macroeconomic analysis series indonesia ......macroeconomic analysis series indonesia economic...
TRANSCRIPT

MACROECONOMIC ANALYSIS SERIES
Indonesia Economic Outlook Q3-2019
Key Figures • GDP Growth* (Q2 ’19)
5.1%
• GDP Growth* (FY 2019)
5.1-5.2%
• Inflation (y.o.y. June ’19)
3.28%
• Credit Growth (y.o.y. Apr
‘19)
11.05%
• Trade Balance (Q2 2019)
USD -1.87 billion
• Current Account* (Q2
‘19)
-3.25%
_________
*) Forecast
Macroeconomic & Financial Sector Policy Research
Febrio N. Kacaribu, Ph.D.
(Head of Research)
Syahda Sabrina
Nauli A. Desdiani
Nisrina Qurratu’Ain
Teuku Riefky
1
To keep you updated
with our free monthly
and quarterly reports,
please subscribe. Scan
the QR code below
or go to
http://bit.ly/LPEMCom
mentarySubscription
Economic Growth Has Not Accelerated
Highlights
• GDP growth in Q2 2019 is estimated at 5.1%. Overall 2019 forecast at 5.1%-5.2%; lower
than our last estimate at 5.2%-5.3%.
• In the last 20 years, Indonesia’s economy has been dominated by Java (59% of total
GDP). GoI must push more initiatives, both infrastructure development and private
investment, in ouside-Java.
• Growth of the manufacturing sector has decelerated to 3.95% in Q1 2019 compared to
4.30% in the previous quarter; no significant turnaround yet.
• Consumption growth fell slightly to 5.01% in Q1 2019 from Q42018; better in Q2 due to
the event of Ramadhan and Eid al-Fitr;
• There could be higher credit growth for the 2H 2019 supported by more certain
investment climate;
• Reversal of oil and gas deficit in Q2 2019 imposes a higher challenge to the improvement
of CAD throughout 2019;
• Stronger Rupiah will be reinforced by the relatively attractive return of portfolio
investments due to the improvement of external and domestic economic conditions.
Indonesia’s economic growth in Q1 2019 is recorded at 5.07% (y.o.y), lower than 5.17% (y.o.y) as
in the previous quarter. Despite of the seasonal pattern, the global stresses caused by economic
downturn and wait-and-see mode of investors ahead of the 2019 general election might have
impeded overall household consumption and investment. The manufacturing sector, which
remains the most contributing sector, only grew at 3.95% (y.o.y) in Q1 2019. Amidst global
uncertainty, the general election has ended, and the new administration would step into the
office. The new government should take the structural reforms agenda of utmost importance
and addressed through bold and significant steps to revive the competitiveness level of
Indonesia’s manufacturing industry.
Table 1: LPEM FEB UI GDP Growth Forecast
Q2 2019 FY 2019
5.1% 5.1-5.2%
Moreover, concerns about Indonesia’s current account balance has increased after the April-
June trade data shows that trade deficit has widened three times higher than its amount in
Q1 2019. The worsened trade deficit was mainly driven by the reversal of oil imports coupled
with lower exports of commodities. Such momentums are expected to lower CAD in Q2 2019,
thus putting more weight on the effort of gaining surpluses in 2019. In order to step up the
game, the government needs to improve the structure of our trade that is still heavily
dependent on commodities; it will require more persistent structural reforms which is
unlikely to be achieved shortly. In the near future, the government will need to quickly pursue
more bilateral trade and investment agreements with our current and new potential trade
partners.

MACROECONOMIC ANALYSIS SERIES
Indonesia Economic Outlook Q3-2019
2
Observing Indonesia’s Economic Inequality
After recovering from the 1998 monetary crisis, Indonesia is currently enjoying a fairly stable economic growth, where GDP grew at around 5% despite the global economic slowdown. Nevertheless, this high economic growth might not be fully translated to an improvement in the welfare of all classes of society as there is an increase in inequality marked by an upward trend of Gini Ratio.
Widening Economic Inequality: A Legacy in the Commodity Boom Era
A substantial increase in inequality has occurred in Indonesia over the past 15 years, especially during the period of the commodity boom. High commodity prices in 2010 had a positive impact on the business climate in Indonesia, where the contribution of natural resources reached 37.3% of GDP in 2012. However, the high growth was followed by the widening level of inequality. The increase in commodity prices has lowered the appetite of investors to enter the other sector than commodity-based sectors; accelerate further the mining industry. As a result, the higher prices was only enjoyed by a small number of people, making economic inequality worsen. This leads to significant widening disparities from 2010 to 2012, as shown by the rise in the Gini Coefficient to 0.41 from 0.38. Gini Ratio is an indicator to measure inequality among groups of people. This ratio is defined by a value of 0 to 1, where the higher the value, the more inequality of income generated between one group of income to others.
Figure 1. Inequality and Economic Growth
Source: Badan Pusat Statistik (BPS), processed
Economic growth in the commodity boom era was accompanied by a widening gap of income distribution among groups of people. Unfortunately, the government was rather late in mitigating the worsening trend of the economic inequality. Revenue from the commodity boom predominately has been used merely for subsidizing the poor than to construct productive investments such as infrastructure development and expansion. The allocation of subsidies, especially for fuel (BBM), had been mistargeted because the affluent society enjoyed most of its benefit. On the other hand, the economic inequality began to narrow as the commodity boom era ended in 2012. Lower commodity prices no longer generate the high-income groups an excessive surge of income.
End of the Commodity Boom: Slowing Trends Postpone Economic Inequality
After enjoying the one-hit-wonder of economic benefit brought by the commodity boom era, the economy has gradually decelerated along with the declining commodity prices. However, the distribution is getting more equal as the Gini ratio keeps dropping since the end of 2013. Several factors might explain this phenomenon. The decline of commodity prices has slowed down the commodity-based sectors; thus
3.5
4
4.5
5
5.5
6
6.5
0.33
0.35
0.37
0.39
0.41
0.43
2002 2005 2007 2008 2009 2010 2011 2012 2013 2014 2015 2016 2017 2018
The End of Commodity Boom Growth
Commodity boom GDP Growth Rate (Right Axis) Gini Ratio (Left Axis)
Gini Ratio

MACROECONOMIC ANALYSIS SERIES
Indonesia Economic Outlook Q3-2019
3
decrease their contribution to the economy while at the same time the contribution of non-commodity sectors relatively increased.
Figure 2: Realization of Government Expenditures for 2011-2014 and 2015-2018
Source: Realization of the State Budget, Ministry of Finance
Figure 3: Indonesia and Several Other Countries’ Latest Gini Ratio Index
Source: Estimated Gini Index, World Bank (2018)
Another factor that also contributes to the improving equality in Indonesia is the implementation of government policies which focus on human development such as more funds for public welfare in terms of education, social security, and health. Realization of government spending to support the quality improvement of these sectors grew more than 100%, even 1160% in social protection from 2015 to 2018. This high expenditure is presented by the incessant social programs in the last three years through the application of Village Funds (Dana Desa), Healthy Indonesian Card (KIS), and Smart Indonesian Card (KIP). Apart from some issues of allocation process during the program implementation, the success of the government in reducing inequality amid rapid economic growth needs to be appreciated. Additionally, in Indonesia, inequality is relatively lower compared to several other emerging markets (see Figure 3), although it is still lower than Thailand (36), Vietnam (35.3), and India (35.1). Success in Suppressing Poverty
National poverty rate throughout the last ten years has decreased significantly despite the relatively slow pace of the decline. Based on data from BPS, with the poverty line in September 2018 set to IDR410,670 per capita per month, the number of poor people in Indonesia was recorded as single digit, stood at 9.7% or around 25.6 million people; a reduction of 909 thousand people from 2017 (See Figure 4). This is the first time in history that Indonesia's poverty rate is below 10 percent.
Figure 4: Number of Poor Population and Poverty Level, 2007-2018
Source: Central Statistics Agency (BPS), based on the standard poverty line of Rp 410.670 per capita per month
Figure 5: Real Growth Rate of Annual Per Capita Expenditure Based on Decile,
2013-2017
Source: National Socio-Economic Survey (Susenas), processed
185
40 113
1.250
374 462 436
1.689
0
400
800
1.200
1.600
Health Social Security Special Allocation
and Village Fund
Education
2011-2014 2015-2018
63
51
47
43
42
42
41
39
36
35
35
0 10 20 30 40 50 60 70
South Africa
Brazil
China
Mexico
Argentina
Turkey
Malaysia
Indonesia
Thailand
Vietnam
India
2014
2015
2016
2016
2016
2016
2015
2017
2015
2016
2011
16,58
15,42
14,1513,33
12,4911,66 11,47
10,96 11,1310,7
10,129,66
0
5
10
15
20
25
30
35
40
0
2
4
6
8
10
12
14
16
18
2007 2008 2009 2010 2011 2012 2013 2014 2015 2016 2017 2018
(Ju
ta J
iwa)
(%)
Jumlah Penduduk Miskin Tingkat Kemiskinan (P0)
-4
-2
0
2
4
6
8
10
12
1 2 3 4 5 6 7 8 9 10
%, y.o.y
Decile
2013 2014 2015 2016 2017

MACROECONOMIC ANALYSIS SERIES
Indonesia Economic Outlook Q3-2019
4
The improvement in the poverty figures is consistent with improved equality. We can look deeper into the by observing the data of annual per capita expenditures based on the decile from the National Socio-Economic Survey (Susenas). We can see that the consumption of low-income people (deciles 1-4) in 2017 grew faster than the previous four years. This illustrates the improvement in the consumption patterns of basic needs of low-income people. Moreover, these conditions were also supported by various government social spending policies which also contributed to maintaining public consumption.
On the other hand, middle-income people (decile 5-9) in 2017 tend to have a stagnant consumption pattern compared to 2016, where people were enjoying high consumption expenditure. Whereas for high-income people (decile 10), there was a steady decrease in per capita consumption from 2013 until 2017, except for 2015. We assess the decline in consumption patterns of basic needs of middle and high-income people due to the increasing tendency of people to divert consumption to savings and investment.
Big Challenge: High Inter-Regional Disparities
Figure 6: Distribution of GDP By Region (%), 2000-2018
Source: Central Statistics Agency (BPS)
Over the past 18 years, the activity of Indonesia’s economy is persistently centralized in Java, which contributes on average of 59% to total GDP, followed by Sumatra at 22% (Figure 6); while the rest of Java and Sumatra is only presented by 19% of GDP. This describes a deficiency of significant improvement towards decentralization of economic activity among regions. The lack of robust decentralized implementation in economic development has only benefited Java’s economy and maintained the gap between Java and other islands. The initiative taken by Jokowi’s administration to expand infrastructure projects outside Java is a good start to distribute the economic activity among regions in Indonesia. The benefit would not be realized in the short-term but is expected to support economic growth in a sustainable manner. In the last 5 years, we can see that Sulawesi is gaining some share of the economic activity; opening the so-called “Special Economic Zone” (Kawasan Ekonomi Khusus) is one of the reasons for this improvement. The government needs to do more of these initiatives in outside-Java. Another Big Challenge: Readiness of Workers in Facing the Industry 4.0 The labor market in Indonesia has been evolving. The impact of structural reforms on the labor market has shifted the labor activity from the primary sector, such as agriculture, towards sectors which create more value-added. This fact is illustrated by figure 8, as the contribution of agriculture sectors in is
21 20 20 22 22 22 22 23 23 23 23 24 24 24 23 22 22 22 22
59 59 60 60 60 59 60 59 58 59 58 58 58 58 57 58 59 58 58
3 3 3 3 3 3 3 3 3 3 3 3 3 3 3 3 3 3 3
10 9 9 9 9 10 9 9 10 9 9 10 9 9 9 8 8 8 8
4 4 4 4 4 4 4 4 4 4 5 5 5 5 6 6 6 6 62 2 2 2 2 2 2 2 2 2 2 2 2 2 2 2 2 2 2
2000
2001
2002
2003
2004
2005
2006
2007
2008
2009
2010
2011
2012
2013
2014
2015
2016
2017
2018
Sumatera Jawa Bali dan Nusa Tenggara Kalimantan Sulawesi Maluku dan Papua

MACROECONOMIC ANALYSIS SERIES
Indonesia Economic Outlook Q3-2019
5
Slow Start for the Year Driven by Global and Domestic Tensions
Economic data has shown an economic slowdown for the first quarter of 2019 as GDP growth
realized at 5.07%, lower than 5.17% in Q4 2018. The escalation of the trade war and higher
prospect of no-deal Brexit play a crucial role in the halted economic growth as external factors.
Several domestic factors also added to the first-quarter economic growth, such as the upcoming
Ramadan and the general election, but has affected economic sectors variously. Manufacturing
industry as the most contributing sector in GDP has started the year rather sluggish. Growth of
the manufacturing industry as a whole has decelerated in Q1 2019 to 3.95% compared to 4.30%
in Q4 2018. Nonetheless, amidst the slowing trend of the manufacturing sector, food and
beverages, textile, and chemicals and pharmaceuticals subsectors has shown a robust demand
declining, while service sector is contributing more to the economy. Furthermore, the same pattern is also observed in the absorption of labor by each sector (Figure 7). Since 2010, it was observed that there was a drop in the agriculture workforce from 43 million to 37 million, while the service sector experienced a trend in jobs growth from 52 million to 69 million. Meanwhile, labor in the secondary sector, the manufacturing industry, has a relatively stagnant movement along with the slowdown in the manufacturing growth recently. The presence of the industrial 4.0 revolution marked by technological progress will change the structure of the domestic labor workforce further. This is an opportunity as the changes in technology could induce economic competitiveness along with the increased efficiency and productivity. However, if Indonesia could not seize this momentum properly by generating high quality and competitive human resources, Industry 4.0 will turn into a big threat; it will worsen the inequality.
Figure 7: Number of Workers per Sector (Million people)
Source: CEIC
Figure 8: Contribution of Each Sector to GDP
Source: CEIC
Indonesia's current economic inequality is not yet in an ideal state, considering the Gini Ratio of the past 15 years, plus the widening gap between Java and non-Java. The commodity boom period is the main culprit of the steep rise in inequality within societies. However, the trend of economic inequality has declined periodically, particularly over the past four years, followed by a decline in the rate of poverty and an increase in economic growth. This reveals that the government has achieved some improvement in implementing efficient strategies to decrease the gap while maintaining economic growth at the same time. But we need more of these. The effectiveness of both ongoing (physical and social infrastructure) and future policies (the capital city relocation and the construction of several regional growth centres) is expected to lower inequality and also have implications for poverty reduction.
43
14
52
37
18
69
0
10
20
30
40
50
60
70
80
Primary Secondary Tertiary
Million Employment by Sector (million people)
2010
2011
2012
2013
2014
2015
2016
2017
2018

MACROECONOMIC ANALYSIS SERIES
Indonesia Economic Outlook Q3-2019
6
growth, driven by the increasing demand due to the upcoming momentum of 2019 general
elections and earlier Ramadan season.
Figure 1: Growth of GDP and the Main Industries, 2014-2019Q1
Source: CEIC
Figure 2: Growth of Manufacturing Sector and Its Subsectors, 2014-2019Q1
Source: CEIC
As the manufacturing sector has been crucial in boosting the potential growth of Indonesia’s
GDP, slower manufacturing growth for the last three quarter could be worrying. The low
manufacturing growth, which is below the overall GDP growth of 5.07% and total consumption
growth of 5.01%, might be translated as the early warning of Indonesia’s declining
competitiveness. As the general election results would bring a new administration to the office,
the new government should take the structural reforms agenda of utmost importance and
addressed through bold and significant steps to revive the competitiveness level of Indonesia.
Within the manufacturing industry, food, and beverages as the most significant subsector
recorded a notable growth of 6.84% (y.o.y). This growth is considerably higher than in the
previous quarter (Q4 2018) with the growth of only 2.74%. Increasing demand in food and
beverages subsector is expected to continue in Q2 2019 due to earlier Ramadan season.
Meanwhile, textile and chemicals enjoyed robust double-digit growth of 18.9% and 11.6% in Q1
2019, continuing the upward trend of growth from the previous quarter, while basic metal
experienced hindered growth of 8.63% in Q1 2019 from 15.52% in Q4 2018. Textile subsector has
become the fastest growth driver of the manufacturing industry in the year’s first quarter, mainly
due to the increasing demand for political apparels and attributes during the campaign period of
2019 general elections.
The growth of the manufacturing industry, however, is not evenly spread across its subsectors.
Metal products, computer, electronic and electric equipment manufacturing, one of the more
technologically-advanced subsectors in the manufacturing industry, experienced modest growth
in Q1, with the growth of 0.95% (y.o.y), continuing previous trends of relatively low growth.
Furthermore, coal, oil, and gas refinery recorded negative growth of -3.70% (y.o.y). This negative
growth level is worse than the previous quarter, which still recorded a slightly positive growth of
0.31%, partially due to the sub-target output of oil & gas production in Indonesia. Transport
equipment subsector recorded the first negative growth since Q4 2015, of -7.09% in Q1 2019,
also the most detrimental increase of the subsector in the last ten years.
5.07
3.96
5.29
1.98
5.91
2.56
8.10
5.23
7.21
-4 -2 0 2 4 6 8 10
Gross Domestic Product
Manufacturing Industry
Wholesales and Retail Trade, Repairs
Agriculture, Forestry and Fisheries
Construction
Mining & Quarrying
Information & Communication
Transportation & Storage
Financial & Insurance Activity
2015
2016
2017
2018
2019Q1
Weights in 2019Q1
100.0
21.2
13.4
12.3
10.1
7.6
5.4
4.2
4.2
%
3.96
6.84
-3.70
0.95
11.6
-7.09
18.9
8.63
-10 -5 0 5 10 15 20
Manufacturing Industry
Food & Beverages
Coal; Oil & Gas Refinery
Metal Prod, Comp, Elect, Optic & Electricity Equip
Chemicals, Pharmaceutical & Tradit'l Medicine
Transport Equipment
Textile & Wearing Apparel
Basic Metals
2015
2016
2017
2018
2019Q1
Weightsin 2019Q1
100.0
31.9
9.6
9.1
8.6
8.6
6.5
4.2
%

MACROECONOMIC ANALYSIS SERIES
Indonesia Economic Outlook Q3-2019
7
“…structural reform to
regain Indonesia’s
competitiveness might not
be an easy task for the
new administration, not
to mention the challenge
brought by demographic
dividend and
digitalization to the
economy in the long-run.”
Figure 3: Growth of Wholesale and Retail Trade and Its Subsectors, 2014-2019Q1
Source: CEIC
Figure 4: Growth of Transport and Its Major Subsectors, 2014-2019Q1
Source: CEIC
Growth of wholesale and retail trade sector grew by 5.29% in Q1 2019, driven by a higher increase
in non-motor-vehicle retail trade subsector, which grew considerably by 5.77% in Q1 2019. This
growth level is driven by robust retail sales growth of 8.8% in Q1 2019 compared to only 4.7% in
Q4 2018, mainly driven by clothing as the engine of retail sales growth. Moreover, wholesale and
retail trade sector growth is also attributable to social assistance programs by the incumbent, as
the elections were approaching, and donations from presidential and legislative elections’
participating contestants which boosted consumption among the middle-lower class. On the
other hand, motor vehicles trade subsector recorded rather slower growth than the overall
sector, only 3.29% in Q1 2019, driven by lower motor vehicle sales which was dropped 13% in Q1
2019 compared to the same period of the previous year.
Transportation and storage sector growth has been decreased quite substantially to 5.23% in Q1
2019, from 7.07% in the previous quarter, due to significant negative growth of air transportation
(-10.1%). This negative growth of air transportation is driven by substantially higher airline ticket
prices, discouraging a hefty amount of airline passengers. On the contrary, road subsector growth
accelerated to 8.98% in Q1 2019, recording the highest quarterly growth since 2011, thanks to
large-scale infrastructure push by the government. Sea and railways subsector also among the
beneficiaries of the government’s extensive infrastructure projects as both subsectors grew in
the first quarter of 2019, despite at a slower rate from the previous quarter, of 7.32% (y.o.y) and
7.88% (y.o.y), respectively. While there is still no classification for e-commerce yet in our statistics
bureau, the steady increase of storage and support activities subsector growth might serve as
rather a convenient proxy for e-commerce economic activity. The storage and support activities
subsector enjoyed steady growth and grew 8.26% (y.o.y) in Q1 2019, which is in-line with the
rapid growth of e-commerce in Indonesia.
Based on our forecast for Q3 2019, the economic activity will rebound as the political condition
is more stable after the elections and the trade war tensions relaxed. As the general election
results unfold, President Jokowi will serve his second and last period of Indonesia’s Presidency;
he would have a strategic position to govern his administration towards implementing set of
policies that might be considered as somewhat not populist, but efficacious for the economy in
the medium and long-term. This greater room for addressing and implementing the right set of
policies is due to the relatively lower political cost since he would not be able to run for any other
presidential candidacy. However, the other side of the coin would be he and his administration
5.29
5.77
3.29
0 2 4 6 8
Wholesale and Retail Trade, Repairs
Non-Motor Vehicles and Motorcycle Trade
Motor Vehicles and Motorcycle Trade and Repairs
%
2015
2016
2017
2018
2019Q1
Weight in 2019Q1
100
80.7
19.3
5.23
8.98
8.26
-10.1
7.32
3.74
7.88
-15 -10 -5 0 5 10 15 20
Transportation & Storage
Road
Storage & Support Activities for
Transportation, Postal & Courier
Air
Sea
Inland Water
Railways
2015
2016
2017
2018
2019Q1
Weight in 2019Q1
16.2
57.2
100
15.0
8.0
2.7
0.9
%

MACROECONOMIC ANALYSIS SERIES
Indonesia Economic Outlook Q3-2019
8
“The post-election effect
will still result in Q3,
where investment climate
is more predictable”
would also have a greater room for corrupt behavior such as rent-seeking act. Hence, structural
reform to regain Indonesia’s competitiveness might not be an easy task for the new
administration, not to mention the challenge brought by demographic dividend and digitalization
to the economy in the long-run.
Household Consumption to Accelerate in Q2 2019
The growth rate of consumption is slightly changed; fell to 5.01% in Q1 2019 from 5.07% in the
previous quarter. The composition of household consumption fell slightly compared to the Q4,
where Christmas and New Year happened. The share of food and beverages consumption
increased to 36.8% from 36.5%, lessen households’ expenditure on transportation and
communication’s share to around 24.7% from 25%. Even the level of consumption growth in the
Q1 was lower, it is still reasonable, where seasonal factor caused the declining growth at the
beginning of the year. The steady growth is supported by an increase in spending food and
beverages (rising to 5.32% in Q1 2019 from 4.79% in Q4 2018), restaurant and hotel (rising to
5.5% in Q1 2019 from 5.79% in Q4 2018), and health and education (rising to 5.71% in Q1 2019
from 4.79 in Q4 2018). We expect the growth to escalate in Q2 as the event of Ramadhan and
Eid al-Fitr happened.
Significant growth of social assistance in the form of Indonesian Conditional Cash Transfer
Program (PKH) also contributed for stable consumption growth in Q1, where the allocation for
social assistance in Q2 was around IDR30 trillion or has reached around 73% of the target in 2019.
Consumer confidence in Q2 2019 increased to 127.6 from 125, indicating for a more maintained
and manageable consumer optimism ahead. In April, a year-on-year credit growth rose
significantly higher than the previous quarter. We expect for a higher credit growth for the overall
Q2, driven by stronger household’s consumption, which was attributable to a surge in loan
disbursement from investment, working capital, as well as consumption. The post-election effect
will still result in Q3, where the investment climate is more predictable.
Figure 5: Growth of Household Consumption and its Components, 2014-2019Q1
Source: CEIC
Figure 6: Growth rate of Investment and its Main Components, 2014-2019Q1
Source: CEIC
Looking closer to the GDP’s components, the household’s consumption remains steady over the
period. On the other hand, there is a decrease in both export and import value. Investment
posted a slower growth to 5.03% from 6.01% in the previous quarter due to the global economic
slowdown and political uncertainty of election result, making investors are more willing to tun
into wait-and-see mode.
5.01
5.32
4.91
4.70
5.50
5.71
2.17
4.85
0 2 4 6
Consumption: Household
F&B, Other than Restaurant
Transportation & Communication
Equipments
Restaurant & Hotel
Health & Education
Others
Apparel, Footwear & Maintenance
2015 2016 2017 2018 2019Q1
Weight in 2019Q1
Sectors
36.8
100
24.7
13.5
9.4
7.0
4.7
3.9
%
5.03
5.48
8.41
-7.37
9.28
-10 -5 0 5 10 15 20 25
Gross Fixed Capital Formation
Buildings & Structures
Machine & Equipment
Vehicles
Cultivated Resources
%
2015 2016 2017 2018 2019Q1
Weight in 2019Q1
Sector
100
74.9
10.6
5.5
5.0
MACROECONOMIC ANALYSIS SERIES
Indonesia Economic Outlook Q3-2019
9
“Investment posted a
slower growth to 5.03%
from 6.01% in the
previous quarter due to
global economic
slowdown and political
uncertainty of election
result, making investors
are more willing to wait-
and-see.”
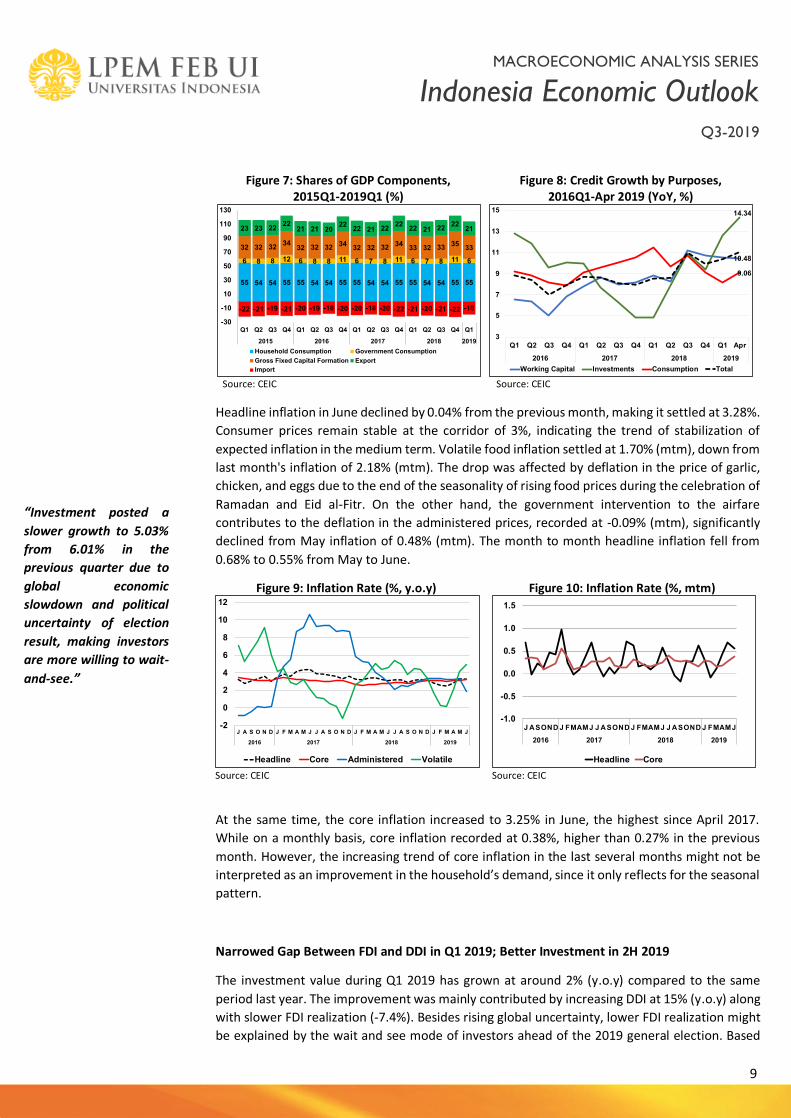
Figure 7: Shares of GDP Components, 2015Q1-2019Q1 (%)
Source: CEIC
Figure 8: Credit Growth by Purposes, 2016Q1-Apr 2019 (YoY, %)
Source: CEIC
Headline inflation in June declined by 0.04% from the previous month, making it settled at 3.28%.
Consumer prices remain stable at the corridor of 3%, indicating the trend of stabilization of
expected inflation in the medium term. Volatile food inflation settled at 1.70% (mtm), down from
last month's inflation of 2.18% (mtm). The drop was affected by deflation in the price of garlic,
chicken, and eggs due to the end of the seasonality of rising food prices during the celebration of
Ramadan and Eid al-Fitr. On the other hand, the government intervention to the airfare
contributes to the deflation in the administered prices, recorded at -0.09% (mtm), significantly
declined from May inflation of 0.48% (mtm). The month to month headline inflation fell from
0.68% to 0.55% from May to June.
Figure 9: Inflation Rate (%, y.o.y)
Source: CEIC
Figure 10: Inflation Rate (%, mtm)
Source: CEIC
At the same time, the core inflation increased to 3.25% in June, the highest since April 2017.
While on a monthly basis, core inflation recorded at 0.38%, higher than 0.27% in the previous
month. However, the increasing trend of core inflation in the last several months might not be
interpreted as an improvement in the household’s demand, since it only reflects for the seasonal
pattern.
Narrowed Gap Between FDI and DDI in Q1 2019; Better Investment in 2H 2019
The investment value during Q1 2019 has grown at around 2% (y.o.y) compared to the same
period last year. The improvement was mainly contributed by increasing DDI at 15% (y.o.y) along
with slower FDI realization (-7.4%). Besides rising global uncertainty, lower FDI realization might
be explained by the wait and see mode of investors ahead of the 2019 general election. Based
55 54 54 55 55 54 54 55 55 54 54 55 55 54 54 55 55
6 8 8 12 6 8 8 11 6 7 8 11 6 7 8 11 6
32 32 3234
32 32 3234
32 32 3234
33 32 3335
33
23 23 2222
21 21 2022
22 21 2222
22 21 2222
21
-22 -21 -19 -21 -20 -19 -18 -20 -20 -18 -20 -22 -21 -20 -21 -22 -18
-30
-10
10
30
50
70
90
110
130
Q1 Q2 Q3 Q4 Q1 Q2 Q3 Q4 Q1 Q2 Q3 Q4 Q1 Q2 Q3 Q4 Q1
2015 2016 2017 2018 2019
Household Consumption Government Consumption
Gross Fixed Capital Formation Export
Import
10.48
14.34
9.06
3
5
7
9
11
13
15
Q1 Q2 Q3 Q4 Q1 Q2 Q3 Q4 Q1 Q2 Q3 Q4 Q1 Apr
2016 2017 2018 2019
Working Capital Investments Consumption Total
-2
0
2
4
6
8
10
12
J A S O N D J F M A M J J A S O N D J F M A M J J A S O N D J F M A M J
2016 2017 2018 2019
Headline Core Administered Volatile
-1.0
-0.5
0.0
0.5
1.0
1.5
J ASOND J FMAMJ J ASOND J FMAMJ J ASOND J FMAMJ
2016 2017 2018 2019
Headline Core

MACROECONOMIC ANALYSIS SERIES
Indonesia Economic Outlook Q3-2019
10
“...the gap between the
amount of FDI and DDI
has been continuing to
be narrowed from the
usual doubled amount of
FDI in 2015 to a relatively
slight gap. It reflects the
slower trend of foreign
investment along with
growing confidence of
domestic investors in Q1
2019.”
on the sector, foreign investors have slowed down the investment in secondary (manufacturing)
and tertiary (service) sector, while the primary sector recorded positive growth.
On the other hand, domestic investment was still dominated by construction, transportation,
warehouse, and telecommunications sectors with a total contribution of industrial sectors
amounting to 18.5% of the total DDI; it is, however, lower than the similar proportion in Q4 2018
(23.5%). As investment realization is crucial to ensure the economic growth, lower investment in
industrial might be one of the reasons for the slowing manufacturing growth in 2019. However,
the absorption of the significant investment in construction continues to be translated in
economic growth as this sector grew higher than overall GDP growth at 5.91% in Q1 2019.
Figure 11: FDI Realization (Nominal)
Source: CEIC
Figure 12: Foreign and Domestic Investment (Nominal)
Source: CEIC
The total investment value in Q1 2019 has only reached 24% of the investment target throughout
2019. What is notable is that the gap between the amount of FDI and DDI has been continuing
to be narrowed from the usual doubled amount of FDI in 2015 to a relatively slight gap. It reflects
the slower trend of foreign investment along with the growing confidence of domestic investors
in Q1 2019. We see that the declining trend of FDI will not continue in 2019 at least in Q2 2019
as the end of the general election session. In order to accelerate the overall investment
realization, the government might needs to strictly maintain the investment climate by
continuing the economic reform such as 16th economic policy package, relaxation of foreign
ownership restriction, better implementation of Online Single Submission (OSS), and higher
intensification of investment facilities by relevant government agencies both at the central and
regional levels.
Significant Improvement in 2019 Current Account Deficit Will Remain a Challenge
The improvement of the current account deficit at 2.6% in the first quarter of 2019 compared to
3.6% CAD in Q4 2018 was attributable to the two consecutive surpluses in February and March
trade. Nevertheless, April-June data shows a reversal trend of the trade balance as its deficit
amount has jumped into USD1.87 billion from USD0.6 billion in Q1 2019. It was mainly driven by
a 28% increase in oil and gas imports coupled with a 22% decrease in its exports. Even though
there was a factor of crude oil price effect, the oil-and-gas trade deficit in Q2 was significantly
deviating from the trend in February and March. It is, however, showing us that a better figure
for CAD in Q1 2019 was, in the majority, an anomaly. The higher trade deficit in Q2 brings overall
deficit amount for 1H 2019 stood at USD1.93 billion, deeper than the total trade deficit in the
10287
189
0
30
60
90
120
150
180
210
Q1 Q2 Q3 Q4 Q1 Q2 Q3 Q4 Q1 Q2 Q3 Q4 Q1 Q2 Q3 Q4 Q1
2015 2016 2017 2018 2019
IDR Trillion
Foreign Domestic Total
102
12
27
64
0
20
40
60
80
100
120
Q1 Q2 Q3 Q4 Q1 Q2 Q3 Q4 Q1 Q2 Q3 Q4 Q1 Q2 Q3 Q4 Q1
2015 2016 2017 2018 2019
IDR Trillion
Total Primary Secondary Tertiary

MACROECONOMIC ANALYSIS SERIES
Indonesia Economic Outlook Q3-2019
11
same period last year (USD1.06 billion). Besides the reversal of oil and gas balance, international
trade disruption and weakened global commodity prices were also the contributors to the
worsening trade balance in Q2 2019. Moreover, we maintain our view that achieving a
substantial improvement in 2019 CAD will remain a challenge.
Figure 13: Monthly Trade Balance (Nominal) (Sept2013-Mar2019)
Source: CEIC
Figure 14: Exchange Rate and Accumulated Short-Term Capital Inflow (Dec ‘17-Mar ’19)
Source: CEIC
The trade deficit in Q2 2019 was recorded about three times higher than the previous quarter.
Higher oil and gas imports, coupled with decreasing oil and gas exports, were not the only reasons
for the worsening trade balance. Non-oil and gas exports were also reduced by 2% (y.o.y) in 1H
2019 due to global commodity price downturn; the trend notably showed in non-oil and gas
deficit in April 2019. However, the reversal of non-oil and gas balance into surpluses in May and
June was significantly driven by the lower imports in machinery and electrical equipment. The
trend of slowing down in export-oriented business expansion due to the lower commodity prices
has impeded the demand for imported capital goods. Moreover, our trade remains vulnerable to
the swing in global prices as our export and import are heavily dependent on commodities.
Figure 15: Indonesia Export Profile (Apr-May 2019)
Source: CEIC
Figure 16: Indonesia Import Profile (Apr-May 2019)
Source: CEIC
Looking further, exports were still significantly dependent on the export of raw materials,
particularly mineral resources, vegetable fat, and precious metals with these three categories
accounting for 40.4% of total export. Even though the electronics and machinery sector were the
highest import contributor (25.8%), imports were also dominated by mineral resources (16.5%),
particularly oil, at least since 2013. A rise in oil imports since April 2019 has reversed the
contribution of mineral resources imports from April until May to 16.5% from 13.4% in February.
-2.5
-1.5
-0.5
0.5
1.5
2.5
Mar-14 Sep-14 Mar-15 Sep-15 Mar-16 Sep-16 Mar-17 Sep-17 Mar-18 Sep-18 Mar-19
USD bn
TB: Oil and Gas TB: Non-Oil and Gas Trade Balance (TB)
13,000
13,500
14,000
14,500
15,000
15,500
-70
-30
10
50
90
130
170
210
Dec-
17
Jan-1
8
Feb-1
8
Mar
-18
Apr-
18
May
-18
Jun-1
8
Jul-1
8
Aug-1
8
Sep-1
8
Oct
-18
Nov-
18
Dec-
18
Jan-1
9
Feb-1
9
Mar
-19
Apr-
19
May
-19
Jun-1
9
IDR Trillion
Total Portfolio Bonds Stocks USD/IDR (RHS)
Mineral Resources
23.1%
Vegetable & Animal Fat
9.1%
Base Metals 8.2%
Textile Goods8.1%
Electronics, Electric Eqp, and Machineries
7.9%
Industrial Chemicals
7.6%
Plastic, Rubber, and Derivatives
5.7%
Vehicles4.9%
Pulp and Paper4.8%
Processed Food and Beverages
4.5%
Pearl, Diamond, Precious Metals
2.6%
Others13.5%
Electronics, Electric Eqp,
and Machineries
25.7%
Mineral Resources
16.5%
Base Metals10.4%
Industrial Chemicals
10.1%
Plastic, Rubber, and Derivatives
6.0%
Textile Goods5.6%
Vehicles5.1%
Plant-Based Product
4.9%
Processed Food and Beverages
4.6%
Pulp and Paper2.0%
Others9.1%

MACROECONOMIC ANALYSIS SERIES
Indonesia Economic Outlook Q3-2019
12
“… We might say that the better oil and gas trade balance in Q1 2019 was beyond expectation as it is currently reversing to the
usual pace”
We might say that the better oil and gas trade balance in Q1 2019 was beyond expectation as it
is currently reversing to the usual pace.
The surprisingly low amount of oil imports throughout Q1 2019 has resulted in a better than
expected CAD position during the period. Concerns about Indonesia’s current account balance
increased after the April-June trade data shows that trade deficit widened three times higher
than its amount in Q1 2019. The reversal of oil imports coupled with lower exports due to global
prices downturn are the significant factors of the worsened trade balance. We see that CAD will
worsen at least in Q2 2019 as the second quarter is traditionally the cycle for companies to settle
foreign debts and pay out the dividend.
However, the potential higher CAD is not going to be translated in economic activity improvement
yet as there is no signal of the increasing investment; imports of capital goods decreased by 25.5%
in June. The uncertainty of global commodity prices will always be pressure on the current
account balance as our exports are heavily dependent on commodities. An improvement from
this will require more persistent structural reforms; unlikely to be achieved shortly. In the short
run, the government will need to quickly pursue more bilateral trade and investment agreements
with our current and new potential trade partners.
After experiencing Rupiah depreciation until mid-May with the currency briefly touching
Rp14,400, Indonesia now enjoys a stronger currency at around Rp14,000. The stronger Rupiah
was mainly driven by the attractive return of portfolio investments that brings net inflows in
domestic financial assets. Moreover, the positive perception of the country’s economy has been
strengthening recently, supported by the improvement in Indonesia's credit rating to BBB. Such
developments, coupled with the US Fed’s continuing dovish monetary stance, are expected to
maintain the current net inflow of foreign capital to Indonesia. The recent moderate thawing of
US-China trade will also prompt investors to move back their assets into emerging economies,
including our financial market. On the domestic side, BI decision to cut the policy rate two weeks
ago will further raise the inflow and strengthen the Rupiah. The accumulation of massive foreign
capital flows will slightly improve the balance of payments surplus, thus support the external
conditions amid the global downturn in 2019.