indonesia macroeconomic outlook & fiscal policy ... · indonesia macroeconomic outlook &...
TRANSCRIPT
INDONESIA MACROECONOMIC OUTLOOK & FISCAL POLICY DEVELOPMENT
SRI MULYANI INDRAWATI
Minister of Finance – Republic Indonesia
Reform on the move, stability intact
Investor PresentationJune 2018
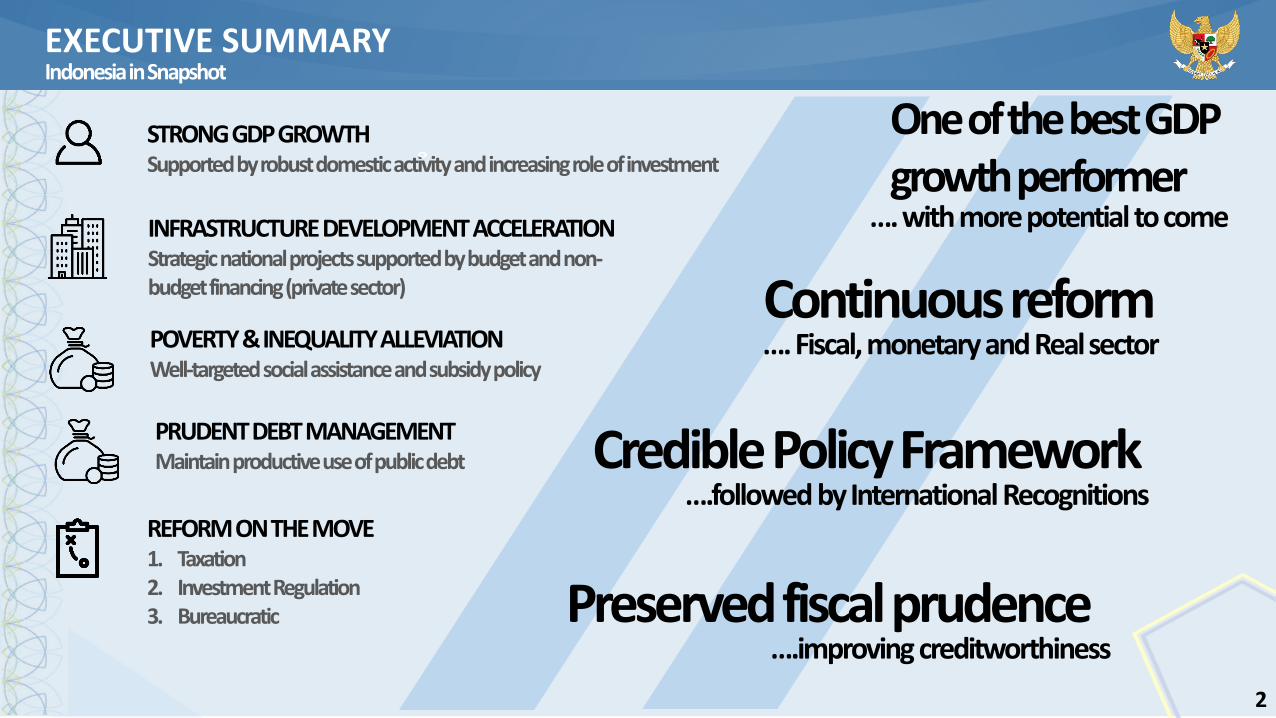
…. with more potential to come
One of the best GDP growth performer
INFRASTRUCTURE DEVELOPMENT ACCELERATIONStrategic national projectssupported by budget and non-budget financing (private sector)
STRONG GDP GROWTHSupported by robust domestic activity and increasing role of investment
POVERTY & INEQUALITY ALLEVIATIONWell-targeted social assistance and subsidypolicy
EXECUTIVE SUMMARYIndonesia in Snapshot
REFORM ON THE MOVE1. Taxation2. Investment Regulation3. Bureaucratic
…. Fiscal, monetary and Real sectorContinuous reform
2
PRUDENT DEBT MANAGEMENTMaintain productive use of public debt
….followed by International RecognitionsCredible Policy Framework
….improving creditworthinessPreserved fiscal prudence

3
GLOBAL NEW NORMAL IS COMING Stabilization policy may influence in reaching Indonesia desired growth target.
The Government will continue to monitor global condition because it can translates to domestic economy.
Policy coordination amongst authorities will be continued (Government, Central Bank, FSA, Deposit insurance Corporation).
Coordinated policy to create Stability in Exchange rate, Manageable inflation rate, Healthy fiscal deficit, and Supportive current account profile.
Potential Risk For Indonesia in 2019
People preference to saving, rather than consumption, not followed by productive (intermediate) financial market
“Wait and See” profile of investor due to General Election process
Monetary policy normalization and US recent taxation policy could influence capital flow to emerging markets
Inward looking policies in Indonesia’s key trade partner with potential trade war between US and China.
Strategic Policy Prepared
Fiscal Policies to support investment, competitiveness and export performance. This include :
Fiscal incentives for investment
Expansionary budget policy, supporting productive sectors and assuring infrastructure development.
Private involvement in infrastructure development
Well-targeted and well-timed social spending
Central and Regional Policy coordination
Real Sector Policies
Law and Regulation certainty
Improving business climate
Maintaining prudent inflation management
Strengthening export performance, include those from non-commodity (high value added) related activities and taping prospective new markets
1.75
3.10
0
1
2
3
4
Jan
-11
Ap
r-1
1Ju
l-1
1O
ct-1
1Ja
n-1
2A
pr-
12
Jul-
12
Oct
-12
Jan
-13
Ap
r-1
3Ju
l-1
3O
ct-1
3Ja
n-1
4A
pr-
14
Jul-
14
Oct
-14
Jan
-15
Ap
r-1
5Ju
l-1
5O
ct-1
5Ja
n-1
6A
pr-
16
Jul-
16
Oct
-16
Jan
-17
Ap
r-1
7Ju
l-1
7O
ct-1
7Ja
n-1
8A
pr-
18
Fed Fund Rate upper bound
10Y US Gov't Bonds
US Policy Rates & 10Y Yield
4
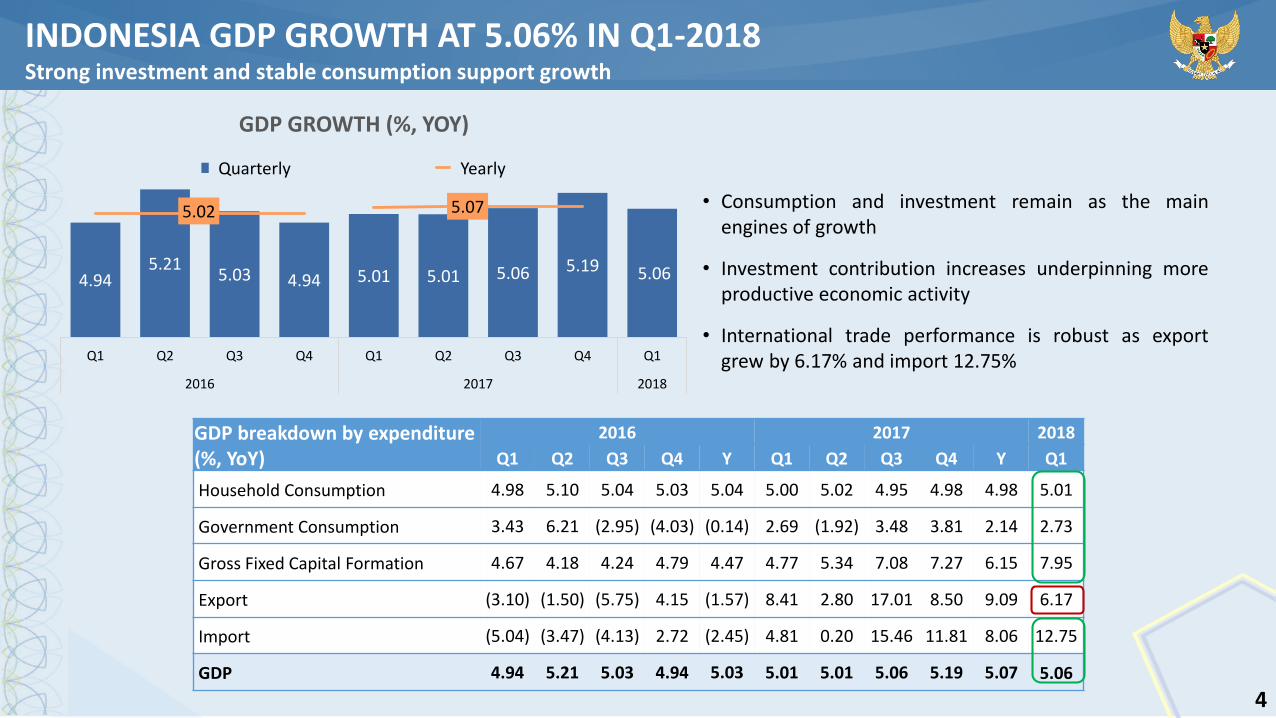
• Consumption and investment remain as the mainengines of growth
• Investment contribution increases underpinning moreproductive economic activity
• International trade performance is robust as exportgrew by 6.17% and import 12.75%
4.945.21
5.03 4.94 5.01 5.01 5.06 5.19 5.06
5.02 5.07
Q1 Q2 Q3 Q4 Q1 Q2 Q3 Q4 Q1
2016 2017 2018
GDP GROWTH (%, YOY)
PDB (%,yoy) Tahunan (%)
GDP breakdown by expenditure (%, YoY)
2016 2017 2018
Q1 Q2 Q3 Q4 Y Q1 Q2 Q3 Q4 Y Q1
Household Consumption 4.98 5.10 5.04 5.03 5.04 5.00 5.02 4.95 4.98 4.98 5.01
Government Consumption 3.43 6.21 (2.95) (4.03) (0.14) 2.69 (1.92) 3.48 3.81 2.14 2.73
Gross Fixed Capital Formation 4.67 4.18 4.24 4.79 4.47 4.77 5.34 7.08 7.27 6.15 7.95
Export (3.10) (1.50) (5.75) 4.15 (1.57) 8.41 2.80 17.01 8.50 9.09 6.17
Import (5.04) (3.47) (4.13) 2.72 (2.45) 4.81 0.20 15.46 11.81 8.06 12.75
GDP 4.94 5.21 5.03 4.94 5.03 5.01 5.01 5.06 5.19 5.07 5.06
Quarterly Yearly
INDONESIA GDP GROWTH AT 5.06% IN Q1-2018Strong investment and stable consumption support growth
5
100
105
110
115
120
125
130
J F M A M J J A S O N D J F M A M J J A S O N D J F M A
2016 2017 2018
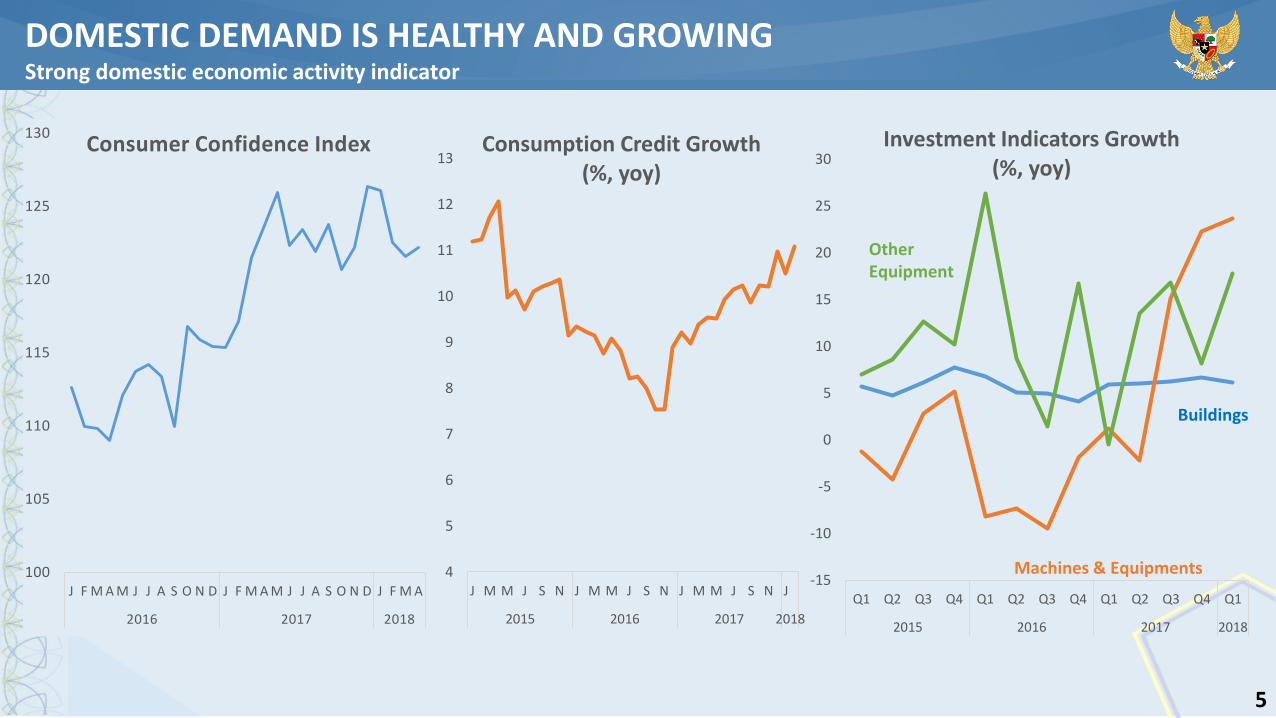
Consumer Confidence Index
-15
-10
-5
0
5
10
15
20
25
30
Q1 Q2 Q3 Q4 Q1 Q2 Q3 Q4 Q1 Q2 Q3 Q4 Q1
2015 2016 2017 2018
Investment Indicators Growth (%, yoy)
Buildings
Machines & Equipments
Other Equipment
4
5
6
7
8
9
10
11
12
13
J M M J S N J M M J S N J M M J S N J
2015 2016 2017 2018
Consumption Credit Growth (%, yoy)
DOMESTIC DEMAND IS HEALTHY AND GROWINGStrong domestic economic activity indicator
6
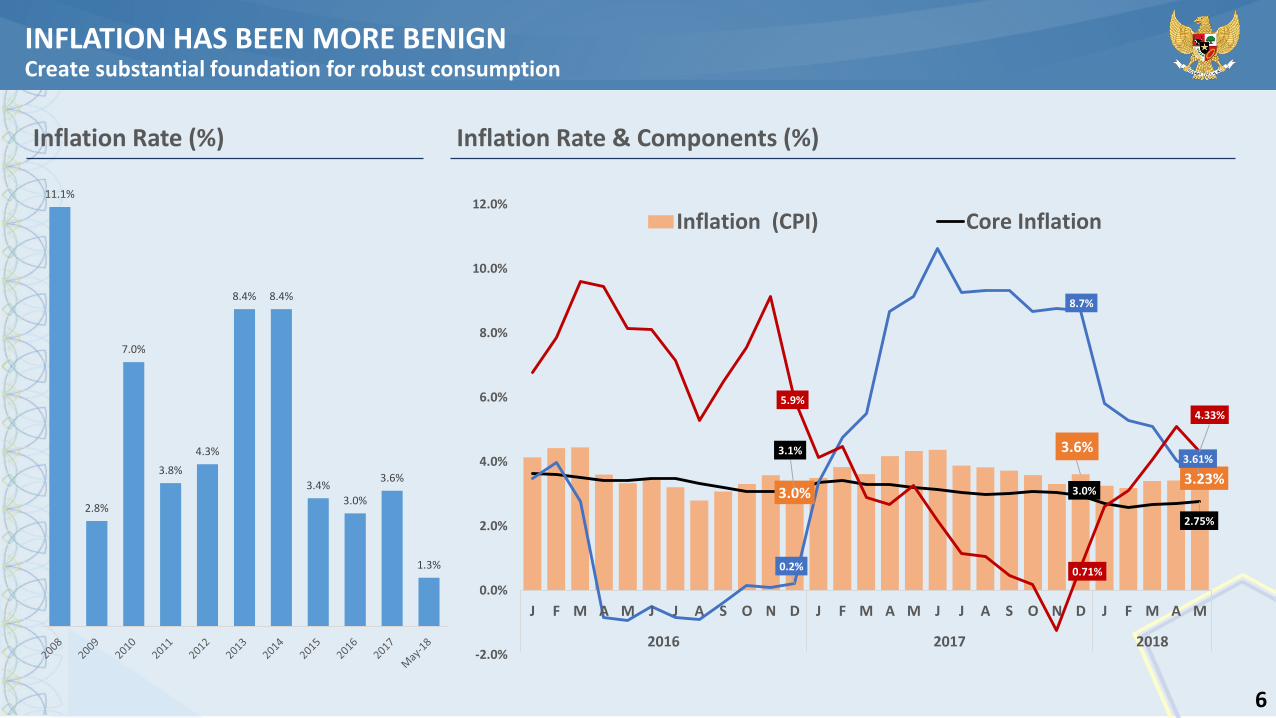
Inflation Rate & Components (%)
INFLATION HAS BEEN MORE BENIGNCreate substantial foundation for robust consumption
Inflation Rate (%)
3.0%
3.6%
3.23%
3.1%
3.0%
2.75%
0.2%
8.7%
3.61%
5.9%
0.71%
4.33%
-2.0%
0.0%
2.0%
4.0%
6.0%
8.0%
10.0%
12.0%
J F M A M J J A S O N D J F M A M J J A S O N D J F M A M
2016 2017 2018
Inflation (CPI) Core Inflation
11.1%
2.8%
7.0%
3.8%
4.3%
8.4% 8.4%
3.4%
3.0%
3.6%
1.3%
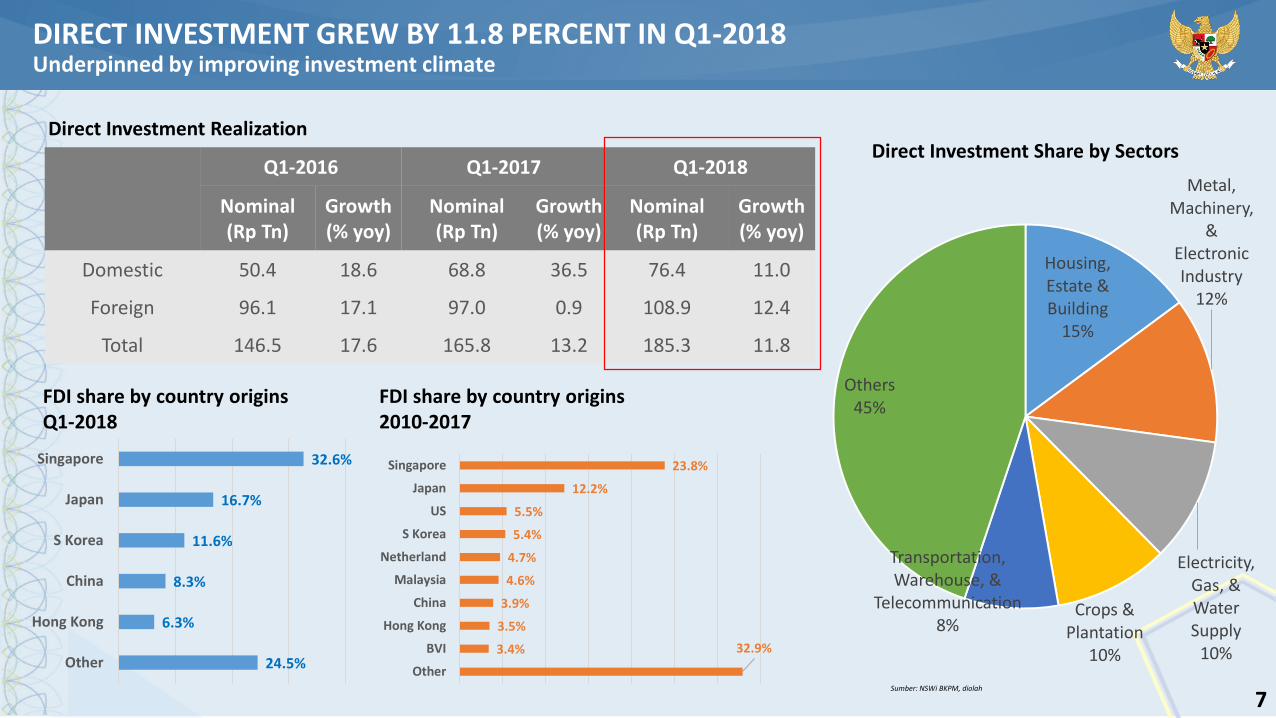
Direct Investment Realization
Q1-2016 Q1-2017 Q1-2018
Nominal (Rp Tn)
Growth (% yoy)
Nominal (Rp Tn)
Growth (% yoy)
Nominal (Rp Tn)
Growth (% yoy)
Domestic 50.4 18.6 68.8 36.5 76.4 11.0
Foreign 96.1 17.1 97.0 0.9 108.9 12.4
Total 146.5 17.6 165.8 13.2 185.3 11.8
Sumber: NSWi BKPM, diolah
FDI share by country originsQ1-2018
Housing, Estate & Building
15%
Metal, Machinery,
& Electronic Industry
12%
Electricity, Gas, & Water Supply
10%
Crops & Plantation
10%
Transportation, Warehouse, &
Telecommunication8%
Others45%
Direct Investment Share by Sectors
DIRECT INVESTMENT GREW BY 11.8 PERCENT IN Q1-2018Underpinned by improving investment climate
7
FDI share by country origins 2010-2017
32.6%
16.7%
11.6%
8.3%
6.3%
24.5%
Singapore
Japan
S Korea
China
Hong Kong
Other
23.8%
12.2%
5.5%
5.4%
4.7%
4.6%
3.9%
3.5%
3.4% 32.9%
Singapore
Japan
US
S Korea
Netherland
Malaysia
China
Hong Kong
BVI
Other
-2.0
-1.0
0.0
1.0
2.0
3.0
M
J J A S O N D
2017
-J F M A M
J J A S O N D
2018
-J F M A
Non O&G O&G Total
8Sumber:BPS, diolah
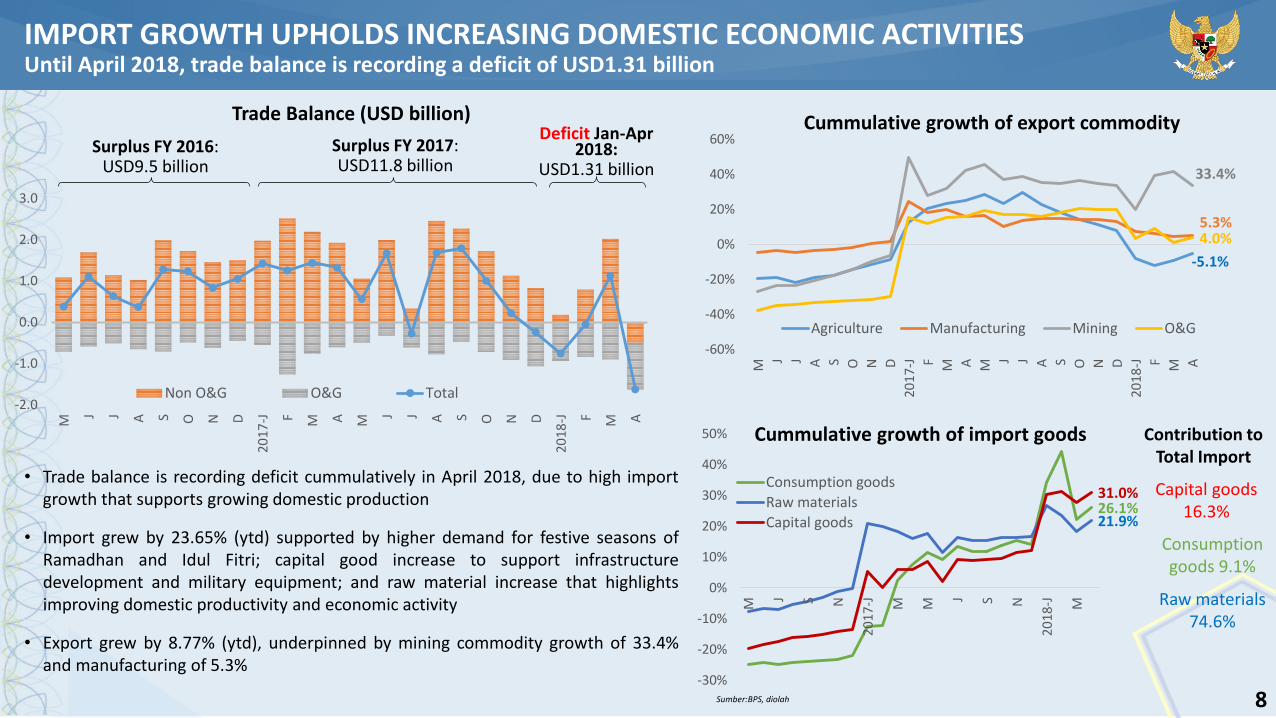
Deficit Jan-Apr 2018:
USD1.31 billionSurplus FY 2016:
USD9.5 billionSurplus FY 2017: USD11.8 billion
Trade Balance (USD billion)
-5.1%
5.3%
33.4%
4.0%
-60%
-40%
-20%
0%
20%
40%
60%
M
J J A S O N D
20
17
-J F M A M
J J A S O N D
20
18
-J F M A
Cummulative growth of export commodity
Agriculture Manufacturing Mining O&G
26.1%21.9%
31.0%
-30%
-20%
-10%
0%
10%
20%
30%
40%
50%
M
J S N
20
17
-J M M
J S N
20
18
-J M
Consumption goods
Raw materials
Capital goods
Cummulative growth of import goods
• Trade balance is recording deficit cummulatively in April 2018, due to high importgrowth that supports growing domestic production
• Import grew by 23.65% (ytd) supported by higher demand for festive seasons ofRamadhan and Idul Fitri; capital good increase to support infrastructuredevelopment and military equipment; and raw material increase that highlightsimproving domestic productivity and economic activity
• Export grew by 8.77% (ytd), underpinned by mining commodity growth of 33.4%and manufacturing of 5.3%
IMPORT GROWTH UPHOLDS INCREASING DOMESTIC ECONOMIC ACTIVITIESUntil April 2018, trade balance is recording a deficit of USD1.31 billion
Contribution to Total Import
Capital goods 16.3%
Consumption goods 9.1%
Raw materials 74.6%
9
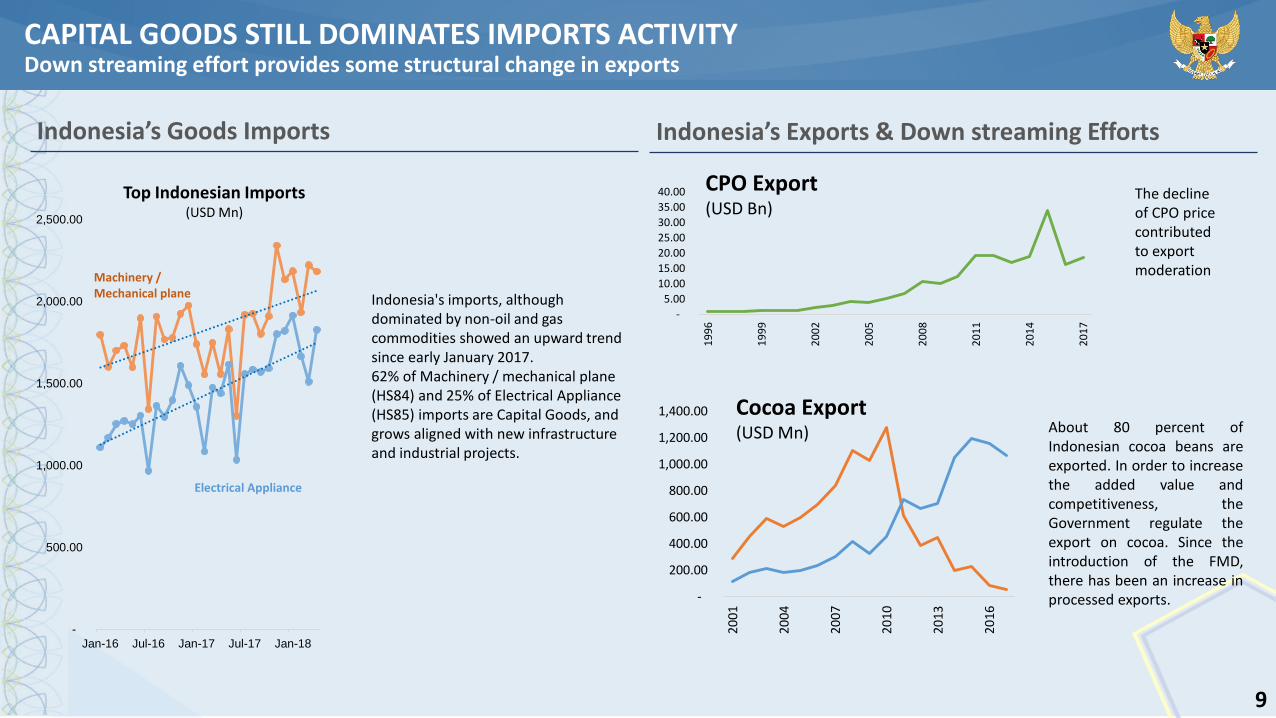
CAPITAL GOODS STILL DOMINATES IMPORTS ACTIVITYDown streaming effort provides some structural change in exports
Indonesia’s Goods Imports
-
500.00
1,000.00
1,500.00
2,000.00
2,500.00
Jan-16 Jul-16 Jan-17 Jul-17 Jan-18
Indonesia's imports, although dominated by non-oil and gas commodities showed an upward trend since early January 2017. 62% of Machinery / mechanical plane (HS84) and 25% of Electrical Appliance (HS85) imports are Capital Goods, and grows aligned with new infrastructure and industrial projects.
Top Indonesian Imports(USD Mn)
Indonesia’s Exports & Down streaming Efforts
-
200.00
400.00
600.00
800.00
1,000.00
1,200.00
1,400.00
200
1
200
4
200
7
201
0
201
3
201
6
-
5.00
10.00
15.00
20.00
25.00
30.00
35.00
40.00
19
96
19
99
20
02
20
05
20
08
20
11
20
14
20
17
CPO Export(USD Bn)
The decline of CPO price contributed to export moderation
About 80 percent ofIndonesian cocoa beans areexported. In order to increasethe added value andcompetitiveness, theGovernment regulate theexport on cocoa. Since theintroduction of the FMD,there has been an increase inprocessed exports.
Cocoa Export(USD Mn)
Electrical Appliance
Machinery / Mechanical plane
10
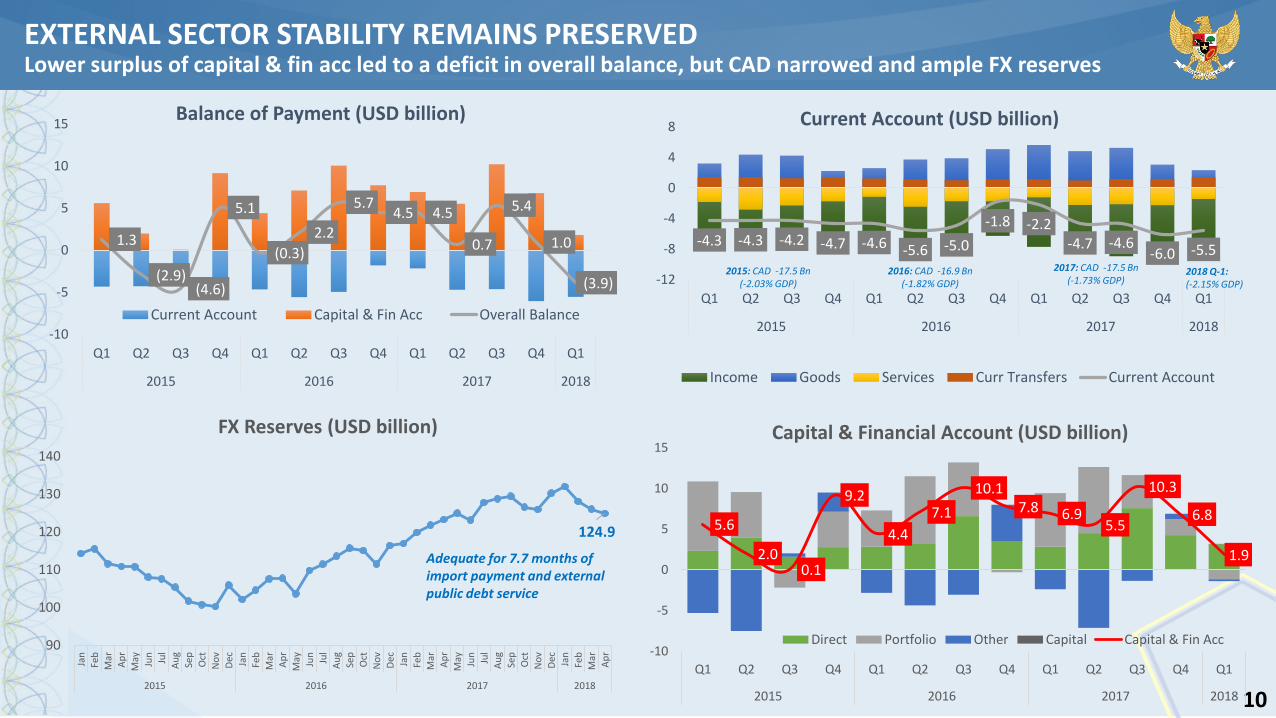
1.3
(2.9)(4.6)
5.1
(0.3)
2.2
5.7 4.5 4.5
0.7
5.4
1.0
(3.9)
-10
-5
0
5
10
15
Q1 Q2 Q3 Q4 Q1 Q2 Q3 Q4 Q1 Q2 Q3 Q4 Q1
2015 2016 2017 2018
Balance of Payment (USD billion)
Current Account Capital & Fin Acc Overall Balance
-4.3 -4.3 -4.2 -4.7 -4.6 -5.6 -5.0
-1.8 -2.2-4.7 -4.6
-6.0 -5.5
-12
-8
-4
0
4
8
Q1 Q2 Q3 Q4 Q1 Q2 Q3 Q4 Q1 Q2 Q3 Q4 Q1
2015 2016 2017 2018
Current Account (USD billion)
Income Goods Services Curr Transfers Current Account
124.9
90
100
110
120
130
140
Jan
Feb
Mar
Ap
r
May Jun
Jul
Au
g
Sep
Oct
No
v
Dec Jan
Feb
Mar
Ap
r
May Jun
Jul
Au
g
Sep
Oct
No
v
Dec Jan
Feb
Mar
Ap
r
May Jun
Jul
Au
g
Sep
Oct
No
v
Dec Jan
Feb
Mar
Ap
r
2015 2016 2017 2018
FX Reserves (USD billion)
Adequate for 7.7 months of import payment and external public debt service
EXTERNAL SECTOR STABILITY REMAINS PRESERVEDLower surplus of capital & fin acc led to a deficit in overall balance, but CAD narrowed and ample FX reserves
5.6
2.00.1
9.2
4.4
7.1
10.17.8 6.9
5.5
10.3
6.8
1.9
-10
-5
0
5
10
15
Q1 Q2 Q3 Q4 Q1 Q2 Q3 Q4 Q1 Q2 Q3 Q4 Q1
2015 2016 2017 2018
Capital & Financial Account (USD billion)
Direct Portfolio Other Capital Capital & Fin Acc
2015: CAD -17.5 Bn(-2.03% GDP)
2016: CAD -16.9 Bn(-1.82% GDP)
2017: CAD -17.5 Bn(-1.73% GDP)
2018 Q-1:(-2.15% GDP)
11
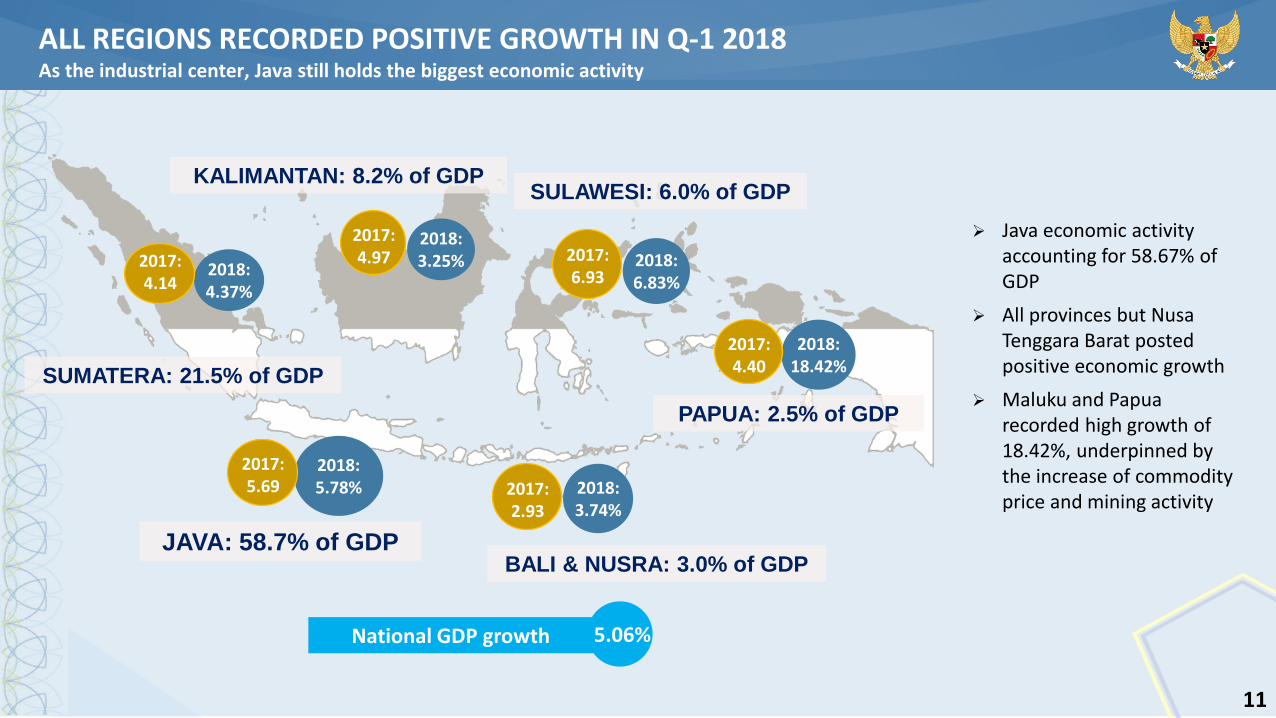
JAVA: 58.7% of GDP
SUMATERA: 21.5% of GDP
KALIMANTAN: 8.2% of GDPSULAWESI: 6.0% of GDP
PAPUA: 2.5% of GDP
BALI & NUSRA: 3.0% of GDP
2018:5.78%
2018:3.25% 2018:
6.83%
2018:3.74%
2018:18.42%
2018:4.37%
2017: 4.14
2017: 5.69
2017: 4.97 2017:
6.93
2017: 4.40
2017: 2.93
ALL REGIONS RECORDED POSITIVE GROWTH IN Q-1 2018As the industrial center, Java still holds the biggest economic activity
National GDP growth 5.06%
Java economic activity accounting for 58.67% of GDP
All provinces but Nusa Tenggara Barat posted positive economic growth
Maluku and Papua recorded high growth of 18.42%, underpinned by the increase of commodity price and mining activity
12
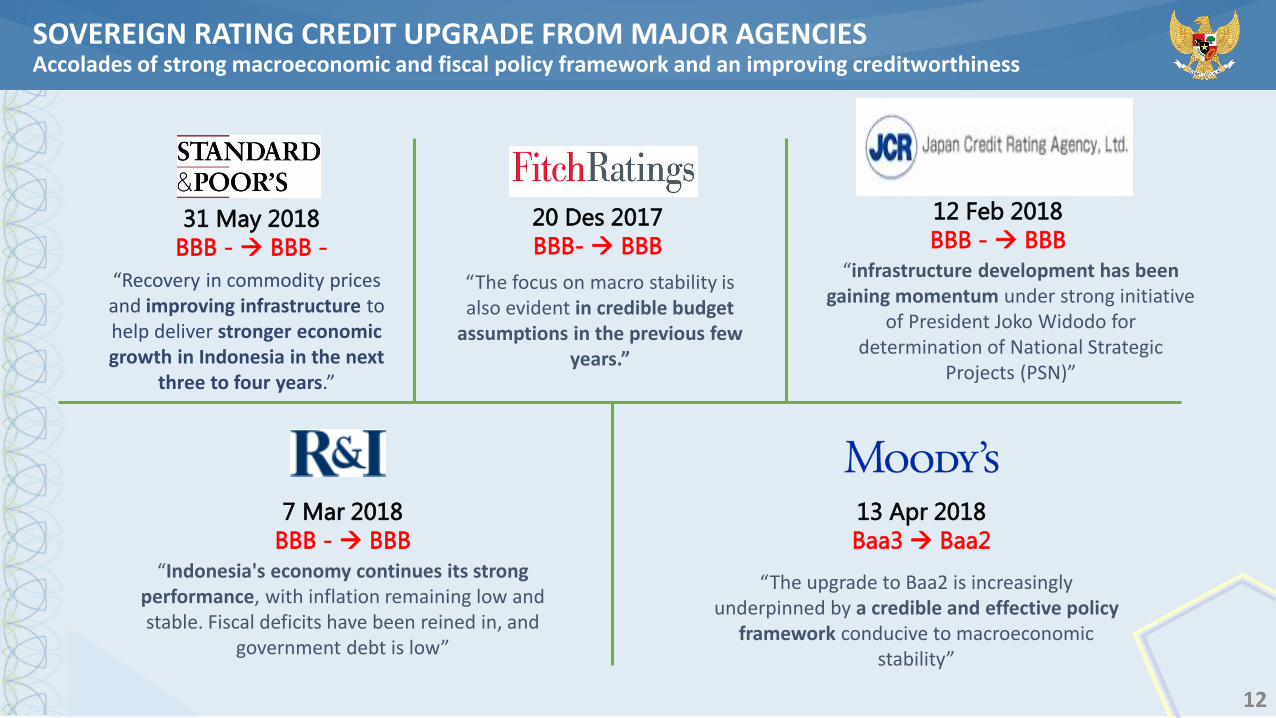
31 May 2018
BBB - BBB -
20 Des 2017
BBB- BBB
12 Feb 2018
BBB - BBB
7 Mar 2018
BBB - BBB
13 Apr 2018
Baa3 Baa2
“The upgrade to Baa2 is increasingly underpinned by a credible and effective policy
framework conducive to macroeconomic stability”
“Recovery in commodity prices and improving infrastructure to help deliver stronger economic growth in Indonesia in the next
three to four years.”
“The focus on macro stability is also evident in credible budget
assumptions in the previous few years.”
“infrastructure development has been gaining momentum under strong initiative
of President Joko Widodo for determination of National Strategic
Projects (PSN)”
“Indonesia's economy continues its strong performance, with inflation remaining low and stable. Fiscal deficits have been reined in, and
government debt is low”
SOVEREIGN RATING CREDIT UPGRADE FROM MAJOR AGENCIESAccolades of strong macroeconomic and fiscal policy framework and an improving creditworthiness
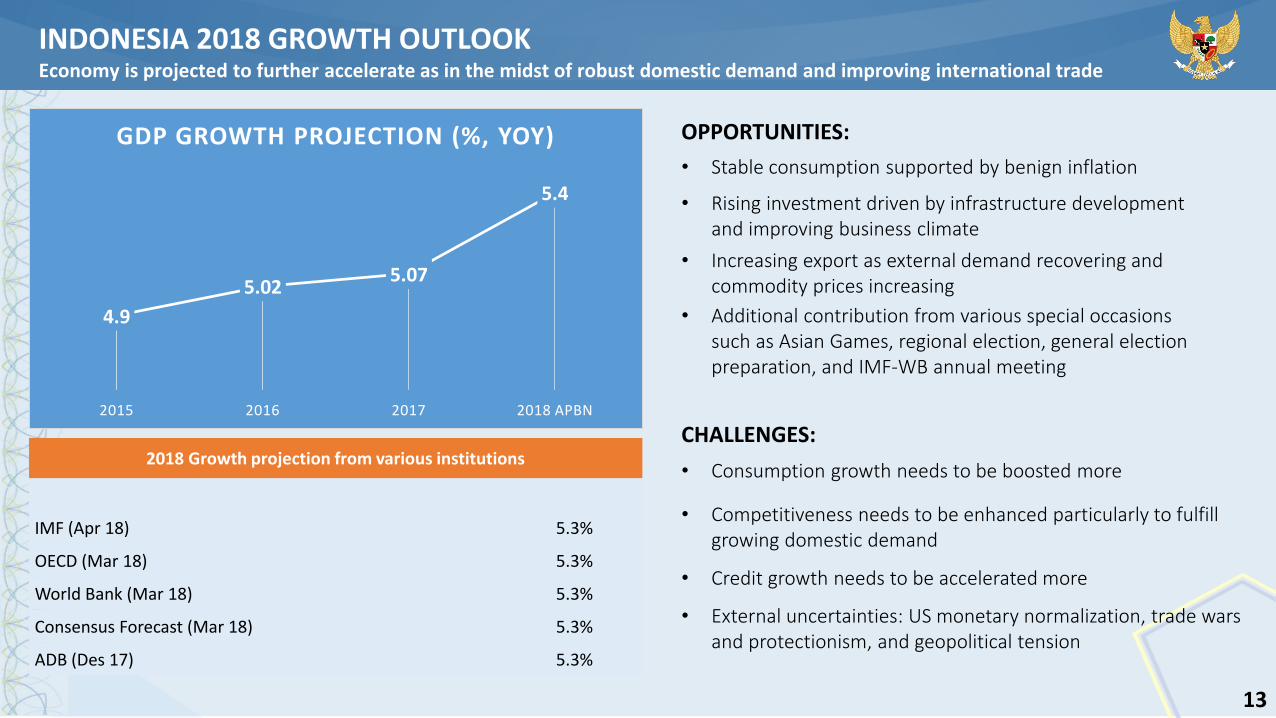
INDONESIA 2018 GROWTH OUTLOOK Economy is projected to further accelerate as in the midst of robust domestic demand and improving international trade
4.9
5.025.07
5.4
2015 2016 2017 2018 APBN
GDP GROWTH PROJECTION (%, YOY)
IMF (Apr 18) 5.3%
OECD (Mar 18) 5.3%
World Bank (Mar 18) 5.3%
Consensus Forecast (Mar 18) 5.3%
ADB (Des 17) 5.3%
2018 Growth projection from various institutions
• Stable consumption supported by benign inflation
• Rising investment driven by infrastructure development and improving business climate
• Increasing export as external demand recovering and commodity prices increasing
• Additional contribution from various special occasionssuch as Asian Games, regional election, general election preparation, and IMF-WB annual meeting
• External uncertainties: US monetary normalization, trade wars and protectionism, and geopolitical tension
OPPORTUNITIES:
CHALLENGES:
• Competitiveness needs to be enhanced particularly to fulfill growing domestic demand
• Credit growth needs to be accelerated more
• Consumption growth needs to be boosted more
13
14
Indicators
2016 2017 2018 2019
Revised Budget
(APBN-P)
Realized 31May
APBNRealized 31
MayBudget(APBN)
Realized 31 May
Submitted to Parliament
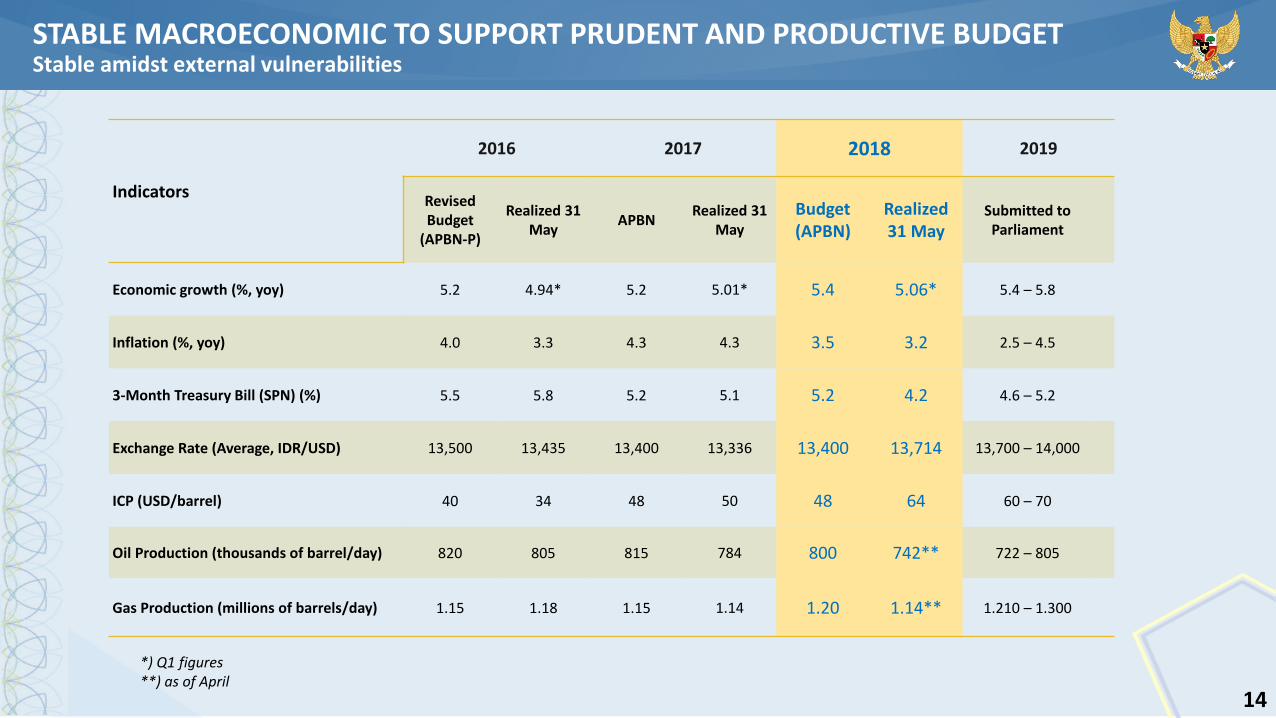
Economic growth (%, yoy) 5.2 4.94* 5.2 5.01* 5.4 5.06* 5.4 – 5.8
Inflation (%, yoy) 4.0 3.3 4.3 4.3 3.5 3.2 2.5 – 4.5
3-Month Treasury Bill (SPN) (%) 5.5 5.8 5.2 5.1 5.2 4.2 4.6 – 5.2
Exchange Rate (Average, IDR/USD) 13,500 13,435 13,400 13,336 13,400 13,714 13,700 – 14,000
ICP (USD/barrel) 40 34 48 50 48 64 60 – 70
Oil Production (thousands of barrel/day) 820 805 815 784 800 742** 722 – 805
Gas Production (millions of barrels/day) 1.15 1.18 1.15 1.14 1.20 1.14** 1.210 – 1.300
*) Q1 figures**) as of April
STABLE MACROECONOMIC TO SUPPORT PRUDENT AND PRODUCTIVE BUDGETStable amidst external vulnerabilities
15
2017 2018
R-BudgetMay
Realization% real
to BudgetBudget
MayRealization
% real to budget
% of growth
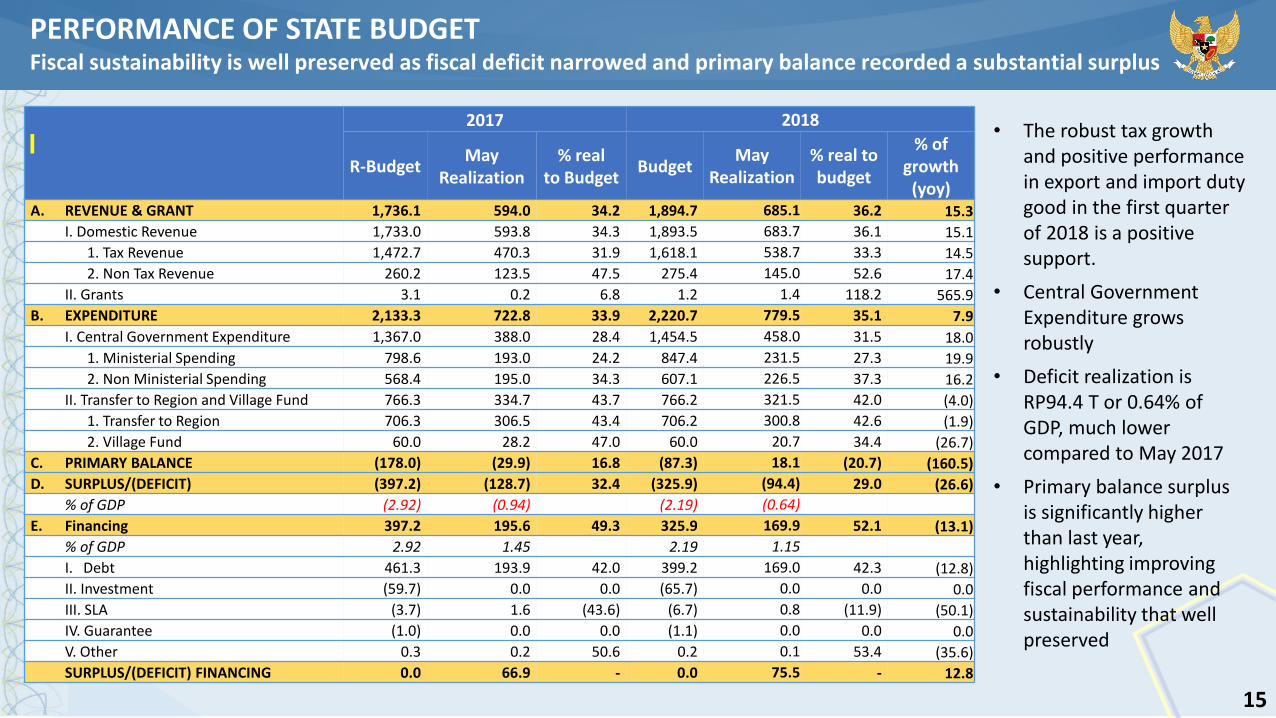
(yoy)A. REVENUE & GRANT 1,736.1 594.0 34.2 1,894.7 685.1 36.2 15.3
I. Domestic Revenue 1,733.0 593.8 34.3 1,893.5 683.7 36.1 15.1
1. Tax Revenue 1,472.7 470.3 31.9 1,618.1 538.7 33.3 14.5
2. Non Tax Revenue 260.2 123.5 47.5 275.4 145.0 52.6 17.4
II. Grants 3.1 0.2 6.8 1.2 1.4 118.2 565.9
B. EXPENDITURE 2,133.3 722.8 33.9 2,220.7 779.5 35.1 7.9
I. Central Government Expenditure 1,367.0 388.0 28.4 1,454.5 458.0 31.5 18.0
1. Ministerial Spending 798.6 193.0 24.2 847.4 231.5 27.3 19.9
2. Non Ministerial Spending 568.4 195.0 34.3 607.1 226.5 37.3 16.2
II. Transfer to Region and Village Fund 766.3 334.7 43.7 766.2 321.5 42.0 (4.0)
1. Transfer to Region 706.3 306.5 43.4 706.2 300.8 42.6 (1.9)
2. Village Fund 60.0 28.2 47.0 60.0 20.7 34.4 (26.7)
C. PRIMARY BALANCE (178.0) (29.9) 16.8 (87.3) 18.1 (20.7) (160.5)
D. SURPLUS/(DEFICIT) (397.2) (128.7) 32.4 (325.9) (94.4) 29.0 (26.6)
% of GDP (2.92) (0.94) (2.19) (0.64)
E. Financing 397.2 195.6 49.3 325.9 169.9 52.1 (13.1)
% of GDP 2.92 1.45 2.19 1.15
I. Debt 461.3 193.9 42.0 399.2 169.0 42.3 (12.8)
II. Investment (59.7) 0.0 0.0 (65.7) 0.0 0.0 0.0
III. SLA (3.7) 1.6 (43.6) (6.7) 0.8 (11.9) (50.1)
IV. Guarantee (1.0) 0.0 0.0 (1.1) 0.0 0.0 0.0
V. Other 0.3 0.2 50.6 0.2 0.1 53.4 (35.6)
SURPLUS/(DEFICIT) FINANCING 0.0 66.9 - 0.0 75.5 - 12.8
• The robust tax growth and positive performance in export and import duty good in the first quarter of 2018 is a positive support.
• Central Government Expenditure grows robustly
• Deficit realization is RP94.4 T or 0.64% of GDP, much lower compared to May 2017
• Primary balance surplus is significantly higher than last year, highlighting improving fiscal performance and sustainability that well preserved
PERFORMANCE OF STATE BUDGETFiscal sustainability is well preserved as fiscal deficit narrowed and primary balance recorded a substantial surplus
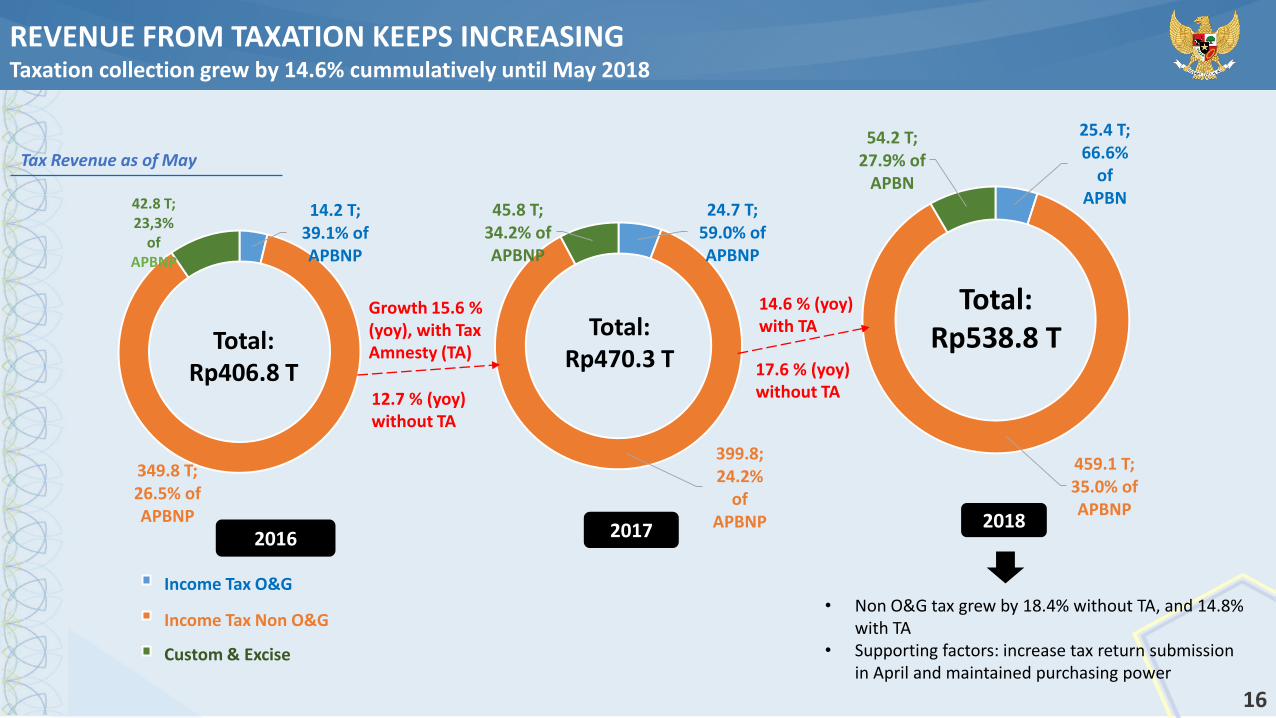
25.4 T; 66.6%
ofAPBN
459.1 T; 35.0% ofAPBNP
54.2 T; 27.9% of
APBN
2018
16
REVENUE FROM TAXATION KEEPS INCREASINGTaxation collection grew by 14.6% cummulatively until May 2018
14.2 T; 39.1% ofAPBNP
349.8 T; 26.5% of APBNP
42.8 T;23,3%
ofAPBNP
PPh Migas
Pajak Non-Migas
Bea Cukai
2016
Total:Rp406.8 T
24.7 T; 59.0% ofAPBNP
399.8; 24.2%
ofAPBNP
45.8 T; 34.2% ofAPBNP
2017
Total:Rp470.3 T
Total:Rp538.8 T
Growth 15.6 % (yoy), with Tax Amnesty (TA)
12.7 % (yoy) without TA
14.6 % (yoy) with TA
17.6 % (yoy) without TA
• Non O&G tax grew by 18.4% without TA, and 14.8% with TA
• Supporting factors: increase tax return submission in April and maintained purchasing power
Income Tax O&G
Income Tax Non O&G
Custom & Excise
Tax Revenue as of May
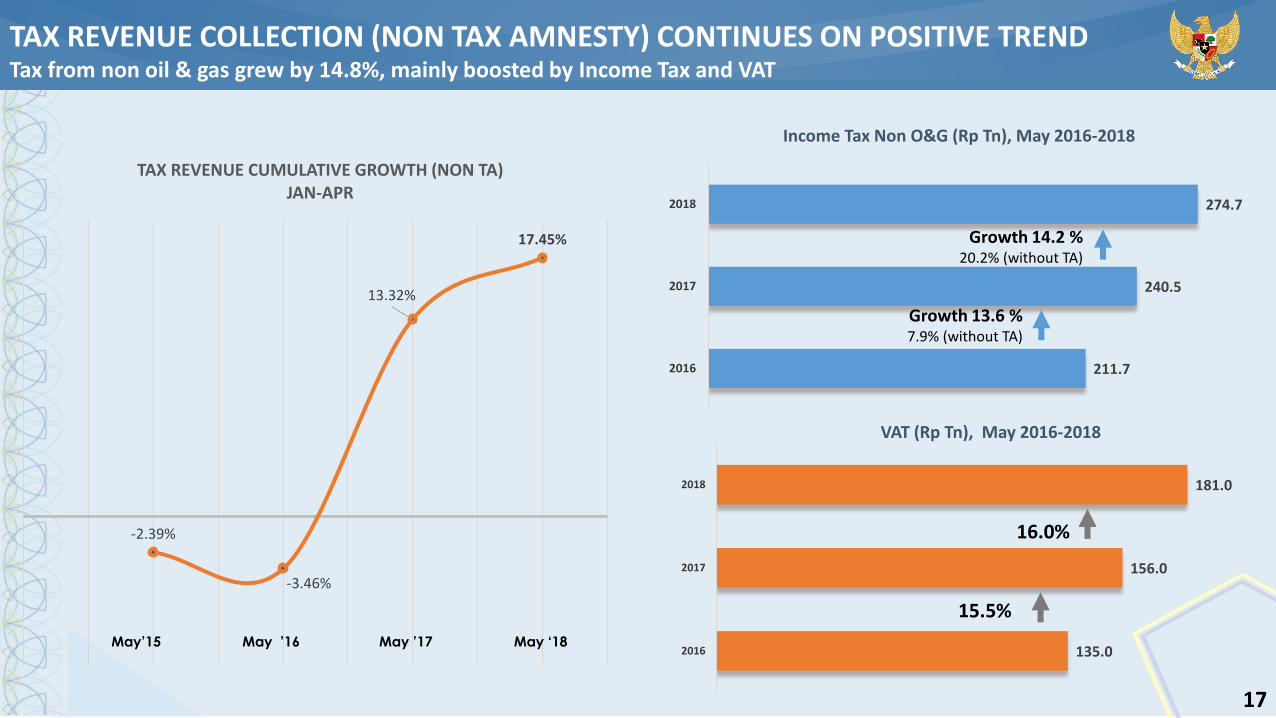
135.0
156.0
181.0
2016
2017
2018
VAT (Rp Tn), May 2016-2018
211.7
240.5
274.7
2016
2017
2018
Income Tax Non O&G (Rp Tn), May 2016-2018
17
Growth 14.2 %20.2% (without TA)
15.5%
16.0%
Growth 13.6 %7.9% (without TA)
TAX REVENUE COLLECTION (NON TAX AMNESTY) CONTINUES ON POSITIVE TRENDTax from non oil & gas grew by 14.8%, mainly boosted by Income Tax and VAT
-2.39%
-3.46%
13.32%
17.45%
TAX REVENUE CUMULATIVE GROWTH (NON TA)JAN-APR
May’15 May ’16 May ’17 May ‘18
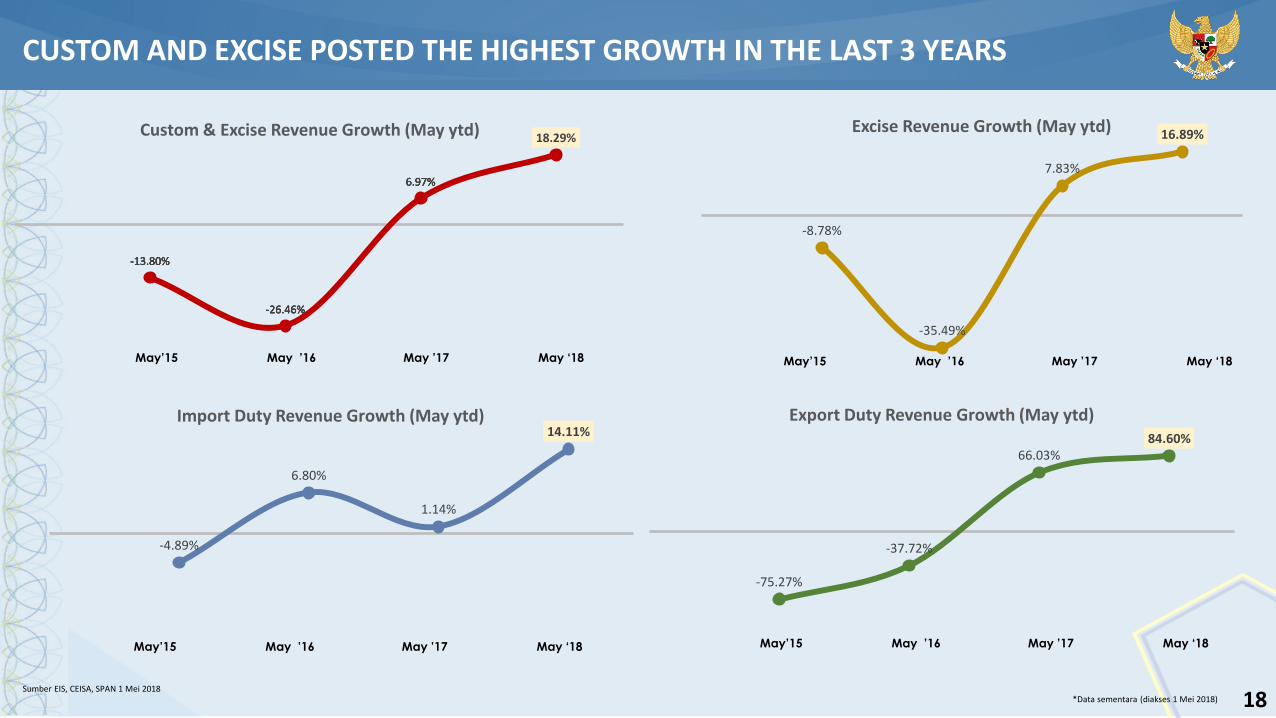
-8.78%
-35.49%
7.83%
16.89%Excise Revenue Growth (May ytd)
CUSTOM AND EXCISE POSTED THE HIGHEST GROWTH IN THE LAST 3 YEARS
18*Data sementara (diakses 1 Mei 2018)Sumber EIS, CEISA, SPAN 1 Mei 2018
May’15 May ’16 May ’17 May ‘18
-13.80%
-26.46%
6.97%
18.29%
-13.80%
-26.46%
6.97%
18.29%
-13.80%
-26.46%
6.97%
18.29%
-13.80%
-26.46%
6.97%
18.29%Custom & Excise Revenue Growth (May ytd)
May’15 May ’16 May ’17 May ‘18May’15 May ’16 May ’17 May ‘18
May’15 May ’16 May ’17 May ‘18
-4.89%
6.80%
1.14%
14.11%Import Duty Revenue Growth (May ytd)
-75.27%
-37.72%
66.03%84.60%
Export Duty Revenue Growth (May ytd)
19
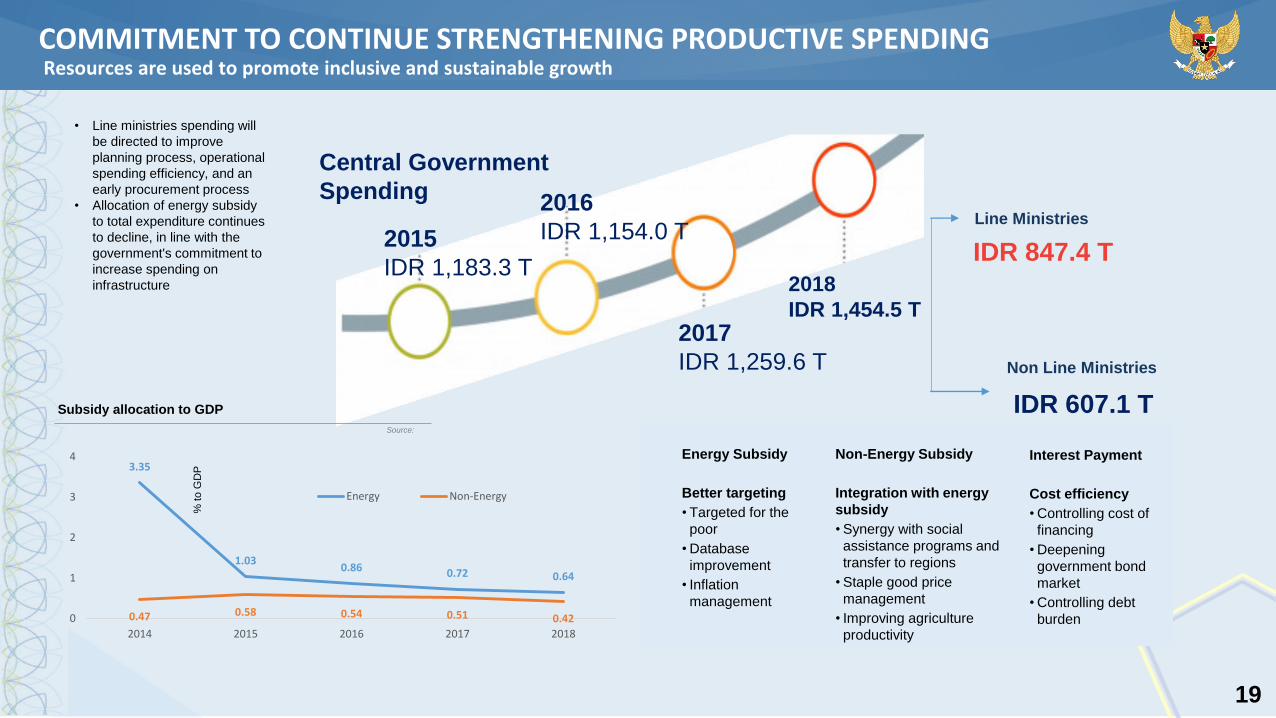
2015
IDR 1,183.3 T
2016
IDR 1,154.0 T
2017
IDR 1,259.6 T
2018
IDR 1,454.5 T
Central Government
SpendingLine Ministries
Non Line Ministries
IDR 847.4 T
IDR 607.1 T
Energy Subsidy
Better targeting
• Targeted for the
poor
•Database
improvement
• Inflation
management
Interest Payment
Cost efficiency
•Controlling cost of
financing
•Deepening
government bond
market
•Controlling debt
burden
Non-Energy Subsidy
Integration with energy
subsidy
•Synergy with social
assistance programs and
transfer to regions
•Staple good price
management
• Improving agriculture
productivity
• Line ministries spending will
be directed to improve
planning process, operational
spending efficiency, and an
early procurement process
• Allocation of energy subsidy
to total expenditure continues
to decline, in line with the
government's commitment to
increase spending on
infrastructure
3.35
1.030.86 0.72 0.64
0.47 0.58 0.54 0.51 0.420
1
2
3
4
2014 2015 2016 2017 2018
Energy Non-Energy
Subsidy allocation to GDP
% to G
DP
Source:
COMMITMENT TO CONTINUE STRENGTHENING PRODUCTIVE SPENDINGResources are used to promote inclusive and sustainable growth

20
2015:
65.9
2016:
92.3
2017:
104.9
2014:
59.7
2018:
111.0
2016:
370.42014:
353.4
2015:
390.12017:
419.8
2018:
444.1
© h
am
da
nh
asa
n.d
evia
nta
rt.c
om
Education Allocation (20% of Spending)
Health Allocation (5% of Spending)
Infrastructure Allocation
2014:
154.7
2015:
256.1
2016:
269.12017 :
400.9
2018:
410.4
Focuses: improving supply side, better access, service quality, promoting preventive
action, and maintain JKN sustainability.
Policy direction
Improving distribution of health facilities and health personnel.
Strengthening promotive and preventive programs
Improving the effectiveness and sustainability of the national health insurance program.
Increasing the role of local government for supply side as well as service side.
Focus on improving access, distribution, and quality of education
Policy direction
• Improving access, distribution, and quality of education.
• Improving school facilities and infrastructure.
• Synergy between Central and Local Government.
• Strengthening vocational education and link and match curriculum.
• Widening access (BOS, PKH, PIP, Bidik Misi and DPPN) for sustainable education.
Infrastructure acceleration to tackle regional and global challenges
Target : Road: 856 km Railway:639 km’sp New airports in 15 locations Irigation:781 km Electrification ratio: 95.15%; Housing: 7062 unit
ALLOCATING MORE ON PRODUCTIVE AVENUEScommitted to strengthen the quality of its people through infrastructure support, good education and health spending
21
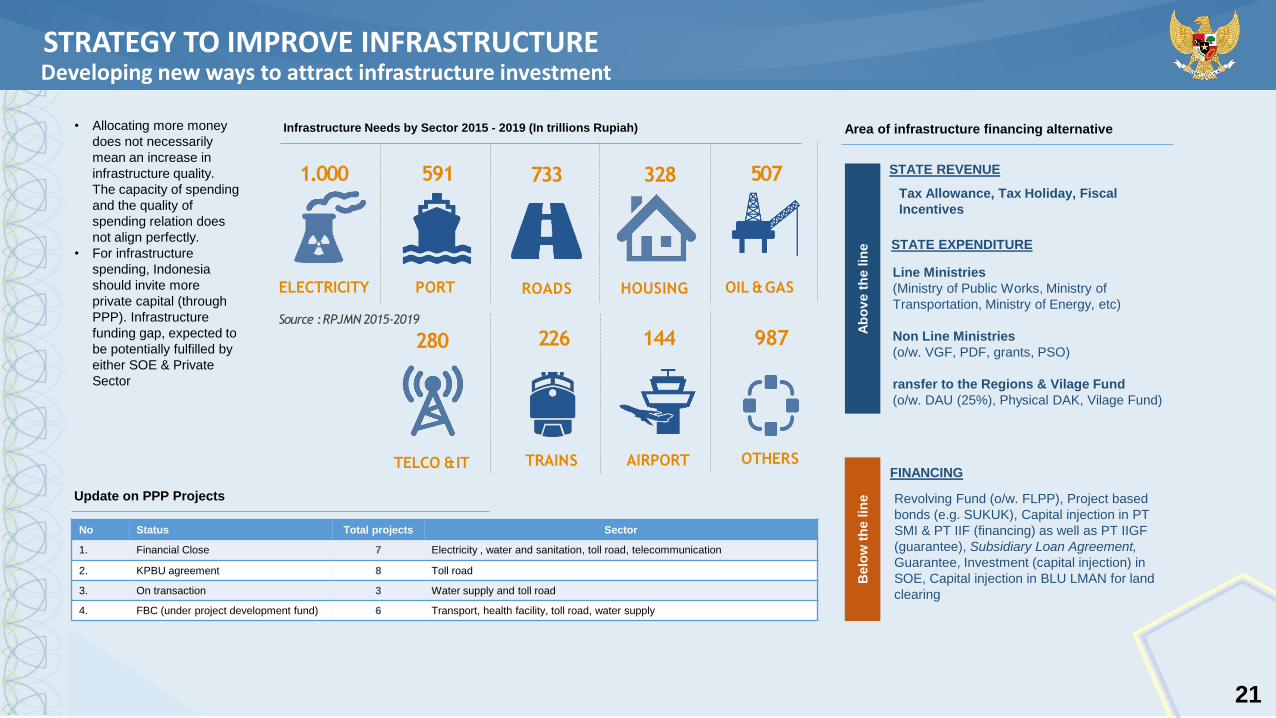
AIRPORTTRAINS
ROADS
OTHERS
144226
HOUSING OIL &GAS
1.000 591 733 328 507
TELCO &IT
280 987
ELECTRICITY PORT
Source : RPJMN 2015-2019
• Allocating more money
does not necessarily
mean an increase in
infrastructure quality.
The capacity of spending
and the quality of
spending relation does
not align perfectly.
• For infrastructure
spending, Indonesia
should invite more
private capital (through
PPP). Infrastructure
funding gap, expected to
be potentially fulfilled by
either SOE & Private
Sector
Ab
ov
e t
he lin
e
Tax Allowance, Tax Holiday, Fiscal
Incentives
STATE REVENUE
STATE EXPENDITURE
Line Ministries
(Ministry of Public Works, Ministry of
Transportation, Ministry of Energy, etc)
Non Line Ministries
(o/w. VGF, PDF, grants, PSO)
ransfer to the Regions & Vilage Fund
(o/w. DAU (25%), Physical DAK, Vilage Fund)
Belo
w t
he lin
e
FINANCING
Revolving Fund (o/w. FLPP), Project based
bonds (e.g. SUKUK), Capital injection in PT
SMI & PT IIF (financing) as well as PT IIGF
(guarantee), Subsidiary Loan Agreement,
Guarantee, Investment (capital injection) in
SOE, Capital injection in BLU LMAN for land
clearing
No Status Total projects Sector
1. Financial Close 7 Electricity , water and sanitation, toll road, telecommunication
2. KPBU agreement 8 Toll road
3. On transaction 3 Water supply and toll road
4. FBC (under project development fund) 6 Transport, health facility, toll road, water supply
Update on PPP Projects
Area of infrastructure financing alternativeInfrastructure Needs by Sector 2015 - 2019 (In trillions Rupiah)
STRATEGY TO IMPROVE INFRASTRUCTUREDeveloping new ways to attract infrastructure investment
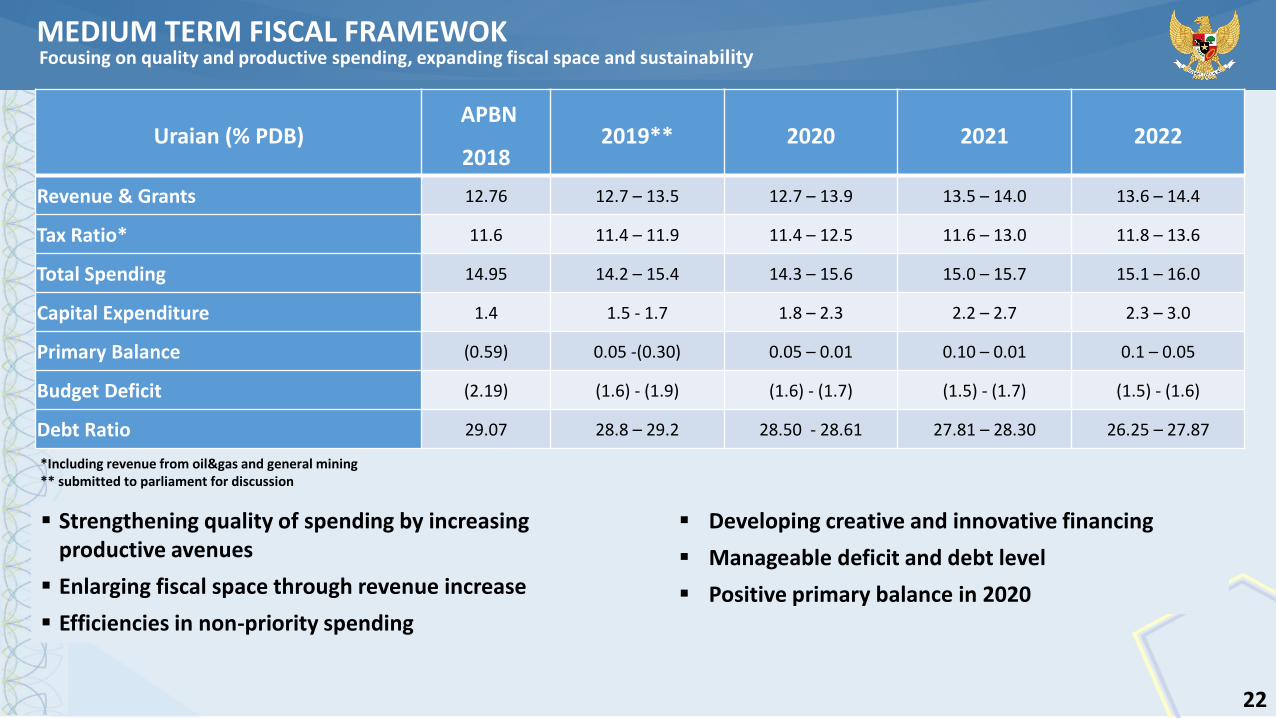
Uraian (% PDB)APBN
20182019** 2020 2021 2022
Revenue & Grants 12.76 12.7 – 13.5 12.7 – 13.9 13.5 – 14.0 13.6 – 14.4
Tax Ratio* 11.6 11.4 – 11.9 11.4 – 12.5 11.6 – 13.0 11.8 – 13.6
Total Spending 14.95 14.2 – 15.4 14.3 – 15.6 15.0 – 15.7 15.1 – 16.0
Capital Expenditure 1.4 1.5 - 1.7 1.8 – 2.3 2.2 – 2.7 2.3 – 3.0
Primary Balance (0.59) 0.05 -(0.30) 0.05 – 0.01 0.10 – 0.01 0.1 – 0.05
Budget Deficit (2.19) (1.6) - (1.9) (1.6) - (1.7) (1.5) - (1.7) (1.5) - (1.6)
Debt Ratio 29.07 28.8 – 29.2 28.50 - 28.61 27.81 – 28.30 26.25 – 27.87
Strengthening quality of spending by increasing productive avenues
Enlarging fiscal space through revenue increase
Efficiencies in non-priority spending
Focusing on quality and productive spending, expanding fiscal space and sustainability
Developing creative and innovative financing
Manageable deficit and debt level
Positive primary balance in 2020
22
*Including revenue from oil&gas and general mining** submitted to parliament for discussion
MEDIUM TERM FISCAL FRAMEWOK
23
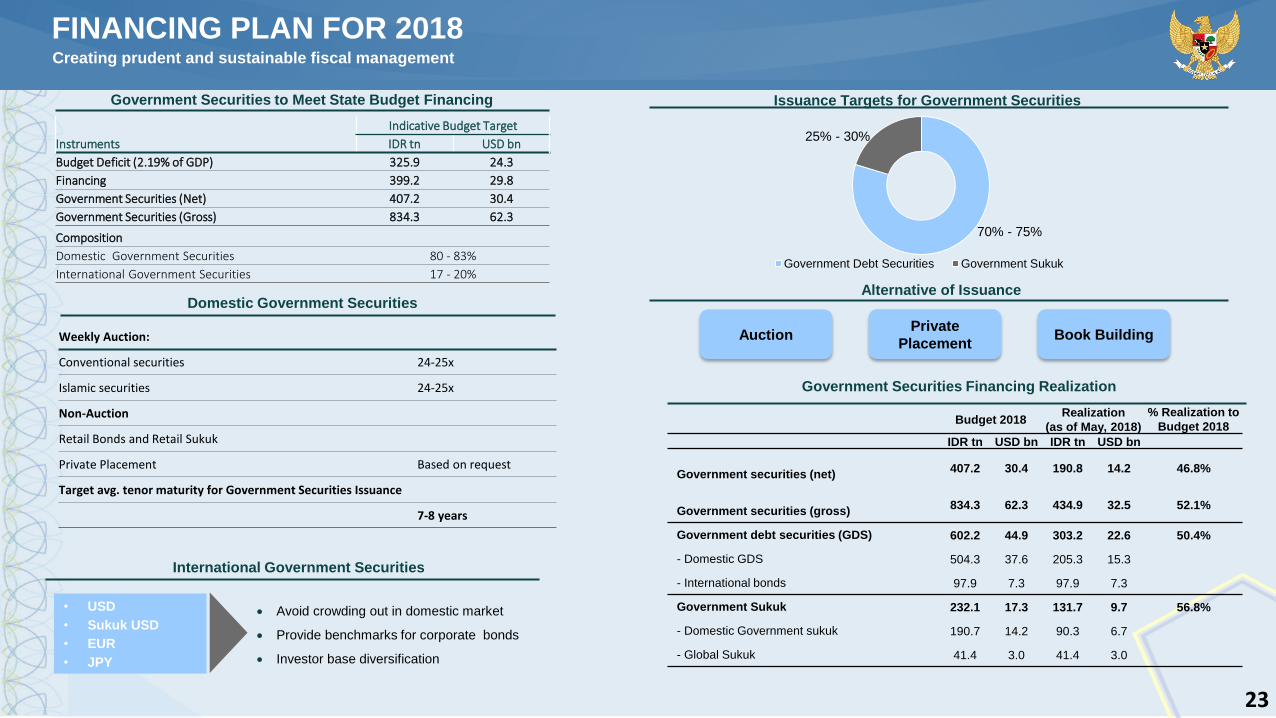
FINANCING PLAN FOR 2018Creating prudent and sustainable fiscal management
Government Securities to Meet State Budget Financing
Domestic Government Securities
Issuance Targets for Government Securities
70% - 75%
25% - 30%
Government Debt Securities Government Sukuk
Weekly Auction:
Conventional securities 24-25x
Islamic securities 24-25x
Non-Auction
Retail Bonds and Retail Sukuk
Private Placement Based on request
Target avg. tenor maturity for Government Securities Issuance
7-8 years
Instruments
Indicative Budget Target
IDR tn USD bn
Budget Deficit (2.19% of GDP) 325.9 24.3
Financing 399.2 29.8
Government Securities (Net) 407.2 30.4
Government Securities (Gross) 834.3 62.3
Composition
Domestic Government Securities 80 - 83%
International Government Securities 17 - 20%
International Government Securities
Avoid crowding out in domestic market
Provide benchmarks for corporate bonds
Investor base diversification
• USD
• Sukuk USD
• EUR
• JPY
Alternative of Issuance
Private
PlacementAuction Book Building
Government Securities Financing Realization
Budget 2018Realization
(as of May, 2018)
% Realization to
Budget 2018
IDR tn USD bn IDR tn USD bn
Government securities (net)407.2 30.4 190.8 14.2 46.8%
Government securities (gross)834.3 62.3 434.9 32.5 52.1%
Government debt securities (GDS) 602.2 44.9 303.2 22.6 50.4%
- Domestic GDS 504.3 37.6 205.3 15.3
- International bonds 97.9 7.3 97.9 7.3
Government Sukuk 232.1 17.3 131.7 9.7 56.8%
- Domestic Government sukuk 190.7 14.2 90.3 6.7
- Global Sukuk 41.4 3.0 41.4 3.0
24
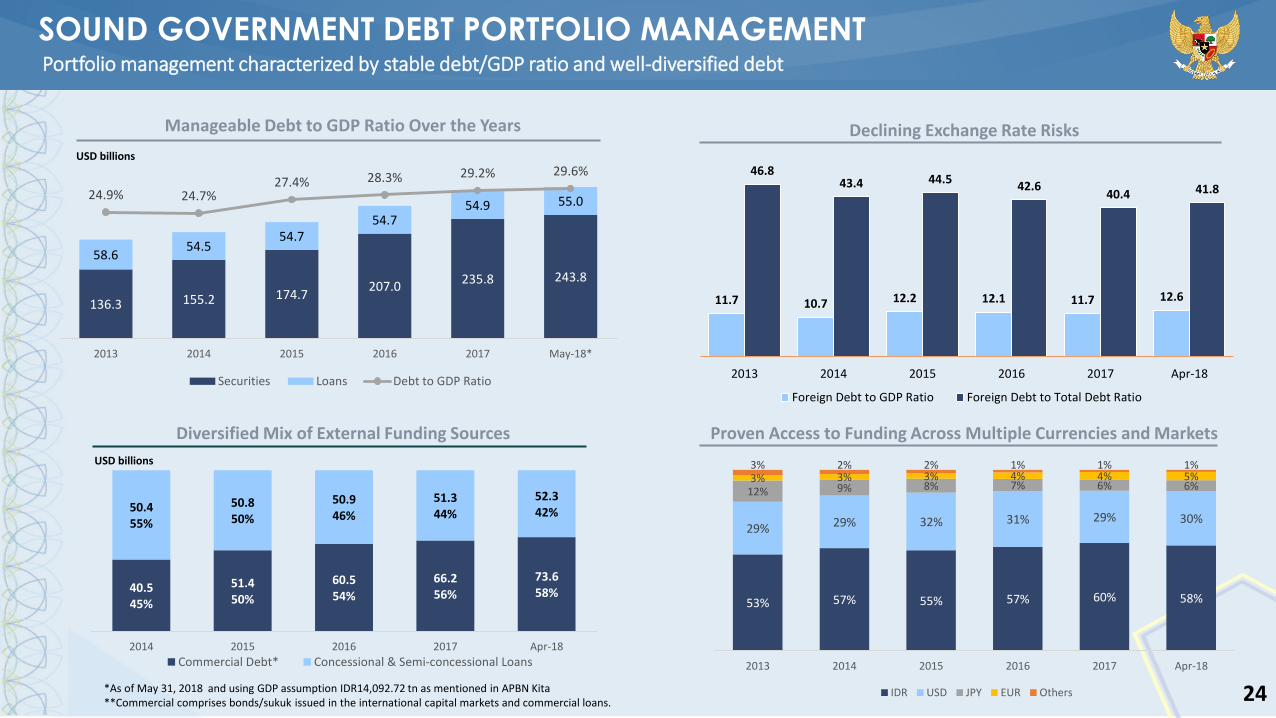
SOUND GOVERNMENT DEBT PORTFOLIO MANAGEMENT Portfolio management characterized by stable debt/GDP ratio and well-diversified debt
Manageable Debt to GDP Ratio Over the Years
Proven Access to Funding Across Multiple Currencies and Markets
136.3 155.2 174.7207.0
235.8 243.8
58.654.5
54.754.7
54.9 55.024.9% 24.7%27.4% 28.3% 29.2% 29.6%
2013 2014 2015 2016 2017 May-18*
Securities Loans Debt to GDP Ratio
USD billions
53% 57% 55% 57% 60% 58%
29% 29% 32% 31% 29% 30%
12% 9% 8% 7% 6% 6%3% 3% 3% 4% 4% 5%3% 2% 2% 1% 1% 1%
2013 2014 2015 2016 2017 Apr-18
IDR USD JPY EUR Others
Declining Exchange Rate Risks
11.7 10.7 12.2 12.1 11.7 12.6
46.843.4 44.5
42.640.4 41.8
2013 2014 2015 2016 2017 Apr-18
Foreign Debt to GDP Ratio Foreign Debt to Total Debt Ratio
Diversified Mix of External Funding Sources
USD billions
40.545%
51.450%
60.554%
66.256%
73.658%
50.455%
50.850%
50.946%
51.344%
52.342%
2014 2015 2016 2017 Apr-18
Commercial Debt* Concessional & Semi-concessional Loans
*As of May 31, 2018 and using GDP assumption IDR14,092.72 tn as mentioned in APBN Kita **Commercial comprises bonds/sukuk issued in the international capital markets and commercial loans.
25
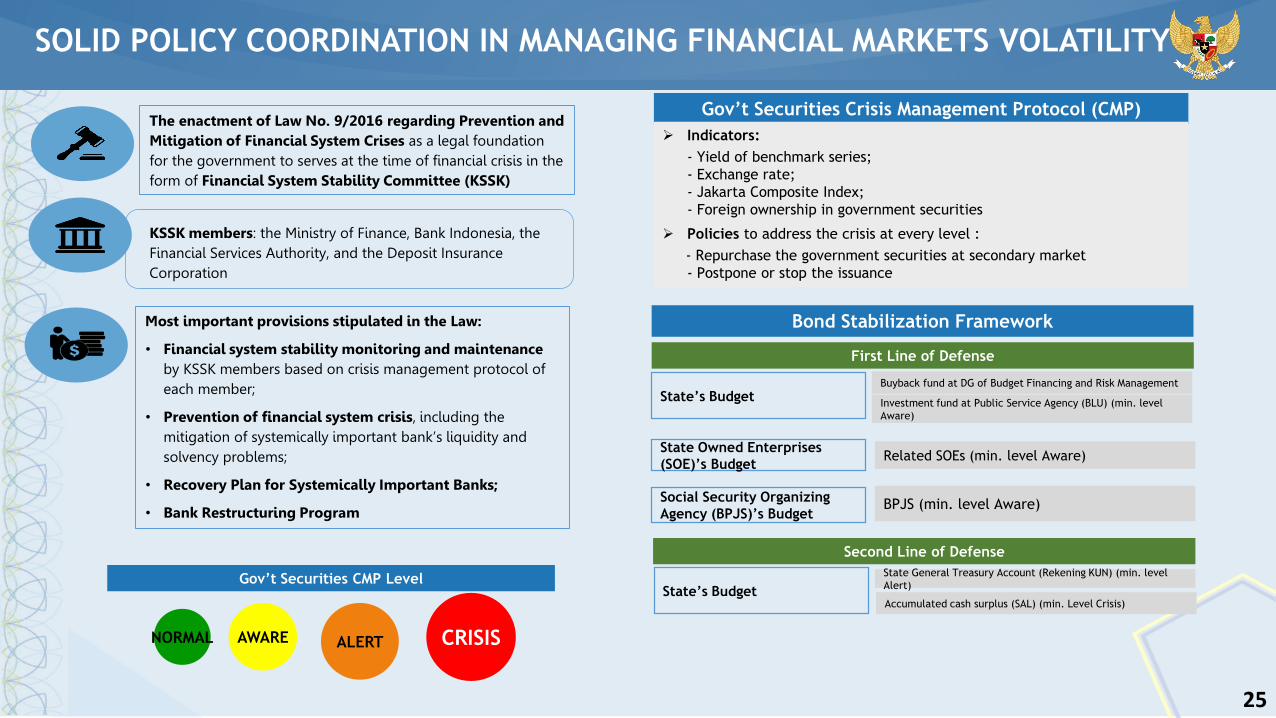
SOLID POLICY COORDINATION IN MANAGING FINANCIAL MARKETS VOLATILITY
First Line of Defense
State’s BudgetBuyback fund at DG of Budget Financing and Risk Management
Investment fund at Public Service Agency (BLU) (min. level
Aware)
State Owned Enterprises
(SOE)’s BudgetRelated SOEs (min. level Aware)
Social Security Organizing
Agency (BPJS)’s BudgetBPJS (min. level Aware)
Second Line of Defense
State’s Budget
State General Treasury Account (Rekening KUN) (min. level
Alert)
Accumulated cash surplus (SAL) (min. Level Crisis)
Gov’t Securities Crisis Management Protocol (CMP)
Indicators:
- Yield of benchmark series;
- Exchange rate;
- Jakarta Composite Index;
- Foreign ownership in government securities
Policies to address the crisis at every level :
- Repurchase the government securities at secondary market
- Postpone or stop the issuance
The enactment of Law No. 9/2016 regarding Prevention and
Mitigation of Financial System Crises as a legal foundation
for the government to serves at the time of financial crisis in the
form of Financial System Stability Committee (KSSK)
KSSK members: the Ministry of Finance, Bank Indonesia, the
Financial Services Authority, and the Deposit Insurance
Corporation
Most important provisions stipulated in the Law:
• Financial system stability monitoring and maintenance
by KSSK members based on crisis management protocol of
each member;
• Prevention of financial system crisis, including the
mitigation of systemically important bank’s liquidity and
solvency problems;
• Recovery Plan for Systemically Important Banks;
• Bank Restructuring Program
Gov’t Securities CMP Level
NORMAL AWARE ALERT CRISIS
Bond Stabilization Framework

26
THANK YOU