low dose nerve agent sarin causes dilated cardiomyopathy
TRANSCRIPT
Wright State University Wright State University
CORE Scholar CORE Scholar
Browse all Theses and Dissertations Theses and Dissertations
2011
Low Dose Nerve Agent Sarin Causes Dilated Cardiomyopathy and Low Dose Nerve Agent Sarin Causes Dilated Cardiomyopathy and
Autonomic Imbalance in Mice Autonomic Imbalance in Mice
Swapnil Vijay Shewale Wright State University
Follow this and additional works at: https://corescholar.libraries.wright.edu/etd_all
Part of the Pharmacology, Toxicology and Environmental Health Commons
Repository Citation Repository Citation Shewale, Swapnil Vijay, "Low Dose Nerve Agent Sarin Causes Dilated Cardiomyopathy and Autonomic Imbalance in Mice" (2011). Browse all Theses and Dissertations. 1059. https://corescholar.libraries.wright.edu/etd_all/1059
This Thesis is brought to you for free and open access by the Theses and Dissertations at CORE Scholar. It has been accepted for inclusion in Browse all Theses and Dissertations by an authorized administrator of CORE Scholar. For more information, please contact [email protected].
LOW DOSE NERVE AGENT SARIN CAUSES DILATED CARDIOMYOPATHY AND AUTONOMIC IMBALANCE IN MICE
A thesis submitted in partial fulf i l lment of the requirements for the degree of Master of Science
By
SWAPNIL VIJAY SHEWALE B.Pharmacy, University of Pune, 2007
2011 Wright State University
WRIGHT STATE UNIVERSITY
SCHOOL OF GRADUATE STUDIES
AUGUST-20-2010
I HEREBY RECOMMEND THAT THE THESIS PREPARED UNDER MY
SUPERVISION BY Swapnil Vijay Shewale ENTITLED “Low Dose Nerve
Agent Sarin Causes Dilated Cardiomyopathy and Autonomic Imbalance In
Mice” BE ACCEPTED IN PARTIAL FULFILLMENT OF THE
REQUIREMENTS FOR THE DEGREE OF Master of Science
Dr. Mariana Morris, Ph.D.
Thesis Director
Dr. Mariana Morris, Ph.D. Chair , Department of
Pharmacology and Toxicology Committee on Final Examination Dr. Mariana Morris, Ph.D. Dr. James Lucot, Ph.D. Dr. Mark Anstadt, M.D. Dr. Andrew Hsu, Ph.D. Dean, Graduate School
ABSTRACT
Shewale, Swapnil Vijay, M.S., Pharmacology/Toxicology Masters Program,
Department of Pharmacology and Toxicology, Wright State University,
2011. Low Dose Nerve Agent Sarin Causes Dilated Cardio myopathy and
Autonomic Imbalance
Sarin, a lethal chemical nerve agent, may be a causative fa ctor in
multifactorial syndrome implicated in the Gulf War and Tokyo terrorist
attacks. While high dose results in seizure and death, low dose exposure
may lead to autonomic imbalance and chronic cardiac pathologies . In the
present study, echocardiography and electrocardiography were used to
examine the late onset effects of a low dose sarin on cardiac structure and
function in mice. Stress responsiveness of the hypothalamic pituitary
adrenal (HPA) axis was also tested . Findings demonstrate changes
consistent with a dilated cardiomyopathy, including left ventricular
dilatation, reduced contractility, and altered electrophysiological and
inotropic responses to β adrenergic stimulation. Results also indicate
altered stress responsiveness of HPA indicating autonomic imbalance . The
role of low-dose sarin/organophosphate exposure needs to be considered
in military and civilian population who suffer from autonomic imbalance
and/or cardiomyopathies of indeterminate origin.
i ii
iv
Table of Contents
I. Introduction ..................................................................................................... 13
I.1. Sarin: Structure, Function and Mechanism of Action ....................................... 13
I.2. Mechanism of Action of OP’s ............................................................................ 14
II. Background ..................................................................................................... 16
III. Health effects of Sarin and current treatment ................................................. 17
III.1 Symptoms seen in Gulf war veterans . ........................................................... 17
III.2. Cardiovascular Effects ...................................................................................... 18
III.3. Current therapy for acute nerve agent / OP-poisoning .................................. 19
IV. Problem Statement, Hypothesis and Specific Aims…………………………………………22
IV.1. Problem Statement ......................................................................................... 20
IV.2. Hypothesis: ...................................................................................................... 20
IV.3 Specific Aims ..................................................................................................... 20
V. Methods ......................................................................................................... 21
V.1. Animal Protocol ................................................................................................ 21
V.2. Sarin Exposure .................................................................................................. 21
V.3. Cholinesterase Assay ........................................................................................ 22
V.4. Transthoracic Echocardiography ...................................................................... 22
V.5. Electrocardiography (EKG) Methods ................................................................ 24
V.6. Body Weights .................................................................................................... 24
V.7. Urine Collection ................................................................................................ 24
V.8. Cage Change Induced Stress Experiment ......................................................... 25
V.9. ANP and BNP Staining and Quantification ....................................................... 25
V.10. H&E Staining ................................................................................................... 25
v
V.11. Cell Size Quantification ................................................................................... 26
V.12. In situ hybridization (ISH) for TH mRNA ......................................................... 27
V.13. Spot Urine Collection and Cage Change Stress Experiment: ......................... 28
V.14. Corticosterone Radioimmunoassay (RIA) ....................................................... 25
V.15. Protein Assay: ................................................................................................. 29
V.16. Creatinine assay: EIA ...................................................................................... 29
V.17. Statistical Analysis ........................................................................................ 29
VI.Equations and Derived Parameters ................................................................. 30
VI.1. ECHO Derived Parameters ............................................................................... 30
VI.2. Electrocardiography Derived Parameters ....................................................... 32
VII. Figures and Results ....................................................................................... 34
VII.1. Time course of sarin induced LV dilation ....................................................... 36
VII.2. Dobutamine stress test: Impaired stress response in sarin mice .................. 39
VII.3. Electrocardiography: ST depression and pro-arrhythmic phenotype in sarin
mice.......................................................................................................................... 42
VII.4. Histological and Immunohistochemical evidence of cardiac remodeling ..... 43
VII.5. Evidence for autonomic imbalance: Stress induced Hypothalamic–pituitary–
adrenal (HPA)-axis dysregulation ............................................................................ 43
VIII. Discussion .................................................................................................... 45
VIII.1. Sarin induced dilated cardiomyopathy ......................................................... 45
VIII.2. Sarin induced autonomic dysfunction: .......................................................... 48
IX. Conclusion ..................................................................................................... 50
XI. Bibliography................................................................................................... 51
vi
List of Figures
Figure Page
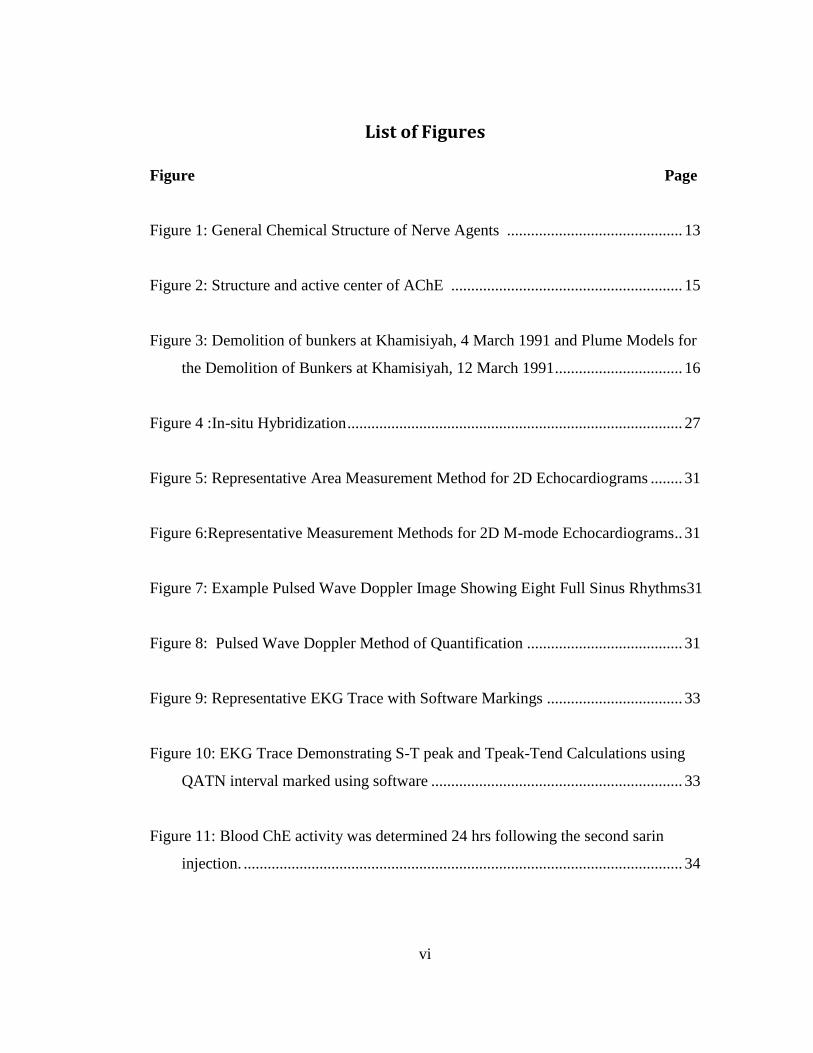
Figure 1: General Chemical Structure of Nerve Agents ............................................ 13
Figure 2: Structure and active center of AChE .......................................................... 15
Figure 3: Demolition of bunkers at Khamisiyah, 4 March 1991 and Plume Models for
the Demolition of Bunkers at Khamisiyah, 12 March 1991 ................................ 16
Figure 4 :In-situ Hybridization .................................................................................... 27
Figure 5: Representative Area Measurement Method for 2D Echocardiograms ........ 31
Figure 6:Representative Measurement Methods for 2D M-mode Echocardiograms .. 31
Figure 7: Example Pulsed Wave Doppler Image Showing Eight Full Sinus Rhythms31
Figure 8: Pulsed Wave Doppler Method of Quantification ....................................... 31
Figure 9: Representative EKG Trace with Software Markings .................................. 33
Figure 10: EKG Trace Demonstrating S-T peak and Tpeak-Tend Calculations using
QATN interval marked using software ............................................................... 33 PAGE
Figure 11: Blood ChE activity was determined 24 hrs following the second sarin
injection. .............................................................................................................. 34
vii
Figure Page
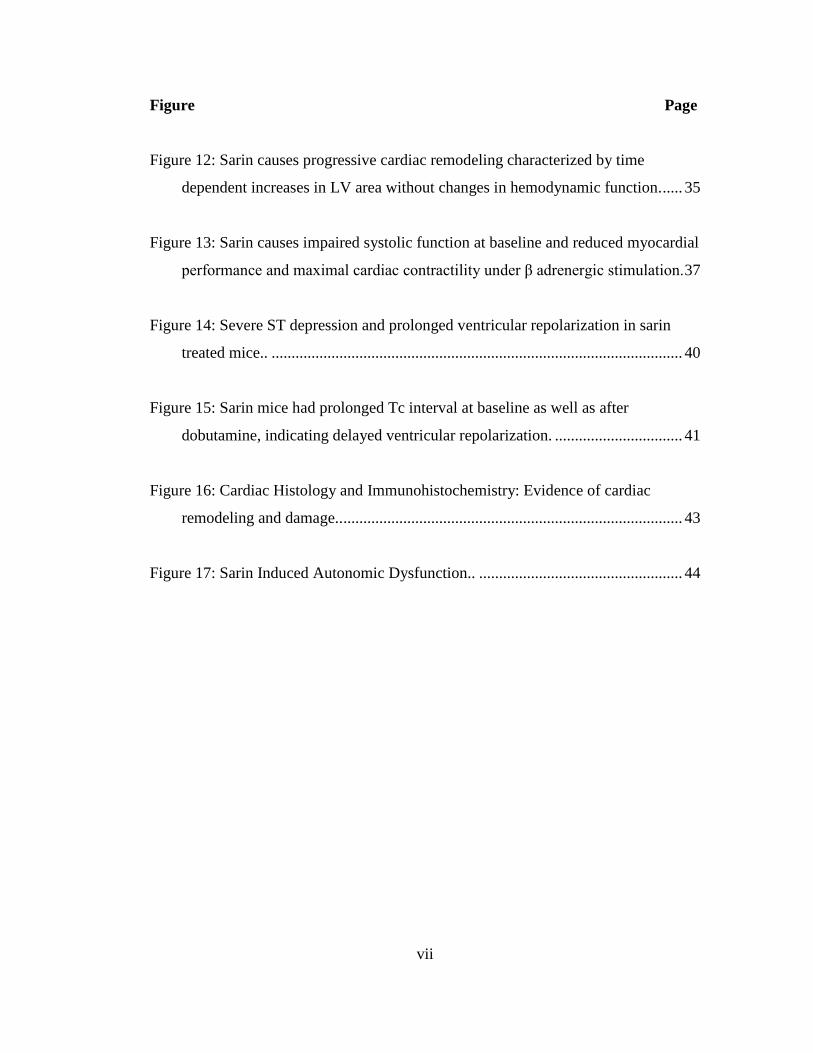
Figure 12: Sarin causes progressive cardiac remodeling characterized by time
dependent increases in LV area without changes in hemodynamic function. ..... 35
Figure 13: Sarin causes impaired systolic function at baseline and reduced myocardial
performance and maximal cardiac contractility under β adrenergic stimulation. 37
Figure 14: Severe ST depression and prolonged ventricular repolarization in sarin
treated mice.. ....................................................................................................... 40
Figure 15: Sarin mice had prolonged Tc interval at baseline as well as after
dobutamine, indicating delayed ventricular repolarization. ................................ 41
Figure 16: Cardiac Histology and Immunohistochemistry: Evidence of cardiac
remodeling and damage.. ..................................................................................... 43
Figure 17: Sarin Induced Autonomic Dysfunction.. ................................................... 44
viii
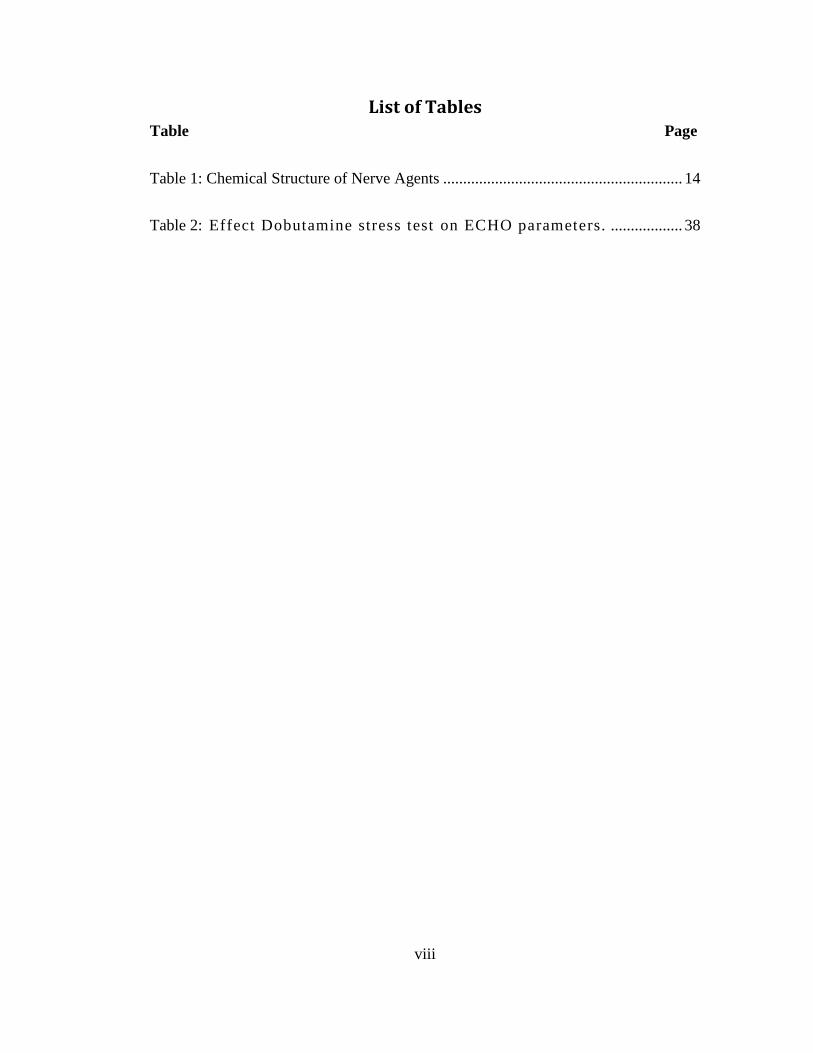
List of Tables Table Page
Table 1: Chemical Structure of Nerve Agents ............................................................ 14
Table 2: Effect Dobutamine stress test on ECHO parameters. .................. 38
ix
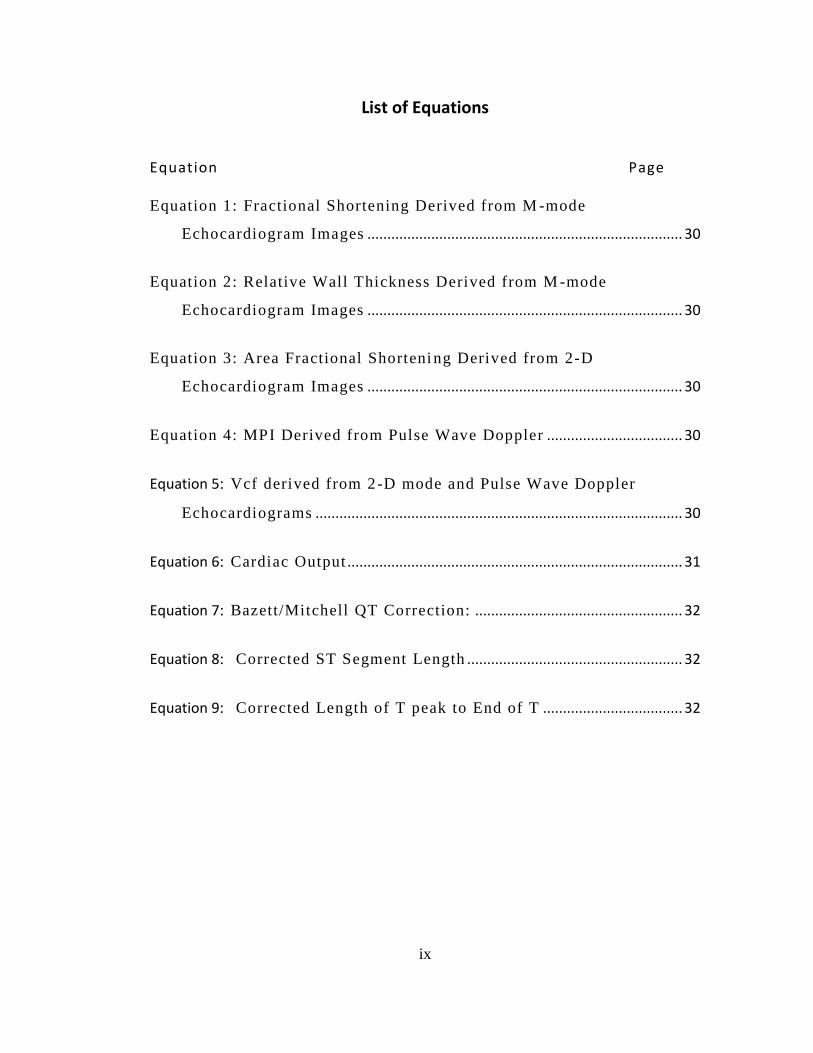
List of Equations Equation Page Equation 1: Fractional Shortening Derived from M -mode
Echocardiogram Images ............................................................................... 30
Equation 2: Relative Wall Thickness Derived from M -mode
Echocardiogram Images ............................................................................... 30
Equation 3: Area Fractional Shorteni ng Derived from 2-D
Echocardiogram Images ............................................................................... 30
Equation 4: MPI Derived from Pulse Wave Doppler .................................. 30
Equation 5: Vcf derived from 2-D mode and Pulse Wave Doppler
Echocardiograms ............................................................................................ 30
Equation 6: Cardiac Output .................................................................................... 31
Equation 7: Bazett/Mitchell QT Correction: .................................................... 32
Equation 8: Corrected ST Segment Length ...................................................... 32
Equation 9: Corrected Length of T peak to End of T ................................... 32
x
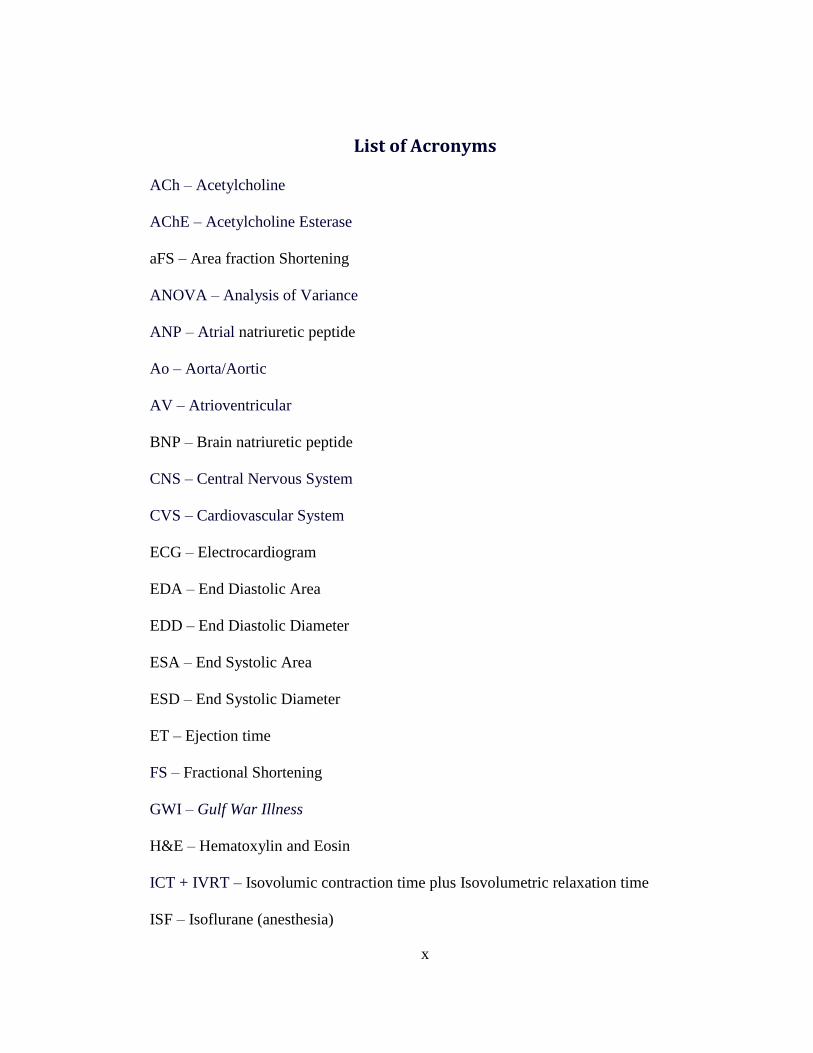
List of Acronyms ACh – Acetylcholine
AChE – Acetylcholine Esterase
aFS – Area fraction Shortening
ANOVA – Analysis of Variance
ANP – Atrial natriuretic peptide
Ao – Aorta/Aortic
AV – Atrioventricular
BNP – Brain natriuretic peptide
CNS – Central Nervous System
CVS – Cardiovascular System
ECG – Electrocardiogram
EDA – End Diastolic Area
EDD – End Diastolic Diameter
ESA – End Systolic Area
ESD – End Systolic Diameter
ET – Ejection time
FS – Fractional Shortening
GWI – Gulf War Illness
H&E – Hematoxylin and Eosin
ICT + IVRT – Isovolumic contraction time plus Isovolumetric relaxation time
ISF – Isoflurane (anesthesia)
xi
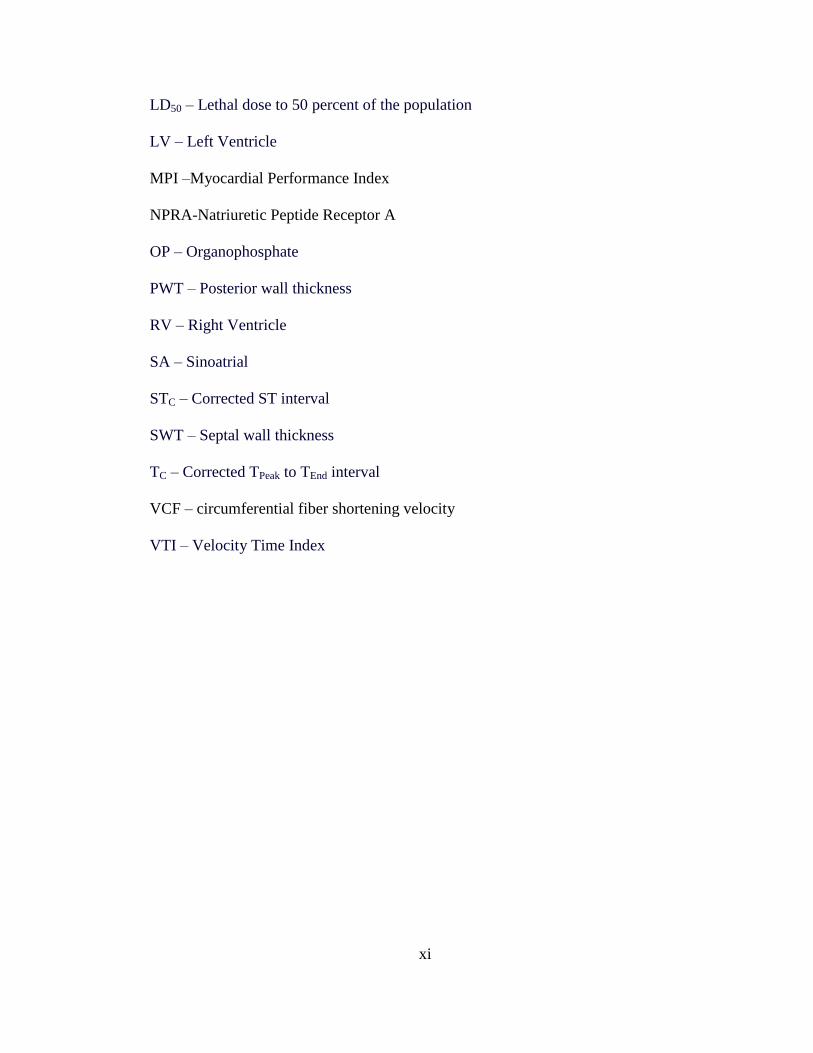
LD50 – Lethal dose to 50 percent of the population
LV – Left Ventricle
MPI –Myocardial Performance Index
NPRA-Natriuretic Peptide Receptor A
OP – Organophosphate
PWT – Posterior wall thickness
RV – Right Ventricle
SA – Sinoatrial
STC – Corrected ST interval
SWT – Septal wall thickness
TC – Corrected TPeak to TEnd interval
VCF – circumferential fiber shortening velocity
VTI – Velocity Time Index
xii
Acknowledgement
I would l ike to express my grat itude to al l th ose who gave me the
opportunity to complete this thesis. I want to thank the Department of
Pharmacology and Toxicology, Wright State University, for al lowing me to do
the necessary research work and to use departmental equipment .
I am deeply indebted to my advisor and chair of the department Dr. Mariana
Morris and to my committee members Dr. Mark Anstadt and Dr. James Lucot
whose help, stimulat ing suggestions and encouragement he lped me in all
the time of research and for writing of this thesis.
My former colleagues from the Pharmacology and Toxicology Department
supported me in my research work. I want to thank them for all their advice,
help, support, interest and valuable hints . Especially I am obl iged to Dr.
Khalid Elased, Dr. David Cool, Mary Key, Teressa Garrett, Terry Oroszi, Dr.
Nathan Weir, Capt. Michael Horenziak, Capt. Joshua Miller, Dr . Brent Izu, Dr.
Danielle Senador, Iara Arajuo, Catherine Winslow, Laurie Schoettinger,
Dhawal Oswal, Ajay Sharma, Drew Nedderman, Jayharsh Panchal, Amod
Joshi, Nita Davis, Dr. Emily Dudley, Dr. Gregory Boivin, Maria Lehto and all
members of the animal resource faci l ity at WSU.
I would l ike to give my special thanks to my friends and my family members.
I would l ike to dedicate this thesis to my father Vijay, mother Vidhya, and
my brother Himanshu Shewale whose support, trust and unconditional love
enabled me to complete this work.
13
I. Introduction
I.1. Sarin: Structure, Function and Mechanism of Action
Sarin is an irreversible acetyl cholinesterase (AChE) inhibitor. It
reacts with the Serine hydroxyl ( -OH) residue in the active site of
Acetylcholinesterase (AChE) enzyme to form a phosphate or phosphonate
ester rendering acetylcholinesterase inactive. Due to sarin induced
inhibit ion of AChE, un-hydrolyzed acetylcholine (ACh) at nerve synapses
and neuromuscular junctions causes cholinergi c overstimulation leading to
variety of symptoms including seizure and death . (McLeod, Jr., 1985; Marrs,
1993)
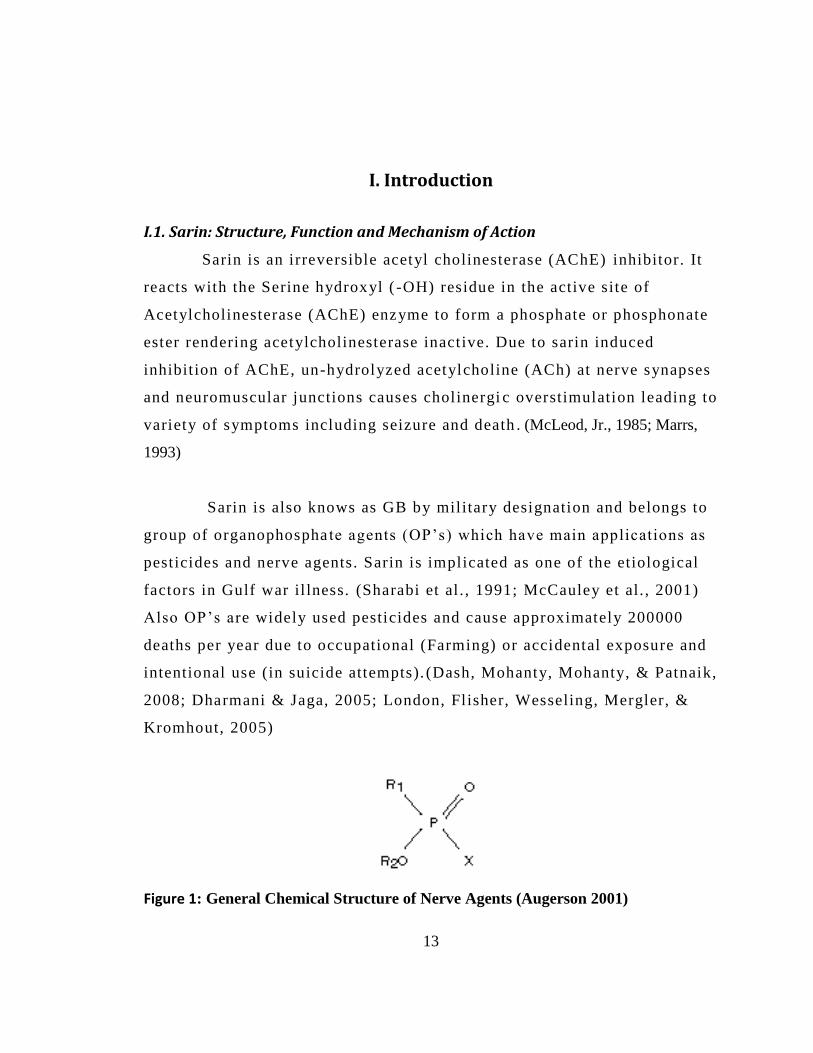
Sarin is also knows as GB by military designation and belongs to
group of organophospha te agents (OP’s) which have main applications as
pesticides and nerve agents. Sarin is implicated as one of the etiological
factors in Gulf war il lness. (Sharabi et al . , 1991; McCauley et al. , 2001)
Also OP’s are widely used pesticides and cause approximately 200000
deaths per year due to occupational (Farming) or accidental exposure and
intentional use (in suicide attempts). (Dash, Mohanty, Mohanty, & Patnaik,
2008; Dharmani & Jaga, 2005; London, Flisher, Wesseling, Mergler, &
Kromhout, 2005)
Figure 1: General Chemical Structure of Nerve Agents (Augerson 2001)
14
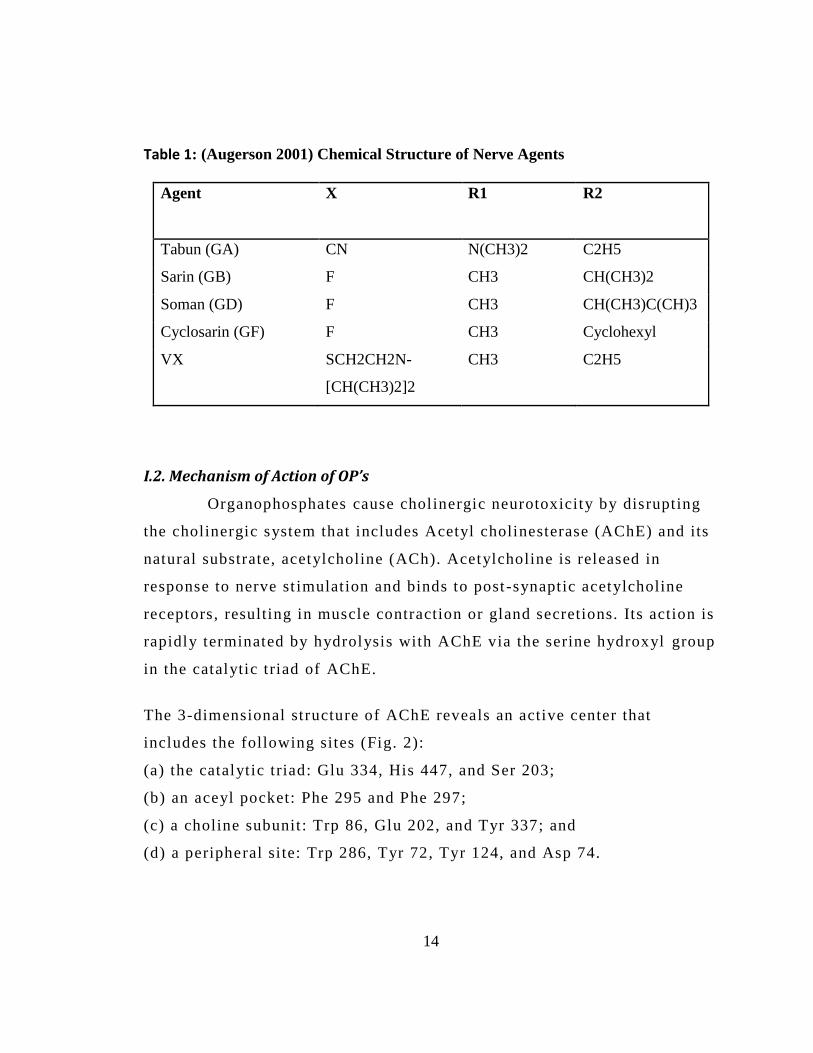
Table 1: (Augerson 2001) Chemical Structure of Nerve Agents
Agent
X R1 R2
Tabun (GA) CN N(CH3)2 C2H5
Sarin (GB) F CH3 CH(CH3)2
Soman (GD) F CH3 CH(CH3)C(CH)3
Cyclosarin (GF) F CH3 Cyclohexyl
VX SCH2CH2N-
[CH(CH3)2]2
CH3
C2H5
I.2. Mechanism of Action of OP’s
Organophosphates cause cholinergic neurotoxicity by disrupting
the cholinergic system that includes Acetyl cholinesterase (AChE) and its
natural substrate, acetylcholine (ACh). Acetylcholine is released in
response to nerve st imulation and binds to post -synaptic acetylcholine
receptors, resulting in muscle contraction or gland secretions. Its action is
rapidly terminated by hydrolysis with AChE via the serine hydroxyl group
in the catalytic triad of AChE.
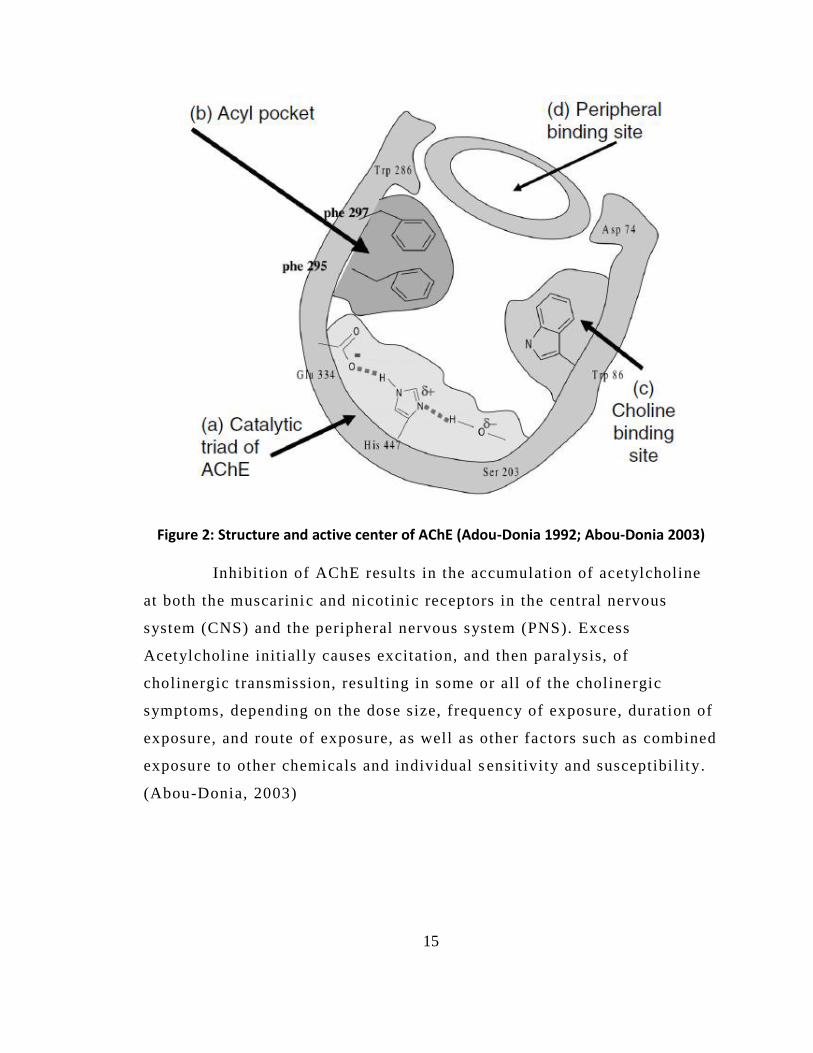
The 3-dimensional structure of AChE reveals an active center that
includes the following sites (Fig. 2):
(a) the catalytic triad: Glu 334, His 447, and Ser 203;
(b) an aceyl pocket: Phe 295 and Phe 297;
(c) a choline subunit: Trp 86, Glu 202, and Tyr 337; and
(d) a peripheral si te: Trp 286, Tyr 72, Tyr 124, and Asp 74.
15
Figure 2: Structure and active center of AChE (Adou-Donia 1992; Abou-Donia 2003) Inhibition of AChE results in the accumulation of acetylcholine
at both the muscarinic and nicotinic receptors in the central nervous
system (CNS) and the peripheral nervous system (PNS). Excess
Acetylcholine initial ly causes excitation, and then paralysis, of
cholinergic transmission, resulting in some or all of the cholinergic
symptoms, depending on the dose size, frequency of exposure, duration of
exposure, and route of exposure, as well as other factors such as combined
exposure to other chemicals and individual s ensitivity and susceptibility.
(Abou-Donia, 2003)
16
II. Background
During the 1980-1988 Iraq-Iran war both Iraq and Iran employed
chemical weapons in an attempt to gain an advantage in a seemingly
unending war (Ali 2001). The Japanese have experienced two separate
terrorist attacks involving sarin. The first occurred, in 1994, and nearly
600 Japanese citizens were exposed to sarin in a neighborhood in
Matsumoto, Japan. In 1995, the Aum Shinrikyo terrorist group deployed
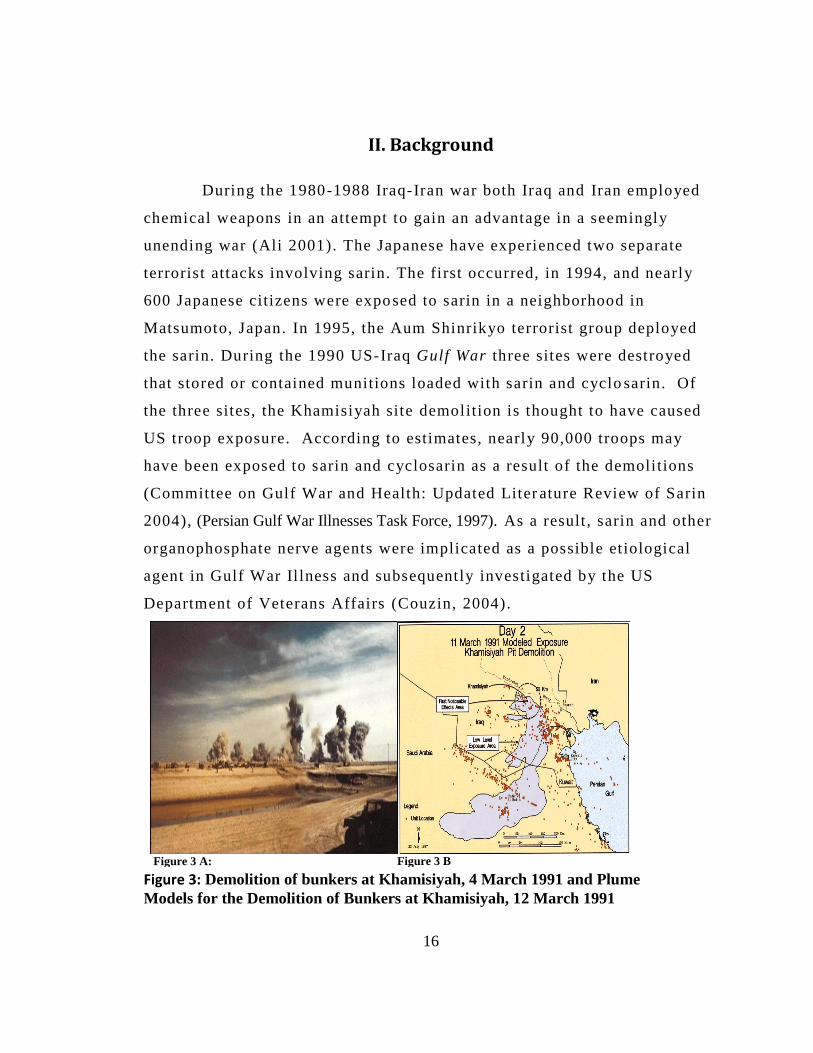
the sarin. During the 1990 US-Iraq Gulf War three sites were destroyed
that stored or contained munitions loaded with sarin and cyclo sarin. Of
the three sites, the Khamisiyah site demolition is thought to have caused
US troop exposure. According to estimates, nearly 90,000 troops may
have been exposed to sarin and cyclosarin as a result of the demolitions
(Committee on Gulf War and Health: Updated Liter ature Review of Sarin
2004), (Persian Gulf War Illnesses Task Force, 1997). As a result , sarin and other
organophosphate nerve agents were implicated as a possible etiological
agent in Gulf War Il lness and subsequently investigated by the US
Department of Veterans Affairs (Couzin, 2004).
Figure 3 A:
Figure 3 B
Figure 3: Demolition of bunkers at Khamisiyah, 4 March 1991 and Plume
Models for the Demolition of Bunkers at Khamisiyah, 12 March 1991
17
III. Health effects of Sarin and current treatment
III.1. Symptoms seen in Gulf war veterans’
Epidemiological studies enlist the Gulf war veterans’ health
outcomes in terms of mortality and hospitalization rates . Population-based
studies have shown that Gulf veterans have an unexpectedly high level of
morbidity (Couzin, 2004; Steele, 2001; Chao, Rothlind, Cardenas,
Meyerhoff, & Weiner, 2010; Haley, 2000; Riddle et al ., 2003) .Kansas
veterans study collected data on prevalence of chronic symptoms
including respiratory, gastrointestinal, neuropsychological, sleep
disturbances, pain and neurologic/cognitive/mood symptoms among 3138
Gulf war and non Gulf war veterans. The results indicate that, 7 years
after serving in the Persian Gulf War, Kansas veterans experienced
substantially more health problems than did era veterans who did not
serve in the war. Increased morbidity was reflected in worse overall
health status, higher rates of medical and psychiatric diagnoses, and more
frequent and severe chronic symptoms (Steele, 2000) .
The Gulf War veterans show variety of poorly defined neurological,
muscular and autonomic symptoms including poorer cognitive function,
tiredness, muscle and joint pain, loss of balance, bladder dysfunction,
diarrhea etc.(Jamal, Hansen, Apartopoulos, & Peden, 1996; Jamal, 1998) .
Study conducted on Gulf war veterans and exposed to low levers of Sarin
and Cyclosarin at Khamisiyah shows reduced visuospatial abil ities and
psychomotor function in dose dependant manner (Proctor, Heaton, Heeren,
& White, 2006). Studies in Gulf war veterans also show altered diurnal
patterns of Heart Rate (HR) and HR variability related to reduced
parasympathetic drive possibly resulting from damage to CNS (Haley et
al. , 2004; Dabisch, To, Kerut, Horsmon, & Mioduszewski, 2007) .
18
Previous study from this laboratory has shown delayed cardiac and
central autonomic effects of l ow dose sarin exposure in mice (Morris,
Key, & Farah, 2007) .Recently, some human data from the Aum Shinrikyo -
Tokyo subway attacks has indicated that sarin could produce neurological
and autonomic changes (Murata et al. , 1997; Yokoyama et al. , 1998) .
Similarly, Haley e t al have shown similar symptoms in veterans exhibiting
GWI (Haley, 1997).
III.2.Cardiovascualr Effects
Cardiovascular effects of OP on heart and blood vessels are complex
effects of accumulated Acetylcholine. It has been shown that symptomatic
dose of Sarin induces bradycardia, tachycardia, and arrhythmias in the
heart that can lead to spontaneous cardiac failure (Taylor, 2001; Marrs,
2007). Studies also show sufficient evidence for cardiotoxicity at delayed
time points in rodent models and case studies of OP exposure survivors.
Studies show evidences of long term QT prolongation, arrhythmias,
various conduction problems, cardiomyopathy, and susceptibil ity to
sudden death (Alaoui, Mossadeq, Faroudy, & Sbihi, 2009; Bar -Meir et al. ,
2007; Gohel, Oza, Panjwani, & Gajjar, 1996; Marosi, Ivan, Vass, Gajdacs,
& Ugocsai, 1989; Kiss & Fazekas, 1983) .
Studies involving sarin in rats report susceptibility to epinephrine
induced arrhythmia and long QT syndrome upto 4 weeks (Allon,
Rabinovitz, Manistersky, Weissman, & Grauer, 2005) . Another study in
rats shows QT prolongation and cardiac lesions for up to 12 weeks
following a higher dose of sarin (Abraham, Oz, Sahar, & Kadar, 2001) .
As with the GWI data, the literature lacks sufficient background to
pinpoint the risk to the cardiovascular system following a
low/asymptomatic dose of nerve agent sarin.
19
III.3. Current therapy for acute nerve agent / OP-poisoning 1) An anticholinergic - like atropine (ATR) as a symptomatic tre atment
it is antagonist of the muscarinic ACh receptors and prevents excessive
cholinergic stimulation. However, it does not act on the nicotinic
receptors.
2) A cholinesterase (ChE) reactivator: Oxime’s such as pralidoxime
(2PAM). Active AChE can be regenerated by the removal of the
phosphoryl group by oxime drugs. However, this is not possible when the
phosphorylated AChE undergoes aging.
3) In addition to the above the therapy may also include an anti -seizure
medication such as diazepam to prevent brain damage following seizure.
20
IV. Problem Statement, Hypothesis and Specific Aims
IV.1. Problem Statement
The current literature lacks sufficient information on low -
asymptomatic dose and late-onset effects of sarin on structure and
function of the heart. Treatment cannot be developed without
characterizing such effects. The literature lacks sufficient information
about whether th is is local , tissue (heart) specific effect of Sarin or
mediated via autonomic nervous system.
IV.2. Hypothesis:
Low dose of organophosphates including nerve agents cause
delayed, long term changes in
1) Cardiovascular structure and function and
2) Autonomic nervous system.
IV.3 Specific Aims
Aim 1- To test the hypothesis that low doses of Sarin causes cardiac
remodeling and reduces cardiac function .
Aim 2 – To test the hypothesis that low doses of Sarin causes autonomic
imbalance analyzed using stress responsiveness of hypothalamic pituitary
adrenal (HPA) axis and adrenal tyrosine hydroxylase (TH) levels.
21
V. Methods
V.1. Animal Protocol
Male C57BL/6J mice were purchased from Harlan Laboratories
(Indianapolis, IN). Body weight (BW) was ~25 gm. Mice were allowed a 1
wk period to acclimate to the facility. They were subjected to at least 3
days of handling before experimental use. Mice were housed individually
at 22°C with a 12:12-hour dark-light cycle and ad libitum access to
standard mouse chow and tap water. All procedures were approved by the
Laboratory Animal Care and Use Committee of Wright State University,
Dayton, OH.
Groups
Experiment 1: Time course of cardiovascular effects of sarin: Mice
were randomly divided into two groups: Sarin (0.4 LD 5 0) and Control
(saline) with n = 12/group.
Experiment 2: Time course of cardiovascular effects of dobu tamine in
sarin treated mice: Mice were randomly divided into two groups: Sarin
(0.4 LD5 0) and Control (saline) with n = 12/ group. Hearts from these 11
wk experimental mice were fixed, sectioned and stained for H&E and
BNP.
V.2. Sarin Exposure
Sarin (obtained from USAMRICD, Aberdeen Proving Ground, MD)
was diluted in 0.9% saline and injected at a dose of 64μg/kg (0.4 LD 5 0).
Sarin was injected subcutaneously in a volume of 0.5 ml/100gm BW on
two consecutive days. The rationale for using two injec tions is to promote
the inhibition of AChE activity. The first injection scavenges
carboxylesterase (CaE) found in high concentrations in rodents as
22
compared to humans. The second injection allows sarin access to AChE,
promoting enzyme inhibition. The 0.4 LD5 0 dose was chosen because it is
widely used and accepted as highest asymptomatic dose which does not
produce symptoms of cholinergic toxicity. Controls were injected with
saline, same volume and regime.
V.3. Cholinesterase Assay
Blood was col lected 24 hrs following the second sarin injection.
Blood was collected by cheek puncture from the facial vein in heparinized
tubes and stored on ice until assay (within one hr). Cholinesterase activity
was measured by a modified version of the assay devel oped by Ellman et
al. (ELLMAN, COURTNEY, Andres, , & FEATHER -STONE, 1961) using
a BIOTEKTM EL808 Micro plate Analyzer. Fresh whole blood was
diluted (1:100) with 0.1 M NaPO4 pH 7.4. Total ChE activity was
measured in whole blood at 25ºC by inhibiting (BuChE) using
tetraisopropylpyrophosphoramide (iso -OMPA). Butyryl ChE was
determined as total ChE minus AChE.
V.4. Transthoracic Echocardiography
Echocardiograms (ECHO) were recorded using a Siemens®
ACUSON Sequoia C512 ultrasound system with an ACUSON 15
megahertz linear array transducer (model 15L8).
To determine left ventricular (LV) structure and function, the
parasternal long axis was used to obtain images via the parasternal apical
window in 2 D B-Mode and 2 D M-Mode. Using 2 D B-Mode
echocardiography, LV End Systolic and End diastolic areas were obtained
where as M Mode was used to calculate LV End Systolic and End
Diastolic Diameters. Stroke volume and cardiac output were obtained
23
using the inbuilt software of the echocardiography machine itself by
feeding the calculated End Systolic and end Dias tolic areas during
analysis in offline mode. The ESD, EDD EDA, and ESA were then also
used to obtain Fractional Shortening and other derived parameters.
Transmitral Doppler flow was traced in parasternal long axis view.
ECHO procedure: Mice were anesthet ized with 2% isoflurane in pure
oxygen (500 ml/min) in an anesthesia chamber. Anesthesia was
maintained using 1.5 % isoflurane delivered by nose cone. Anesthetized
mice were weighed, transferred to a heating pad and placed in a supine
position. Chest hai r was removed using a commercial gel . The transducer
was coated with pre-warmed ul trasound transmission gel (Aqua sonic™
100, Parker Laboratories, Inc). Transthoracic t wo-dimensional guided M-
mode (2D M-mode) and two-dimensional (2D B-mode) images were
obtained via the parasternal apical windows.
Dobutamine Stress Test: Following ECHO and EKG recording at baseline
(2D B Mode, 2 D M Mode, Doppler, EKG), mice were injected with
dobutamine (1 mg/kg, ip). The effect of the dobutamine was visually and
acoustically obvious in the Doppler tracings after 1 -2 min.
Offline ECHO analysis: Analysis was performed by a single observer
using the Siemens ACUSON Sequoia machine’s off -line analysis module.
Another observer, inter -observer, also analyzed a random sampling of the
controls and sarin groups at varying times to verify data quali ty. Inter -
observer results did not vary significantly from the primary observer (<
15 % intraobserver variability). Three values were recorded and averaged
for each parameter from each animal.
24
V.5. Electrocardiography (EKG) Methods
Use of External Telemetry Probes : A two-lead telemetry probe, (Data
Sciences International (DSI) radio telemetry probe model # TA11ETA -F10
(manufactured 15 May 2009) ), was clipped to the shaved ches t area. The
electrodes were clipped using a Schwartz micro-serrefine clip, and the
transmitting end of the probe was placed over a DSI PhysioTel® receiver.
EKG Acquisit ion : Baseline EKG Tracings were recorded for
approximately 3 minutes before injection of dobutamine (1 mg/kg IP).
EKG tracings were recorded for an additional 7 minutes after dobutamine.
This was done to ensure that EKG recordings were captured after the
dobutamine was effective.
EKG Analysis: EKG tracings were analyzed using DSI’s Ponemah™
software (version 4.90). The software was set to record all available
derived parameters under the channel input tab. 30 sec of the EKG
tracings from before the dobutamine injection and 30 sec after the
dobutamine injection were analyzed for each mouse.
V.6. Body Weights
Body weights were collected 24 hours, four weeks, seven weeks, and
10 weeks following the sarin injections.
V.7. Urine Collection
Spot Urine samples were collected (~ 30 – 100 ul) using pipette by
gently massaging the abdomen and stored on dry ice during collection and
later in -80 freezer until analyzed. All urine samples were coll ected
between 1600 to 2000 Hrs. Urine was collected at Baseline (Before
Injection), 3 week, 6 week and at 9t h
week following sarin injection.
25
V.8. Cage Change Induced Stress Experiment
Mice were subjected to cage change induced stress and urine was
collected at Baseline (before cage change), 30 min and 45 min from cage
change. The object ive was to measure corticosterone (fight or flight
glucocorticoids released from adrenal gland under stress) release in
response to stress .
V.9. ANP and BNP Staining and Quantification
Tissue collection and processing : Mice were decapitated 12 wks after
sarin injection. Hearts were perfused with cold PBS, weighed and fixed in
4% paraformaldehyde (PFA) followed by 4% PFA/20% sucrose at 4°C.
After 2 days of fixation, the tissues were stored at −80°C until sectioning.
Hearts were sectioned (5 µm) using cryostat and 3 sections were placed on
each slide.
BNP Immunohistochemistry:
Slides were de-paraffinized by rinsing in increasing concentrations of
ethanol (60 -100%). The sections were then washed in a (0.1 M)
phosphate buffered saline (PBS) solution, subjected to 0.15% hydrogen
peroxide (catalogue number 216763, Sigma Aldrich) for 15 minutes, and
rewashed. Sections were then blocked (with a normal goat serum (NSG)
blocking solution) (catalogue number G9023, Sigma Aldrich) for one
hour. After blocking, the sections were rewashed and st ained with the
primary antibody 1/500 for BNP. The primary antibody was rabbit/anti -
rat; obtained from Bachem AG (Torrance, CA). The sections were allowed
to incubate overnight prior to addition of secondary antibody. The
secondary antibody was goat/anti -rabbit (1:400). After a one hour
incubation the sections were stained with an Elite® Vectastain™ ABC
26
stain kit (rabbit Immoglobulin (IgG), catalogue number EK6101,
VECTOR LABORATORIES, INC., Burlingame, CA) in conjunction with
3-3’-Diaminobenzidine tetrahydrochloride (DAB) tablets ( catalogue
number D3939, Sigma Aldrich) . Finally, the slides were dehydrated,
cleaned (with ethanol and xylene, respectively) and coversliped using
paramount.
A single observer used Molecular Devices®’ software package
Metamorph® (version 7.6) to perform the analysis of the images.
V.10. H&E Staining
Paraffin was removed from the slides containing 5 micron thick
sections of the fixed heart tissue. The sections were washed, then
submerged in a Gill II hematoxylin solution fo r 30 seconds, and rinsed
with water for 5 to 10 minutes. Ensuing hematoxylin, the sections were
dehydrated (with xylene) and cover slipped with permount .
V.11. Cell Size Quantification
Pictures were taken at 20X magnification of the heart section s using
the Leica Microsystems® DMR microscope .The light intensity,
microscope settings, and camera settings were setup as previously
described and a single observer collected same day images using the same
lighting and settings.
27
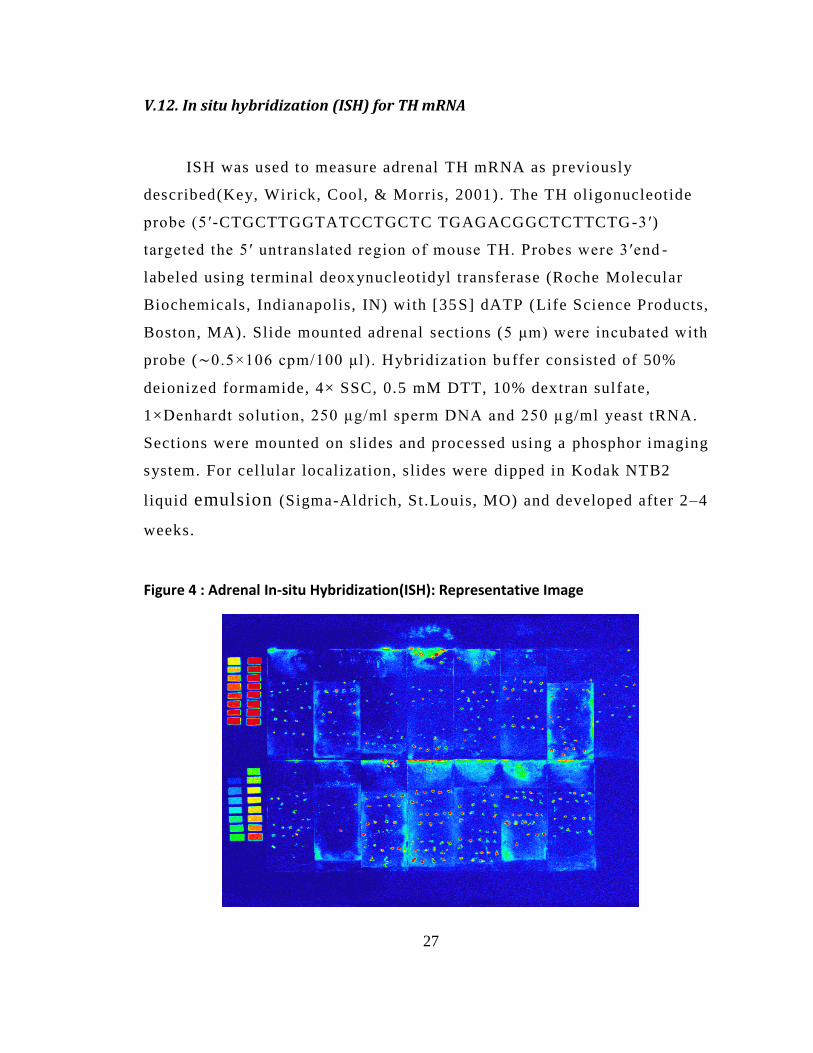
V.12. In situ hybridization (ISH) for TH mRNA
ISH was used to measure adrenal TH mRNA as previously
described(Key, Wirick, Cool, & Morris, 2001) . The TH oligonucleotide
probe (5′-CTGCTTGGTATCCTGCTC TGAGACGGCTCTTCTG-3′)
targeted the 5′ untranslated region of mouse TH. Probes were 3′end -
labeled using terminal deox ynucleotidyl transferase (Roche Molecular
Biochemicals, Indianapolis, IN) with [35S] dATP (Life Science Products,
Boston, MA). Slide mounted adrenal sections (5 μm) were incubated with
probe (∼0.5×10⁶ cpm/100 μl). Hybridization bu ffer consisted of 50%
deionized formamide, 4× SSC, 0.5 mM DTT, 10% dextran sulfate,
1×Denhardt solution, 250 μg/ml sperm DNA and 250 μ g/ml yeast tRNA.
Sections were mounted on slides and processed using a phosphor imaging
system. For cel lular localization, slides were dipped in Kodak NTB2
liquid emulsion (Sigma-Aldrich, St .Louis, MO) and developed after 2–4
weeks.
Figure 4 : Adrenal In-situ Hybridization(ISH): Representative Image
28
V.13. Spot Urine Collection and Cage Change Stress Experiment:
Spot Urine samples were collected by gentl y massaging the
abdomen. Time of urine collection varied from 1600 -2000 hrs as highest
concentration of corticosterone (correlated to circadian rhythm) was found
in this time. Samples were collected at baseline, 3rd and 6t h
week. In 7t h
week cage change st ress was induced to determine stress responsiveness
at 20 and 45 minutes from the cage change. Spot urine samples were
collected before cage change and 20 and 45 minutes from cage change.
Usual volume of urine collected varied from 70 -200 ul.0.5 M HCL was
added in 1 / 10 proportion to urine and stored at -80 degree Celsius unti l
used.
V.14. Corticosterone assay: Radioimmunoassay (RIA):
Corticosterone was determined with slight modifications in
Corticosterone DA I 125 Radio Immuno Assay kit (MP Biomedical, LLC
Diagnostic division Orangeburg, NY, USA). Diluted urine (1: 20 with dd
H20) samples / calibrators were mixed with Steroid diluent to which
(radioactive labeled) Corticosterone I 121 was added followed by
antiserum (anti corticosterone) and incubated for 2 hrs. Precipitating
reagent was added and Samples were centrifuged at 2500 RPM for 15 min
to separate bound I 121 corticosterone from unbound. Radioactivity was
measured by gamma counter (Micromedic 4/200 plus). Corticosterone
levels for samples were obtained from the standard curve of the known
concentrations of Cort . and expressed in ng/ml.
29
Adrenal Corticosterone: Adrenal glands were homogenized in 0.2
N perchloric acid using Precellys 24 lysis and homogenization instrument
from Bertin technologies. Samples were homogenized at 3500 rpm x 30
seconds. Adrenal homogenate was diluted 1:200 in steroid diluent and
analyzed using RIA.
V.15. Protein Assay:
Adrenal homogenate (5ul was diluted to 795 ul dd H2O) and
urinary protein content was determined using colorimetric Bio -rad protein
assay where protein concentration is obtained from standard curve
obtained by using known concentration of BS A.
V.16. Creatinine assay: EIA
Urinary corticosterone was cor rected by creatinine concentration in
given sample of urine. An Enzyme Immuno assay (EIA) kit (Quidel
Corporation (Microvue Creatinine Assay Kit) San Diego, USA ) was used
and quantity of creatinine was detected calorimetrically at 490 nm. Assay
is based on modified Jaffe method where creatinine forms color solution
with alkaline picrate.
V.17. Statistical Analysis
Statistical analysis of the mice was performed using
STATISTICA software version 7. In general , Two -way Repeated Measures
Analysis of Variance (ANOVA) with Bonferoni post-hoc test was used to
compare the Controls to the 0.4 LD 5 0 at different t ime points or at
baseline and under drug treatment. Finally, when only two groups were
analyzed a Student’s t -test was used.
30
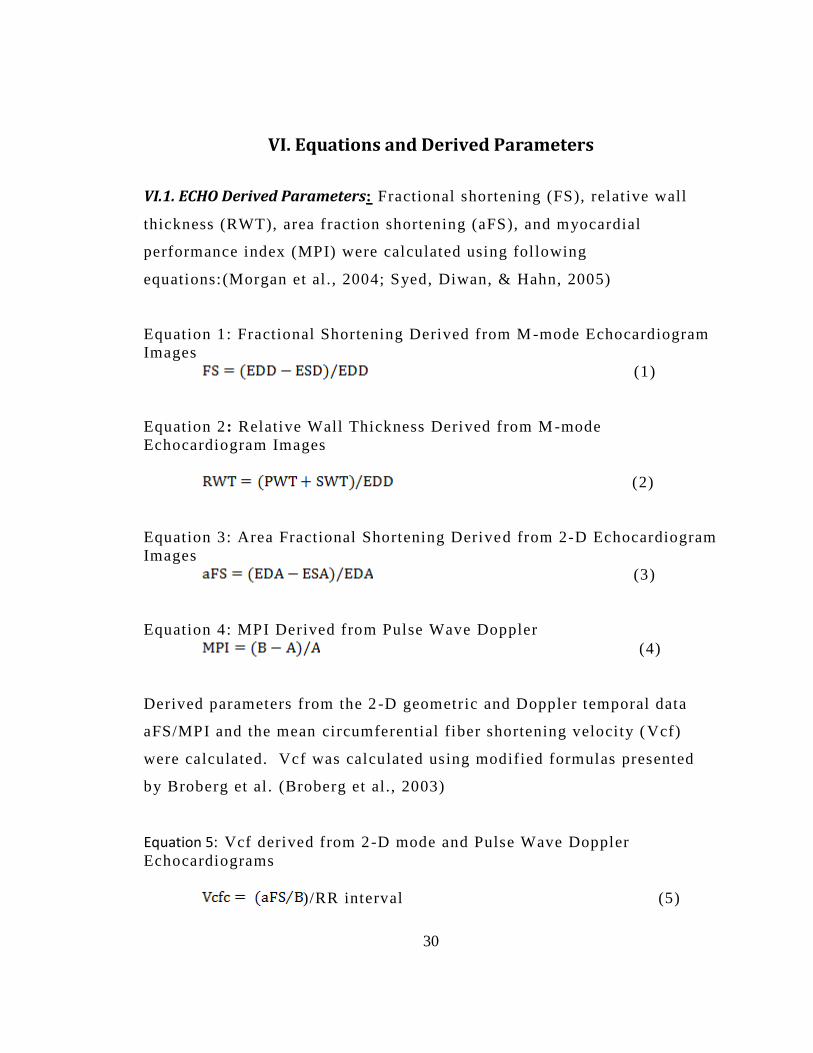
VI. Equations and Derived Parameters
VI.1. ECHO Derived Parameters: Fractional shortening (FS), relative wall
thickness (RWT), area fraction shortening (aFS), and myocardial
performance index (MPI) were calculated using following
equations: (Morgan et al ., 2004; Syed, Diwan, & Hahn, 2005)
Equation 1: Fractional Shortening Derived from M -mode Echocardiogram
Images
(1)
Equation 2: Relative Wall Thickness Derived from M -mode
Echocardiogram Images
(2)
Equation 3: Area Fractional Shortening Derived from 2-D Echocardiogram
Images
(3)
Equation 4: MPI Derived from Pulse Wave Doppler
(4)
Derived parameters from the 2 -D geometric and Doppler temporal data
aFS/MPI and the mean circumferential fiber shortening velocity ( Vcf)
were calculated. Vcf was calculated using modified formulas presented
by Broberg et al . (Broberg et al., 2003)
Equation 5: Vcf derived from 2-D mode and Pulse Wave Doppler
Echocardiograms
)/RR interval (5)
31
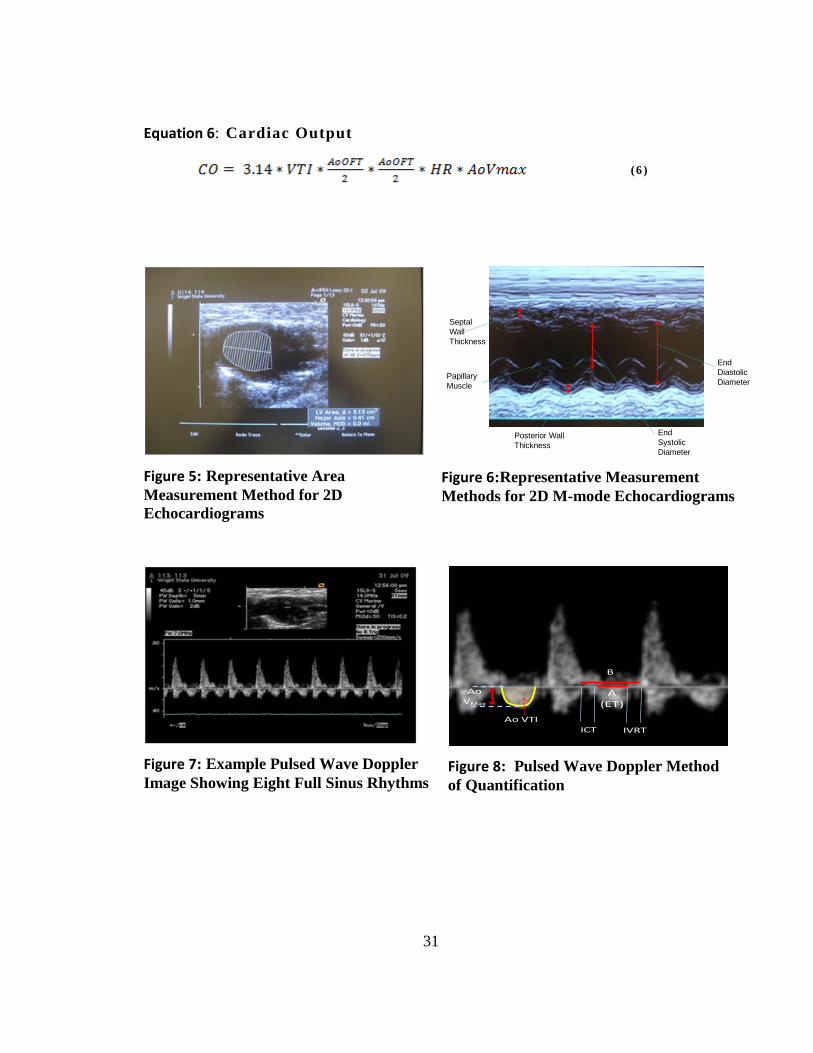
Equation 6: Cardiac Output
(6 )
Figure 5: Representative Area
Measurement Method for 2D
Echocardiograms
Septal
Wall
Thickness
Posterior Wall
Thickness
Papillary
Muscle
End
Systolic
Diameter
End
Diastolic
Diameter
Figure 6:Representative Measurement
Methods for 2D M-mode Echocardiograms
Figure 7: Example Pulsed Wave Doppler
Image Showing Eight Full Sinus Rhythms
A (ET)
IVRTICT
B
Ao VTI
AoVMax
Figure 8: Pulsed Wave Doppler Method
of Quantification
32
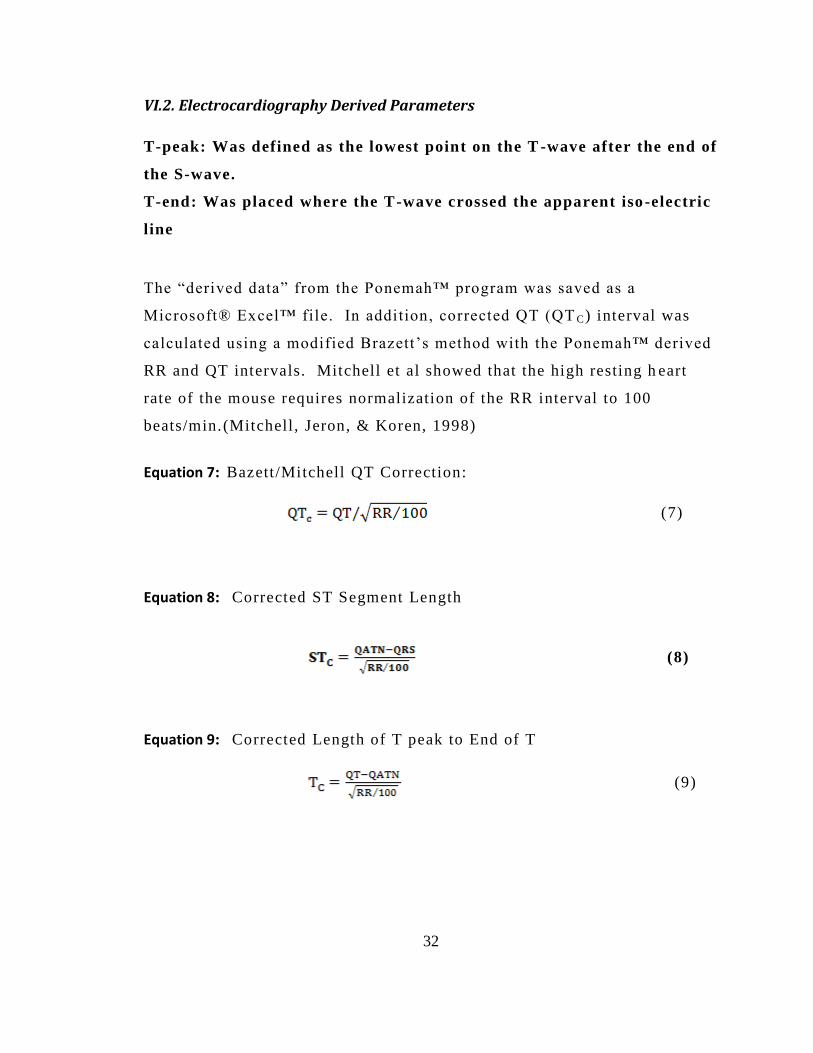
VI.2. Electrocardiography Derived Parameters
T-peak: Was defined as the lowest point on the T -wave after the end of
the S-wave.
T-end: Was placed where the T-wave crossed the apparent iso -electric
line
The “derived data” from the Ponemah™ program was saved as a
Microsoft® Excel™ file. In addition, corrected QT (QT C) interval was
calculated using a modified Brazett’s method with the Ponemah™ derived
RR and QT intervals. Mitchell et al showed that the high resting h eart
rate of the mouse requires normalization of the RR interval to 100
beats/min.(Mitchell , Jeron, & Koren, 1998)
Equation 7: Bazett/Mitchell QT Correction:
(7)
Equation 8: Corrected ST Segment Length
(8)
Equation 9: Corrected Length of T peak to End of T
(9)
33
Figure 9: Representative EKG:
P-wave startP-wave end
Q-wave peak
R-wave peak
S-wave peak
S-wave end
T-wave peak
T-wave end
Figure 9: Representative EKG Trace with Software Markings
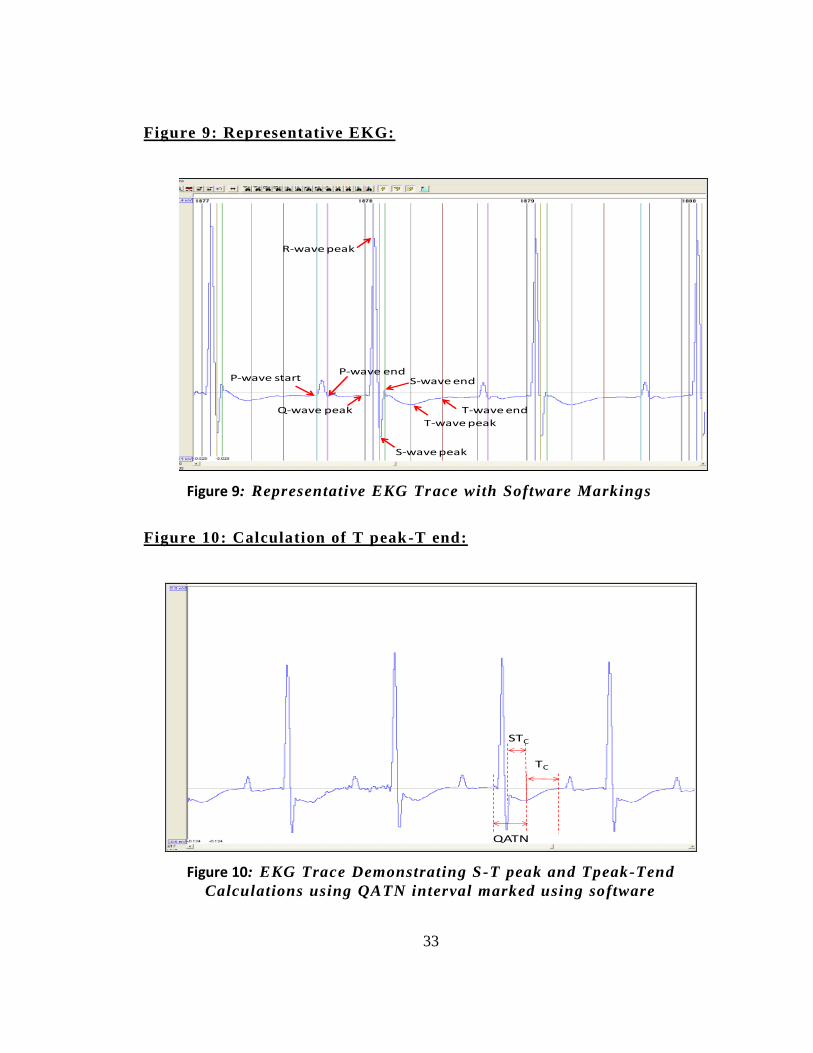
Figure 10: Calculation of T peak-T end:
QATN
TC
STC
Figure 10: EKG Trace Demonstrating S-T peak and Tpeak-Tend
Calculations using QATN interval marked using software
34
VII. Figures and Results Note: All values are expressed as Mean ± Standard Error
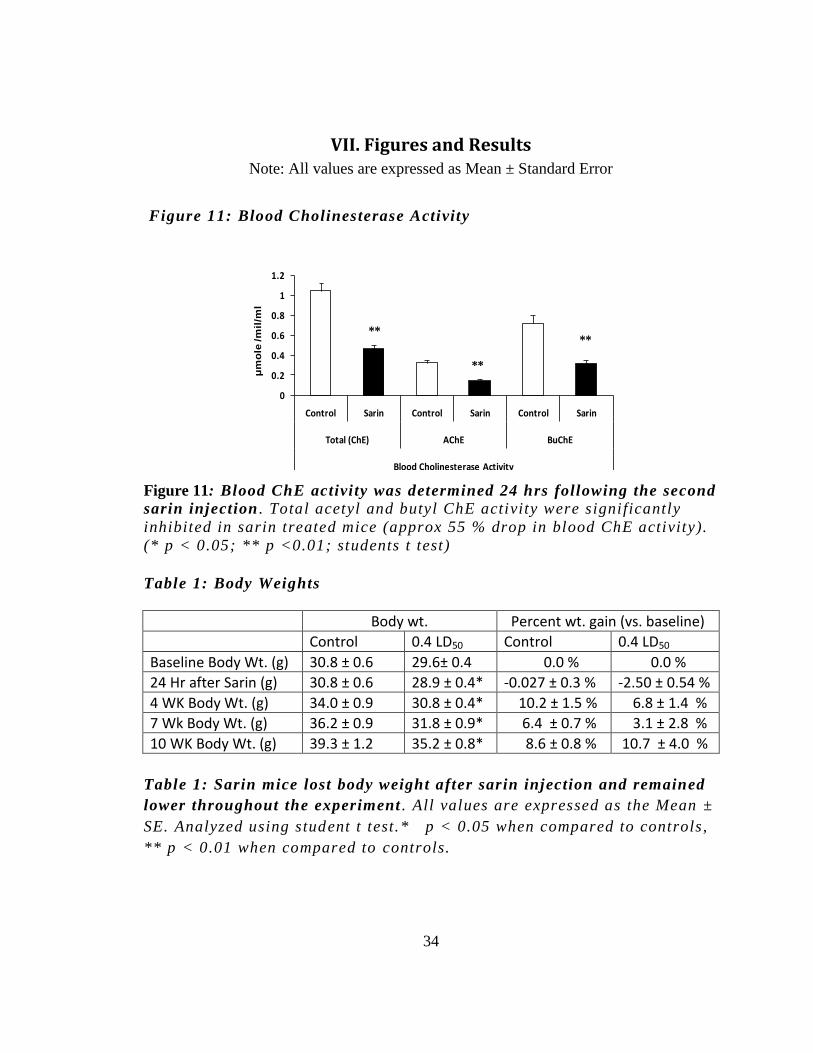
Figure 11: Blood Cholinesterase Activity
0
0.2
0.4
0.6
0.8
1
1.2
Control Sarin Control Sarin Control Sarin
Total (ChE) AChE BuChE
Blood Cholinesterase Activity
**
**
**
μm
ole
/m
il/m
l
Figure 11: Blood ChE activity was determined 24 hrs following the second
sarin injection . Total acetyl and butyl ChE activity were significantly
inhibited in sarin treated mice (approx 55 % drop in blood ChE activity).
(* p < 0.05; ** p <0.01; students t test)
Table 1: Body Weights
Body wt. Percent wt. gain (vs. baseline)
Control 0.4 LD50 Control 0.4 LD50
Baseline Body Wt. (g) 30.8 ± 0.6 29.6± 0.4 0.0 % 0.0 %
24 Hr after Sarin (g) 30.8 ± 0.6 28.9 ± 0.4* -0.027 ± 0.3 % -2.50 ± 0.54 %
4 WK Body Wt. (g) 34.0 ± 0.9 30.8 ± 0.4* 10.2 ± 1.5 % 6.8 ± 1.4 %
7 Wk Body Wt. (g) 36.2 ± 0.9 31.8 ± 0.9* 6.4 ± 0.7 % 3.1 ± 2.8 %
10 WK Body Wt. (g) 39.3 ± 1.2 35.2 ± 0.8* 8.6 ± 0.8 % 10.7 ± 4.0 %
Table 1: Sarin mice lost body weight after sarin injection and remained
lower throughout the experiment . All values are expressed as the Mean ±
SE. Analyzed using student t test.* p < 0.05 when compared to controls,
** p < 0.01 when compared to controls.
35
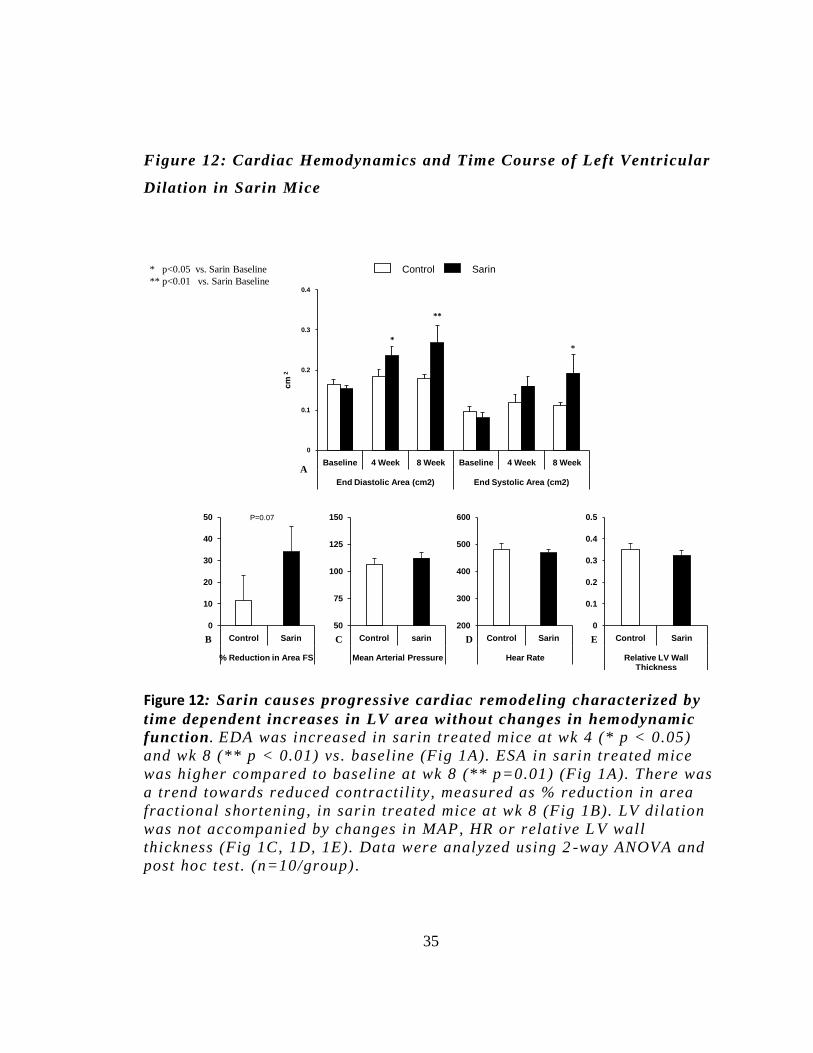
Figure 12: Cardiac Hemodynamics and Time Course of Left Ventricular
Dilation in Sarin Mice
0
0.1
0.2
0.3
0.4
Baseline 4 Week 8 Week Baseline 4 Week 8 Week
End Diastolic Area (cm2) End Systolic Area (cm2)
cm
2
*
**
A
*
SarinControl
B
0
10
20
30
40
50
Control Sarin
% Reduction in Area FS
50
75
100
125
150
Control sarin
Mean Arterial Pressure
200
300
400
500
600
Control Sarin
Hear Rate
0
0.1
0.2
0.3
0.4
0.5
Control Sarin
Relative LV Wall Thickness
P=0.07
C D E
* p<0.05 vs. Sarin Baseline
** p<0.01 vs. Sarin Baseline
Figure 12: Sarin causes progressive cardiac remodeling characterized by
time dependent increases in LV area without changes in hemodynamic
function . EDA was increased in sarin treated mice at wk 4 (* p < 0.05)
and wk 8 (** p < 0.01) vs. baseline (Fig 1A). ESA in sarin treated mice
was higher compared to baseline at wk 8 (** p=0.01) (Fig 1A). There was
a trend towards reduced contractili ty, measured as % reduction in area
fractional shortening, in sarin treated mice at wk 8 (Fig 1B). LV dilation
was not accompanied by changes in MAP, HR or relative L V wall
thickness (Fig 1C, 1D, 1E). Data were analyzed using 2 -way ANOVA and
post hoc test . (n=10/group) .
36
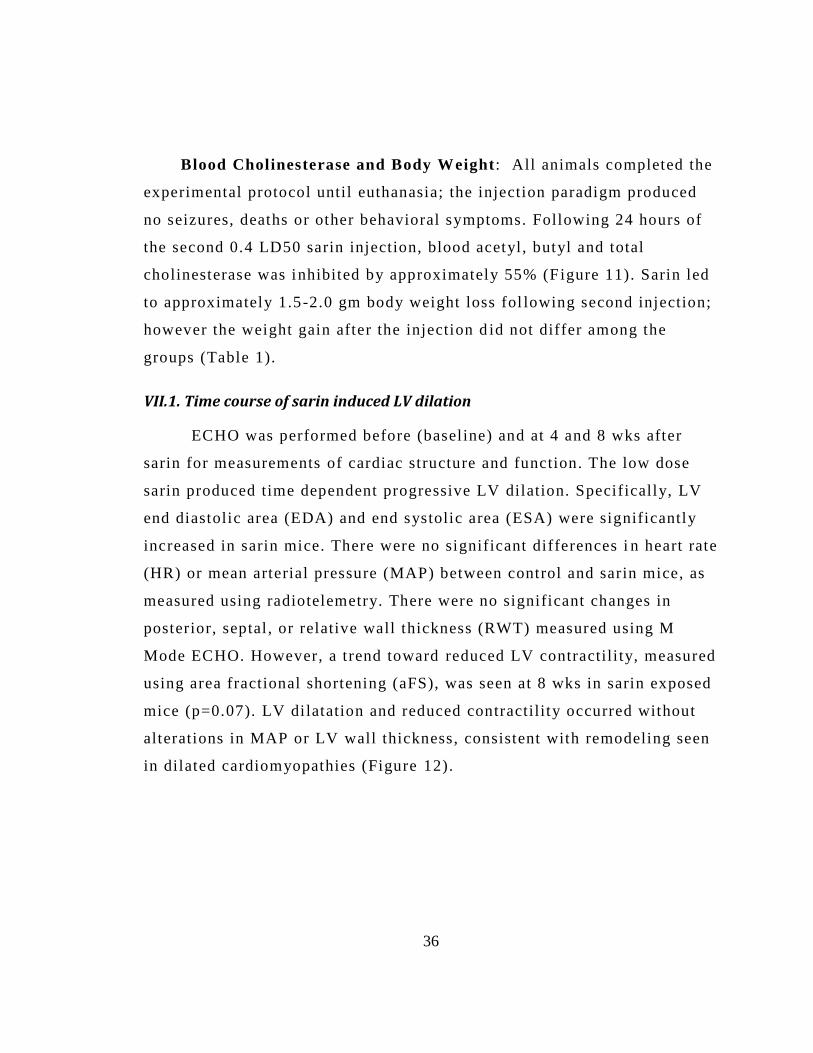
Blood Cholinesterase and Body Weight: All animals completed the
experimental protocol until euthanasia; the injection paradigm produced
no seizures, deaths or other behavioral symptoms. Following 24 hours of
the second 0.4 LD50 sarin injection, blood acetyl , butyl and total
cholinesterase was inhibited by approximately 55% (Figure 11). Sarin led
to approximately 1.5-2.0 gm body weight loss fol lowing second injection;
however the weight gain after the injection d id not differ among the
groups (Table 1).
VII.1. Time course of sarin induced LV dilation
ECHO was performed before (baseline) and at 4 and 8 wks after
sarin for measurements of cardiac structure and function. The low dose
sarin produced time dependent progressive LV dilation. Specifically, LV
end diastolic area (EDA) and end systolic area (ESA) were significantly
increased in sarin mice. There were no significant differences i n heart rate
(HR) or mean arterial pressure (MAP) between control and sarin mice, as
measured using radiotelemetry. There were no significant changes in
posterior, septal , or relative wall thickness (RWT) measured using M
Mode ECHO. However, a trend toward reduced LV contractili ty, measured
using area fractional shortening (aFS), was seen at 8 wks in sarin exposed
mice (p=0.07). LV dilatation and reduced contractility occurred without
alterations in MAP or LV wall thickness, consistent with remodeling seen
in dilated cardiomyopathies (Figure 12).
37
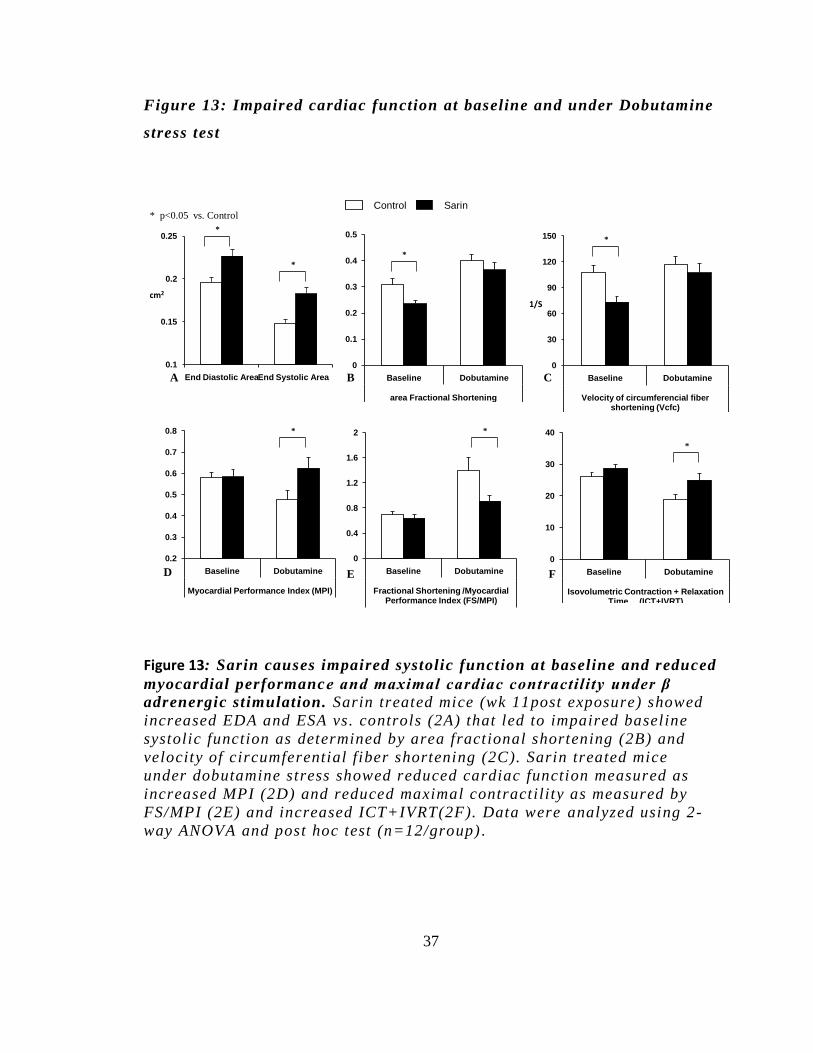
Figure 13: Impaired cardiac function at baseline and under Dobutamine
stress test
0.1
0.15
0.2
0.25
End Diastolic AreaEnd Systolic Area
cm2
*
0
0.1
0.2
0.3
0.4
0.5
Baseline Dobutamine
area Fractional Shortening
0
30
60
90
120
150
Baseline Dobutamine
Velocity of circumferencial fiber shortening (Vcfc)
1/S
0.2
0.3
0.4
0.5
0.6
0.7
0.8
Baseline Dobutamine
Myocardial Performance Index (MPI)
0
0.4
0.8
1.2
1.6
2
Baseline Dobutamine
Fractional Shortening /Myocardial Performance Index (FS/MPI)
*
*
*
* *
A B C
D E F
*
* p<0.05 vs. ControlSarinControl
0
10
20
30
40
Baseline Dobutamine
Isovolumetric Contraction + Relaxation Time (ICT+IVRT)
*
Figure 13: Sarin causes impaired systolic function at baseline and reduced
myocardial performance and maximal cardiac contractility under β
adrenergic st imulation. Sarin treated mice (wk 11post exposure) showed
increased EDA and ESA vs. controls (2A) that led to impaired baseline
systolic function as determined by area fractional shortening (2B) and
velocity of circumferential fiber shortening (2C). Sarin treated mice
under dobutamine stress showed reduced cardiac function measured as
increased MPI (2D) and reduced maximal contractility as measured by
FS/MPI (2E) and increased ICT+IVRT(2F). Data were analyzed using 2-
way ANOVA and post hoc test (n=12/group) .
38
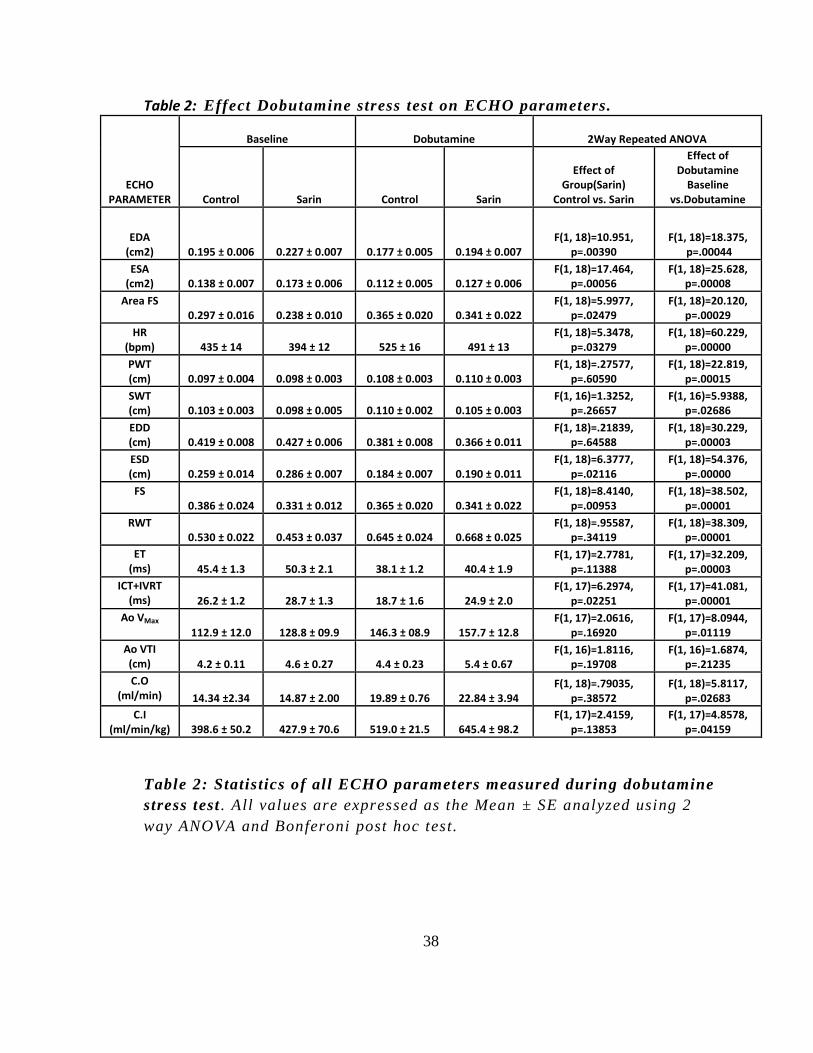
Table 2: Effect Dobutamine stress test on ECHO parameters.
ECHO PARAMETER
Baseline Dobutamine 2Way Repeated ANOVA
Control Sarin Control Sarin
Effect of Group(Sarin)
Control vs. Sarin
Effect of Dobutamine
Baseline vs.Dobutamine
EDA (cm2) 0.195 ± 0.006 0.227 ± 0.007 0.177 ± 0.005 0.194 ± 0.007
F(1, 18)=10.951, p=.00390
F(1, 18)=18.375, p=.00044
ESA (cm2) 0.138 ± 0.007 0.173 ± 0.006 0.112 ± 0.005 0.127 ± 0.006
F(1, 18)=17.464, p=.00056
F(1, 18)=25.628, p=.00008
Area FS 0.297 ± 0.016 0.238 ± 0.010 0.365 ± 0.020 0.341 ± 0.022
F(1, 18)=5.9977, p=.02479
F(1, 18)=20.120, p=.00029
HR (bpm) 435 ± 14 394 ± 12 525 ± 16 491 ± 13
F(1, 18)=5.3478, p=.03279
F(1, 18)=60.229, p=.00000
PWT (cm) 0.097 ± 0.004 0.098 ± 0.003 0.108 ± 0.003 0.110 ± 0.003
F(1, 18)=.27577, p=.60590
F(1, 18)=22.819, p=.00015
SWT (cm) 0.103 ± 0.003 0.098 ± 0.005 0.110 ± 0.002 0.105 ± 0.003
F(1, 16)=1.3252, p=.26657
F(1, 16)=5.9388, p=.02686
EDD (cm) 0.419 ± 0.008 0.427 ± 0.006 0.381 ± 0.008 0.366 ± 0.011
F(1, 18)=.21839, p=.64588
F(1, 18)=30.229, p=.00003
ESD (cm) 0.259 ± 0.014 0.286 ± 0.007 0.184 ± 0.007 0.190 ± 0.011
F(1, 18)=6.3777, p=.02116
F(1, 18)=54.376, p=.00000
FS 0.386 ± 0.024 0.331 ± 0.012 0.365 ± 0.020 0.341 ± 0.022
F(1, 18)=8.4140, p=.00953
F(1, 18)=38.502, p=.00001
RWT 0.530 ± 0.022 0.453 ± 0.037 0.645 ± 0.024 0.668 ± 0.025
F(1, 18)=.95587, p=.34119
F(1, 18)=38.309, p=.00001
ET (ms) 45.4 ± 1.3 50.3 ± 2.1 38.1 ± 1.2 40.4 ± 1.9
F(1, 17)=2.7781, p=.11388
F(1, 17)=32.209, p=.00003
ICT+IVRT (ms) 26.2 ± 1.2 28.7 ± 1.3 18.7 ± 1.6 24.9 ± 2.0
F(1, 17)=6.2974, p=.02251
F(1, 17)=41.081, p=.00001
Ao VMax
112.9 ± 12.0 128.8 ± 09.9 146.3 ± 08.9 157.7 ± 12.8 F(1, 17)=2.0616,
p=.16920 F(1, 17)=8.0944,
p=.01119
Ao VTI (cm) 4.2 ± 0.11 4.6 ± 0.27 4.4 ± 0.23 5.4 ± 0.67
F(1, 16)=1.8116, p=.19708
F(1, 16)=1.6874, p=.21235
C.O (ml/min) 14.34 ±2.34 14.87 ± 2.00 19.89 ± 0.76 22.84 ± 3.94
F(1, 18)=.79035, p=.38572
F(1, 18)=5.8117, p=.02683
C.I (ml/min/kg) 398.6 ± 50.2 427.9 ± 70.6 519.0 ± 21.5 645.4 ± 98.2
F(1, 17)=2.4159, p=.13853
F(1, 17)=4.8578, p=.04159
Table 2: Statistics of all ECHO parameters measured during dobutamine
stress test . All values are expressed as the Mean ± SE analyzed using 2
way ANOVA and Bonferoni post hoc test.
39
VII.2. Dobutamine stress test: Impaired stress response in sarin mice
At wk 11 post sarin, there was significant LV dilation as seen by
the increase in EDA and ESA and impaired LV systolic f unction
determined via aFS (Figure 13A, 13B). The velocity of circumferential
fiber shortening (Vcfc) was also reduced in sarin treated mice (Figure
13C). With dobutamine stimulation, aFS and Vcfc were comparable in
both groups, indicating that given dose of dobutamine had produced a
maximal contracti le effect.
Myocardial performance index (MPI) was obtained from Doppler for
mitral flow and calculated using Tei’s index (Tei et al. , 1995) . MPI was
significantly increased under β adrenergic st imulation in sarin treated
mice (Figure 13D). Maximal cardiac contracti lity (+dP/dt max)
characterized indirectly using FS/MPI (Broberg et al., 2003) was lower in
sarin mice, indicating an impaired cardiac stress response (Figure 13E).
Additionally, isovolumetric contraction and relaxation time (ICT + IVRT)
obtained from Doppler ECHO was significantly lengthened during
dobutamine testing in the sarin mice.
There were no significant alterations in posterior, septal or relative wall
thickness. Hemodynamic measures of pump function including stroke
volume and cardiac output did not differ significantly among groups
(Table 2), indicating maintenance of corporal perfusion despite LV
dilat ion and systolic dysfunction.
40
Figure 14: EKG
Typical
S End in a
MouseSTC
TC
No ST
Depression
STC
TC
Slightly
Depressed
ST
TC
STC
TC
STC
Severe ST
Depression
Control –Baseline Sarin –Baseline
Control- Dobutamine Sarin -Dobutamine
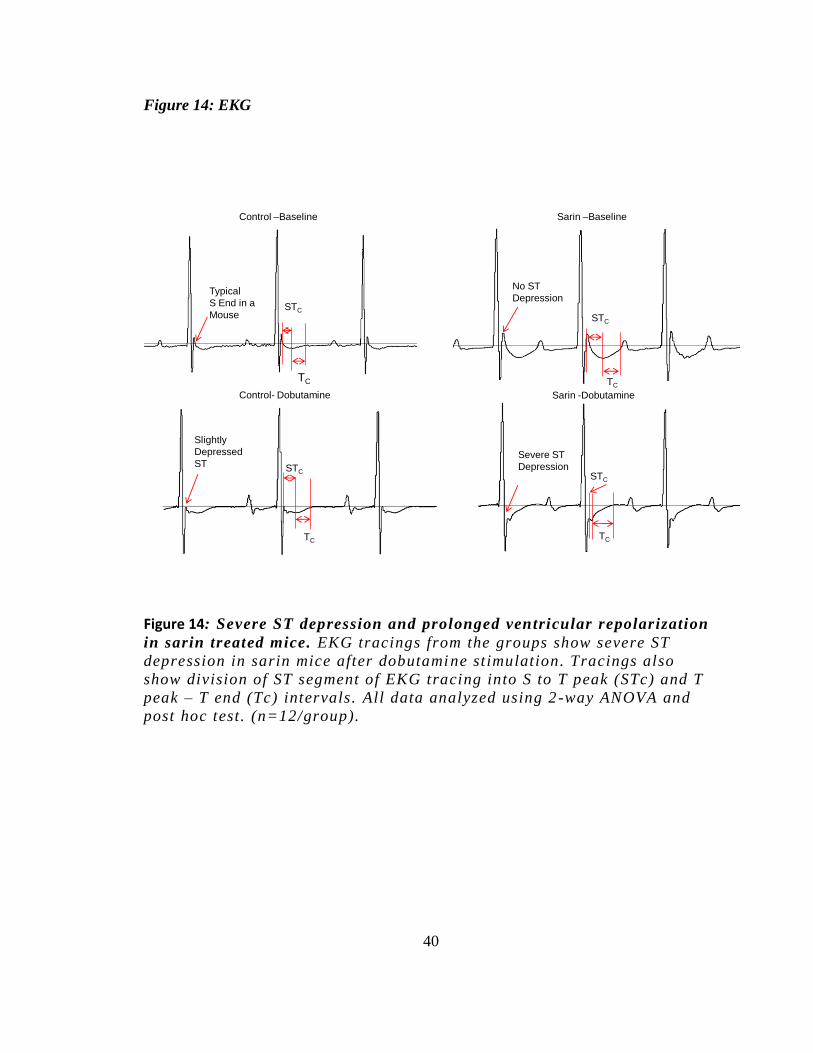
Figure 14: Severe ST depression and prolonged ventricular repolarization
in sarin treated mice. EKG tracings from the groups show severe ST
depression in sarin mice after dobutamine st imulation. Tracings also
show division of ST segment of EKG tracing into S to T peak (STc) and T
peak – T end (Tc) intervals. All data analyzed using 2 -way ANOVA and
post hoc test . (n=12/group).
41
Figure 15: Effect of Dobutamine stress test on EK G parameters
0
10
20
30
40
50
Baseline Dobutamine
T Peak - T End (Tc)
Mil
liseco
nd
s *
*
SarinControl ECG
Parameter
Baseline Dobutamine
Control Sarin Control Sarin
RR Interval
(ms) 152.8 ± 4.3 153.4 ± 4.8 112.7 ± 9.5 115.5 ± 2.6
Heart Rate
(bpm) 395± 11 394± 13 553 ± 36 521± 12
QRS
(ms) 16.5 ± 0.8 18.2 ± 1.0 17.3 ± 0.9 19.5 ± 1.1
PR Interval
(ms) 42.9 ± 1.4 42.0 ± 1.1 39.0 ± 2.7 44.2 ± 2.3
P Width
(ms) 12.6 ± 0.7 14.2 ± 1.2 11.8 ± 0.6 14.6 ± 0.9
QT Interval
(ms) 54.6 ± 7.0 57.5 ± 1.3 59.4 ± 7.2 64.3 ± 2.4
QTcorrected
44.2 ± 1.8 46.5 ± 1.0 56.5 ± 1.6 59.8 ± 1.8
T peak-T end
(Tc) (ms) 17.3 ± 1.1 24.0 ± 1.7 25.9 ± 1.5 35.0 ± 1.8
S-T peak
(STc)(ms) 7.8 ± 2.0 11.7 ± 0.8 6.7 ± 1.9 13.2 ± 1.4
Tabulated Results of 10 Week Electrocardiography
and Dobutamine Stress Test.
* p<0.05 vs. Control
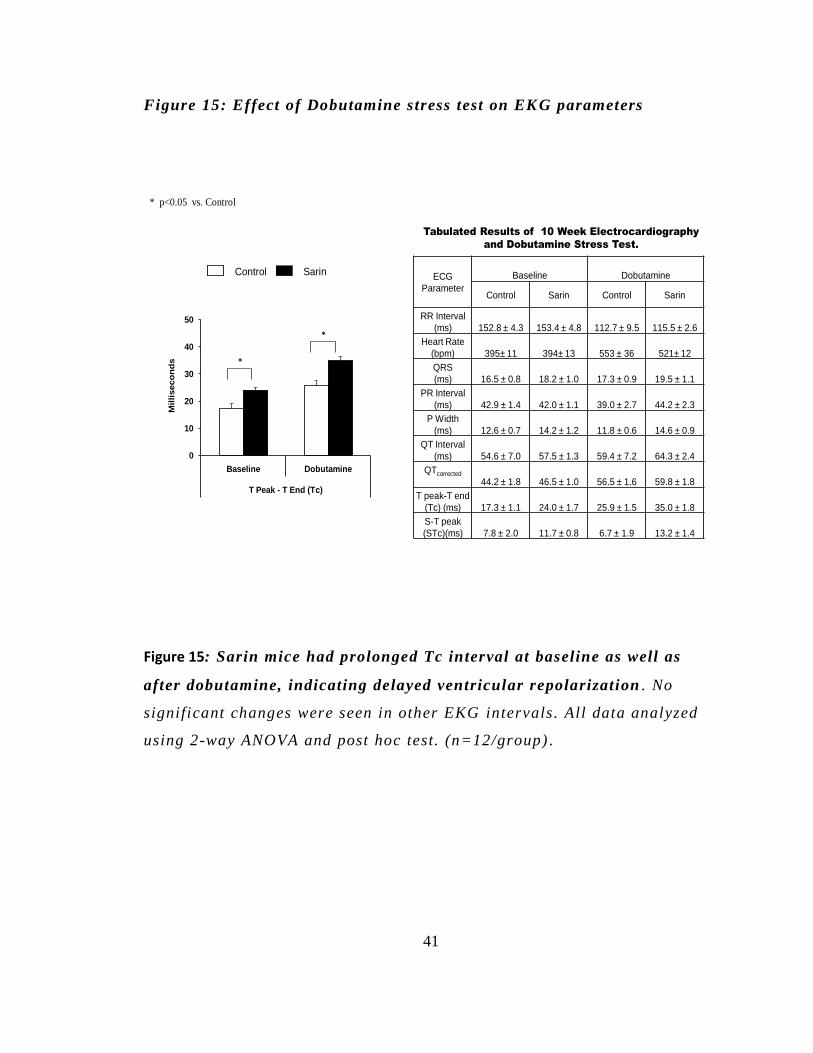
Figure 15: Sarin mice had prolonged Tc interval at baseline as well as
after dobutamine, indicating delayed ventricular repolarization . No
significant changes were seen in other EKG intervals. All data analyzed
using 2-way ANOVA and post hoc test. (n=12/group) .
42
VII.3. Electrocardiography:
ST depression and pro-arrhythmic phenotype in sarin mice
Dobutamine resulted in prominent ST depression in sarin mice . In
order to further characterize these ST segm ent changes, T-peak to T-end
interval was assessed as an indicator of global distribut ion of
repolarization (Figures 14). Sarin mice had prolonged T-peak-T-end
intervals at baseline and with dobutamine stimulation (Figure 15),
indicating an increased dispersion of repolarization/ prolonged ventricular
recovery in sarin mice which may result in a predisposition to ventricular
arrhythmias.
Figure 16 :Histology
Histology Immunohistochemistry
Sarin Control
Control LV
Sarin LV
Pix
els
/ n
ucle
i
A
C
*
2000
4000
6000
LV Cardiomyocite Size
B
0
1
2
3
4
Left Ventricle Left Ventricle
Atrial Natriuretic Peptide Brain Natriuretic Peptide
** *
ln (
Pix
els
)
LV Cardiomyocyte Cross Section
0.2
0.3
0.4
0.5
Heart Wt.(mg) / Body Wt.(gm)
0.5
0.6
0.7
0.8
Heart Wt.(mg) / Kidney Wt.(mg)
*
*
SarinControl
43
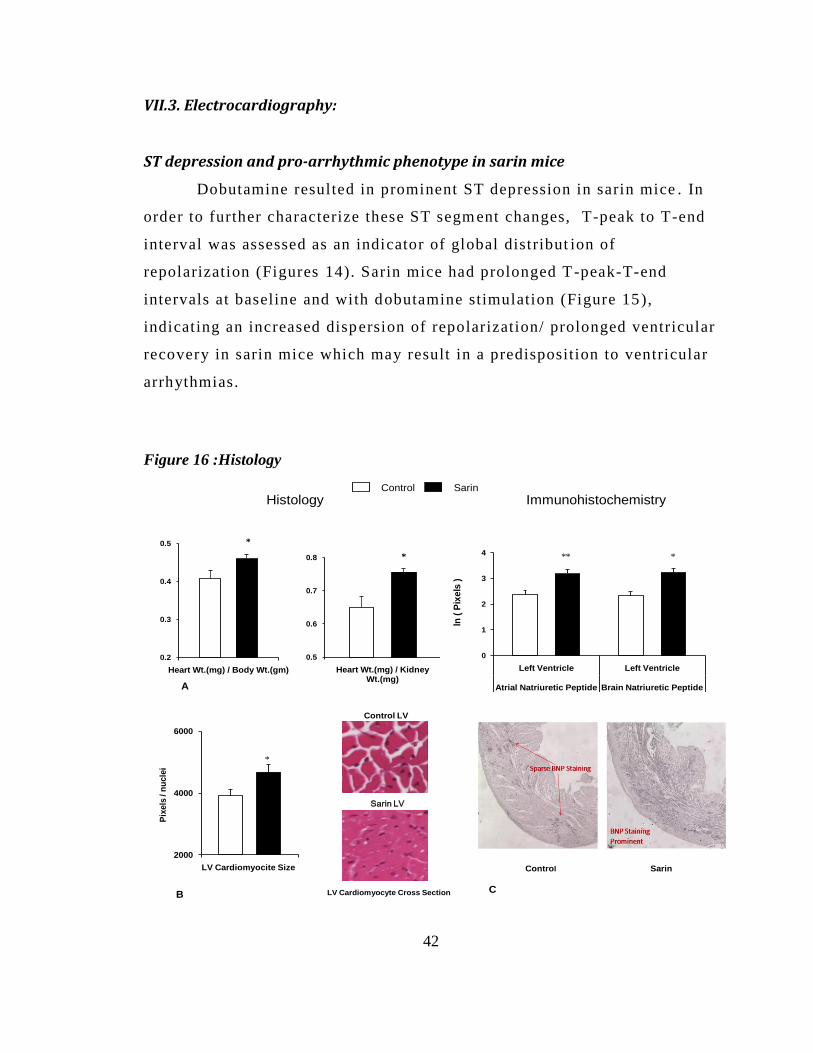
Figure 16: Cardiac Histology and Immunohistochemistry: Evidence o f
cardiac remodeling and damage. Sarin mice showed significantly
increased heart to body weight ratio (6A) LV cardiomyocytes were larger
in sarin treated mice as seen in the H& E stained sections an d the image
analysis data (Fig 6B). LV BNP levels were higher in sarin mice (Fig 6C)
suggestive of cardiac stretch.
VII.4. Histological and Immunohistochemical evidence of cardiac remodeling
The heart weight ratios to body and kidney weight were significantly
higher in sarin mice, (p< 0.05) (Figure 16A). LV cardiomyocyte cross
sectional area was increased in sarin mice (p < 0.05) corroborating with
LV remodeling (Figure 16B). Immunohistochemical staining revealed a
significant increase in BNP (Brain Natriuretic Peptide) in LV of mice
exposed to sarin (Figure 16C); consistent with the observation that sarin
leads to cardiomyocyte and LV remodeling
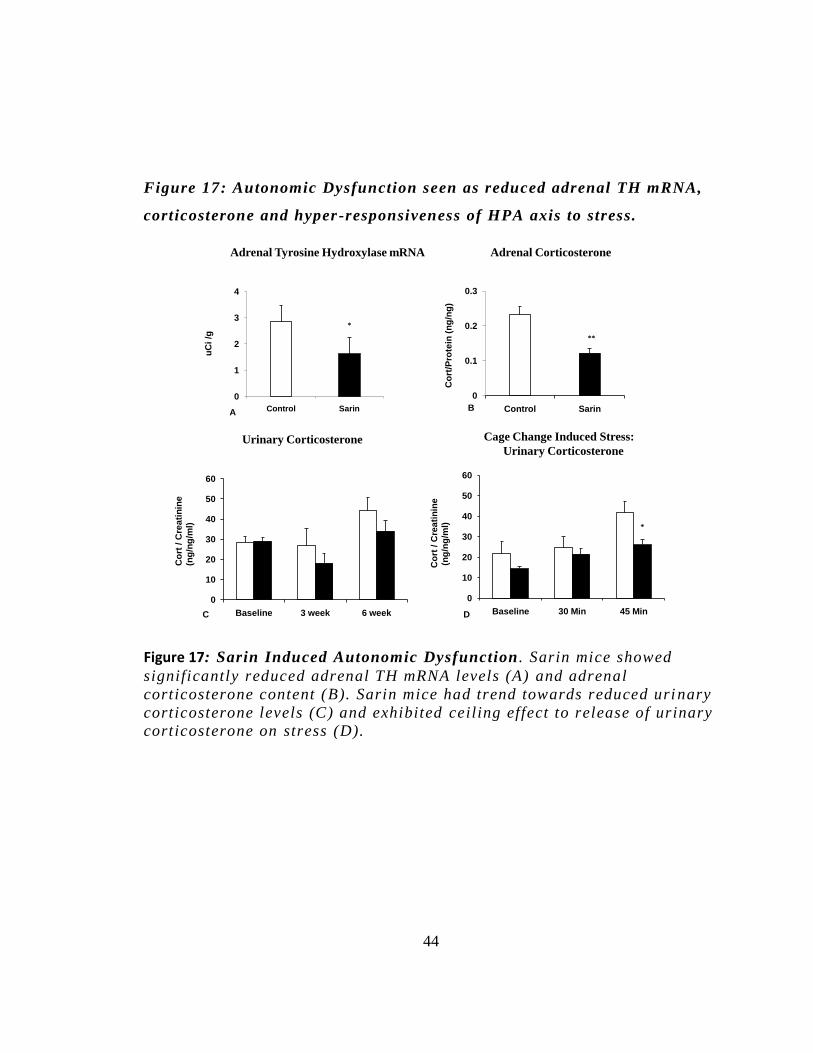
VII.5. Evidence for autonomic imbalance: Stress induced Hypothalamic–pituitary–adrenal (HPA)-axis dysregulation
The adrenal TH mRNA levels determin ed using in-situ
hybridization were significantly reduced in sarin group ( Figure 17A).
Adrenal corticosterone content determined using radioimmunoassay on
adrenal homogenate was significantly reduced as well ( Figure 17B). Mice
sacrificed under anesthesia induced stress had markedly different adrenal
corticosterone content. Anesthesia induced marked elevation in
cort/protein levels in controls however sarin mice failed to match up to
controls. Sarin mice had trend towards reduced urinary corticosterone
compared to controls (Figure 17C). Cage change induced stress led to
significantly lower levels of urinary corticosterone over 45 minutes
suggesting altered stress responsiveness and ceil ing effect to release of
urinary Corticosterone under stress in sarin mice (Figure 17D).
44
Figure 17: Autonomic Dysfunction seen as reduced adrenal TH mRNA,
corticosterone and hyper -responsiveness of HPA axis to stress.
0
10
20
30
40
50
60
Baseline 3 week 6 week
0
10
20
30
40
50
60
Baseline 30 Min 45 Min
*
0
0.1
0.2
0.3
Control Sarin
**
0
1
2
3
4
Control Sarin
*
Cage Change Induced Stress:
Urinary Corticosterone
Adrenal Tyrosine Hydroxylase mRNA Adrenal Corticosterone
Urinary Corticosterone
uC
i/g
Co
rt / C
rea
tin
ine
(ng
/ng
/ml)
Co
rt / C
rea
tin
ine
(ng
/ng
/ml)
Co
rt/P
rote
in (
ng
/ng
)
AB
C D
Figure 17: Sarin Induced Autonomic Dysfunction . Sarin mice showed
significantly reduced adrenal TH mRNA levels (A) and adrenal
corticosterone content (B). Sarin mice had trend towards reduced uri nary
corticosterone levels (C) and exhibited ceiling effect to release of urinary
corticosterone on stress (D).
45
VIII. Discussion
VIII.1. Sarin induced dilated cardiomyopathy
This is the first report to show that low dose sarin results in
delayed LV dilation and systoli c dysfunction. The findings are notable
given that physiologic alterations in MAP and HR were absent. This
phenotype is consistent with humans and animal models of a dilated
cardiomyopathy and heart failure (Rajan et al. , 2007; Fedak et al ., 2004;
Ikeda & Ross, Jr. , 2000) . Cardiomyopathies are deleterious, chronic
conditions affecting a wide clinical spectrum for which effective
treatments are limited (one year mortality rates of 30%) (Levy et al .,
2002; Ell iott et al., 2008) . Sarin did not appear to change peripheral
vascular resistance, indicating that the LV dilation was not secondary to
hypertension. Plausible explanations for the LV dilation include
autonomic stimuli or direct cellular effects secondary to sarin.
To assess the mediators of the functional/s tructural changes, we
tested the abil ity of a β adrenergic agonist, dobutamine, to stimulate
cardiac function and reserve under stress. Independent indices of cardiac
function such as Vcfc, MPI and ICT+IVRT were obtained using ECHO.
LV dilatation and reduced aFS were reco nfirmed at the 11 wk in sarin
mice.
Vcfc, cardiac preload independent index of cardiac function was
reduced at baseline in sarin mice, indicating increased end systolic wall
stress (Colan, Borow, & Neumann, 1984) . Reduced Vcfc has also been
reported in humans with dilated cardiomyopathy (Paraskevaidis, Tsiapras,
46
Adamopoulos, & Kremastinos, 1999) . MPI is a clinically used diagnostic
marker of combined LV systolic and diastolic function and is independent
of HR, MAP and valvular incompetence. Increased MPI values suggest
decreased global ventricular function in sarin t mice. FS/MPI is an index
of maximal cardiac contractility, which was reduced in sarin mice. This
indicates sarin reduces contractile reserve. FS/MPI and Vcfc served as
relatively accurate indicators of global LV function which take into
account both geometric and temporal measures of LV function (Broberg et
al. , 2003).
To broaden our understanding of sarin’s effect on heart we
examined ECG traces. The QTc segment of ECG is often used as a
biomarker of susceptibility to sudden arrhythmias a nd QTc prolongation
has been reported upon acute OP poisoning in humans (Shadnia, Okazi,
Akhlaghi, Sasanian, & Abdollahi, 2009) . In addition, rats given a
convulsive dose of sarin had transiently prolonged QT C interval at 2 wks
which returned to normal after 4 wks (Roth, Zell inger, Arad, & Atsmon,
1993). In our study using low dose sarin, there were no changes in QTc
segment, at least at 11 wk post treatment. However careful analysis of the
ST segment using the T-peak-T-end interval shows that sarin mice had
prolonged T peak-Tend at baseline as well as upon dobutamine. This
indicated an increased dispersion of ventricular repolarization, and a
predisposition to ventricular arrhythmias.
ECG changes were more apparent in the stress test. Prominent ST
segment depression in sarin mice may indicate myocardial/sub-
endocardial ischemia (Chu et al. , 2001) (Tomai, Crea, Chiariello, &
Gioffre, 1999) . Importantly, this effect was seen almost 3 months after
asymptomatic sarin exposure, suggesting that low -dose sarin can result in
chronic cardiac electrophysiological changes (Figure 3). These ECG
47
changes cannot be considered to be specific since they may result from
alterations in cell membrane potential or intracellular effects such as
mitochondrial damage.
The heart weight / body weight ratio and heart weight / kidney
weight ratio are common indexes used for comparison in various models
of cardiac hypertrophy and stroke. The heart weight /body weight ratio
and heart weight / kidney weight ratio both were significantly higher in
sarin mice indicating cardiac remodeling. Significantly increases cardiac
mass, cardiomyocyte area and BNP (Brain Natriuretic Peptide) expression
in the sarin mice further suggest a sarin induced cardiomyopathy. BNP is
a peptide hormone synthesized and secreted exclusively by the heart in
response to activation of neurohumoral and/or mechanical st imuli such
that occur during heart failure (Yasuno et al. , 2009) . ANP is synthesized
in atrial myocytes wall stretch and cardiac stress .(Goetze, Georg,
Jorgensen, & Fahrenkrug, 2010)
This study demonstrates that low dose sarin exposure re sults in
cardiac remodeling characterized by left ventricular dilation, reduced
systolic function, and delayed ventricular repolarization. These effects are
further characterized by reduced myocardial performance, reduced
maximal contracti lity and prominen t ST segment depression under β
adrenergic stimulation. These findings are consistent with early
maladaptive changes that lead to cardiomyopathy and set the stage for the
development of end-stage heart failure.
48
VIII.2. Sarin induced autonomic dysfunction:
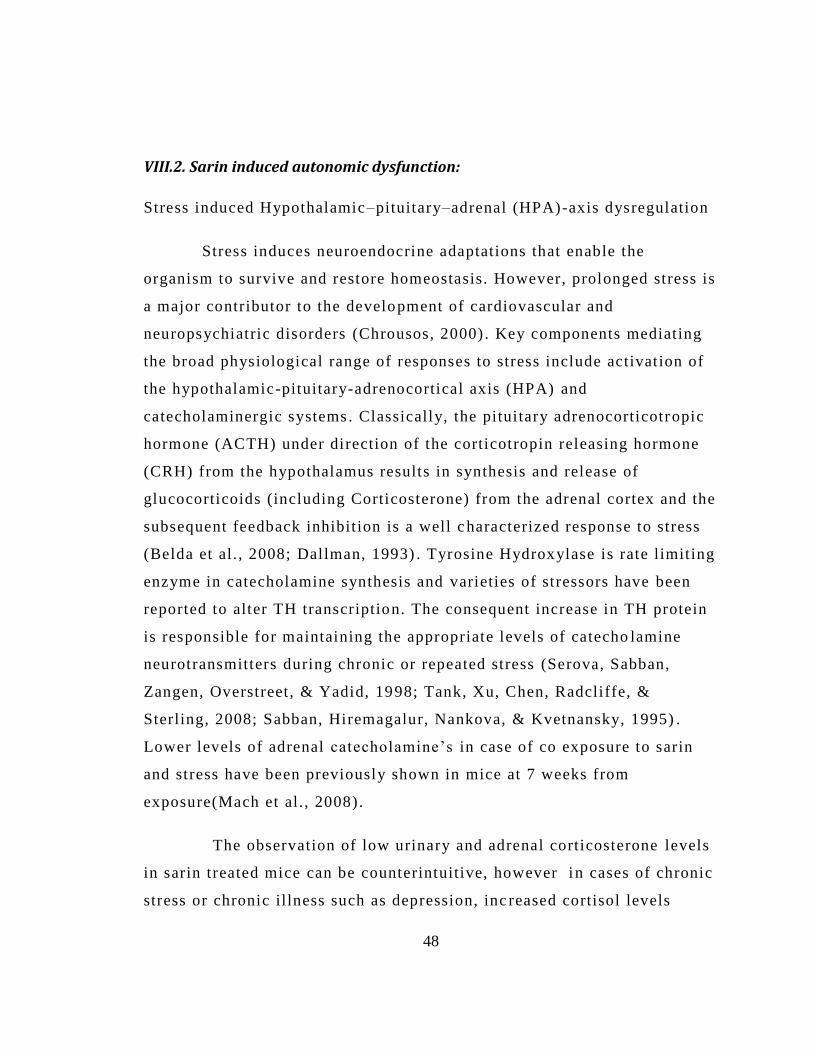
Stress induced Hypothalamic–pituitary–adrenal (HPA)-axis dysregulation
Stress induces neuroendocrine adaptations that enable the
organism to survive and restore homeostasis. However, prolonged stress is
a major contributor to the development of cardiovascular and
neuropsychiatric disorders (Chrousos, 2000) . Key components mediating
the broad physiological range of responses to stress include activation of
the hypothalamic-pituitary-adrenocortical axis (HPA) and
catecholaminergic systems . Classically, the pituitary adrenocorticotr opic
hormone (ACTH) under direction of the corticotropin releasing hormone
(CRH) from the hypothalamus results in synthesis and release of
glucocorticoids (including Corticosterone) from the adrenal cortex and the
subsequent feedback inhibit ion is a well c haracterized response to stress
(Belda et al. , 2008; Dallman, 1993) . Tyrosine Hydroxylase is rate limiting
enzyme in catecholamine synthesis and varieties of stressors have been
reported to alter TH transcription. The consequent increase in TH protein
is responsible for maintaining the appropriate levels of catecho lamine
neurotransmitters during chronic or repeated stress (Serova, Sabban,
Zangen, Overstreet , & Yadid, 1998; Tank, Xu, Chen, Radcliffe, &
Sterling, 2008; Sabban, Hiremagalur, Nankova, & Kvetnansky, 1995) .
Lower levels of adrenal catecholamine’s in case of co exposure to sarin
and stress have been previously shown in mice at 7 weeks from
exposure(Mach et al. , 2008).
The observation of low urinary and adrenal corticosterone levels
in sarin treated mice can be counterintuitive, however i n cases of chronic
stress or chronic illness such as depression, inc reased cortisol levels
49
indicate that the hypothalamic -pituitary- adrenal (HPA) axis has grown
resistant to the effects of cortisol. In contrast, l ow cortisol levels are
associated with enhanced cortisol suppression after dexamethasone
administration also seen in gulf war veterans (Golier, Schmeidler, Legge,
& Yehuda, 2007; de Kloet et al ., 2007) suggests that the HPA axis is
actually overly responsive to stimulation/stress . The hypothesis that the
HPA axis may be hypersensitive in sarin mice is consistent with the more
general phenomenology of increased reactivity to both explicit and
implicit trauma reminders and as well as a more generalized hyper
vigilance in trauma survivors with this disorder. (Pitman, Orr, Forgue, de
Jong, & Claiborn, 1987; Ottenweller, Natelson, Pitman, & Drastal , 1989) .
50
IX. Conclusion
In summary these findings raise important health concerns related
to the development of autonomic imbalance and cardiomyopathy of
indeterminate origin in both military and civil ian populations following
exposure to low, non-symptomatic doses of the chemical warfare agent,
sarin, or other occupational OP pesticides. The study also provides a
novel model of delayed onset cardiomyopathy in mice. These results are
particularly important in the military theater in which essentially healthy
individuals may be exposed to the OP/stress combination. Diminished
cardiac function and altered stress re sponsiveness could explain the
feeling of tiredness in these patients .
51
XI. Bibliography
Books and Other References
CDC. (1999). Background Document on Gulf War-Related Research for the Health
Impact of Chemical Exposures During the Gulf War: A Research Planning Conference.
Atlanta GA: CDC (Center for Disease Control and Prevention) , pp. 55
Central Intelligence Agency; Department of Defense. (1997, 09 4). Modeling the
Chemical Warfare Agent Release at the Khamisiyah Pit. Retrieved 02 09, 2010, from
CIA Home: https://www.cia.gov/library/reports/general-reports-
1/gulfwar/555/425055597.html
Committee on Gulf War and Health: Updated Literature Review of Sarin. (2004). Gulf
War and Health: Updated Literature Review of Sarin. In Gulf War and Health: Updated
Literature Review of Sarin (pp. 14 - 17). Washington DC: National Academy of Sciences.
Conover, M. B. (2003). Understanding Electrocardiography, p. 34-40. St. Louis: Mosby,
Inc.
52
Eroschenko, V. P. (2008). diFiore's Atlas of Histology with Functional Correlations
(11th ed.). Baltimore MD: Lippincott Williams & Wilkins.
Marrs, T. C. (2007). Toxicology of Organophosphate Nerve Agents. In T. C. Marrs, R. L.
Maynard, & F. R. Sidell, Chemcial Warfare Agents Toxicology and Treatment (pp. 191 -
223). West Sussex, England: John Wiley & Sons Ltd.
Mirvis, D. M., & Goldberger, A. L. (2008). CHAPTER 12 – Electrocardiography. In P.
Libby, R. O. Bonow, D. L. Mann, & D. P. Zipes, BRAUNWALD'S Heart Disease A
Textbook of Cardiovascular Medicine (pp. 149 - 195). Philadelphia PA: Saunders, an
imprint of Elsevier Inc.
Taylor, P. (2001). Anticholinesterase Agents. In J. G. Hardman, L. E. Limbird, & A. G.
Gilman, Goodman & Gilman's: The Pharmacological Basis of Therapeutics (pp. 175-
191). New York NY: McGraw Hill Companies, Inc.
Persian Gulf War Illnesses Task Force. (1997, 04 02). Khamisiyah: A Historical
Perspective on Related Intelligence. Retrieved 02 09, 2010, from GulfLINK:
http://www.gulflink.osd.mil/cia_wp/
Roden, D. M. (2001). Antiarrhythmic Drugs. In J. G. Hardman, L. Limbird, & A. G.
Gilman, Goodman & Gilman's The Pharmacological Basis of Therapeutics (10th ed.)
(pp. 935 - 970). New Yoyk NY: McGraw - Hill.
Taylor, P. (2001). Anticholinesterase Agents. In J. G. Hardman, L. E. Limbird, & A. G.
Gilman, Goodman & Gilman's: The Pharmacological Basis of Therapeutics (pp. 175-
191). New York NY: McGraw Hill Companies, Inc.
53
United States Air Force. (2007, January 26). Counter-Chemical, Biological, Radiological,
and Nuclear Operations. Air Force Doctrine Document 2-1.8 . Headquarters Air Force
Doctrine Center.
Article Reference List
Abou-Donia, M. B. (2003). Organophosphorus ester-induced chronic
neurotoxicity. Arch.Environ.Health, 58, 484-497.
Abraham, S., Oz, N., Sahar, R., & Kadar, T. (2001). QTc prolongation and cardiac
lesions following acute organophosphate poisoning in rats. Proc.West Pharmacol.Soc.,
44, 185-186.
Alaoui, M. Y., Mossadeq, A., Faroudy, M., & Sbihi, A. (2009). [Cardiac
complications associated with organophosphate poisoning.]. Ann.Cardiol.Angeiol.(Paris).
Allon, N., Rabinovitz, I., Manistersky, E., Weissman, B. A., & Grauer, E. (2005).
Acute and long-lasting cardiac changes following a single whole-body exposure to sarin
vapor in rats. Toxicol.Sci., 87, 385-390.
54
Bar-Meir, E., Schein, O., Eisenkraft, A., Rubinshtein, R., Grubstein, A., Militianu, A.
et al. (2007). Guidelines for treating cardiac manifestations of organophosphates
poisoning with special emphasis on long QT and Torsades De Pointes. Crit Rev.Toxicol.,
37, 279-285.
Belda, X., Rotllant, D., Fuentes, S., Delgado, R., Nadal, R., & Armario, A. (2008).
Exposure to severe stressors causes long-lasting dysregulation of resting and stress-
induced activation of the hypothalamic-pituitary-adrenal axis. Ann.N.Y.Acad.Sci., 1148,
165-173.
Broberg, C. S., Pantely, G. A., Barber, B. J., Mack, G. K., Lee, K., Thigpen, T. et al.
(2003). Validation of the myocardial performance index by echocardiography in mice: a
noninvasive measure of left ventricular function. J.Am.Soc.Echocardiogr., 16, 814-823.
Chao, L. L., Rothlind, J. C., Cardenas, V. A., Meyerhoff, D. J., & Weiner, M. W.
(2010). Effects of low-level exposure to sarin and cyclosarin during the 1991 Gulf War on
brain function and brain structure in US veterans. Neurotoxicology.
Chrousos, G. P. (2000). The role of stress and the hypothalamic-pituitary-adrenal
axis in the pathogenesis of the metabolic syndrome: neuro-endocrine and target tissue-
related causes. Int.J.Obes.Relat Metab Disord., 24 Suppl 2, S50-S55.
55
Chu, V., Otero, J. M., Lopez, O., Morgan, J. P., Amende, I., & Hampton, T. G.
(2001). Method for non-invasively recording electrocardiograms in conscious mice. BMC
Physiol, 1, 6.
Colan, S. D., Borow, K. M., & Neumann, A. (1984). Left ventricular end-systolic
wall stress-velocity of fiber shortening relation: a load-independent index of myocardial
contractility. J.Am.Coll.Cardiol., 4, 715-724.
Couzin, J. (2004). Epidemiology. VA advisers link Gulf War illnesses to
neurotoxins. Science, 306, 26-27.
Dabisch, P. A., To, F., Kerut, E. K., Horsmon, M. S., & Mioduszewski, R. J. (2007).
Multiple exposures to sarin vapor result in parasympathetic dysfunction in the eye but
not the heart. Toxicol.Sci., 99, 354-361.
Dallman, M. F. (1993). Stress update Adaptation of the hypothalamic-pituitary-
adrenal axis to chronic stress. Trends Endocrinol.Metab, 4, 62-69.
Dash, S. K., Mohanty, M. K., Mohanty, S., & Patnaik, K. K. (2008).
Organophosphorus poisoning: victim specific analysis of mortality and morbidity.
Med.Sci.Law, 48, 241-245.
de Kloet, C. S., Vermetten, E., Heijnen, C. J., Geuze, E., Lentjes, E. G., &
Westenberg, H. G. (2007). Enhanced cortisol suppression in response to dexamethasone
56
administration in traumatized veterans with and without posttraumatic stress disorder.
Psychoneuroendocrinology, 32, 215-226.
Dharmani, C. & Jaga, K. (2005). Epidemiology of acute organophosphate
poisoning in hospital emergency room patients. Rev.Environ.Health, 20, 215-232.
Elliott, P., Andersson, B., Arbustini, E., Bilinska, Z., Cecchi, F., Charron, P. et al.
(2008). Classification of the cardiomyopathies: a position statement from the European
Society Of Cardiology Working Group on Myocardial and Pericardial Diseases. Eur.Heart
J, 29, 270-276.
ELLMAN, G. L., COURTNEY, K. D., Andres, V., , Jr., & FEATHER-STONE, R. M.
(1961). A new and rapid colimetric determination of acetylcholinesterase activity.
Biochem Pharmacol, 7, 88-95.
Fedak, P. W., Smookler, D. S., Kassiri, Z., Ohno, N., Leco, K. J., Verma, S. et al.
(2004). TIMP-3 deficiency leads to dilated cardiomyopathy. Circulation, 110, 2401-2409.
Gilat, E., Kadar, T., Levy, A., Rabinovitz, I., Cohen, G., Kapon, Y. et al. (2005).
Anticonvulsant treatment of sarin-induced seizures with nasal midazolam: an
electrographic, behavioral, and histological study in freely moving rats.
Toxicol.Appl.Pharmacol., 209, 74-85.
57
Goetze, J. P., Georg, B., Jorgensen, H. L., & Fahrenkrug, J. (2010). Chamber-
dependent circadian expression of cardiac natriuretic peptides. Regul.Pept., 160, 140-
145.
Gohel, D. R., Oza, J. J., Panjwani, S. J., & Gajjar, P. P. (1996). Organophosphate
compound poisoning and cardiac toxicity. J.Assoc.Physicians India, 44, 287.
Golier, J. A., Schmeidler, J., Legge, J., & Yehuda, R. (2007). Twenty-four hour
plasma cortisol and adrenocorticotropic hormone in Gulf War veterans: relationships to
posttraumatic stress disorder and health symptoms. Biol.Psychiatry, 62, 1175-1178.
Haley, R. W. (1997). Is Gulf War syndrome due to stress? The evidence
reexamined. Am.J.Epidemiol., 146, 695-703.
Haley, R. W. (2000). Re: "Factor analysis of self-reported symptoms: does it
identify a Gulf War syndrome?". Am.J.Epidemiol., 152, 1204-1206.
Haley, R. W., Vongpatanasin, W., Wolfe, G. I., Bryan, W. W., Armitage, R.,
Hoffmann, R. F. et al. (2004). Blunted circadian variation in autonomic regulation of
sinus node function in veterans with Gulf War syndrome. Am.J.Med., 117, 469-478.
Ikeda, Y. & Ross, J., Jr. (2000). Models of dilated cardiomyopathy in the mouse
and the hamster. Curr.Opin.Cardiol., 15, 197-201.
Ip, M. S., Scott, I. U., VanVeldhuisen, P. C., Oden, N. L., Blodi, B. A., Fisher, M. et
al. (2009). A randomized trial comparing the efficacy and safety of intravitreal
58
triamcinolone with observation to treat vision loss associated with macular edema
secondary to central retinal vein occlusion: the Standard Care vs Corticosteroid for
Retinal Vein Occlusion (SCORE) study report 5. Arch.Ophthalmol., 127, 1101-1114.
Jamal, G. A. (1998). Gulf War syndrome--a model for the complexity of biological
and environmental interaction with human health. Adverse Drug React.Toxicol.Rev., 17,
1-17.
Jamal, G. A., Hansen, S., Apartopoulos, F., & Peden, A. (1996). The "Gulf War
syndrome". Is there evidence of dysfunction in the nervous system?
J.Neurol.Neurosurg.Psychiatry, 60, 449-451.
Key, M., Wirick, B., Cool, D., & Morris, M. (2001). Quantitative in situ
hybridization for peptide mRNAs in mouse brain. Brain Res.Brain Res.Protoc., 8, 8-15.
Kiss, Z. & Fazekas, T. (1983). Organophosphate poisoning and complete heart
block. J.R.Soc.Med., 76, 85-86.
Levy, D., Kenchaiah, S., Larson, M. G., Benjamin, E. J., Kupka, M. J., Ho, K. K. et al.
(2002). Long-term trends in the incidence of and survival with heart failure.
N.Engl.J.Med, 347, 1397-1402.
London, L., Flisher, A. J., Wesseling, C., Mergler, D., & Kromhout, H. (2005).
Suicide and exposure to organophosphate insecticides: cause or effect? Am.J.Ind.Med.,
47, 308-321.
59
Mach, M., Grubbs, R. D., Price, W. A., Nagaoka, M., Dubovicky, M., & Lucot, J. B.
(2008). Delayed behavioral and endocrine effects of sarin and stress exposure in mice.
J.Appl.Toxicol., 28, 132-139.
Marosi, G., Ivan, J., Vass, K., Gajdacs, A., & Ugocsai, G. (1989). [ECG
repolarization disorder (QT lengthening) in organophosphate poisoning]. Orv.Hetil., 130,
111-115.
Marrs, T. C. (1991). Toxicology of oximes used in treatment of organophosphate
poisoning. Adverse Drug React.Toxicol.Rev., 10, 61-73.
Marrs, T. C. (1993). Organophosphate poisoning. Pharmacol.Ther., 58, 51-66.
McCauley, L. A., Rischitelli, G., Lambert, W. E., Lasarev, M., Sticker, D. L., &
Spencer, P. S. (2001). Symptoms of Gulf War veterans possibly exposed to
organophosphate chemical warfare agents at Khamisiyah, Iraq.
Int.J.Occup.Environ.Health, 7, 79-89.
McLeod, C. G., Jr. (1985). Pathology of nerve agents: perspectives on medical
management. Fundam.Appl.Toxicol., 5, S10-S16.
Mitchell, G. F., Jeron, A., & Koren, G. (1998). Measurement of heart rate and Q-T
interval in the conscious mouse. Am.J.Physiol, 274, H747-H751.
Morgan, E. E., Faulx, M. D., McElfresh, T. A., Kung, T. A., Zawaneh, M. S., Stanley,
W. C. et al. (2004). Validation of echocardiographic methods for assessing left
60
ventricular dysfunction in rats with myocardial infarction. Am.J.Physiol Heart
Circ.Physiol, 287, H2049-H2053.
Morris, M., Key, M. P., & Farah, V. (2007). Sarin produces delayed cardiac and
central autonomic changes. Exp.Neurol., 203, 110-115.
Murata, K., Araki, S., Yokoyama, K., Okumura, T., Ishimatsu, S., Takasu, N. et al.
(1997). Asymptomatic sequelae to acute sarin poisoning in the central and autonomic
nervous system 6 months after the Tokyo subway attack. J.Neurol., 244, 601-606.
Ottenweller, J. E., Natelson, B. H., Pitman, D. L., & Drastal, S. D. (1989).
Adrenocortical and behavioral responses to repeated stressors: toward an animal model
of chronic stress and stress-related mental illness. Biol.Psychiatry, 26, 829-841.
Paraskevaidis, I. A., Tsiapras, D. P., Adamopoulos, S., & Kremastinos, D. T. (1999).
Assessment of the functional status of heart failure in non ischemic dilated
cardiomyopathy: an echo-dobutamine study. Cardiovasc.Res., 43, 58-66.
Pitman, R. K., Orr, S. P., Forgue, D. F., de Jong, J. B., & Claiborn, J. M. (1987).
Psychophysiologic assessment of posttraumatic stress disorder imagery in Vietnam
combat veterans. Arch.Gen.Psychiatry, 44, 970-975.
Proctor, S. P., Heaton, K. J., Heeren, T., & White, R. F. (2006). Effects of sarin and
cyclosarin exposure during the 1991 Gulf War on neurobehavioral functioning in US
army veterans. Neurotoxicology, 27, 931-939.
61
Rajan, S., Ahmed, R. P., Jagatheesan, G., Petrashevskaya, N., Boivin, G. P.,
Urboniene, D. et al. (2007). Dilated cardiomyopathy mutant tropomyosin mice develop
cardiac dysfunction with significantly decreased fractional shortening and myofilament
calcium sensitivity. Circ.Res, 101, 205-214.
Riddle, J. R., Brown, M., Smith, T., Ritchie, E. C., Brix, K. A., & Romano, J. (2003).
Chemical warfare and the Gulf War: a review of the impact on Gulf veterans' health.
Mil.Med., 168, 606-613.
Roth, A., Zellinger, I., Arad, M., & Atsmon, J. (1993). Organophosphates and the
heart. Chest, 103, 576-582.
Sabban, E. L., Hiremagalur, B., Nankova, B., & Kvetnansky, R. (1995). Molecular
biology of stress-elicited induction of catecholamine biosynthetic enzymes.
Ann.N.Y.Acad.Sci., 771, 327-338.
Serova, L., Sabban, E. L., Zangen, A., Overstreet, D. H., & Yadid, G. (1998). Altered
gene expression for catecholamine biosynthetic enzymes and stress response in rat
genetic model of depression. Brain Res.Mol.Brain Res., 63, 133-138.
Shadnia, S., Okazi, A., Akhlaghi, N., Sasanian, G., & Abdollahi, M. (2009).
Prognostic value of long QT interval in acute and severe organophosphate poisoning.
J.Med Toxicol., 5, 196-199.
62
Sharabi, Y., Danon, Y. L., Berkenstadt, H., Almog, S., Mimouni-Bloch, A., Zisman,
A. et al. (1991). Survey of symptoms following intake of pyridostigmine during the
Persian Gulf war. Isr.J.Med.Sci., 27, 656-658.
Steele, L. (2000). Prevalence and patterns of Gulf War illness in Kansas veterans:
association of symptoms with characteristics of person, place, and time of military
service. Am.J.Epidemiol., 152, 992-1002.
Steele, L. (2001). Invited commentary: unexplained health problems after Gulf
War Service--finding answers to complex questions. Am.J.Epidemiol., 154, 406-409.
Syed, F., Diwan, A., & Hahn, H. S. (2005). Murine echocardiography: a practical
approach for phenotyping genetically manipulated and surgically modeled mice.
J.Am.Soc.Echocardiogr., 18, 982-990.
Tank, A. W., Xu, L., Chen, X., Radcliffe, P., & Sterling, C. R. (2008). Post-
transcriptional regulation of tyrosine hydroxylase expression in adrenal medulla and
brain. Ann.N.Y.Acad.Sci., 1148, 238-248.
Tei, C., Ling, L. H., Hodge, D. O., Bailey, K. R., Oh, J. K., Rodeheffer, R. J. et al.
(1995). New index of combined systolic and diastolic myocardial performance: a simple
and reproducible measure of cardiac function--a study in normals and dilated
cardiomyopathy. J.Cardiol., 26, 357-366.
63
Tomai, F., Crea, F., Chiariello, L., & Gioffre, P. A. (1999). Ischemic preconditioning
in humans: models, mediators, and clinical relevance. Circulation, 100, 559-563.
Yasuno, S., Usami, S., Kuwahara, K., Nakanishi, M., Arai, Y., Kinoshita, H. et al.
(2009). Endogenous cardiac natriuretic peptides protect the heart in a mouse model of
dilated cardiomyopathy and sudden death. Am.J Physiol Heart Circ.Physiol, 296, H1804-
H1810.
Yokoyama, K., Araki, S., Murata, K., Nishikitani, M., Okumura, T., Ishimatsu, S. et
al. (1998). Chronic neurobehavioral and central and autonomic nervous system effects
of Tokyo subway sarin poisoning. J.Physiol Paris, 92, 317-323.