logistic regression sta302 f 2014 see last slide for copyright information 1
TRANSCRIPT

1
Logistic Regression
STA302 F 2014
See last slide for copyright information

2
Binary outcomes are common and important
• The patient survives the operation, or does not.• The accused is convicted, or is not.• The customer makes a purchase, or does not.• The marriage lasts at least five years, or does not.• The student graduates, or does not.

3
Logistic Regression
Dependent variable is binary (Bernoulli): 1=Yes, 0=No

4
Least Squares vs. Logistic Regression

5
The logistic regression curve arises from an indirect representation of the probability of Y=1 for a given set of x values.
Representing the probability of an event by

6
• If P(Y=1)=1/2, odds = .5/(1-.5) = 1 (to 1)• If P(Y=1)=2/3, odds = 2 (to 1)• If P(Y=1)=3/5, odds = (3/5)/(2/5) = 1.5
(to 1)• If P(Y=1)=1/5, odds = .25 (to 1)

7
The higher the probability, the greater the odds

8
Linear regression model for the log odds of the event Y=1
for i = 1, …, n

9
Equivalent Statements

10
• A distinctly non-linear function• Non-linear in the betas• So logistic regression is an example of
non-linear regression.

11
In terms of log odds, logistic regression is like regular
regression

12
In terms of plain odds,
• (Exponential function of) the logistic regression coefficients are odds ratios
• For example, “Among 50 year old men, the odds of being dead before age 60 are three times as great for smokers.”

13
Logistic regression
• X=1 means smoker, X=0 means non-smoker
• Y=1 means dead, Y=0 means alive
• Log odds of death =
• Odds of death =

14

15
Cancer Therapy Example
x is severity of disease

16
For any given disease severity x,

17
In general,
• When xk is increased by one unit and all other independent variables are held constant, the odds of Y=1 are multiplied by
• That is, is an odds ratio --- the ratio of the odds of Y=1 when xk is increased by one unit, to the odds of Y=1 when everything is left alone.
• As in ordinary regression, we speak of “controlling” for the other variables.

18
The conditional probability of Y=1
This formula can be used to calculate a predictedP(Y=1|x). Just replace betas by their estimates
It can also be used to calculate the probability of gettingthe sample data values we actually did observe, as afunction of the betas.
19
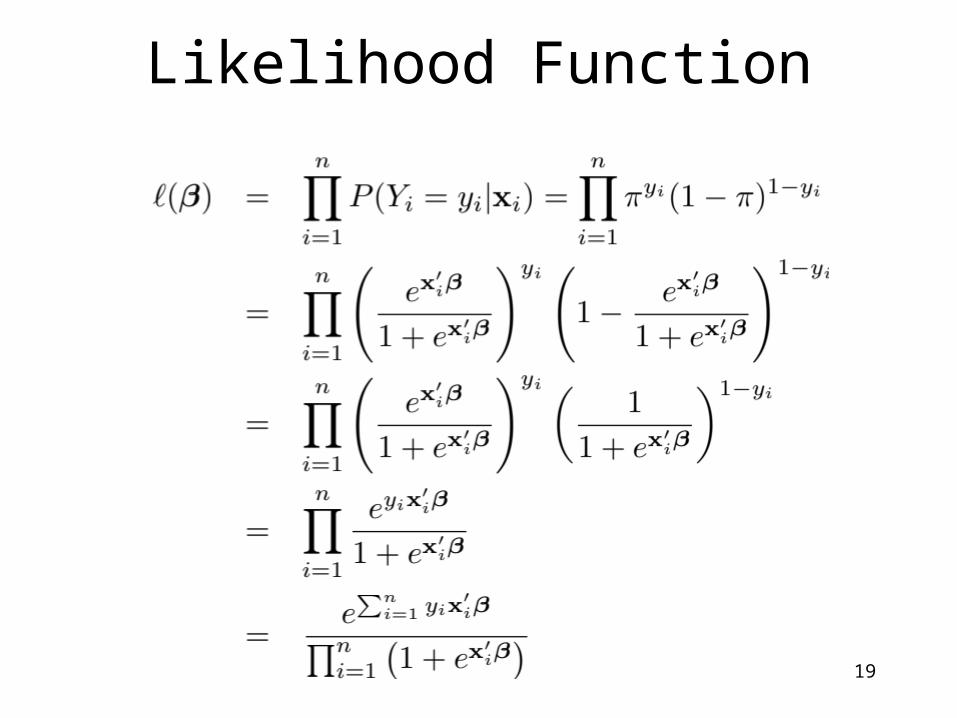
Likelihood Function

20
Maximum likelihood estimation• Likelihood = Conditional probability of getting
the data values we did observe,• As a function of the betas• Maximize the (log) likelihood with respect to
betas.• Maximize numerically (“Iteratively re-weighted
least squares”)• Likelihood ratio tests play he role of F tests.• Divide regression coefficients by estimated
standard errors to get Z-tests of H0: bj=0.• These Z-tests are like the t-tests in ordinary
regression.

21
The conditional probability of Y=1
This formula can be used to calculate a predictedP(Y=1|x). Just replace betas by their estimates
It can also be used to calculate the probability of gettingthe sample data values we actually did observe, as afunction of the betas.

22
Likelihood Function

23
Copyright Information
This slide show was prepared by Jerry Brunner, Department of
Statistics, University of Toronto. It is licensed under a Creative
Commons Attribution - ShareAlike 3.0 Unported License. Use
any part of it as you like and share the result freely. These
Powerpoint slides will be available from the course website:
http://www.utstat.toronto.edu/brunner/oldclass/302f14