loan portfolio and performance of bank holding...
TRANSCRIPT
1
Loan Portfolio and Performance of Bank Holding Companies in the US: 2006-2008
Mahelet Fikru
Southern Illinois University Carbondale
December, 2009
Abstract
The paper examines loan portfolio of bank holding companies in the US during the years 2006-
2008 to identify any significant differences in bank lending before and during the financial crisis.
The results of the study suggest that for the largest banks there was no significant change in loan
portfolio throughout 2006-8. However, for small banks, the share of real estate loans slightly
increased in 2008 where as the share of consumer loans declined suggesting some possible
substitution of consumer loans by real estate loans. The study also examines the relationship
between loan types and overall performance of bank holding companies in order to identify any
significant difference in the effect of loan on bank profitability between the years 2006, 2007 and
2008. The empirical evidence suggests that higher aggregate loans were consistently associated
with lower bank performance throughout 2006-08 where as evidence for the varying effect of
loan portfolio on performance throughout 2006-08 is limited.
Keywords: loan portfolio, bank holding company, bank performance
JEL classification: G01, G10, G21
2
1. Introduction
Commercial banks are distinguished from other financial institutions by their accepting deposits
and provision of loans. The Federal Reserve classifies bank loans into several categories: real
estate loan, agricultural loan, commercial and industrial loan (C&I), loan to depository
institutions, consumer loan, obligations to state and political subdivision, and foreign loan
(Saunders, 2008). Loans are the basic source of revenue and a major part of asset for banks. Loan
portfolio problems have historically been a major cause of bank failure (Comptroller’s
Handbook, 1998). Loans are associated with default risk in addition to the inherent risk of
individual loans. Thus, according to the Modern Portfolio Theory the objective of the bank
manager is to choose a loan portfolio that minimizes risk given the expected return of the
portfolio.
The recent financial crisis of 2008 had severe consequences for commercial banks. According to
the Federal Deposit Insurance Corporation (FDIC) 25 commercial banks failed and several
others declared bankruptcy during 2008. These failures are likely to cause a decline in
confidence that would make commercial banks reluctant to lend money amongst themselves or
to others.
Recent papers find evidence that bank loans have declined during the peak of the recent financial
crisis (August-October 2008) relative to the credit booms of May-July 2007. Contessi et al
(2009b) showed that bank credit had expanded strongly in the fourth quarter of 2007,
particularly for C&I loans but was followed by a sharp contraction until the first quarter of 2008.
Subsequently, there was a mild contraction in the third and fourth quarters of 2008. Contessi et al
(2009b) argue that lending declined for the major types of loans (C&I, consumer loans and real
estate loans) and for all US banks during the third and fourth quarters of 2008.
Similarly, Chari et al (2008) argued that bank lending to non-financial corporations and
individuals declined sharply during the crisis while interbank lending was essentially
nonexistent. However, they added that such evidence is not evident in the aggregate data. In fact,
using aggregate data they showed that C&I loans increased slightly during the crisis, consumer
3
loans did not decline and interbank loans also did not decline during the crisis. Consistent with
this result Ivashina et al (2008) found a slightly rising trend of C&I loans for much of 2008.
The use of aggregated data can be misleading when making conclusions about what happened to
loans during the crisis (Contessi, 2009a). A deeper look at disaggregated data shows a steep
decline of loans during the crisis (Cohen-Cole et al, 2008, Chari, 2008, Ivashina et al, 2008).
Ivashina et al (2008) estimated that during August-October 2008, loans from commercial banks
were 36% less than the previous 3 months.
The effect of loans on the performance of banks differs for different types of banks, different
macroeconomic condition (Athanasoglou, 2005, Demirguc-Kunt et al, 2000), and different
institutional factors (Cornett et al, 2009). Regarding the relationship between loan portfolio and
bank returns, Acharaya (2002) found that loan diversification reduces bank return while
endogenously producing riskier loans for all banks in a sample of Italian banks in the 1990s.
The purpose of this study is to examine if there is a statistical difference in the amount of
lending, type of lending and loan portfolio of US bank holding companies in the years 2006-
2008. Mean estimation is used to compare bank lending during the crisis years to the patterns
observed in 2006. In addition, this paper examines the relationship between loan portfolio and
overall performance of bank holding companies (hereafter ‘banks’). The study investigates if
loan and loan composition affects bank profitability and if there is any significant difference in
the effect of loan portfolio on bank profitability between the years 2006-2008. To address this
issue seemingly unrelated regression technique is used to determine which loan types were most
detrimental for bank return and how (or if) these variables had significantly changed throughout
2006-08.
Section 2 describes the main variables used in the paper, presents the econometric model and
compares values of the major loan types in 2007-2008 to those given in 2006 using mean
estimation and descriptive statistics. Following, section 3 presents regression results and
discusses major findings. Finally, the major findings are summarized and conclusions are drawn
in section 4.
4
2. Data and Methodology
The study examines a cross-sectional data of 19,947 US consolidated bank-year observations
obtained from Federal Financial Institution Examination Council Call Report (FFIEC 031) found
on the Chicago Federal Reserve’s website. Bank holding company data is obtained by
aggregating commercial bank values at the highest holding level. The sample contains 4,805
single banks which are not associated with any bank holding company. Initially, the study
analyses all the 19,947 bank-year observations.
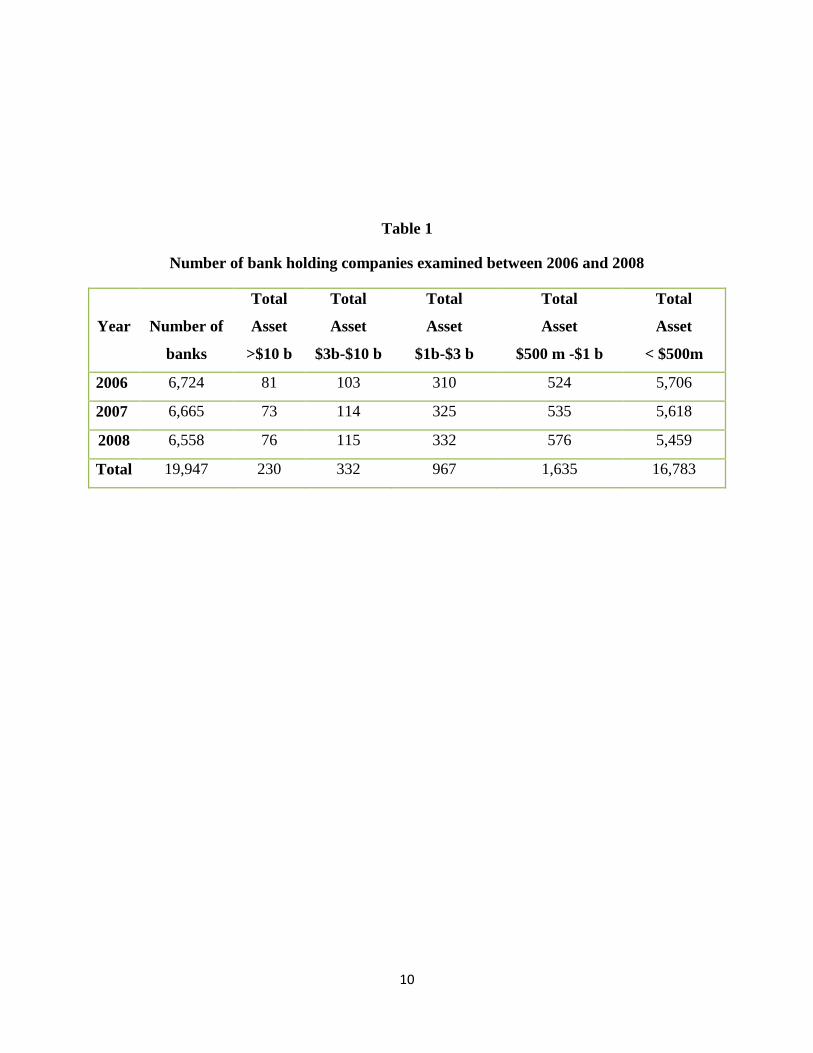
Table 1 classifies the sample of banks into five size-groups according to their end of year asset.
Total asset is classified as greater than $10 billion, $3 billion - $10 billion, $1 billion - $3 billion,
$500 million - $1 billion-$ and less than $500 million.
The total number of banks declined from 2006 to 2008 in the sample. In addition, the sample is
dominated by small sized banks for all the years. The number of small sized banks declined from
2006 to 2008 where as the number of large banks did not decline during the period under study.
This is likely to suggest that the financial crisis hit smaller banks relatively harder, and that the
smaller banks were more likely to be acquired and bought by larger banks.
The Report of Condition and Income identifies 9 types of bank loan: real estate loans, C&I loans,
consumer loans, loans to depository institutions, agricultural loans, obligations of states and
political subdivisions in the US, loans to foreign governments, lease financing receivables and
others. Let Lj,i be the jth
loan type for each bank holding company i (bank) where j=1,2,….k and
i=1,2,…n. If Li is the amount of total loans given by the ith bank, then for the ith
bank
Li = 𝐋𝐣,𝐢𝒌𝒋=𝟏 (1)
Loan portfolio for each bank is measured by the share of each loan type from total loans (Si,j)
The share of each loan type, Sj,i , from total loans for the ith
bank is the unit of analysis in this
study and is calculated as
𝑆𝑗 ,𝑖 = Lj ,i
Li (2)
5
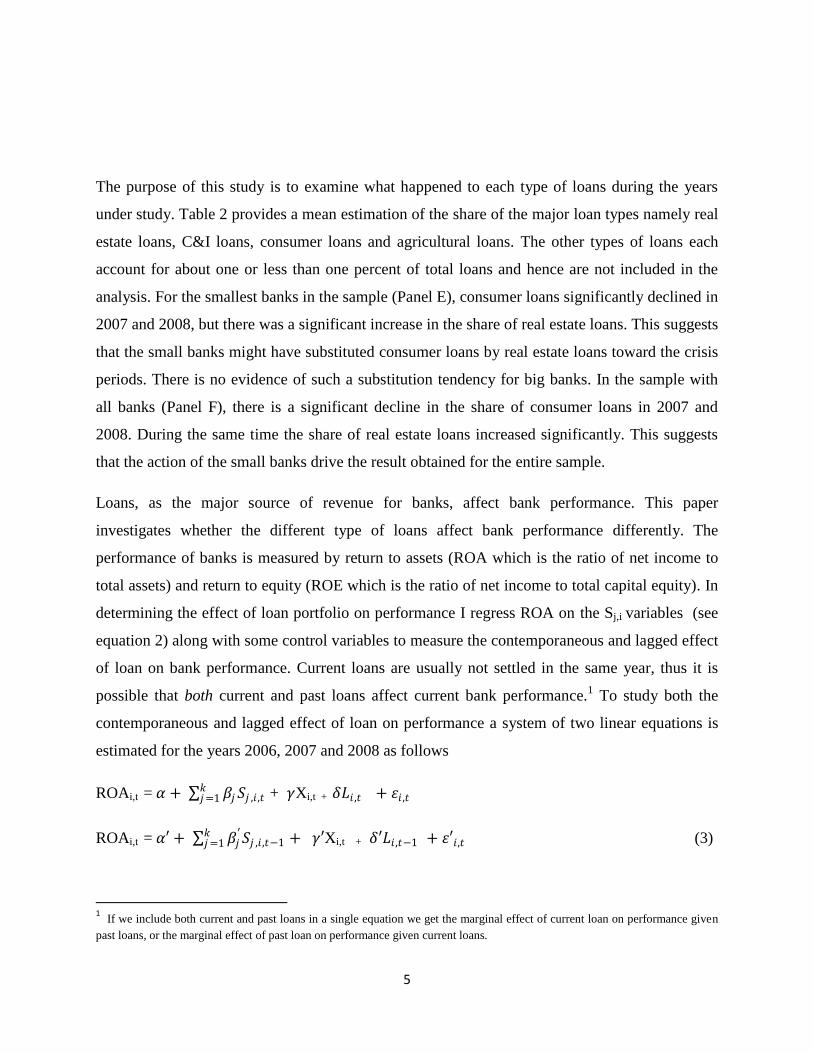
The purpose of this study is to examine what happened to each type of loans during the years
under study. Table 2 provides a mean estimation of the share of the major loan types namely real
estate loans, C&I loans, consumer loans and agricultural loans. The other types of loans each
account for about one or less than one percent of total loans and hence are not included in the
analysis. For the smallest banks in the sample (Panel E), consumer loans significantly declined in
2007 and 2008, but there was a significant increase in the share of real estate loans. This suggests
that the small banks might have substituted consumer loans by real estate loans toward the crisis
periods. There is no evidence of such a substitution tendency for big banks. In the sample with
all banks (Panel F), there is a significant decline in the share of consumer loans in 2007 and
2008. During the same time the share of real estate loans increased significantly. This suggests
that the action of the small banks drive the result obtained for the entire sample.
Loans, as the major source of revenue for banks, affect bank performance. This paper
investigates whether the different type of loans affect bank performance differently. The
performance of banks is measured by return to assets (ROA which is the ratio of net income to
total assets) and return to equity (ROE which is the ratio of net income to total capital equity). In
determining the effect of loan portfolio on performance I regress ROA on the Sj,i variables (see
equation 2) along with some control variables to measure the contemporaneous and lagged effect
of loan on bank performance. Current loans are usually not settled in the same year, thus it is
possible that both current and past loans affect current bank performance.1 To study both the
contemporaneous and lagged effect of loan on performance a system of two linear equations is
estimated for the years 2006, 2007 and 2008 as follows
ROAi,t = 𝛼 + 𝛽𝑗𝑆𝑗 ,𝑖 ,𝑡𝑘𝑗=1 + 𝛾Xi,t + 𝛿𝐿𝑖 ,𝑡 + 휀𝑖 ,𝑡
ROAi,t = 𝛼′+ 𝛽𝑗′𝑆𝑗 ,𝑖 ,𝑡−1
𝑘𝑗=1 + 𝛾′Xi,t + 𝛿′𝐿𝑖 ,𝑡−1 + 휀′𝑖,𝑡 (3)
1 If we include both current and past loans in a single equation we get the marginal effect of current loan on performance given
past loans, or the marginal effect of past loan on performance given current loans.
6
Where E (휀𝑖 ,𝑡) = E (휀′𝑖 ,𝑡) = 0 but E (휀𝑖 ,𝑡 , 휀′𝑖,𝑡) ≠ 0, i=1,2,…n, j=1,2,..k and t=2006, 2007, 2008.
X is a list of control variables including size of the bank, riskiness of loans measured by loan loss
allowance and capital measure by total equity capital.
𝛽𝑗 measures the direct effect of current year’s share of the j’th loan type on current bank
performance, 𝛽′𝑗 measures the direct effect of previous year’s share of the j’th loan type on
current performance, 𝛿 measures the effect of current total loans on current performance and 𝛿′
measures the effect of previous year’s total loan on current performance.
At first glance, the above equations may seem unrelated, but the equations are related through
the correlation of the error terms. Elements of 휀𝑖 ,𝑡 may be contemporaneously correlated to
elements of 휀′𝑖,𝑡 due to the common dependent variable. In addition, a common regressor Xi,t is
used for both equations, and for all time periods. Thus, in empirical tests, it would be incorrect
to exclusively rely on the conclusions drawn from Ordinary Least Squares. For such a series of
equations Greene (2008) proposed the use of seemingly unrelated regression (SUR) to get
efficient estimates of the coefficients. SUR is a technique used for analyzing a system of multiple
equations with cross-equation parameter restrictions and correlated error terms (Greene, 2008).
In this case, SUR estimates obtained from a cross section of banks would be more efficient than
OLS equation-by-equation estimates. The advantage of a cross sectional data is that it helps to
see the difference in the performance across banks and to identify whether banks with a certain
loan type had better performance than the rest.
3. Empirical Results and Discussion
3.1 The impact of current and previous loans on performance
To determine the impact of loans on the performance of bank holding companies, only banks
with at least one higher holding company are included in the sample. Some 4,805 commercial
banks are single banks and are excluded from the sample to form a sample of 15,142
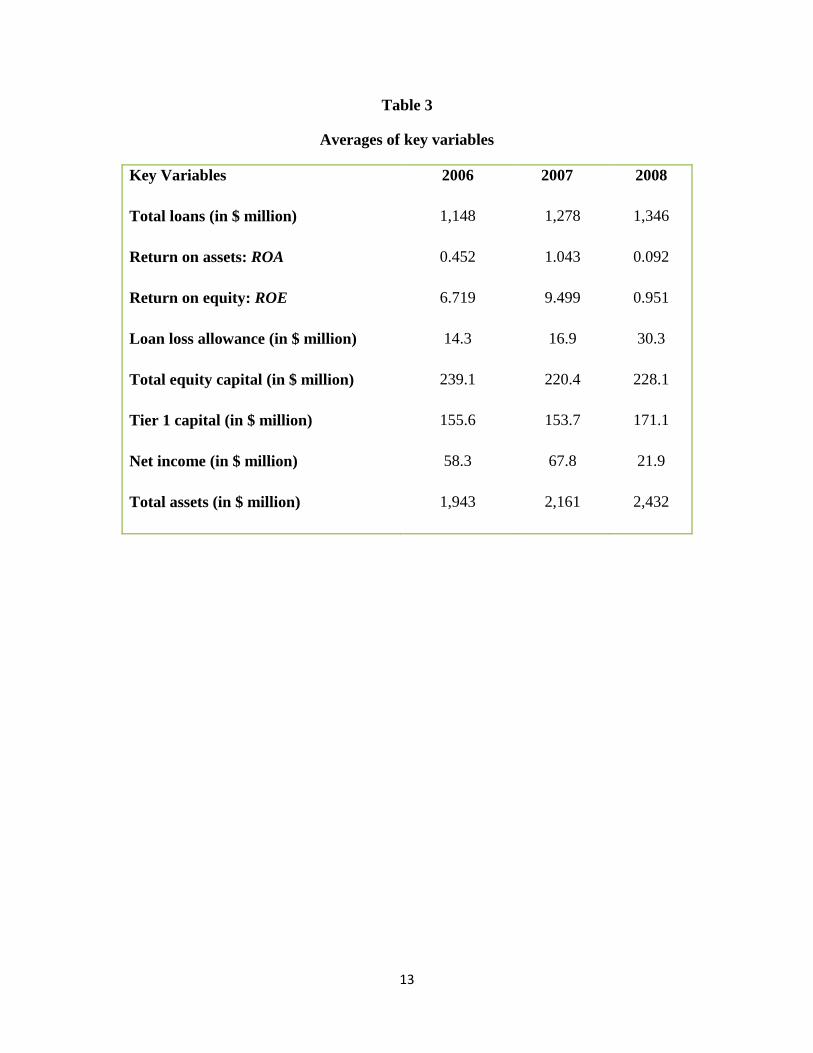
observations. In this sample, most banks have a lower average performance in 2008 as compared
to 2007, but a lower aggregate loan in 2007 as compared to 2008. Thus, in 2008 higher loans
seem to have been associated with a lower performance. In 2008, the average size of banks is
higher than both 2007 and 2008 which suggests that smaller banks might have disappeared in
7
2008 due to mergers or acquisition by bigger banks. Table 3 summarizes the key variables used
in the study for the years 2006-08.
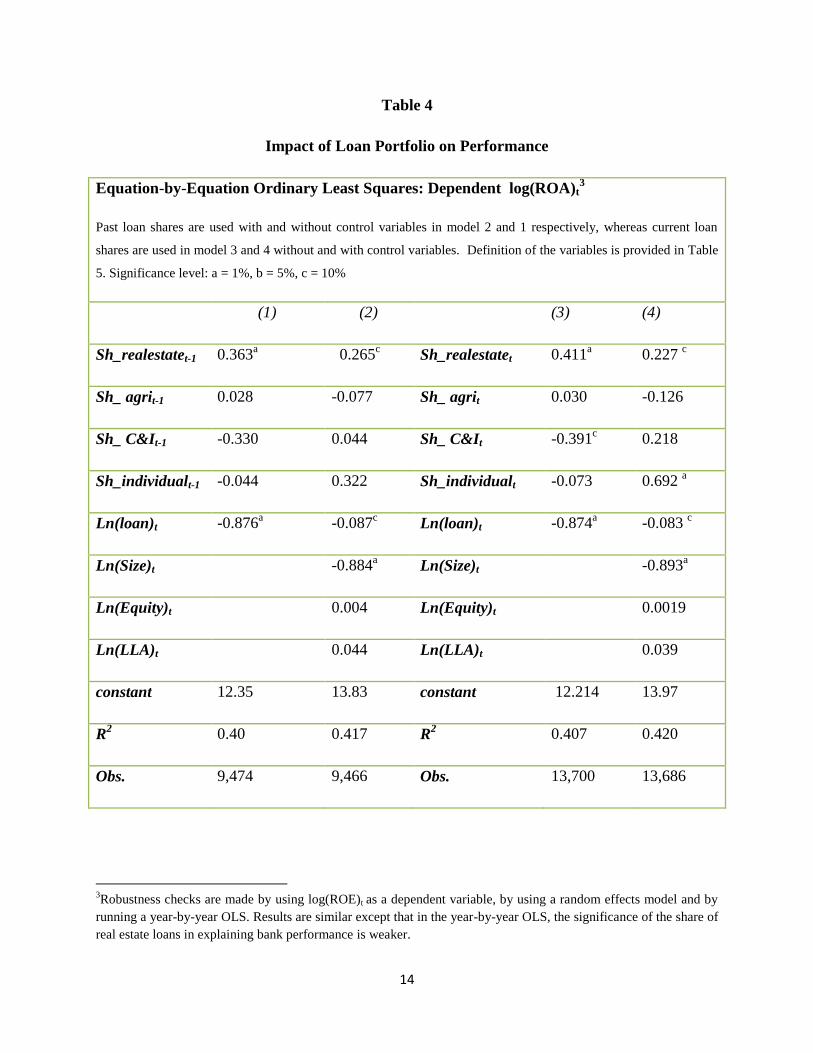
The share of real estate loans, agricultural loans, loans to individuals and C&I loans take a higher
share in total loans, thus those are the only types of loans included in the regression. To estimate
the effect of past and current loan portfolio on current bank performance equation-by-equation
Ordinary Least Squares is initially applied to the sample of banks. Table 4 presents regression
results using four alternative models excluding and including control variables.
The amount of current and past aggregate loan is negatively related to current performance.
Those banks which gave out higher levels of total loans had a lower return on asset; this may be
due to many reasons including default risks associated with different types of loans in addition to
the inherent risk of individual loans.
The estimation results suggest that both past and current loan to the real estate sector have a
significant positive impact on performance, even after controlling for size, capital and risk.
Banks which give more loans for the purpose of residential and non-residential property
construction had the highest performance. Both previous year and current year loans to the real
estate sector are important for performance of banks. Similarly, banks with a higher share of
current consumer loans have a higher current performance, and this holds true after controlling
for the effect of asset, capital and risk.
A surprising result is that bank size is negatively related to performance; bigger banks tend to
have a lower return on assets. This may be because larger banks have the capacity to give out
larger loans which when defaulted affect bank performance negatively or it may be due to the
higher exposure to risky activities.
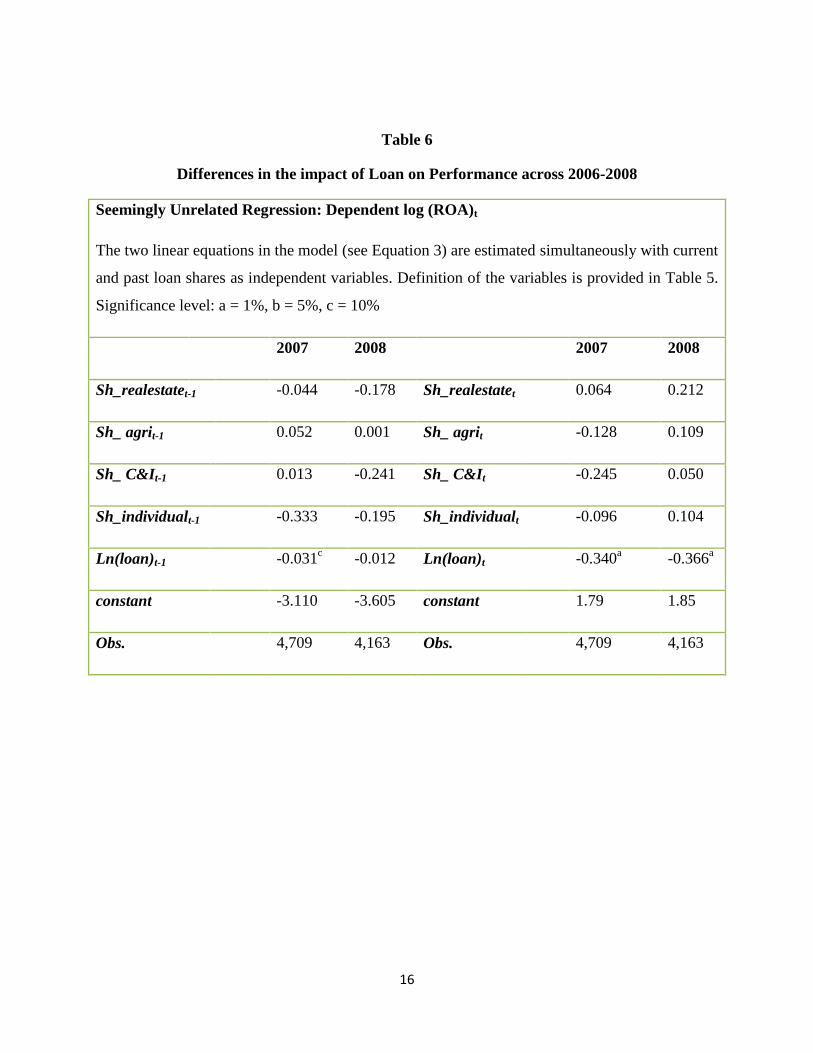
3.2. Differences in the impact of loan on performance across 2006-2008
As argued in section 2, analysis based only on OLS is not sufficient since it generates inefficient
coefficients. To analyze and compare the effect of loan portfolio on performance during and
before the financial crisis a seemingly unrelated regression (SUR) is used. Table 6 presents
results from the SUR regression.

8
The composition of both previous and current year’s loan are not a significant determinant of
current bank performance. It did not matter to which sector banks were lending and hence the
loan portfolio was not a determinant of bank performance in the years 2007 and 2008. But total
loans significantly and negatively affect current performance in both 2007 and 2008 suggesting
that only the size of aggregate loans and not the decomposition of loan affect performance during
the financial crisis (2007-08). Unlike the OLS results, the SUR regressions produce no
significant effect of loan portfolio on bank performance; as long as banks gave out lower
aggregate loans they would have higher performance in subsequent years
The results for 2006 produced very small and statistically insignificant coefficients and are not
reported. Similar results are obtained when controlling2 for size, capital and risk. The coefficient
on bank size is negative and highly significant. Consistent with the OLS results, total loans
continue to have a negative impact on bank performance. The OLS regression produced a
positive effect of lending to the real estate sector. This difference occurs because the OLS
results measure the effect of change in current loan portfolio on current performance and the
effect of change in past loan portfolio on current performance independently where as in the
SUR the simultaneous effect of past and current loan portfolio create no effect on current
performance. Therefore, if we separate past real estate loans and current real estate loans, these
variables independently affect current performance. But their simultaneous change has no
significant effect on performance.
6. Conclusions
The study investigates possible differences in the loan portfolio of US bank holding companies
in the years 2006-2008. For the larger banks there is no significant change in loan portfolio in
2007 and 2008 as compared to 2006. However, for small banks, the share of real estate loans
slightly increased in 2008 where as the share of consumer loans declined, suggesting some
possible substitution of consumer loans by real estate loans.
2 Additional controls used are interest and non-interest income. Interest income has a significant positive coefficient suggesting
that returns from loans are important determinants of bank performance. The significance or the signs of the loan portfolio
variables were unaltered by the inclusion of additional controls.

9
The study also examines the effect of loan on the performance of US bank holding companies.
The regression model provides consistence evidence that higher aggregate loans (both past and
current) were associated with lower bank performance. Higher current real estate loans and
higher past real estate loans are independently associated with higher bank performance, but
there is no sufficient evidence for a simultaneous effect of current and past real estate loans on
bank performance. In addition, there is no sufficient evidence to claim that the effect of loan
portfolio on performance does differ in the years 2006-07.
10
Table 1
Number of bank holding companies examined between 2006 and 2008
Year
Number of
banks
Total
Asset
>$10 b
Total
Asset
$3b-$10 b
Total
Asset
$1b-$3 b
Total
Asset
$500 m -$1 b
Total
Asset
< $500m
2006 6,724 81 103 310 524 5,706
2007 6,665 73 114 325 535 5,618
2008 6,558 76 115 332 576 5,459
Total 19,947 230 332 967 1,635 16,783

11
Table 2
Loan Composition indicators: 2006-2008
Panel A contains results for banks with end of year total asset greater than $10 billion, Panel B contains results for
banks with total asset $3 billion-$10 billion, Panel C contains results for banks with asset $1 billion-$3 billion, Panel
D contains results for banks with total asset 500 million-$1 billion, Panel E contains results for banks with asset less
than $500 million and Panel F contains results for all banks in the sample. Tests are made for differences in the
mean of the values between 2006 & 2007 and between 2007 & 2008. The level of significance is reported for those
differences which are significant, where a=difference in 2006 & 2007 at 1% level, b=difference in 2006 & 2007 at
5% level, c=difference in 2006 & 2007 at 10% level, d=difference in 2007 & 2008 at 1% level, e=difference in 2007
& 2008 at 5% level and f=difference in 2007 & 2008 at 10% level. The mean values of Sj,t are calculated over the
entire banks in each group and the averages are reported for the three years below. Values are expressed in
percentage. The null hypothesis tested is: Ho: 1
𝑛 Sj,t,i𝑖 −
1
𝑛 Sj,t′ ,i𝑖 = 0 , t & t’ represent years 2006,2007 and 2008
where t≠ t’
Loan composition indicators : 2006-2008
Panel A: Banks with total assets > $ 10 b 2006 2007 2008
Real estate loans to total loans 59.6 60.0 57.4
1. Agricultural loan to total loans 0.5 0.5 0.4
C&I loans to total loans 19.8 21.1 21.9
Consumer loan to total loans 9.9 9.7 11.8
Real estate loans to total asset 38.9 39.8 37.6
Agricultural loan to total asset 0.3 0.3 0.3
C&I loans to total asset 12.3 13.5 12.9
Consumer loan to total asset 5.9 6.0 7.5
Panel B: Banks with total assets $3 b-$10 b
Real estate loans to total loans 69.1 70.2 70.9
Agricultural loan to total loans 1.2 1.1 1.1
C& I loans to total loans 18.3 18.2 18.9
Consumer loan to total loans 7.1 6.4 4.9
Real estate loans to total asset 47 48.3 48.6
Agricultural loan to total asset 0.8 0.8 0.7
C&I loans to total asset 11.8 12.2 12.8
Consumer loan to total asset 4.7 4.2 3.3
Panel C: Banks with total assets $1b-$3b
Real estate loans to total loans 75.9 75.7 75.6
Agricultural loan to total loans 1.6 1.5 1.7
C&I loans to total loans 13.9 14.1 14.2
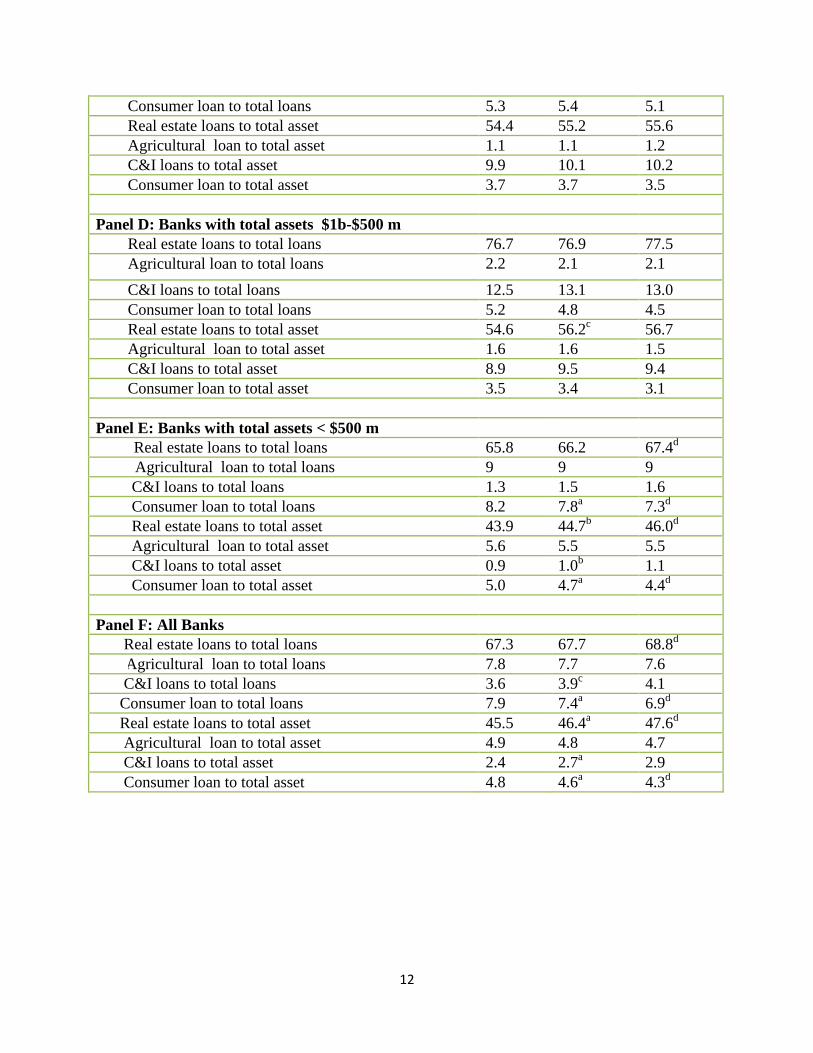
12
Consumer loan to total loans 5.3 5.4 5.1
Real estate loans to total asset 54.4 55.2 55.6
Agricultural loan to total asset 1.1 1.1 1.2
C&I loans to total asset 9.9 10.1 10.2
Consumer loan to total asset 3.7 3.7 3.5
Panel D: Banks with total assets $1b-$500 m
Real estate loans to total loans 76.7 76.9 77.5
Agricultural loan to total loans 2.2 2.1 2.1
C&I loans to total loans 12.5 13.1 13.0
Consumer loan to total loans 5.2 4.8 4.5
Real estate loans to total asset 54.6 56.2c
56.7
Agricultural loan to total asset 1.6 1.6 1.5
C&I loans to total asset 8.9 9.5 9.4
Consumer loan to total asset 3.5 3.4 3.1
Panel E: Banks with total assets < $500 m
Real estate loans to total loans 65.8 66.2 67.4d
Agricultural loan to total loans 9 9 9
C&I loans to total loans 1.3 1.5 1.6
Consumer loan to total loans 8.2 7.8a
7.3d
Real estate loans to total asset 43.9 44.7b
46.0d
Agricultural loan to total asset 5.6 5.5 5.5
C&I loans to total asset 0.9 1.0b
1.1
Consumer loan to total asset 5.0 4.7a
4.4d
Panel F: All Banks
Real estate loans to total loans 67.3 67.7 68.8d
Agricultural loan to total loans 7.8 7.7 7.6
C&I loans to total loans 3.6 3.9c
4.1
Consumer loan to total loans 7.9 7.4a
6.9d
Real estate loans to total asset 45.5 46.4a 47.6
d
Agricultural loan to total asset 4.9 4.8 4.7
C&I loans to total asset 2.4 2.7a
2.9
Consumer loan to total asset 4.8 4.6a
4.3d
13
Table 3
Averages of key variables
Key Variables 2006 2007 2008
Total loans (in $ million) 1,148 1,278 1,346
Return on assets: ROA 0.452 1.043 0.092
Return on equity: ROE 6.719 9.499 0.951
Loan loss allowance (in $ million) 14.3 16.9 30.3
Total equity capital (in $ million) 239.1 220.4 228.1
Tier 1 capital (in $ million) 155.6 153.7 171.1
Net income (in $ million) 58.3 67.8 21.9
Total assets (in $ million) 1,943 2,161 2,432
14
Table 4
Impact of Loan Portfolio on Performance
Equation-by-Equation Ordinary Least Squares: Dependent log(ROA)t3
Past loan shares are used with and without control variables in model 2 and 1 respectively, whereas current loan
shares are used in model 3 and 4 without and with control variables. Definition of the variables is provided in Table
5. Significance level: a = 1%, b = 5%, c = 10%
(1) (2) (3) (4)
Sh_realestatet-1 0.363a
0.265c
Sh_realestatet 0.411a
0.227 c
Sh_ agrit-1 0.028 -0.077 Sh_ agrit 0.030 -0.126
Sh_ C&It-1 -0.330
0.044 Sh_ C&It -0.391c
0.218
Sh_individualt-1 -0.044
0.322
Sh_individualt -0.073 0.692 a
Ln(loan)t -0.876a
-0.087c
Ln(loan)t -0.874a
-0.083 c
Ln(Size)t -0.884a
Ln(Size)t -0.893a
Ln(Equity)t 0.004
Ln(Equity)t 0.0019
Ln(LLA)t 0.044
Ln(LLA)t 0.039
constant 12.35 13.83 constant 12.214 13.97
R2 0.40 0.417 R
2 0.407 0.420
Obs. 9,474 9,466 Obs. 13,700 13,686
3Robustness checks are made by using log(ROE)t as a dependent variable, by using a random effects model and by
running a year-by-year OLS. Results are similar except that in the year-by-year OLS, the significance of the share of
real estate loans in explaining bank performance is weaker.

15
Table 5
Definition of Variables
Key Variables
Ln(LLA)t: natural logarithm of loan loss allowance at time t
Ln(Equity)t : natural logarithm of total equity capital at time t
Ln (Size)t: natural logarithm of total asset at time t
Ln(ROA)t : natural logarithm of return on assets, ratio of net income to asset at time t
Sh_realestatet : the share of real estate loans from total loans at time t
Sh_ agrit: the share of agricultural loans from total loans at time t
Sh_ C&It : the share of construction and industrial loans from total loans at time t
Sh_individualt : the share of consumer loans from total loans at time t
16
Table 6
Differences in the impact of Loan on Performance across 2006-2008
Seemingly Unrelated Regression: Dependent log (ROA)t
The two linear equations in the model (see Equation 3) are estimated simultaneously with current
and past loan shares as independent variables. Definition of the variables is provided in Table 5.
Significance level: a = 1%, b = 5%, c = 10%
2007 2008 2007 2008
Sh_realestatet-1 -0.044 -0.178 Sh_realestatet
0.064 0.212
Sh_ agrit-1 0.052 0.001 Sh_ agrit -0.128 0.109
Sh_ C&It-1 0.013 -0.241 Sh_ C&It
-0.245
0.050
Sh_individualt-1 -0.333 -0.195 Sh_individualt -0.096 0.104
Ln(loan)t-1
-0.031c
-0.012 Ln(loan)t
-0.340a
-0.366a
constant -3.110 -3.605 constant 1.79 1.85
Obs. 4,709 4,163 Obs. 4,709 4,163

17
Bibliography
Acharya, Viral V, Iftekhar Hasan, and Anthony Saunders. "The Effect of Focus and
Diversification on Bank Risk and Return: Evidence from individual Bank Portfolios." March 15,
2002.
Athanasoglou, Panayiotis P, Sophocles N Brissimis, and Matthaios D Delis. "Bank specific,
Industry specific and Macroeconomic determinants of Bank Profitability." Bank of Greece, June
2005.
Chari V.V, Lawrence Christiano, and Patrick J. Kehoe. "Facts and Myths about the Financial
crisis of 2008." Working Paper 666. Federal Reserve Bank of Minneapolis, October 2008.
Cohen-Cole, Ethan, Burcu Duygan-Bump, Jose Fillat and Judit Montoriol-Garriga. "Looking
behind the Aggregates: A reply to " Facts and Myths about the Financial Crisis of 2008".
Quantitaive Analysis Unit. Federal Bank of Boston, November 2008.
Contessi, Silvio, and Hoda El-Ghazaly. Commercial bank lending data during the crisis: handle
with care. Short essays and reports on the economic issues of the day, Saint Louis: Federal
Reserve Bank of St. Louis, 2009.
Contessi, Silvio, and Johanna L Francis. "U.S. Commercial Bank Lending through 2008:Q4:
New Evidence from Gross Credit Flows." Research Division Working paper series. St Louis:
Federal Reserve Bank of St Louis, March 2009.
Cornett, Marcia Million, Jamie John McNutt, Hassan Tehranian. "The Financial Crisis: Did
Corporate Governance affect the Performance of Publicly-Traded U.S Bank Holding
Companies?" September 2009.
Demirguc-Kunt, Asli, and Harry Huizinga. "Financial Structure and Bank Profitability." January
2000.
Greene, William. "Econometric Analysis”. Prentice Hall, 6e, 2008
Ivashina, Victoria, and David Scharfstein. "Bank Lending During the Financial Crisis of 2008."
November 5, 2008.
______________."Loan Portfolio Management." Comptroller’s Handbook. Comptroller of the
Currency Administrator of National Banks, April 1998.
Saunders, Anthony. Financial Institutions Management: A Risk Management Approach, 6e. New
York University, 2008.