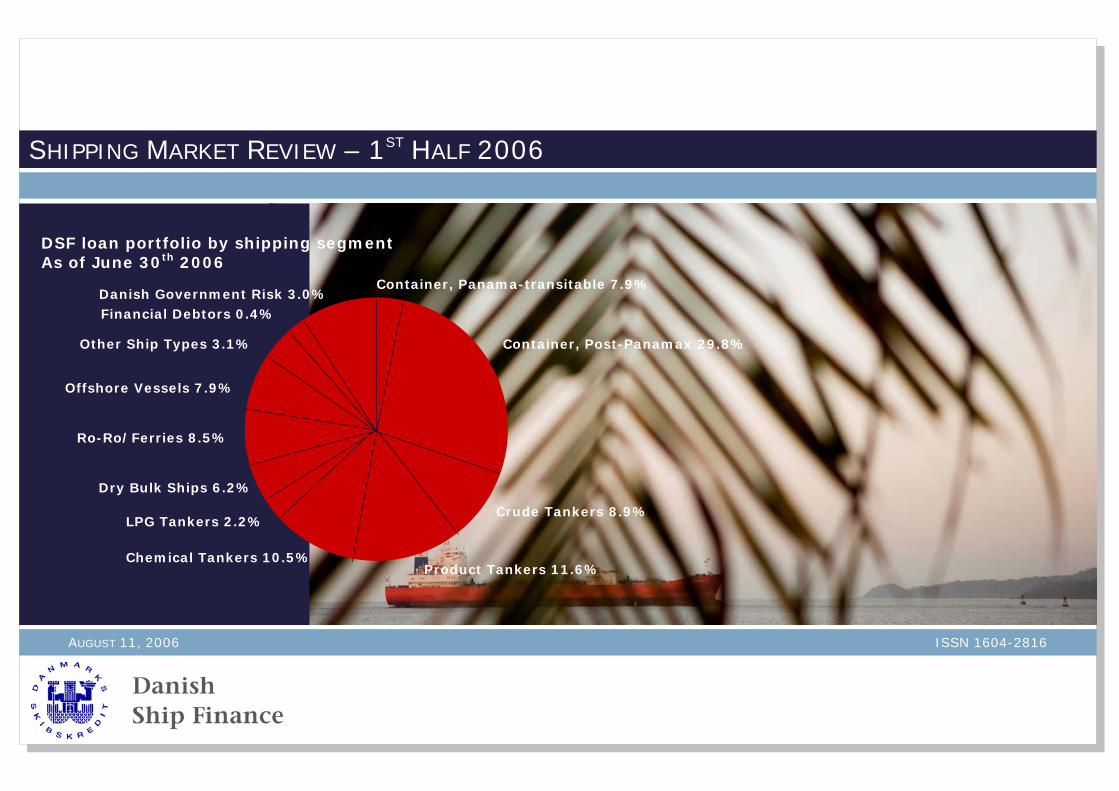
dsf loan portfolio by shipping segment
TRANSCRIPT
SHIPPING MARKET REVIEW – 1ST HALF 2006
AUGUST 11, 2006 ISSN 1604-2816
Danish Government Risk 3.0%Financial Debtors 0.4%
Other Ship Types 3.1%
Ro-Ro/Ferries 8.5%
LPG Tankers 2.2%
Chemical Tankers 10.5% Product Tankers 11.6%
Crude Tankers 8.9%
Container, Post-Panamax 29.8%
Container, Panama-transitable 7.9%
Offshore Vessels 7.9%
Dry Bulk Ships 6.2%
DSF loan portfolio by shipping segment As of June 30th 2006

Danish Ship Finance (Danmarks Skibskredit)
Please read carefully the disclaimer at the end of this report. This report reviews the central developments in the period from January to June of 2006 for the main shipping segments in which Danish Ship Finance has exposure, and indicates possible future market directions.
General Review & Outlook In the last 6-7 months the majority of shipping markets has displayed unusually high freight rates during the otherwise seasonally low summer period, and most newbuilding and secondhand ship prices have resumed an upward path.
Newbuilding prices have entered a new phase of increases as extraordinarily large numbers of tanker contracts were signed ahead of the April 1st implementation date of the Common Structural Rules. Furthermore, contracting volumes of containerships have staged a comeback and LPG ship contracting continues to exhibit great volumes. Consequently, shipyards have managed to maintain their 3-year orderbook backlog and thus to maintain their considerable pricing power versus the shipowners.
Both dry bulk and crude tanker demand were powered by a reacceleration of China’s economic growth which has led to a surprisingly strong demand for iron ore and petroleum imports. In addition, demand for dry bulk ships, crude and product tankers was temporarily boosted by rebuilding of the hurricane devastated areas in the US Gulf of Mexico, which temporarily required higher imports of for instance steel, cement, crude oil and product oil.
Although high petroleum prices generally are viewed as destructive for global economic growth, several shipping segments have experienced improved demand because of it. Car carriers have seen greater deep sea transport requirements as high oil revenues have boosted Middle East imports of European luxury cars and as high fuel costs have boosted American imports of fuel-efficient cars. Furthermore, the relatively best freight rate improvement comes from the offshore supply vessel sector, where high oil and gas prices have caused a surge in exploration and production activity that subsequently has pushed charter rates to levels significantly above previous records.
But speaking from the vantage point of a dedicated ship financier with long-term interests in the shipping business, several issues must be highlighted as they provide us with evidence that at least some of the strength we have been witness to in recent years may be running out of steam. The effects of rising interest rates on US consumption have so far been limited as the majority of variable interest rate mortgage loans are not to be reset until the end of 2006 and into 2007. But as the mortgages are gradually being reset during the coming 6-12 months, US household consumption and apparent resilience against rising oil prices may most likely start to show clear signs of weakness. Unfortunately, the US government is already running a significant deficit, and the US Federal Reserve now has much less leeway than in 2001 to lower interest rates as mounting inflation pressures threaten monetary stability. Their abilities to once again jumpstart US economic growth are thus increasingly limited. As the US slowdown is largely concerning the consumption ability of US households, it is at least in the short to medium term mostly concerning the outlook for the container shipping segments. More importantly, the prosperity of other shipping segments will largely depend on the extent to which the rest of the world can counteract an economic slowdown in the US. The other great driver of world shipping demand has been the Chinese economy. But as the Chinese economy is showing signs of overheating particularly in the sectors that drive Chinese imports of seaborne products, the prosperity of the shipping markets thus also depends on the Chinese government’s abilities to prevent it from experiencing a hard landing. Economic overheating will in near term create great shipping demand, but a following hard landing will have very negative ramifications for almost all shipping markets. In conclusion, the remainder of 2006 is probably to be yet another profitable period for almost every shipping market as global macro-economic imbalances continue to exert positive influence on China’s investments and import growth. But beyond 2006, a slowdown in the US economy coupled with an uncertain future in China may most likely lead to lower freight rates and ship prices
3 Danish Ship Finance (Danmarks Skibskredit)
Executive Summary o Ship Building: Prices rebound as particularly tanker contracting
activity surges, partly due to new building rules. Shipyards need continued high contracting activity and strong freight markets to prevent prices from falling in the next 6-12 months.
o Container Ships: Significantly lower freight rates as supply
growth beats demand growth and competition toughens. Contracting activity revives despite an uncertain outlook for demand coupled with excessive fleet growth.
o Crude Tankers: Exceptionally resilient spot market beats the
usual summer lull. Contracting of new ships shoots sky-high ahead of the implementation of the Common Structural Rules. The positive outlook is increasingly dependant on China to import oil.
o Product Tankers: First quarter freight rate collapse as US and
Asian demand momentarily slows. Without any new significant refinery outages in the US Gulf, the fall and winter product tanker market may disappoint.
o Chemical Tankers: Deep sea freight rates gradually moved
towards ‘normal’ as the US chemical industry returned to production after extensive hurricane related outages. Contracting activity and secondhand prices continued upwards.
o LPG Tankers: Still very strong freight rates as a cold winter in
Japan, South Korea and Europe compensates for a warm US
winter and slowing Chinese imports. The short and medium term outlook is still rather positive, but the longer-term outlook is questionable.
o Dry Bulk Ships: Continued freight rate volatility as China built
iron ore stocks and growth in global steel demand beats expectations. Contracting stays subdued despite limited orderbook and much improved freight rate expectations for the coming 6-12 months.
o Car Carriers: An exceptionally tight car carrier charter market
prevents the large liner operators from fully optimizing their trade networks. Contracting stays relatively strong and prices edge up as the outlook remains positive despite high fleet growth.
o Ro-Ro/Ferries: Passenger ferries are still fighting low cost
airlines whereas the Ro-Ro market has regained a bit throughout 1st half of 2006. Fleet capacity is stable with low contracting and demolition activities. The Ro-Ro market is expected to gain further.
o Offshore Support Vessels: Previous records have been
significantly beaten as AHTS dayrates sky-rocket. Consequently, orders of new ships and secondhand prices boom similarly. The outlook for 2006 remains very healthy, but the outlook for 2007 may show a setback as fleet grows.
SS HH II PP BB UU II LL DD II NN GG . . . . . . . . . . . . . . . . . . . . . . . . . . . . . . . . . . . . 4
CC OO NN TT AA II NN EE RR SS HH II PP SS . . . . . . . . . . . . . . . . . . . . . . . . . . . . . . . . . 8
CC RR UU DD EE TT AA NN KK EE RR SS . . . . . . . . . . . . . . . . . . . . . . . . . . . . . . . . . . 1 4
PP RR OO DD UU CC TT TT AA NN KK EE RR SS . . . . . . . . . . . . . . . . . . . . . . . . . . . . . . . . 2 1
CC HH EE MM II CC AA LL TT AA NN KK EE RR SS . . . . . . . . . . . . . . . . . . . . . . . . . . . . . . . 2 4
LL PP GG TT AA NN KK EE RR SS . . . . . . . . . . . . . . . . . . . . . . . . . . . . . . . . . . . . . 2 6
DD RR YY BB UU LL KK SS HH II PP SS . . . . . . . . . . . . . . . . . . . . . . . . . . . . . . . . . . 3 0
CC AA RR CC AA RR RR II EE RR SS . . . . . . . . . . . . . . . . . . . . . . . . . . . . . . . . . . . . 3 6
RR OO -- RR OO // FF EE RR RR II EE SS . . . . . . . . . . . . . . . . . . . . . . . . . . . . . . . . . . 3 7
OO FF FF SS HH OO RR EE SS UU PP PP OO RR TT VV EE SS SS EE LL SS . . . . . . . . . . . . . . . . . . . . 3 8
GG LL OO SS SS AA RR YY . . . . . . . . . . . . . . . . . . . . . . . . . . . . . . . . . . . . . . . . . 4 1

4 Danish Ship Finance (Danmarks Skibskredit)
SShh ii pp BBuu ii ll dd ii nngg
Prices rebound slightly as particularly tanker contracting activity surges, partly due to new building rules. Shipyards need a continued high contracting activity and strong freight markets to prevent prices from falling in the next 6-12 months.
CONTRACTING PRICES
Rebounding prices particularly in the tanker segments During the latest six months contracting prices have staged a clear rebound as exceptionally large volumes of oil and gas tanker orders have meant that the shipyards, for the moment being, have been able to maintain their 3+ year order backlog and significant pricing power. But the price rebound has so far been mostly concerning the ship types (oil tankers, LNG tankers) that have seen the exceptionally high contracting volumes, whereas newbuilding prices of other ship types such as dry bulk ships, container ships and LPG vessels so far have remained relatively steady.
Since prices bottomed out in late 2005, oil tanker newbuilding prices have increased by about 6% and LPG newbuilding prices have increased by about 5%, according to data from Clarkson and Fearnleys. Conversely, newbuilding prices on container ships have only increased by about 2% and dry bulk ships by about 0-1%.
Adding to the upward movement has been a stronger South Korean Won against the USD combined with still high steel plate prices, which have provided the yards with plentiful ammunition in their price negotiations. Additionally, a lack of capacity at the yard’s subcontractors has by now forced supply costs upwards.
Particularly the supply of the largest and most modern diesel electric engines for LNG ships is now so scarce that buyers of LNG ships are offered the older steam turbine engine, if they do not wish to pay a significant premium. These underlying costs pressures should for the next 1-2 years prevent the newbuilding prices from falling drastically – although they can not completely prevent the ship prices from falling altogether.
5 Danish Ship Finance (Danmarks Skibskredit)
CONTRACTING ACTIVITY
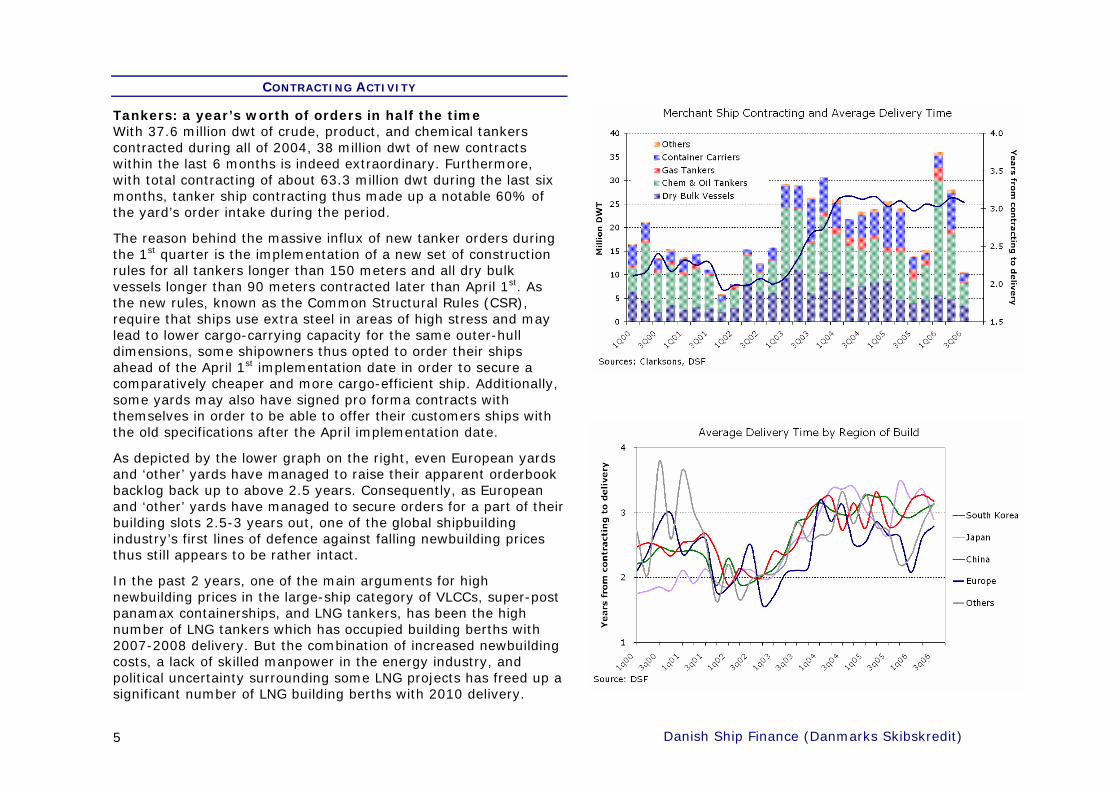
Tankers: a year’s worth of orders in half the time With 37.6 million dwt of crude, product, and chemical tankers contracted during all of 2004, 38 million dwt of new contracts within the last 6 months is indeed extraordinary. Furthermore, with total contracting of about 63.3 million dwt during the last six months, tanker ship contracting thus made up a notable 60% of the yard’s order intake during the period.
The reason behind the massive influx of new tanker orders during the 1st quarter is the implementation of a new set of construction rules for all tankers longer than 150 meters and all dry bulk vessels longer than 90 meters contracted later than April 1st. As the new rules, known as the Common Structural Rules (CSR), require that ships use extra steel in areas of high stress and may lead to lower cargo-carrying capacity for the same outer-hull dimensions, some shipowners thus opted to order their ships ahead of the April 1st implementation date in order to secure a comparatively cheaper and more cargo-efficient ship. Additionally, some yards may also have signed pro forma contracts with themselves in order to be able to offer their customers ships with the old specifications after the April implementation date.
As depicted by the lower graph on the right, even European yards and ‘other’ yards have managed to raise their apparent orderbook backlog back up to above 2.5 years. Consequently, as European and ‘other’ yards have managed to secure orders for a part of their building slots 2.5-3 years out, one of the global shipbuilding industry’s first lines of defence against falling newbuilding prices thus still appears to be rather intact.
In the past 2 years, one of the main arguments for high newbuilding prices in the large-ship category of VLCCs, super-post panamax containerships, and LNG tankers, has been the high number of LNG tankers which has occupied building berths with 2007-2008 delivery. But the combination of increased newbuilding costs, a lack of skilled manpower in the energy industry, and political uncertainty surrounding some LNG projects has freed up a significant number of LNG building berths with 2010 delivery.

6 Danish Ship Finance (Danmarks Skibskredit)
Additionally, there are already a number of open LNG building slots with 2009 delivery, which in due time could be switched to container or crude tanker building instead. Yards are in the next 1-2 years thus increasingly reliant on the container and tanker freight markets to perform above standard in order to maintain their pricing power in these important large-ship segments.
OUTLOOK Continued high contracting is needed to prevent a price fall As we argued in the previous report from February 2006, the global shipbuilding community would need a considerable volume of new orders during 2006 to prevent the orderbook backlog from shortening significantly from its current 3+ years. So far, yards have managed to defer the inevitable price fall partly by encouraging tanker shipowners to purchase the old design now rather than wait for the CSR to be implemented. But with no new significant changes on the drawing board which can bring forward any new orders, yards are in the future almost entirely dependent on freight markets to perform above norm in order to secure the required order volumes necessary to maintain a 3-year backlog.
Nonetheless, during the next 6 months or so, the likelihood of a significant drop in contracting activity for every one of the large ship segments is rather limited. Particularly the high secondhand prices compared to newbuilding prices (see lower graph page 4) theoretically act as a lower limit as to how far newbuilding prices can fall before it becomes economically preferable to order new rather than buying secondhand. Thus unless secondhand prices fall compared to newbuilding prices, the lower graph on page 4 implies that it is still rather likely that in particular the LPG and oil tanker segments will see continued healthy contracting activity.
The order intake required during the coming 12-month period to maintain a backlog of above 3 years is about 105 million dwt. This is almost on level with the contracting level exhibited in the record-year 2003, when about 115 million dwt were contracted. As all of 2005 provided yards with 75 million dwt, and given that
the current orderbook for most ship segments already implies a considerable fleet growth 2-3 years ahead, much more than 90 million dwt of new orders in the next 12 months sound somewhat unlikely. Consequently, by the middle of next year the average delivery time may be ¼-½ years lower than now, thus leaving shipyards with significantly less pricing power.
Although both shipyard utilization and forward orderbook cover are probably to descent from their current highs, both factors are in a historic perspective to remain at reasonable levels for the foreseeable future. Additionally, currency movements, steel costs, and other construction costs are still squeezing yards’ profit margins, thereby preventing newbuilding prices from falling too low, too fast. In conclusion, global shipyard competition to secure a full orderbook is expected to increase in coming years and coupled with a contracting slowdown it will act as a negative pressure on newbuilding prices. Conversely, several factors may at least in the next 6-12 months act in the opposite direction, thereby keeping newbuilding prices from falling too fast, too low

7 Danish Ship Finance (Danmarks Skibskredit)
Fleet & Orderbook as per July 31 by Region of Build and Year of Delivery (Excludes allowances for possible slippage from scheduled delivery dates)
The Japanese orderbook may appear smaller than it actually is, as Japanese yards have a tendency not to register their orders until shortly before the actual ship building takes place.

8 Danish Ship Finance (Danmarks Skibskredit)
CCoonn ttaa ii nnee rr SShh ii ppss Significantly lower freight rates as supply growth beats demand growth and competition toughens. Contracting activity revives despite an uncertain outlook for demand coupled with excessive fleet growth.
FREIGHT RATES
Declining freight and T/C rates but high utilization Timecharter rates declined on average 10% in the first quarter com-pared to the 4q05 whereas they regained on average 3.5% (qoq) in the 2nd quarter. Despite the fact that deliveries to the charter seg-ments were modest, timecharter rates came under pressure. This may indicate that at least the charter market has overreacted to the announcement of expected overcapacity. With respect to the length of the timecharter period, it seems that the current drop in time-charter rates has reached a level where liner operators find it fitting to secure longer time charter periods, indicating more positive expectations for demand. By end of 2005, the average charter period was around 9-12 months, but by now it has grown to about 18-20 months.
On the freight market, it appears that despite rising operating costs, average freight rates per teu on the two main head-haul legs (Asia to North America and Asia to Europe) declined by an average 9% in 1q06 compared to 4q05, with the biggest reductions on the Asia to Europe leg, according to ‘Chineseshipping.com’. In the 2nd quarter, freight rates per teu continued to decline by an average 3% compared to 1q06 as the usual and much proclaimed peak season surcharge seemed to disappoint. Thus 1st half 2006 freight rates ended 10-18% below 1st half 2005. Against logic, the much lower freight rates and the apparent absence of a peak season surcharge stand in contrast to the repeated statements from the liner operators of full ships and no spare capacity throughout much of the 1st quarter. A part of the explanation could be that one or more of the major line operators have struggled with reshuffling of ship capacity and/or cascading activity (the replacement of existing ships by new, larger vessels), which temporarily may have removed some fleet capacity, providing other operators with better capacity utilization.

9 Danish Ship Finance (Danmarks Skibskredit)
Sources: DSF, Global Insight

10 Danish Ship Finance (Danmarks Skibskredit)
SUPPLY & DEMAND
A supply surplus has replaced a tight freight market The monthly figures on global port container handling growth, publis-hed by the British consultancy firm Drewry Shipping Consultants, have in the 1st quarter of 2006 depicted an acceleration from 8.4% in 1q05 to 11.4% in 1q06, measured year-on-year, but a deceleration from 12.2% growth in the 4th quarter of 2005. The year-on-year acceleration may primarily be ascribed to increased intra-Asian trade growth and, to a lesser degree, West European import growth. Conversely, the North American and Eastern European imports have faced a substantial growth slowdown in 1q06 compared to 1q05. The preliminary data for 2q06 suggest that these trends have continued into 2q06. The impact of intra-Asian trade growth on head-haul demand (teu-nm) is rather limited and hence has a relative lesser effect on freight rates.
Comparatively, the containership fleet has grown by around 17% since the middle of 2005, thus effectively creating a supply growth surplus of a massive 5%-point in the last 12 months. This apparent supply surplus goes a long way in explaining the drop in freight rates, on the large head-haul routes, within the last 6-12 months.
By analyzing the supply-demand balance by route it is notable that currently 90% of vessels above 4,000 teu capacity are employed on the two main head-haul routes: Asia to North America and Asia to Europe. Given that the most likely future employment pattern for these large ships probably will continue to primarily be these two routes, the expected 28%, 20%, and 14% annual percentage growth in 2006, 2007 and 2008, respectively, of the 4,000+ teu fleet may without a similar Asian export growth indeed leave these two routes exposed to overcapacity. In comparison, China’s annual export growth has averaged about 20% with the highest annual growth rate in 2000 of approx. 26%. Conversely, the sub 4,000 teu fleet is only expected to see 10%, 9% and 4% fleet growth in the respective years. Consequently, we may see many of the new large ships replacing smaller ships rather than be net additions on the east-west trade thus creating a cascading activity of larger ships into the smaller routes, thereby exposing the smaller routes to a certain degree of overcapacity as well.

11 Danish Ship Finance (Danmarks Skibskredit)
CONTRACTING & SHIP VALUES
Heavy 2q06 contracting activity of post-panamax ships Heavy ordering throughout the 1st quarter of both LNG ships and VLCC Crude Carriers (prior to the implementation of the Common Structural Rules) has effectively raised newbuilding prices for all segments including containerships. Within the last 6 months, containership newbuilding and secondhand prices have on average increased 1% and 5% respectively, with the biggest ships gaining the most.
As the market outlook for oil tankers was considered to be better than for containerships, a limited number of old orders for containerships have been changed into oil tankers. However, it seems that as VLCC and LNG contracting slowed in the 2nd quarter it left room for containership contracting. Particularly in the post-panamax segment contracting activity surprised in the 2nd quarter as a massive 447.000 teu of post-panamax tonnage were contracted.
The improved contracting activity raised the orderbook/fleet ratio from around 0.47 in the 1st quarter to about 0.48 in the 2nd quarter, indicating a continued very strong fleet growth in coming years.
OUTLOOK
Slowing demand growth is expected to depress freight rates For the 2nd half of 2006, we expect a slowdown in global demand from the 1st half so that demand in 2006 will have grown by 9-11% over 2005. Conversely, fleet growth in all of 2006 is expected to be around 15%. Thus, for all of 2006 we expect the supply surplus to stay near 5%-points and hence to exercise continued downward pressure on freight rates. According to our estimates, this could reduce container freight rates on the three major head-haul routes (Asia-North America, Asia-Europe, Europe-North America) by around 11% on average in 2006 from the 2005 average. Already now, freight rates have fallen by more, indicating that the market perhaps has overreacted to the expectations of overcapacity in 2006.
In 2007, we expect total head-haul trade growth on a teu-nautical miles basis to average around 8-10% compared to an expected fleet growth of 13% (see upper graph on page 10), thus causing overall

12 Danish Ship Finance (Danmarks Skibskredit)
containership fleet utilization to drop by 3-5%-points. Potentially, this may have a negative impact on head-haul freight rates in the range of 10-13% in 2007, pushing freight rates down to a level close to the lows of 2002. Yet, it could be that the 2006 freight rate structure has already incorporated a part of the expected fall in 2007 and hence that our expected freight rate reduction in 2007 may be too large. However, in a market with substantial overcapacity it is extremely difficult to forecast the impact on freight rates as it as much is a question of strategic positioning as a supply-demand issue. Further, the escalating entry of super post-panamax containerships and the expected cascading make it complicated to predict the future fleet utilization and the freight rate level on individual routes. Moreover, several factors could change the immediate outlook for the supply-demand balance. For example, port congestion and to a lesser degree odd size cargo can significantly reduce available fleet capacity. So far, there has been no sign of port congestion, but some observers express concern about potential US port congestion in coming years.
In any case, on the demand side, several macroeconomic indicators point to even lower total head-haul trade growth as it seems that the composition of world GDP is moving away from its reliance on the US economy. The essential issue regarding global demand for container-ships is not whether a slowdown in US GDP can be counterbalanced elsewhere, but rather a question of whether higher GDP growth in other regions will have a material impact on head-haul container trade and hence freight rate formation. Looking ahead, the most positive prospects for global consumption growth lie in Asian countries such as India or China. But as Indian and Chinese imports of containerized consumer goods is most likely to come from other Asian countries (and thus on the relatively short-distance head-haul routes, or alternatively from Europe or North America, and thus on the irrelevant back-haul routes) the impact on freight rates may turn out to be modest. With respect to the charter market, however, this represents an upside potential as Intra-Asian trade growth has a direct positive impact on charter rates. Thus, while comfort can be taken from rising global demand in the aggregate, changes in the composition may have a diverse impact on freight and charter rates.

13 Danish Ship Finance (Danmarks Skibskredit)
Therefore, as the world is still overly dependent on the US economy, it is crucial to determine the expected impact of rising interest rates and soaring energy prices on US consumption and hence US demand for containerized imports. The historically low interest rates (since 2001) have caused real estate prices to rise, enabling a substantial amount of mortgage equity withdrawal (MEW), and thus increasing private consumption. MEW is defined as equity extracted from existing homes via cash-out refinancing, home equity borrowing, and housing turnover. In other words, in recent years MEW has been a significant driver of the rising US consumption. But, as interest rates rise, the real estate supercharger in the economic engine will fade due to the sudden absence of MEW.
But why have we so far not seen much evidence that rising interest rates have slowed consumption? One reason is because the majority of the vulnerable Adjustable Rate Mortgages (ARM) originating from 2004-2005 will not be reset before the second half of 2006, with the bulk of loans resetting in 2007 and 2008. Consequently, borrowers have, in effect not yet been directly exposed to the interest rate rises, which may go a long way in explaining the US economy’s resilience against oil price shocks and hurricane devastation. Additionally, about 30% of the ARMs, or USD 500 billion, is on properties with less than 5% equity, which could leave some consumers with very limited economic leeway. Goldman Sachs estimates that the reduction in US consumption directly related to MEW is expected to shave ¾%-point of GDP growth in both 2007 and 2008. Furthermore, the direct effect of rising interest rates on investment growth is expected to shave another ¾%-point off annual GDP growth. In terms of consumption, Goldman Sachs expects these effects to subtract approx. 1%-point from consumer spending growth in 2007 and approx. ½-¾%-point in 2008.
This is, of course, only a partial reflection as there are several factors determining the actual consumption and GDP growth. Still, it gives a clear indication of the trend and its impact on US economy. In comparison, in 2003 and 2004 the UK and Australian consumption growth slowed by average 3%-points as the MEW factor fell away. With many other European economies
being similarly driven by the housing boom, the issue is also extremely relevant with respect to European demand for containerized imports. However, the degree to which these factors will have a real impact on containerized trade in 2007, 2008 or 2009 is difficult to predict as the effects on global containerised trade may be lagged. Thus, to be able to translate changes in world GDP growth into changes in global container trade growth, we have estimated the implicit relationship between world GDP growth and global demand growth (see lower graph on previous page). According to our estimates, global growth in containerized trade can be calculated as world GDP growth plus 6%-points. This implies that the generally accepted rule of thumb of a GDP-multiple of 3 does not necessarily hold. The interpretation of the 6% growth constant can be some kind of globalization factor. Interestingly, year 2003 and 2004 clearly exhibit the impact of increased globalization through extraordinary growth in global container trade, reflecting the impact of the Chinese integration into the world economy. But, as the growth potential for globalization declines over time, and as there is a natural ceiling on demand for containerised imports, we do not expect the 6% growth constant to remain at 6% in the long run. In conclusion, in 2007 and beyond, the expected continuing slowdown in demand growth for containerized imports on the head-haul routes is a direct consequence of higher interest rates and the consequent slowdown in MEW in the US and to a lesser extent in Europe. Further adding to slowing US and European consumption is higher energy prices and the inability of countries such as India and Russia to counterbalance the effect of slowing Chinese exports, given their much smaller trading volumes. Thus, in accordance with our previous ‘Shipping Market Review’, a head-haul demand growth for containerized imports above the decade’s average of 10% annually for the next 2 years is regarded as rather unlikely. In a market characterized by overcapacity and a few large players fighting for strategic positions the downward pressure on freight rates is thus likely to continue

14 Danish Ship Finance (Danmarks Skibskredit)
CCrruuddee TTaannkkeerrss
Exceptionally resilient spot market beats the usual summer lull. Contracting of new ships shoots sky-high ahead of the implementation of the Common Structural Rules. The positive outlook is increasingly dependant on China to import oil.
FREIGHT RATES Spot rates extraordinarily beat the usual summer lull Indicative of the total crude tanker market, the VLCC spot freight rates turned out to be exceptionally profitable during the first six months of 2006. Compared to an average timecharter equivalent (TCE) spot earning of about USD 53,000 a day during the 1st half of last year, this year’s spot earnings of about USD 63,000 a day actually beat last year’s spot earnings by a substantial USD 10,000 a day, according to data from Clarkson.
Moreover, the usual seasonal downturn in spot freight rates during the summer period has turned out to be almost non-existent so far this year as freight rates have been exceptionally strong, especially during the latter part of the 1st half of 2006.
SUPPLY & DEMAND
High freight rates despite an abundance of ships The 1st quarter of 2006 in particular has proven exceptionally rewarding for crude oil tankers despite lack of activity in the Arabian Gulf and falling crude imports to the US.
As depicted by the blue line in the lower graph on the right, the availability of VLCCs in the Arabian Gulf during the 1st half of 2006 was significantly higher than during the boom-years of 2003-2004 and somewhat higher than during much of 2005. Notice that the left axis is inverted. All else being equal, a higher availability of ships should thus indicate lower freight rates in 2006 than during much of 2003-2005. But, as depicted by the green line, freight rates during the latter part of 2005 and well into 2006 momen-tarily seem to have broken out from the otherwise almost synchro-nous inverse relationship between ship supply and freight rates.
Freight rates momentarily disconnected from their usual relationship with ship supply…
15 Danish Ship Finance (Danmarks Skibskredit)
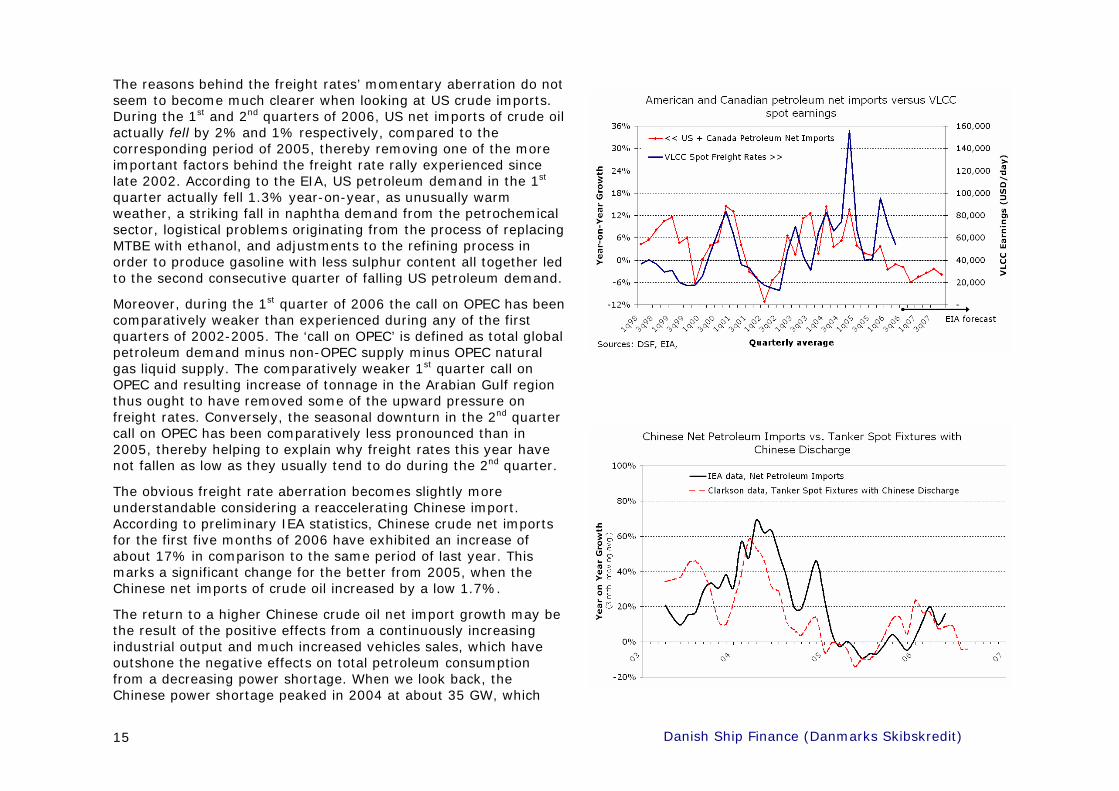
The reasons behind the freight rates’ momentary aberration do not seem to become much clearer when looking at US crude imports. During the 1st and 2nd quarters of 2006, US net imports of crude oil actually fell by 2% and 1% respectively, compared to the corresponding period of 2005, thereby removing one of the more important factors behind the freight rate rally experienced since late 2002. According to the EIA, US petroleum demand in the 1st quarter actually fell 1.3% year-on-year, as unusually warm weather, a striking fall in naphtha demand from the petrochemical sector, logistical problems originating from the process of replacing MTBE with ethanol, and adjustments to the refining process in order to produce gasoline with less sulphur content all together led to the second consecutive quarter of falling US petroleum demand.
Moreover, during the 1st quarter of 2006 the call on OPEC has been comparatively weaker than experienced during any of the first quarters of 2002-2005. The ‘call on OPEC’ is defined as total global petroleum demand minus non-OPEC supply minus OPEC natural gas liquid supply. The comparatively weaker 1st quarter call on OPEC and resulting increase of tonnage in the Arabian Gulf region thus ought to have removed some of the upward pressure on freight rates. Conversely, the seasonal downturn in the 2nd quarter call on OPEC has been comparatively less pronounced than in 2005, thereby helping to explain why freight rates this year have not fallen as low as they usually tend to do during the 2nd quarter.
The obvious freight rate aberration becomes slightly more understandable considering a reaccelerating Chinese import. According to preliminary IEA statistics, Chinese crude net imports for the first five months of 2006 have exhibited an increase of about 17% in comparison to the same period of last year. This marks a significant change for the better from 2005, when the Chinese net imports of crude oil increased by a low 1.7%.
The return to a higher Chinese crude oil net import growth may be the result of the positive effects from a continuously increasing industrial output and much increased vehicles sales, which have outshone the negative effects on total petroleum consumption from a decreasing power shortage. When we look back, the Chinese power shortage peaked in 2004 at about 35 GW, which

16 Danish Ship Finance (Danmarks Skibskredit)
consequently was a significant factor behind the amazing import growth in fuel oil used for the stand-alone power generators that temporarily helped to alleviate the power shortage. But in 2005, the power shortage dropped to about 25 GW, which in 2005 led to the lower reliance on the energy-inefficient generators and resulting near-zero import growth. In 2006, the power shortage is expected to drop to about 8 GW, and in 2007 the power shortage may finally develop into a power surplus. As the incremental power capacity being built in recent and future years runs mostly on non-petroleum products (e.g. coal, water, nuclear, natural gas and wind) and in addition is expected to render some of the petroleum-powered power plants uncompetitive, Chinese petroleum imports may – despite of continued strong economic growth – exhibit relatively lesser growth.
In addition to growing Chinese crude oil imports, demand for crude oil tankers received a boost from longer sailing distances (see upper graph on right). With US seaborne imports in decline, the sought after light sweet crude oil from West Africa thus appears to have gone to distant China instead of nearby USA.
But importantly, longer distances and a return to significant positive growth of Chinese imports do not seem to have caused a shortage of VLCCs in the Arabian Gulf, which otherwise would have helped to explain the abnormally high freight rates.
Instead, it does appear likely that the great uncertainty stemming from last year’s hurricane devastation in the Gulf of Mexico may have provided tanker shipowners with the ability to temporarily convince charterers that ships are in short supply. Moreover, some of the large energy companies have recently decided to use double-hull tonnage only, thus effectively limiting ship supply despite numerous non-double-hull tankers available. And more importantly, it has been reported that Iran has used up to 10 VLCCs to store heavy, sour crude oil, which has been hard to sell given that global refiners lack the available capacity to refine the very heavy crude oils. Until the time when the tanker market once again is characterized by a significant surplus of tanker capacity, crude tanker freight rates are probably to react disproportional to even small events that may shift the delicate supply-demand balance.

17 Danish Ship Finance (Danmarks Skibskredit)
CONTRACTING & SHIP VALUES
Contracting bonanza, but secondhand prices slightly down According to Clarkson’s data, 16.5 and 8.7 million dwt of crude tankers were contracted during the 1st and 2nd quarters of 2006 respectively.
The 1st quarter order volume set a new all-time record as ship-owners went all out to secure comparatively cheaper building slots ahead of the implementation date of the Common Structural Rules (CSR). The high 1st quarter contracting levels could thus be interpreted as a one-off effect from the CSR and not necessarily as expectations for strong future crude tanker demand. But with 2nd quarter contracting levels almost on a par with the peak contracting levels of 2003, despite much higher prices, it does indeed appear as though tanker shipowners still hold remarkably positive expectations for future tanker ship demand growth.
The extreme contracting volumes have led to an increase in newbuilding contract prices of about 6% since the end of 2005. But despite higher newbuilding prices, 5-year-old secondhand prices have registered a fall of about 1-2% during the same period.
Although secondhand tanker prices are down, they are still at a historic high both in absolute numbers and relative to the prevalent timecharter rates. As depicted by the lower graph on the right, the relationship during 1992-2003 between 1-year timecharter rates and prices of 5-year-old VLCCs has been rather close. But in 2004, the old relationship broke down as ship prices rose much higher than otherwise dictated by T/C rates. In 2005-2006, the relationship became even more distant as secondhand prices remained high or even rose further despite falling T/C rates.
The seemingly illogical deviation may be the result of lower risk-aversion because of bulging cash reserves from 3 years of re-cord earnings, coupled with a new-found knowledge and awareness that freight rates in a short period of time can perhaps reach much higher levels than was previously believed possible. Ship prices must thus take account of this greater upside volatility. Unfortuna-tely, it creates greater downside risks for ship prices should the market’s risk-aversion turn sour again or freight rates disappoint.

18 Danish Ship Finance (Danmarks Skibskredit)
Average Spot Earnings of Modern VLCC, USD/day
Source\quarter 2004 2005 1q06 2q06 3q06 4q06 2006 1q07 2q07 3q07 4q07 2007
DSF Model 72,060 53,880 40,493 34,244 50,169 39,218 36,642 38,993 42,158 39,253 Imarex * 72,060 53,880 83,958 116,856 81,688 79,088 46,422 36,979 65,098 56,897
* Forward curve from the International Maritime Exchange as per August 11 2006. Average of routes TD3 (Ras Tanura - Chiba) and TD4 (Bonny - Loop). Grey shaded areas are actually realised historic spot earnings.
94,878 60,725
19 Danish Ship Finance (Danmarks Skibskredit)
OUTLOOK
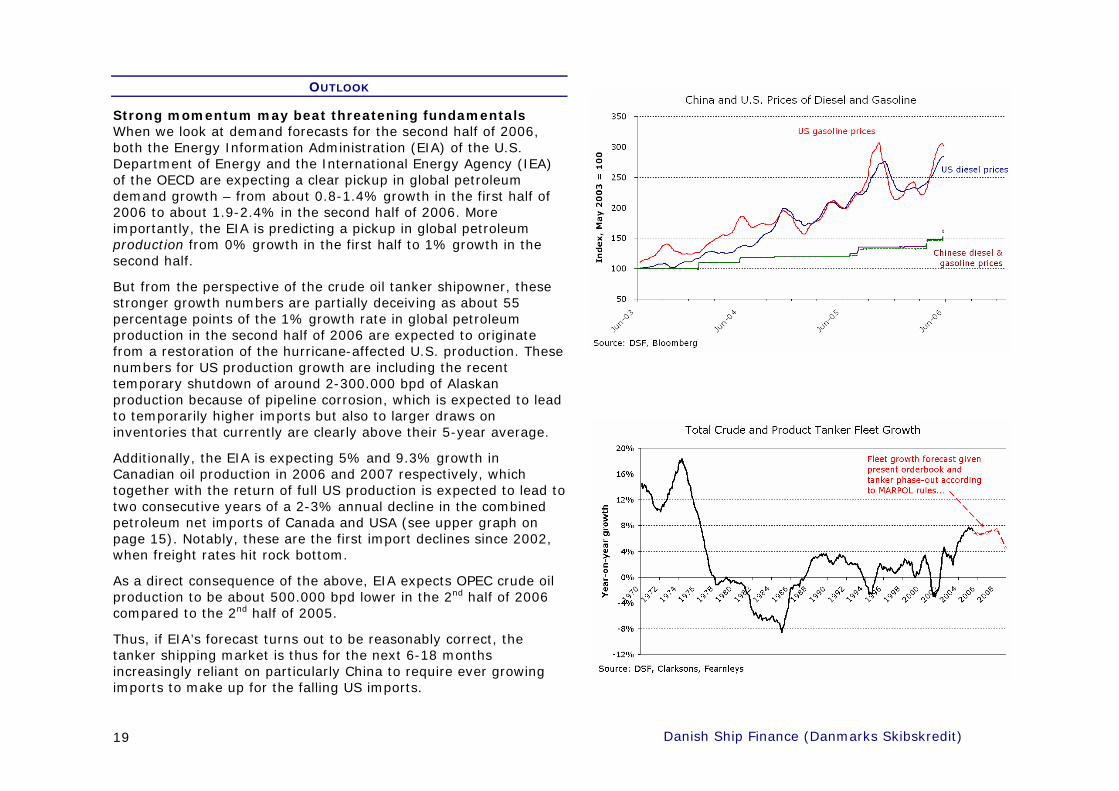
Strong momentum may beat threatening fundamentals When we look at demand forecasts for the second half of 2006, both the Energy Information Administration (EIA) of the U.S. Department of Energy and the International Energy Agency (IEA) of the OECD are expecting a clear pickup in global petroleum demand growth – from about 0.8-1.4% growth in the first half of 2006 to about 1.9-2.4% in the second half of 2006. More importantly, the EIA is predicting a pickup in global petroleum production from 0% growth in the first half to 1% growth in the second half.
But from the perspective of the crude oil tanker shipowner, these stronger growth numbers are partially deceiving as about 55 percentage points of the 1% growth rate in global petroleum production in the second half of 2006 are expected to originate from a restoration of the hurricane-affected U.S. production. These numbers for US production growth are including the recent temporary shutdown of around 2-300.000 bpd of Alaskan production because of pipeline corrosion, which is expected to lead to temporarily higher imports but also to larger draws on inventories that currently are clearly above their 5-year average.
Additionally, the EIA is expecting 5% and 9.3% growth in Canadian oil production in 2006 and 2007 respectively, which together with the return of full US production is expected to lead to two consecutive years of a 2-3% annual decline in the combined petroleum net imports of Canada and USA (see upper graph on page 15). Notably, these are the first import declines since 2002, when freight rates hit rock bottom.
As a direct consequence of the above, EIA expects OPEC crude oil production to be about 500.000 bpd lower in the 2nd half of 2006 compared to the 2nd half of 2005.
Thus, if EIA’s forecast turns out to be reasonably correct, the tanker shipping market is thus for the next 6-18 months increasingly reliant on particularly China to require ever growing imports to make up for the falling US imports.

20 Danish Ship Finance (Danmarks Skibskredit)
But despite the above mentioned factors that could weigh rather negatively on freight rates in the coming 6-12 months, the momentum in the market currently appears to be so strong that tanker shipowners may most likely be able to keep freight rates from falling as low as implied by our DSF Forecast Model. In addition, expectations of yet another severe hurricane season on top of far-reaching geopolitical turmoil in the Middle East, the reverberations of last year’s hurricane devastations, and the continued guerrilla attacks on the petroleum industry in Nigeria may altogether lead to so much market uncertainty that the oil traders and petroleum companies are willing to pay much higher freight rates than what is otherwise indicated by the fundamental supply and demand for the forthcoming fall and winter period.
Beyond 2006, tanker demand will possibly benefit from on average longer sailing distances. Particularly the new supplies from Nigeria, Angola and Brazil may in addition to Venezuela’s possible desire to reduce supplies to the US lead to longer transport distances as China and India probably are the most likely takers of these new crude supplies.
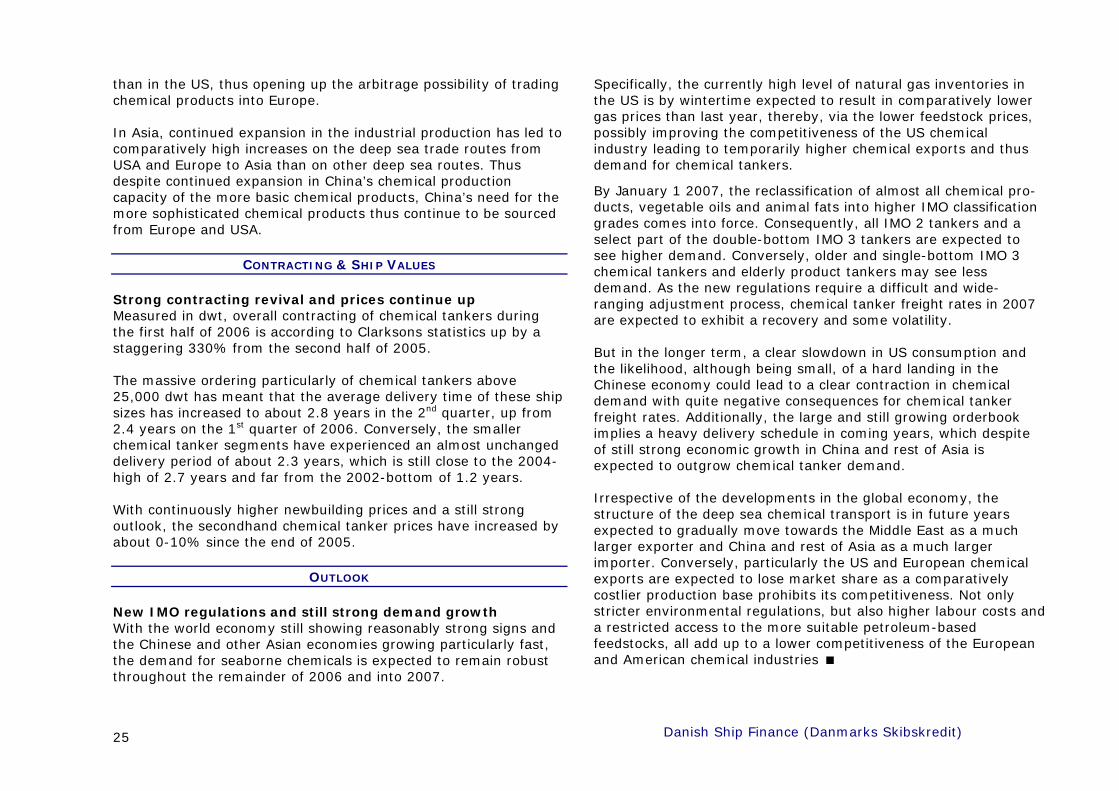
On the pure fundamental demand side in the near term as well as in the longer term, much is still dependant on both USA and China to exhibit continued strong crude oil import growth in order to counteract a growth in the crude tanker fleet of about 5-8% annually through to the end of 2009. As depicted by the lower graph on the previous page, fleet growth is for the next three years expected to exhibit a strong pace which like has not been seen since the very early days of the tanker shipping business.
A clear factor increasing tanker demand is a Chinese economy that continues to power ahead. Car sales have risen sharply, adding to demand for gasoline and diesel, and the Chinese petrochemical sector is also rising fast, leading to increased demand for naphtha. Additionally, the construction of China’s strategic petroleum storage facilities is gradually progressing, with the first of four storage sites expected to be completed by August. The filling of the first strategic storage site is reported to begin by the end of 2006, leading to a temporary import boost – but soaring international crude prices may cause a delay.
Despite continued exceptionally strong economic growth in China, the Chinese imports of crude oil may in the next few years exhibit a less remarkable growth rate as several barriers exist to a return of the import bonanza experienced in 2003-2004.
Firstly, the power industry in China is expected to move gradually away from the petroleum-powered plants to more energy-efficient plants powered by coal, nuclear, water or wind. Secondly, despite of recent upward revisions, Chinese retail petroleum prices are still far from world market levels as depicted in the upper graph on the previous page. The difference thus causes a loss to the refineries for each barrel of oil they import, thereby limiting incentives to supply the domestic market. When Chinese and world prices are aligned eventually, it may initially lead to a burst in imports, possibly causing a clear but temporary increase in tanker freight rates. But if, as suspected, the price alignment entails a significant increase in Chinese domestic prices, it may subsequently lead to a substantial slowdown in Chinese demand growth. Notably, the timing of the price alignment is still very unclear. In May 2006, the Chinese National Development and Reform Commission (NDRC) issued a report recommending price reform, but the central government has so far reacted by only raising prices in small increments in fear of public unrest if prices are increased too much, too fast. Thus, until the price alignment is implemented, Chinese petroleum imports are likely to exhibit a positive but restrained growth.
In conclusion, crude tanker freight rates in the second half of 2006 and into the early part of 2007 will probably remain above our model’s forecast as widespread geopolitical uncertainty, a severe hurricane season, increased use of VLCCs as storage tanks, and a booming Chinese economy may temporarily cloud the fundamental picture of a year-on-year fall in US seaborne crude imports and a rapidly growing tanker fleet.
In the longer term, a record-high fleet growth and growing North American crude output will most likely outweigh the beneficial influences from longer trading distances and expected continued demand growth from China and the rest of Asia, leading to lower freight rates than those experienced in 2006

21 Danish Ship Finance (Danmarks Skibskredit)
PPrroodduucctt TTaannkkeerrss
First quarter freight rate collapse as US and Asian demand momen-tarily slows. Without any new significant refinery outages in the US Gulf, the fall and winter product tanker market may disappoint.
FREIGHT RATES Complete freight rate collapse during the first quarter Clean product spot rates of the larger product tankers experienced an almost complete collapse in early 2006, as freight rates particularly on the Middle East Gulf to Asia routes for a short period of time fell significantly below any previous historic low. Fortunately, spot freight rates subsequently increased to strong levels. Comparatively, the smaller Medium Range tankers (25-50,000 dwt) saw much less decline.
Consequently, the timecharter rates (indicating the market’s average longer term expectations) dipped shortly, only to regain part of the lost ground as spot rates revived. Timecharter rates are still at rather high levels, implying continued optimistic earnings expectations for the coming 1-3 year period.
SUPPLY & DEMAND
Too high US imports in 2005 subsequently reversed The first quarter collapse appears to be the concurrence of several factors of both temporary and more permanent duration.
According to EIA weekly data, total US gasoline and distillate (diesel, fuel oil, heating oil) imports increased by an incredible 32% during the 3-month period from November 2005 to January 2006 over the comparable period a year earlier. The massive increase in imports was a direct result of hurricane devastations which caused several major refineries in the US Gulf to shut down for an extended period, thus demanding much increased oil product imports to make up for the damaged domestic refinery production. But as imports in November to January turned out to be excessive, petroleum stocks grew to very high levels. In the following two months, year-on-year growth in US imports thus fell

22 Danish Ship Finance (Danmarks Skibskredit)
to a measly 3% as gasoline and distillate stocks were brought back down.
In addition to the emergence of too high stocks in the US, an unusually warm winter in the US combined with an unusually cold winter in Europe led to a temporary but significant reversal of the price spread between petroleum prices in Europe and USA (see lower graph on previous page). The usual trans-Atlantic arbitrage trade of European exports to the US thus came to a temporary but abrupt halt in the very early months of 2006. As winter subsided and US gasoline stocks quickly came down to more normal levels, the trans-Atlantic arbitrage window and subsequent need for higher US imports once again returned.
In the Middle East, oil product exporters were experiencing strong domestic demand for oil products and weakening Asian demand that, together with a weak trans-Atlantic market, temporarily led to a significant buildup of product tanker tonnage in the Middle East Gulf which caused freight rates to nose-dive. The Asian demand weakness is partly on account of an extensive refinery maintenance season in combination with sufficient product stocks, and partly on account of high naphtha prices that to an increasing extent push the Japanese petrochemical sector to diversify its feedstocks (e.g. to gasoil, LPG, and natural gas liquids).
While a Japanese demand weakness may be the answer to some of the lagging Asian demand for Middle East exports, significantly increasing Indian oil product exports in the 1st quarter of 2006 in addition to slowing demand from Thailand and Indonesia, may also have reduced combined Asian demand for Middle East oil products.
US product imports have during the past 6-9 months, in addition to hurricane related refinery outages, been boosted by an unusually wide-ranging refinery maintenance season as US refineries and logistical networks made preparations for the phase-out of MTBE in gasoline ahead of the 2006 summer driving season. Given this extreme strength in US product imports over the past winter period it is thus a slight surprise that product tanker freight rates have not managed to significantly outperform the crude tanker freight rates during the same period. Perhaps it is a sign

23 Danish Ship Finance (Danmarks Skibskredit)
that the very high product tanker fleet growth is indeed beginning to eat away at the upside volatility in product tanker freight rates.
CONTRACTING & SHIP VALUES
CSR contracting bonanza and unchanged secondhand prices Similar to the contracting activity in the crude segments, product tanker contracting volumes exhibited record-breaking levels in the 1st quarter followed by a still very strong 2nd quarter.
With about 5-10% higher newbuilding prices and slightly lower timecharter rates, secondhand prices of the relatively young tonnage are currently on levels that are rather unchanged since late 2005. Conversely, the older product tanker tonnage has exhibited clear upward tendencies in the recent 6-month period.
Product tanker secondhand prices are currently exhibiting the same tendency as crude tankers of being higher than the historic relationship between timecharter rates and secondhand prices would otherwise indicate it to be. Currently, the larger the product tanker, the greater the discrepancy appears to be.
OUTLOOK
Hangovers from the 2005 hurricane boost A major component behind the excessive growth in US petroleum product imports in the last 9 months has been the combination of hurricane related refinery outages and the unusually wide-ranging maintenance season in advance of the phase-out of MTBE in gasoline ahead of the summer driving season. Consequently, this has caused a significant boost to demand for product tankers.
Unfortunately, these positive effects on tanker demand from strong US product imports are not permanent. Instead, the return to normal of the US refinery capacity by the 3rd quarter of this year may cause a significant year-on-year decline in US imports.
According to the EIA, a surge in US gasoline imports similar to what occurred following Hurricane Katrina and Rita in 2005 may not be possible this year, given the currently tight European fuel oil and gasoline markets. Notably for product tanker demand and freight rates, a slow-responding European refinery sector to a US
supply shock may actually turn out to be even more beneficial than the supply shock experienced in 2005 on account of the oil products would have to be sourced from even further away, leading to much higher tonne-miles demand.
Importantly, the above scenario for product tanker freight rates may most likely never come to fruition as it requires yet another season of similarly devastating hurricanes in the US. Instead, US product imports may exhibit a year-on-year fall in the coming winter period thereby removing a significant part of the upside-pressure on freight rates. Conversely, if crude tanker freight rates surprise positively, product tanker freight rates are probably to be pulled up as well.
The product tanker fleet is for the next 2½ years expected to exhibit continued high growth rates, thus adding to the negative pressure on freight rates. The predominant reason for the large product tanker orderbook and future fleet growth is that the planned construction of several major petroleum refineries in the Middle East is expected to lead to very strong product exports out of the Middle East heading particularly for Asia and USA, thus creating significant tonne-miles demand for product tankers.
But what is going against this positive outlook are the expectations for very strong petroleum consumption growth in the Middle East which may significantly reduce the volume of oil products made available for exports out of the region. Specifically, IEA’s July Oil Market Report forecasts that of the 1.21 and 1.57 million barrels/day growth in global petroleum demand in 2006 and 2007 respectively, the Middle East is expected to make up between 21% and 27%. Furthermore, US demand growth is only expected to make up about 13% and 24% of global petroleum demand growth in 2006 and 2007 respectively. Thus despite the positive long term implications of a limited capacity growth in the US refinery sector, requiring a growing share of product imports compared to crude imports, the effects of this may not necessarily be clearly visible in product tanker trades in the coming 1-2 years.
In conclusion, product tanker freight rates are to remain volatile in the near and medium term, and probably on a downward path in the longer term

24 Danish Ship Finance (Danmarks Skibskredit)
CChheemmiiccaall TTaannkkeerrss Deep sea transatlantic chemical freight rates gradually moved towards ‘normal’ as the US chemical industry returned to production after extended hurricane related outages. Contracting activity and secondhand prices continued upwards.
FREIGHT RATES High deep sea rates but fading boost from hurricanes The significant boost in late 2005 to deep sea transatlantic freight rates from Europe to North America almost completely faded away in the 2nd quarter of 2006. Conversely, deep sea freight rates for U.S. exports to Europe have only recently managed to take back some of the losses incurred in the wake of the US hurricane devastation.
SUPPLY & DEMAND Still strong Asian demand and a return to ‘normal’ in the US Deep sea freight rates on the major transatlantic chemical trade routes returned to ‘normal’ as the vast majority of the shut-down US chemical plants in the US Gulf Coast was restored to production after having experienced significant outages following the hurricane devastations in 2005. With US chemical production capacity almost fully up and running again, demand for imports to the US quickly receded. Consequently, spot freight rates on the Europe to USA route have subsequently fallen to a still healthy level experienced prior to the hurricane devastation in 2005. US chemical exports were additionally boosted by a growing need for imports to the European chemical sector as the European industrial production gained momentum. Furthermore, the cold European winter meant relatively higher product prices in Europe
25 Danish Ship Finance (Danmarks Skibskredit)
than in the US, thus opening up the arbitrage possibility of trading chemical products into Europe. In Asia, continued expansion in the industrial production has led to comparatively high increases on the deep sea trade routes from USA and Europe to Asia than on other deep sea routes. Thus despite continued expansion in China’s chemical production capacity of the more basic chemical products, China’s need for the more sophisticated chemical products thus continue to be sourced from Europe and USA.
CONTRACTING & SHIP VALUES Strong contracting revival and prices continue up Measured in dwt, overall contracting of chemical tankers during the first half of 2006 is according to Clarksons statistics up by a staggering 330% from the second half of 2005. The massive ordering particularly of chemical tankers above 25,000 dwt has meant that the average delivery time of these ship sizes has increased to about 2.8 years in the 2nd quarter, up from 2.4 years on the 1st quarter of 2006. Conversely, the smaller chemical tanker segments have experienced an almost unchanged delivery period of about 2.3 years, which is still close to the 2004-high of 2.7 years and far from the 2002-bottom of 1.2 years. With continuously higher newbuilding prices and a still strong outlook, the secondhand chemical tanker prices have increased by about 0-10% since the end of 2005.
OUTLOOK New IMO regulations and still strong demand growth With the world economy still showing reasonably strong signs and the Chinese and other Asian economies growing particularly fast, the demand for seaborne chemicals is expected to remain robust throughout the remainder of 2006 and into 2007.
Specifically, the currently high level of natural gas inventories in the US is by wintertime expected to result in comparatively lower gas prices than last year, thereby, via the lower feedstock prices, possibly improving the competitiveness of the US chemical industry leading to temporarily higher chemical exports and thus demand for chemical tankers.
By January 1 2007, the reclassification of almost all chemical pro-ducts, vegetable oils and animal fats into higher IMO classification grades comes into force. Consequently, all IMO 2 tankers and a select part of the double-bottom IMO 3 tankers are expected to see higher demand. Conversely, older and single-bottom IMO 3 chemical tankers and elderly product tankers may see less demand. As the new regulations require a difficult and wide-ranging adjustment process, chemical tanker freight rates in 2007 are expected to exhibit a recovery and some volatility. But in the longer term, a clear slowdown in US consumption and the likelihood, although being small, of a hard landing in the Chinese economy could lead to a clear contraction in chemical demand with quite negative consequences for chemical tanker freight rates. Additionally, the large and still growing orderbook implies a heavy delivery schedule in coming years, which despite of still strong economic growth in China and rest of Asia is expected to outgrow chemical tanker demand. Irrespective of the developments in the global economy, the structure of the deep sea chemical transport is in future years expected to gradually move towards the Middle East as a much larger exporter and China and rest of Asia as a much larger importer. Conversely, particularly the US and European chemical exports are expected to lose market share as a comparatively costlier production base prohibits its competitiveness. Not only stricter environmental regulations, but also higher labour costs and a restricted access to the more suitable petroleum-based feedstocks, all add up to a lower competitiveness of the European and American chemical industries

26 Danish Ship Finance (Danmarks Skibskredit)
LLPPGG TTaannkkeerrss
Still very strong freight rates as a cold winter in Japan, South Korea and Europe compensates for a warm US winter and slowing Chinese imports. The short and medium term outlook is still rather positive, but the longer-term outlook is questionable.
FREIGHT RATES
VLGCs prosper, but smaller vessels experience clear setbacks During the 1st quarter of 2006 almost every LPG segment experienced freight rates that were better than or on level with their respective historic highs. But as 2nd quarter of 2006 ran its course, particularly the medium and coastal LPG vessels experienced significantly lower spot freight rates. On the other hand, VLGCs experienced improved spot freight rates during 2q06 and ended the period at new historical highs.
The trend of falling spot freight rates for the smaller segments and improving spot freight rates for the larger vessels have had a similar effect on timecharter rates of the respective ship sizes.
The fall in timecharter rates for the medium and coastal LPG vessels is the first significant and more prolonged fall in timecharter rates since the freight rate rally began back in 2002, and may represent a noticeable shift in market expectations. Although down, timecharter rates and thus market expectations are still at very lucrative levels.
SUPPLY & DEMAND
Cold Japanese winter compensates for lack of Chinese demand 2006 began with harsh winter conditions in some of the world’s largest LPG consuming areas (Europe, Japan and South Korea), leading to a temporary above-normal demand for LPG imports and high LPG product prices.
In Europe, a shortage of LPG supply from the Mediterranean and delays in ship loading hampered deliveries to the northwest Europe, which, on top of a cold weather, led to record-high propane prices during the first several weeks of 2006. As LPG prices in the US stayed relatively steady during the same period,
27 Danish Ship Finance (Danmarks Skibskredit)
high European propane prices created the opening of a significant arbitrage window for US LPG exports to Europe. Usually, the arbitrage window works in the other direction, but for the first time in more than seven years the arbitrage window created an eastward move of LPG across the Atlantic and thus a temporary boost to demand for LPG ships. In Japan (the largest import market for seaborne LPG) LPG consumption increased by 13% in December 2005 (measured year-on-year), leading to a large-scale draw on LPG inventories which subsequently had to be rebuilt by means of larger-than-normal LPG imports in following months. On the negative front, Chinese LPG imports did not manage to buck the trend of falling imports that began in 2005 – the first year since 1999 that China did not manage to increase its LPG imports. In 2005, Chinese LPG imports dropped by 3.8% on 2004 and in the first quarter of 2006 the undesired trend got worse, as Chinese LPG imports actually tumbled 26.5% on the same period in 2005, according to Argus LPG World. Falling Chinese imports during 2005 and 1q06 is caused partly by rising competition from domestic supply sources and partly by demand destruction from high LPG prices. Additionally, the exceptionally large drop in 1st quarter imports was amplified by the necessity to bring down high Chinese LPG inventories, which had been built during the previous months because expectations for LPG demand following the Chinese lunar New Year celebrations subsequently turned out to be overly optimistic. Apparently, the Chinese import market has proven to be somewhat price inelastic as buyers seem to shy away from LPG purchases as prices rise above an undefined threshold. As the Chinese market is expected to be one of the principal outlets of incremental LPG production in coming years, the ramifications of China’s possible price inelasticity could thus turn out to be a significant obstacle to both LPG producers and LPG shipowners, notably provided that LPG prices stay high.

28 Danish Ship Finance (Danmarks Skibskredit)
CONTRACTING & SHIP VALUES
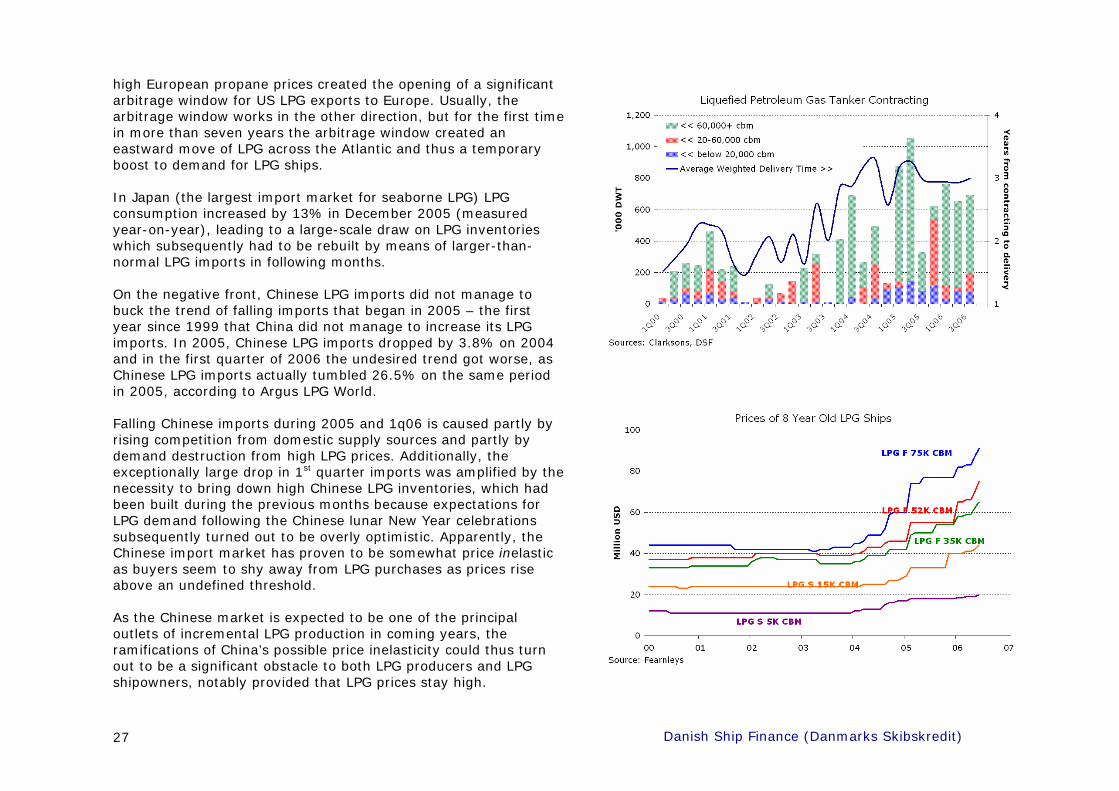
Contracting revival and secondhand prices continue up During the first six months of 2006, LPG shipowners seem to have found renewed interest in contracting of both VLGCs and smaller LPG vessels. Measured in dwt, contracting levels increased by almost 50% compared to the preceding six-month period.
Particularly the contracting of LPG ships with ethylene-carrying capability has seen a marked revival as prospects for future ethylene transport seem to have increased (read outlook below). Ethylene gas requires a temperature of below -104 ºc whereas other types of LPG gasses require temperatures of -48 ºc or warmer in order to liquefy. The transport of ethylene thus requires purpose-built LPG ships.
Continued strong contracting of LPG ships combined with the overly exuberant contracting of oil tankers has pushed the bargaining power safely in the hands of the shipyards, providing them with the possibility to push LPG newbuilding prices upwards by about 5% since the beginning of 2006.
Secondhand prices have seen an even more remarkable increase of 10-35 % since the end of 2005, according to Fearnleys.
OUTLOOK
Will demand for LPG meet the expected LPG output growth? During the years 2006 and 2007, LPG fleet growth is expected to be between 3% and 9% annually, depending on scrapping, and may thus create a limited downward pressure on freight rates. But particularly the Large and Very Large Gas Carrier segments are expected to see none or limited fleet growth in 2006 and into 2007, thus providing potential for continued high freight rates in these segments in the medium term – notably assuming that demand growth remains healthy. In the longer term in 2008 and 2009, new deliveries particularly in the VLGC segment appear overwhelming and will despite of scrapping of the older part of the fleet require an almost similarly significant demand growth in order to maintain high freight rates.
The large volume of LPG ship orders with delivery in 2008+ mainly rests on expectations that demand growth in future years will be significantly boosted by the arrival of new LPG supply sources in connection to the arrival of numerous new LNG liquefaction and exporting facilities situated particularly in the Middle Eastern and West African regions.
The problem is that it is highly uncertain how much LPG will actually be stripped from the LNG stream before being shipped. If demand for LPG turns out to be depressed, less LPG will be stripped from the LNG stream and consequently less LPG ships will be needed.
How much extra shipping capacity is needed for future LPG exports primarily depends on demand in the three principal outlets for the incremental LPG and LNG supplies: China, India and the US.
Unfortunately, China already has proven to be an uncertain market to rely on given its price inelastic characteristics and growing domestic supply of LPG. Additionally, China is due to start up its first LNG receiving terminal in Shenzen, south China which is expected to displace nearly 200,000 tonnes (about 3%) of LPG imports this year (Argus LPG World). As China is expected to build

29 Danish Ship Finance (Danmarks Skibskredit)
up additional LNG receiving terminals in coming years, additional LPG imports could thus be displaced. Furthermore, as developing countries such as India and China use LPG systems to build up customer bases prior to expanding natural gas systems, the pending start to LNG imports to China and India, in addition to China’s fast growing natural gas pipeline infrastructure (taking domestically produced natural gas from the eastern regions to the coastal city areas) could thus in coming years displace some of the imported LPG currently used for urban domestic cooking and as a heating fuel. This is much similar to what has happened in Japan and Chile in the last decade. Despite the above mentioned threats from domestic natural gas production and LNG imports, a significant downturn in LPG demand in China and India is fortunately not in the cards as LPG always is to prefer in areas where the terrain is too difficult and the population is too sparse to justify building a natural gas pipeline. Additionally, with the rapid reduction in the share of China’s population that lives in deep poverty, it may be expected that the general demand for LPG for domestic use is rising in China. Instead, we may only imagine a slowdown or even a slightly negative LPG import growth in China in coming years. In the US, on the other hand, natural gas and LPG coexist without being a serious threat to each other as about half of the nation’s LPG is used as a petrochemical feedstock rather than for domestic use. But unfortunately, the US petrochemical sector is facing hard competition from Asian and Middle Eastern chemical producers who are able to purchase much cheaper feedstock for their production, thereby rendering it unlikely that much new petrochemical cracker capacity will be added in the US in coming years. If in future years the main growth in global petrochemical output capacity takes place in the Middle East instead of in the US, a significant share of future incremental demand for the VLGC ships may thus disappear as the trading distances become much shorter because the LPG is sourced directly from the Middle East region.
Conversely, as some of the output of the new Middle East chemical capacity is likely to be ethylene, of which some of it may be destined for export, particularly the subsegment of LPG ships that is able to transport ethylene (most of them between 4,000 and 12,000 cubic meters) are expected to draw benefit from increased Middle East petrochemical production. This may be the reason for the growing interest in building new ethylene LPG ships in the recent period. Additionally, the US petrochemical sector is highly sensitive to the macroeconomic situation because its products are the basic building blocks of most consumer goods. As the US economy, and especially its private consumption, is expected to exhibit a slowdown in coming years, it may thus be expected that demand for non-durable goods will exhibit a similar slowdown – leading to a slowdown in US demand for LPG. Despite all of the above mentioned threats to demand for seaborne LPG imports (Chinese price inelasticity, Chinese and Indian LPG being displaced by domestic natural gas and LNG imports, domestic production of LPG, Middle East petrochemical production growth, and slowing demand growth in the US), it is important to remember that LPG historically has not been a demand-pulled fuel but rather has been a supply-pushed substitute to other fossil fuels. This implies that the adjustment process arising from too much supply of LPG might take the form of a fall in LPG prices relative to other fossil fuels rather than that of a clear reduction in the share of LPG stripped from the LNG stream. This brings support to the expectations of a significant demand growth for LPG ships in coming years. In conclusion, in 2006-2007 freight rates particularly of the small and medium LPG ships are probably to exhibit a slight downward correction as fleet growth slowly takes off. In the longer term the outlook is increasingly difficult to call as new orders of VLGCs continue to enlarge the already massive orderbook with delivery in 2008+. The shipowners apparently already seem to count on the maximum possible LPG being stripped from the expected growth in LNG production

30 Danish Ship Finance (Danmarks Skibskredit)
DDrryy BBuullkk SShhiippss Continued freight rate volatility as China built iron ore stocks and growth in global steel demand beats expectations. Contracting stays subdued despite limited orderbook and much improved freight rate expectations for the coming 6-12 months.
FREIGHT RATES 1st quarter boom-bust followed by renewed upturn The first half of 2006 has proven to be yet another rollercoaster for dry bulk freight rates, with Capesize freight rates in the early months of 2006 surging by almost 50% (USD 14,000 a day) within just five weeks. Subsequently, Capesize freight rates fell back, but have recently displayed renewed life. Although volatile, the volati-lity has indeed come down from the extreme levels of 2003-2005.
In the Panamax and Handymax segments, freight rates have displayed a more gradual rise throughout the six-month period and have by now risen by a higher 70% (USD 8,300 a day).
SUPPLY & DEMAND
Pre-emptive Chinese iron ore stock built & steel export boom As depicted by the lower graph on the right, stocks of iron ore at Chinese seaports experienced a significant boost in the first three months of 2006. The excessive stock-building was a pre-emptive move by Chinese steel mills and iron ore traders ahead of the April iron ore contract price renegotiations. As the market expected an iron ore price increase for the new contract period, Chinese steel mills and iron ore traders thus imported extra iron ore ahead of the expected April price increase, thereby temporarily creating extra demand for dry bulk ships.
The 1st quarter boost to Capesize freight rates was further aided by unexpected port congestion as a severe cyclone season tempo-rarily damaged some of the major Australian coal and iron ore export facilities. Additionally, the dry bulk market was rattled by labour protests in Brazil which temporarily blocked a key rail line.

31 Danish Ship Finance (Danmarks Skibskredit)

32 Danish Ship Finance (Danmarks Skibskredit)
Chinese imports of iron ore grew by a strong 23% in the first six months of 2006 over the comparable period in 2005. And although 23% is markedly down on the import growth in 2004 and 2005 of 40% and 32% respectively, it is still significantly stronger than the 10-15% growth that the market last year was generally expecting.
A part of the unexpected strength in China’s iron ore imports originates from the sudden boost to stock levels. Of the 23 percent in import growth the 3%-points are related to the boost in stock levels. The higher stocks could thus be a source for later weakness in Chinese iron ore imports in the event that steel mills and iron ore traders should decide to temporarily draw on stocks instead of importing.
The remaining 20% import growth is mainly on account of an 18% growth in the Chinese crude steel production during the first half of 2006 over the comparable period in 2005. Similar to the unexpected strength in iron ore imports, the 18% growth in China’s steel production clearly has disproved the earlier hopes and expectations that the Chinese government would be able to curb the excessive growth in China’s steel production.
As depicted by the red area in the graph on the previous page, China’s crude steel production has again turned much higher than apparent consumption. Chinese domestic crude consumption in the first six months of 2006, were about 13% higher than during the comparable period in 2005, and thus much slower than the 18% growth in production. As a result of over-capacity, the Chinese steel industry has seen it difficult to push rising feedstock costs onto its domestic customers and thus seen much lower domestic price increases than experienced in other major steel consuming regions (see upper graph on the right). Rising iron ore prices and almost non-existent pricing power thus resulted in a substantial 57% drop in the Chinese steel industry’s 1st quarter profits compared to the 1st quarter of 2005.
So far this year, the Chinese steel industry has been able to offload a large part of its excess production to other countries, primarily because growth rates in steel demand in these other countries have proven much stronger than experienced last year. According to Steel Business Briefing (SBB), the main beneficiaries
33 Danish Ship Finance (Danmarks Skibskredit)
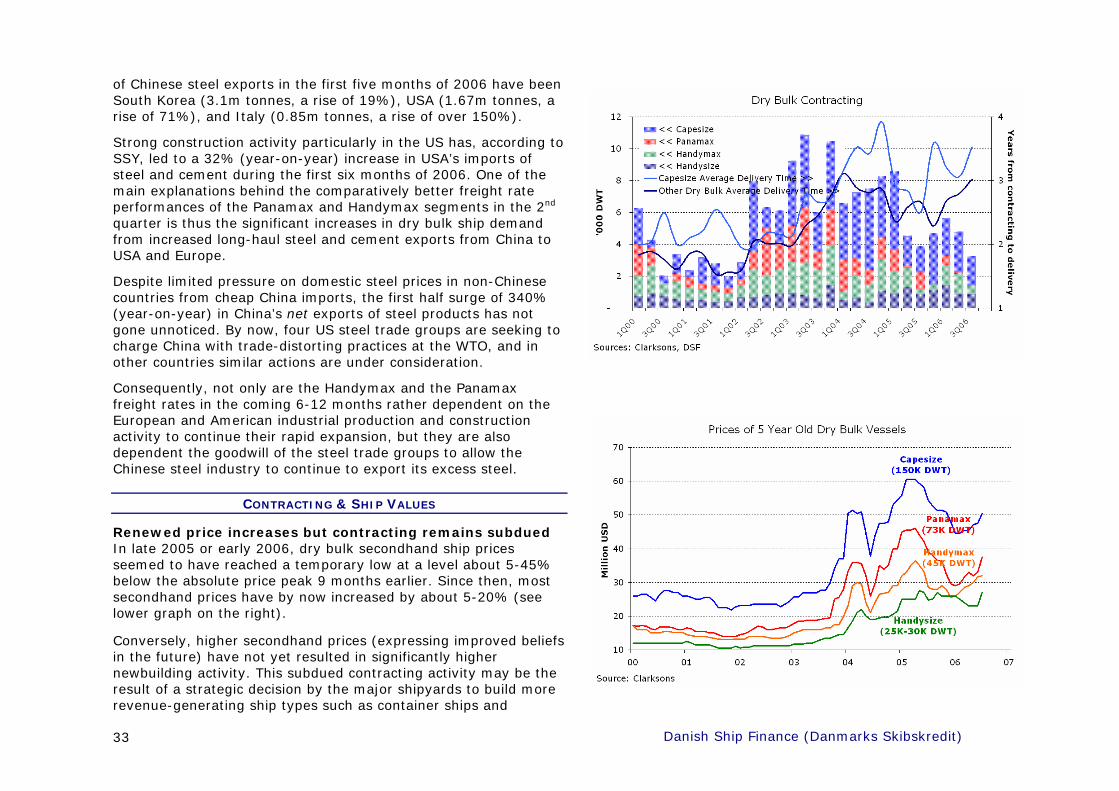
of Chinese steel exports in the first five months of 2006 have been South Korea (3.1m tonnes, a rise of 19%), USA (1.67m tonnes, a rise of 71%), and Italy (0.85m tonnes, a rise of over 150%).
Strong construction activity particularly in the US has, according to SSY, led to a 32% (year-on-year) increase in USA’s imports of steel and cement during the first six months of 2006. One of the main explanations behind the comparatively better freight rate performances of the Panamax and Handymax segments in the 2nd quarter is thus the significant increases in dry bulk ship demand from increased long-haul steel and cement exports from China to USA and Europe.
Despite limited pressure on domestic steel prices in non-Chinese countries from cheap China imports, the first half surge of 340% (year-on-year) in China’s net exports of steel products has not gone unnoticed. By now, four US steel trade groups are seeking to charge China with trade-distorting practices at the WTO, and in other countries similar actions are under consideration.
Consequently, not only are the Handymax and the Panamax freight rates in the coming 6-12 months rather dependent on the European and American industrial production and construction activity to continue their rapid expansion, but they are also dependent the goodwill of the steel trade groups to allow the Chinese steel industry to continue to export its excess steel.
CONTRACTING & SHIP VALUES
Renewed price increases but contracting remains subdued In late 2005 or early 2006, dry bulk secondhand ship prices seemed to have reached a temporary low at a level about 5-45% below the absolute price peak 9 months earlier. Since then, most secondhand prices have by now increased by about 5-20% (see lower graph on the right).
Conversely, higher secondhand prices (expressing improved beliefs in the future) have not yet resulted in significantly higher newbuilding activity. This subdued contracting activity may be the result of a strategic decision by the major shipyards to build more revenue-generating ship types such as container ships and

34 Danish Ship Finance (Danmarks Skibskredit)
petroleum, chemical and gas tankers. Consequently, shipowners wanting to build dry bulk ships have had to look for other less known shipyards to meet their needs.
OUTLOOK How much longer will China’s rampant investment boom last? As we wrote in our last Shipping Market Review, the prosperity of the dry bulk market in 2006 would indeed depend on the ability of the Chinese government to slow down investment growth and consequently also slow down the growth rate in China’s steel production. The less China’s real estate construction and steel production would slow, the better the dry bulk market would perform in 2006. With China’s fixed asset investments and real estate investments in the first half of 2006 increasing a substantial 29.8% and 24.2% (year-on-year) respectively, thereby accounting for more than 85% of the government’s full-year target for 2006, it is thus no big surprise that China’s steel production and iron ore imports have outperformed even the most optimistic forecasts. The continued surge in investments is to a great extent a result of a massive amount of money flowing to the country from speculative inflows and a rampant trade surplus, which the Chinese central bank to an increasing extent find it difficult to sterilize in the domestic economy. With a closed capital account, keeping Chinese private households and corporate depositors from investing abroad, the inflow of money thus has nowhere to go but some of the more capital intensive sectors in China’s economy (e.g. real estate, construction, mining, cement, aluminium, and other heavy-industry sectors). Thus despite that fundamental demand for the goods and services from these industries should continue to grow healthily, the massive inflow of money leads to even higher investments in capacity increases that may eventually lead to overcapacity, depressed profit margins and possibly a new round of non-performing loans depressing the already fragile banking sector.
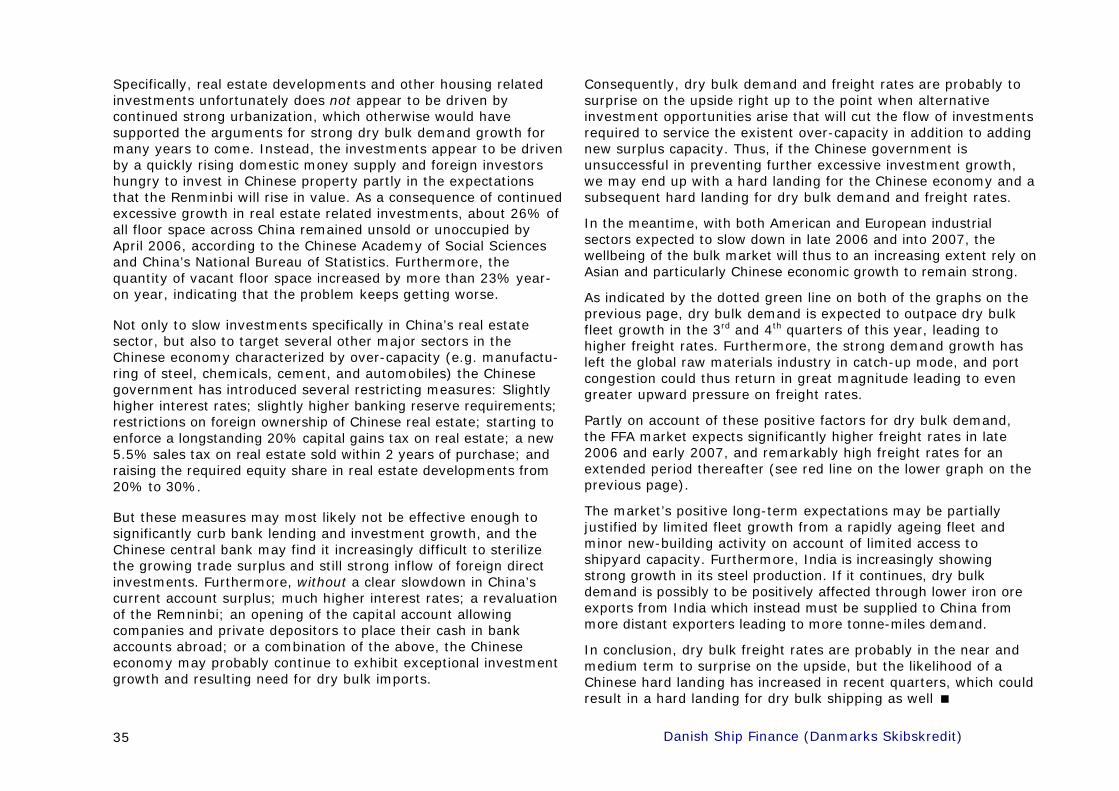
35 Danish Ship Finance (Danmarks Skibskredit)
Specifically, real estate developments and other housing related investments unfortunately does not appear to be driven by continued strong urbanization, which otherwise would have supported the arguments for strong dry bulk demand growth for many years to come. Instead, the investments appear to be driven by a quickly rising domestic money supply and foreign investors hungry to invest in Chinese property partly in the expectations that the Renminbi will rise in value. As a consequence of continued excessive growth in real estate related investments, about 26% of all floor space across China remained unsold or unoccupied by April 2006, according to the Chinese Academy of Social Sciences and China’s National Bureau of Statistics. Furthermore, the quantity of vacant floor space increased by more than 23% year-on year, indicating that the problem keeps getting worse. Not only to slow investments specifically in China’s real estate sector, but also to target several other major sectors in the Chinese economy characterized by over-capacity (e.g. manufactu-ring of steel, chemicals, cement, and automobiles) the Chinese government has introduced several restricting measures: Slightly higher interest rates; slightly higher banking reserve requirements; restrictions on foreign ownership of Chinese real estate; starting to enforce a longstanding 20% capital gains tax on real estate; a new 5.5% sales tax on real estate sold within 2 years of purchase; and raising the required equity share in real estate developments from 20% to 30%. But these measures may most likely not be effective enough to significantly curb bank lending and investment growth, and the Chinese central bank may find it increasingly difficult to sterilize the growing trade surplus and still strong inflow of foreign direct investments. Furthermore, without a clear slowdown in China’s current account surplus; much higher interest rates; a revaluation of the Remninbi; an opening of the capital account allowing companies and private depositors to place their cash in bank accounts abroad; or a combination of the above, the Chinese economy may probably continue to exhibit exceptional investment growth and resulting need for dry bulk imports.
Consequently, dry bulk demand and freight rates are probably to surprise on the upside right up to the point when alternative investment opportunities arise that will cut the flow of investments required to service the existent over-capacity in addition to adding new surplus capacity. Thus, if the Chinese government is unsuccessful in preventing further excessive investment growth, we may end up with a hard landing for the Chinese economy and a subsequent hard landing for dry bulk demand and freight rates.
In the meantime, with both American and European industrial sectors expected to slow down in late 2006 and into 2007, the wellbeing of the bulk market will thus to an increasing extent rely on Asian and particularly Chinese economic growth to remain strong.
As indicated by the dotted green line on both of the graphs on the previous page, dry bulk demand is expected to outpace dry bulk fleet growth in the 3rd and 4th quarters of this year, leading to higher freight rates. Furthermore, the strong demand growth has left the global raw materials industry in catch-up mode, and port congestion could thus return in great magnitude leading to even greater upward pressure on freight rates.
Partly on account of these positive factors for dry bulk demand, the FFA market expects significantly higher freight rates in late 2006 and early 2007, and remarkably high freight rates for an extended period thereafter (see red line on the lower graph on the previous page).
The market’s positive long-term expectations may be partially justified by limited fleet growth from a rapidly ageing fleet and minor new-building activity on account of limited access to shipyard capacity. Furthermore, India is increasingly showing strong growth in its steel production. If it continues, dry bulk demand is possibly to be positively affected through lower iron ore exports from India which instead must be supplied to China from more distant exporters leading to more tonne-miles demand.
In conclusion, dry bulk freight rates are probably in the near and medium term to surprise on the upside, but the likelihood of a Chinese hard landing has increased in recent quarters, which could result in a hard landing for dry bulk shipping as well

36 Danish Ship Finance (Danmarks Skibskredit)
CCaarr CCaarrrriieerrss
An exceptionally tight car carrier charter market prevents the large liner operators from fully optimizing their trade networks. Contracting stays relatively strong and prices edge up as the outlook remains positive despite high fleet growth.
SUPPLY & DEMAND
Tight charter market limits operators’ manoeuvrability The very tight car carrying market from the last two year appears not to have eased much in the past six months. Rather it appears to have tightened further.
Going against logic, the continual strong growth in the deep sea car carrying trade is to some extent actually driven by high oil prices. On the one end, astronomical petroleum related revenues have pushed up Middle East’s imports of high-priced European luxury cars, and on the other end, higher fuel costs have motivated European and American consumers to buy more fuel-efficient cars of which some of them are Far East exports.
But the strong demand for deep sea transport of cars has not been exclusively positive for the large car carrier operators. The lack of available ships to charter has meant that operators have been unable to fully optimize their operational performance in existing trades. Furthermore, the lack of charter ships has rendered it very expensive or even impossible to temporarily remove existing ships in order to have them lengthened to increase their carrying capacity. In order to honour the contract volumes with their longstanding customers, some operators were thus forced to reduce the share of space available to shippers of e.g. secondhand vehicles and high and heavy cargoes.
In addition to the inability to fully optimize operations, the large as well as the small car carrier operators have experienced increased costs from rising bunker prices, which they have been unable to fully transfer onto their customers. The reason behind the inability to fully transfer costs down the chain despite a very tight market, is that automotive manufacturers insist they cannot
bear any costs increases because of tough competition and already depressed profit margins.
CONTRACTING & SHIP VALUES
Minimal contracting slowdown and slightly higher prices Despite high newbuilding prices, a delivery time of more than 2.7 years, and an orderbook that already represented about 35% of the existing fleet, car carrier shipowners continued to order new tonnage in somewhat strong numbers during 1st half 2006.
The tighter market and still buoyant newbuilding activity thus led to 0-5% higher secondhand prices of the large deep sea car carriers, compared to the prevalent prices late last year.
Given the very tight market and large share of elderly ships, contracting activity is probably to remain buoyant, and may even accelerate as yard space becomes available when contracting of other ship types slows down.
OUTLOOK
Large orderbook, slowing demand growth but ageing fleet With more than half of the orderbook in ships larger than 6,000 ceu, the orderbook is portraying a picture of ever growing ship sizes. Specifically the new generation of car carriers of 8,000+ ceu may generate an increased need for feeder services as not all ports will be able to accommodate the large vessels. This will involve a clear change from the way the deep sea car carrying business has worked so far with the vast majority of the trade being on point-to-point routes.
According to the current orderbook, capacity equivalent to 5% and 13% of the current fleet is expected to be delivered from shipyards in the remainder of 2006 and 2007 respectively. But despite relatively high fleet growth, the current market is still so tight that any new ships are probably not to cause a significant fall in the overall fleet utilization

37 Danish Ship Finance (Danmarks Skibskredit)
RRoo--RRoo//FFeerrrriieess
Passenger ferries are still fighting low cost airlines, whereas the Ro-Ro market has regained a bit throughout 1st half of 2006. Fleet capacity is stable with low contracting and demolition activities. The Ro-Ro market is expected to gain further.
SUPPLY & DEMAND
Consolidations, rising costs but increasing demand Passenger ferry companies continue to face considerable competition from low-cost airlines. However, the general market outlook for RO-RO ships in Europe is starting to point to a brighter future after some consolidations have taken place. Market consolidation has been particularly evident among operators in the English Channel and the North Sea, where acquisitions and the following changes in the departure schedule appear to have improved profitability. Thus, it seems that consolidation and specialisation has enabled economy of scale and an optimization of the cost structure. Hence, this has improved the competitive position of Ro-Ro operators compared not only with other vessel types, but also with road hauliers. Improved market conditions have, disregarding rising operating costs, enabled an improvement of the operator’s earnings throughout the 1st half of 2006. By now, higher earnings have deferred the decision to lay-up tonnages whereas the high steel prices have caused that older ships already in lay-up have been scrapped. According to Clarkson’s data, 3 vessels have been scrapped in the 1st half of 2006.
CONTRACTING & SHIP VALUES
Modest contracting and higher newbuilding prices Increased demand and the relatively tight supply-demand balance, combined with high steel prices have enabled a 4% increase in newbuilding prices throughout the 1st half of 2006. In comparison, secondhand prices have gained 6% for a 5-year-old ship and 8% for a 20-year-old ship in the same period. The
greater impact on older ships’ values may be due to the fact that current earnings have a relatively larger impact on the valuation of older ship than they have on ships with a longer remaining trading life. The orderbook currently stands at 79 vessels of 134,597 lane metres or 10% of the existing fleet. With the average age of the current fleet approx. 20 year, and with 45% of the fleet (measured in lane metres) older than 25 years and 13% older than 30 years, the orderbook seems modest.
OUTLOOK
Increasing demand and contracting activity We expect demand to increase due to improved market conditions and due to the expected impact of EU-funded programs such as the Marco Polo aid and Motorways of the Sea program. Further, several operators have announced that they expect capacity shortage on some routes and thus that route expansions are required in years to come. Thus, it seems that there is a potential vessel supply shortage in 2007 and 2008 as we expect further demolition activity given the large share of elderly ships (the average scrapping age has been 25 years). Besides, the impact of rising oil prices on Ro-Ro and ferry demand is to some degree ambiguous. On the one hand it increases operating costs (which in the past not always have been transferred to the customers), but on the other hand, high oil prices provide Ro-Ro and ferries with a comparative advantage compared to road hauliers (measured on a marginal cost per transport distance). This perspective adds further to the upside potential for Ro-Ro (and ferries). Further, in accordance with our previous ‘Shipping Market Review’ we expect operators to continue their increased focus on pure cargo Ro-Ro services

38 Danish Ship Finance (Danmarks Skibskredit)
OOffffsshhoorree SSuuppppoorrtt VVeesssseellss Previous records have been significantly beaten as AHTS dayrates sky-rocket. Consequently, orders of new ships and secondhand prices boom similarly. The outlook for 2006 remains very healthy, but the outlook for 2007 may show a setback as fleet grows.
FREIGHT RATES Almost double up on previous North Sea AHTS records The first half of 2006 turned out much better than our most optimistic expectations for the offshore supply vessels. Almost all types of offshore supply vessels in almost all offshore regions around the world experienced extraordinarily high charter rates. In the North Sea, AHTS dayrates reached levels that were drastically higher than any previous records, and PSVs saw dayrates above the otherwise remarkable levels of last year. In the Gulf of Mexico (GoM), charter rates remained high as repair work following the extensive damages from hurricanes Ivan, Katrina and Rita continued to require vessels. Consequently, the North Sea have continually seen ships being pulled away to do repair work in the GoM, thereby helping to keep the North Sea market extremely tight. As the GoM repair work primarily is on subsea installations or on large floating structures, particularly subsea construction vessels and Dynamic Positioning vessels with large accommodation facilities and cranes experience strong demand. In other offshore drilling regions, availability of ships has remained tight resulting in record breaking dayrates reported. Importantly, according to the Norwegian shipbroker Fearnley Offshore Supply, the high spot rates now to a greater degree than earlier have resulted in an upward-going pressure on rates for medium and long term periods.

39 Danish Ship Finance (Danmarks Skibskredit)
SUPPLY & DEMAND World-wide demand bonanza as E&P activity surges The global offshore support vessel market has proven extremely resilient against a large number of new ships being delivered to the market and a reactivation of several ships in lay-up.
In the previous Shipping Market Review, we raised concerns that offshore support vessels would perhaps only see limited demand growth in the short term because of few additional offshore drilling rigs being built. And combined with fast growing AHTS and PSV fleets it would subsequently lead to lower charter rates. Fortunately for offshore shipowners, these concerns have so far proved unjustified.
Particularly the North Sea AHTS and PSV spot markets have experienced a lack of available tonnage as almost all of the new ships being delivered from the shipyards were already signed on long-term contracts for work outside the North Sea.
The offshore market’s tightness and overall healthiness is apart from the AHTSs and PSVs segments further demonstrated by buoyant activity in the segments of seismic vessels, construction vessels, ROV support vessels and accommodation vessels. Improved activity in the seismic segment is particularly important as it confirms that energy companies are increasingly eager to discover new areas for later development, and that the AHTSs and PSVs also in the long term will be in demand to support the exploration and production efforts of these areas.
CONTRACTING & SHIP VALUES
Contracting activity just keeps gaining speed, prices go up According to Clarkson, 99 AHTSs and 66 PSVs were ordered during the first six months of 2006. This by far surpassed the order activity for all of 2005 of 81 and 58 AHTSs and PSVs respectively. Furthermore, it is the highest number of AHTSs and PSVs ever contracted during any previous six-month period.
Beside from the high contracting numbers, the most noticeable development within the offshore shipyard industry has been the

40 Danish Ship Finance (Danmarks Skibskredit)
marked increase in number of ships built by Asian shipyards. Previously, European yards almost had monopoly on building large AHTSs and large PSVs, but now Asian yards are indeed making headway into these ship segments as well.
Although the above contracting numbers sound daunting, they may be partly deceiving as the majority of above orders are for AHTSs with a capacity below 10,000 or for PSVs with a capacity below 2,000 dwt. Particularly these segments are characterized by a disproportional large share of elderly ships that in time will have to be replaced by new ships.
Conversely, as depicted by the figure on the right and the lower figure on the previous page, both the AHTS 10,000+ BHP segment and the PSV 2,000+ Dwt segment are set to see an exceptionally large number of ships being delivered in the next 2-3 years. As very few ships are prone for scrapping in the PSV segment of 2,000+ dwt but the opposite being the case in the segment of PSVs below 2,000 dwt, we are probably to experience a significant cascading activity with large PSVs displacing smaller vessels.
The much improved charter markets have within the last six months led to an increase in offshore vessel secondhand prices in the magnitude of 5-40% with a particularly positive development for the 10-15 year old ships.
OUTLOOK
Limited rig fleet growth, high offshore vessel fleet growth As the majority of the offshore gas and oil drilling rigs on order at the construction yards are expected to be delivered after 2007, the probability exists that there is not going to be enough rigs in operation to soak up the significant growth in the AHTS and PSV fleets until then.
The fact that the market has been able to perfectly absorb the delivery of 88 AHTSs and 65 PSVs within the last 1½ year makes these concerns less pronounced. But, as at least a part of the demand increase for AHTSs and PSVs was due to a remobilization of cold stacked rigs, the same increase in demand can thus not be repeated in 2006 or 2007 as the number of remaining cold stacked
rigs is almost non-existing. Furthermore, the offshore support vessels have experienced a temporary demand from construction activity and repair work as a direct result of the 2005 hurricanes in the GoM. This work will most likely continue well into 2007, if not into 2008, thereby continuing to require tonnage, but the demand boost from this work is expected to gradually fade. In conclusion, the offshore support vessel markets in the North Sea, Gulf of Mexico and elsewhere are for the remainder of 2006 expected to remain exceptionally tight with resulting high but volatile dayrates. In 2007 and the immediate years to follow the offshore markets are probably to remain profitable for the vessel owners, although dayrates are probably not to return to the exceptional levels of 2006. Importantly, if gas and petroleum prices were to drop perceptibly from current levels, it may lead to a subsequent significant drop in offshore drilling activity

41 Danish Ship Finance (Danmarks Skibskredit)
GGlloossssaarryy Aframax: Crude oil tanker or product tanker too
large to pass through the Panama Canal and below 120,000 dwt.
AHTS: Anchor Handling Tug Supply. Offshore vessel used for jobs such as the relocation of oil rigs and anchors of the oil rigs.
ARM: Adjustable Rate Mortgage. Mortgage loan with a variable interest rate that is being adjusted on a regular basis.
Back-haul: The leg of the trade route that has the lowest container volumes is often called ’back-haul, whereas the return leg is often referred to as ‘head-haul’.
Barrel: A volumetric unit measure for crude oil and petroleum products equivalent to 42 U.S. gallons, or approximately 159 litres.
BHP: Break Horse Power. The amount of engine horsepower.
Brent: Term used for crude oil from the North Sea. Brent oil is traded at the International Petroleum Exchange in London, and the price of Brent is used as a benchmark for several other types of European oil.
Bulk vessel: Description of vessels transporting large cargo quantities, including coal, iron ore, steel, corn, gravel, oil, gas, etc.
Bunker: Fuel for vessels. Call on OPEC: Defined as total global petroleum demand
minus non-OPEC supply minus OPEC natural gas liquid supply.
Capesize: Dry bulk carrier of more than approximately 80,000 dwt; too large to pass through the Panama Canal.
Cbm: Cubic Meter. Ceu: Car equivalent unit. Unit of measure
indicating the car carrying capacity of a vessel.
Cgt: Compensated Gross Tonnage. International unit of measure that facilitates a comparison of different shipyards’ production regardless of the types of vessel produced.
Clarkson: British ship brokering and research company. www.clarksons.net
Clean products: Refers to light, refined oil products such as jet fuel, gasoline and naphtha.
CoA: Contract of Affreightment. Contract between shipping company and shipper concerning the freight of a predetermined volume of goods within a given period of time and/or at given intervals.
CSR: Common Structural Rules. A common set of construction rules agreed by the leading international classification societies to be applied to all new construction contracts from April 1, 2006 between shipyards and shipowners for tankers of 150 m or more in length and bulk carriers of 90 m or more in length. The CSR require the ships to be built at a higher set of standards thus enabling the ships to trade for longer.
Dirty products: Refers to heavy oils such as crude oil or refined oil products such as fuel oil, diesel oil or bunker oil.
Drewry: Drewry Shipping Consultants Ltd. British shipping and transport research company. www.drewry.co.uk
Dwt: Dead Weight Tons. Indication of a vessel’s cargo carrying capacity (including bunkers, ballast, water and food supplies, crew and passengers).
Dynamic Positioning: Special instruments on board that in conjunction with bow thrusters and main propellers enable the ship to position itself

42 Danish Ship Finance (Danmarks Skibskredit)
in a fixed position in relation to the seabed.
EIA: Energy Information Administration. A subsidiary of the US Department of Energy. www.eia.doe.gov
E&P: Exploration and Production. Fearnleys: Norwegian ship brokering and research
company. www.fearnleys.no Feeder: Small container carrier. FPSO: Floating Production Storage Offloading
unit. Vessel used in the offshore industry to process and store oil from an underwater (sub-sea) installation.
Geared: Indicates that a vessel is equipped with a crane or other lifting device.
Gearless: Indicates that a vessel is not equipped with a crane or other lifting device.
Global Insight: American economic consulting company. www.globalinsight.com
Gt: Gross Tons. Unit of 100 cubic feet or 2.831 cubic meters, used in arriving at the calculation of gross tonnage.
Handy, tank: Crude oil tanker, product tanker or chemical tanker of between 10,000 and 25,000 dwt.
Handymax, dry cargo: Dry bulk carrier of between approximately 40,000 and 60,000 dwt.
Handysize, dry cargo: Dry bulk carrier of between approximately 10,000 and 40,000 dwt.
Head-haul: The leg of the trade route that has the highest container volumes is often called ’head-haul, whereas the return leg is often referred to as ‘back-haul’. On routes where there is a great trading volume mismatch between head-haul and back-haul, the head-haul demand will most often determine the freight rate level.
IEA: International Energy Agency. A subsidiary of the OECD. www.iea.org
Imarex: International Maritime Exchange. www.imarex.com
IMO: International Maritime Organization. An organisation under the UN.
IMO I-III: Quality grades for tankers for the permission to transport different chemical and oil products. IMO I are the most hazardous products, IMO III the least hazardous.
Chemical tanker: Tanker with coated or stainless steel tanks (IMO I-III).
LOOP: Louisiana Offshore Oil Port. A deepwater port in the Gulf of Mexico off the coast of Louisiana. LOOP provides tanker offloading and temporary storage services for crude oil transported on some of the largest tankers in the world of which some are too large for U.S. inland ports.
LPG vessels: Liquefied Petroleum Gas. Vessels used to transport ammonia and liquid gases (ethane, ethylene, propane, propylene, butane, butylenes, isobutene and isobutylene). The gases are transported under pressure and/or refrigerated.
LR1, product tanker: Long Range 1. Product tanker with the maximum dimensions for passing through the Panama Canal (width of 32.21 metres and length of 289.5 metres) of approximately 50,000—80,000 dwt.
LR2, product tanker: Long Range 2. Product tanker too large to pass through the Panama Canal and larger than approximately 80,000 dwt.
Medium, tanker (MR): Medium Range. Product tanker of between 25,000 and 50,000 dwt.
MEW: Mortgage Equity Withdraw. Defined as equity extracted from existing homes via cash-out refinancing, home equity borrowing, and/or housing turnover.

43 Danish Ship Finance (Danmarks Skibskredit)
Multi-Purpose: Dry bulk carrier with multiple applications, mainly as a feeder vessel or for special cargo.
Nautical Mile: Distance unit measure of 1,582 meters, or 6,076.12 ft.
Offshore vessel: Vessel serving the offshore oil industry. OPEC: Organisation of Petroleum Exporting
Countries. Panamax, container: Container carrier with the maximum
dimensions for passing through the Panama Canal (width of 32.21 metres, length of 291 metres) of approximately 3,000—5,000 teu.
Panamax, tanker: Crude oil tanker or product tanker with the maximum dimensions for passing through the Panama Canal (width of 32.21 metres and length of 289.5 metres) of approximately 50,000—80,000 dwt.
Panamax, dry cargo: Dry bulk vessel with the maximum dimensions for passing through the Panama Canal (width of 32.21 metres and length of 289.5 metres) of approximately 60,000—80,000 dwt.
PCC: Pure Car Carrier. Car carrier built exclusively to transport passenger cars.
Post-Panamax: Container vessel of approximately 4,000+ teu that is too large to pass through the Panama Canal.
Product tanker: Tanker vessel with coated tanks used to transport refined oil products.
PSV: Platform Supply Vessel. Offshore vessel serving the offshore oil installations.
Ro-Ro: Roll On – Roll Off. Common description of vessels on which the cargo is rolled on board and ashore.
SSY: Simpson Spence & Young, British ship brokering and research company. www.ssy.co.uk
Suezmax: Crude oil tanker with the maximum dimensions for passing through the Suez
Canal (approximately 120,000—200,000 dwt.).
TCE: Time Charter Equivalent. Teu: Twenty Feet Equivalent Unit. Container
with a length of 20 feet (about 6 metres) which forms the basis of describing the capacity of a container vessel.
Teu-knots: Unit of measure that takes account of the speed of the ships when estimating the actual supply of ships within a segment.
Teu-nautical mile: Unit of measure indicating the volume of cargo, measured in teu, and how far it has been transported, measured in nautical miles.
Ton-nautical mile: Unit of measure indicating the volume of cargo, measured in ton, and how far it has been transported, measured in nautical miles.
Tonnage: Synonymous with “vessel”. ULCC: Ultra Large Crude Carrier. Crude oil tanker
above 320,000 dwt. VLCC: Very Large Crude Carrier. Crude oil tanker
of between approximately 200,000 and 320,000 dwt.
VLGC: Very Large Gas Carrier. LPG ship with capacity above 60,000 cbm.
WTI: West Texas Intermediate. Oil price benchmark in the USA.
44
The persons named as the authors of this report hereby certify that: (i) all of the views expressed in the research report accurately reflect the personal views of the authors about the subjects; and (ii) no part of their compensation was, is, or will be, directly or indirectly, related to the specific recommendations or views expressed in the research report. This report has been prepared by Danish Ship Finance A/S (Danmarks Skibskredit A/S). This report is provided to you for information purposes only. Whilst every effort has been taken to represent as reliable information as possible, DSF does not represent the information as accurate or complete, and it should not be relied upon as such. Any opinions expressed reflect DSF’s judgment at the time this report was prepared and are subject to change without notice. DSF will not be responsible for the consequences of reliance upon any opinion or statement contained in this report. This report is based on information obtained from sources which DSF believes to be reliable, but DSF does not represent or warrants its accuracy. The information in this report is not intended to predict actual results, which may differ substantially from those reflected. This report may not be reproduced, in whole or in part, without the prior written permission of DSF. To Non-Danish residents: The contents hereof are intended for the use of non private customers and may not be issued or passed on to any person and/or institution without the prior written consent of DSF. Additional information regarding this publication will be furnished upon request.
DSF corporate division, contact details: Head of Division Erik I. Lassen, Senior Vice President [email protected] Account Managers Christian Behnke, Vice President [email protected] Anette Berg, Vice President [email protected] Knud Jaeger, Vice President [email protected] Anne Jarling, Vice President [email protected] Berit Koertz, Vice President [email protected] Morten Snede Larsen, Vice President [email protected] Ole Staergaard, Vice President [email protected] Henrik Soegaard Olsen, Vice President [email protected] Hanne M. Pedersen, Vice President [email protected]
Market Research Nikolaj Frederik Kamedula, Analyst [email protected] Christopher Rex, Analyst [email protected] For enquiries regarding this report, please contact Nikolaj Frederik Kamedula.
Danmarks Skibskredit Sankt Annae Plads 3 DK-1250 Copenhagen K Denmark Phone: +45 33 33 93 33 Fax: +45 33 33 96 66 Email: [email protected] Website: www.shipfinance.dk