liquid-liquid separation subsea - folk.ntnu.nofolk.ntnu.no/chribac/experts in teamwork - report -...
TRANSCRIPT

Semester project, EiT
Liquid-Liquid Separation Subsea
Adrian AadalAlisher DjuraevCasimiro Costa
Haris MilakMelissa DlimaSun Tianqi
May 3, 2016
1 PREFACE
The project received at the Subsea crude oil separation village was tilted “Liquid-Liquid sep-aration technology”. The project consisted of the following four tasks: review state-of-the-artseparation devices, review existing measurement devices, demonstrate the difference betweenhigh- and low-level models, and finally explain what slugging is and how to prevent it. The workwas performed in the period from 13th of January to 4th of May.
We would like to use this opportunity to thank our village supervisor Brian Grimes, who provideduseful guidance and feedback on our technical report. We would also thank the village facilitatorsIngvild Finstad and Philip Jackson who have initiated all our exercises and helped us reflect onthe different situations that occurred throughout the course. Finally, we would like to thankour project mentor Christoph Backi who read and gave feedback to our paper in addition toanswering any questions we had.
Contents
1 PREFACE i
2 INTRODUCTION 32.1 COMPONENTS OF SUBSEA INSTALLATIONS . . . . . . . . . . . . . . . . . . 52.2 THE NEED FOR SUBSEA SEPARATION . . . . . . . . . . . . . . . . . . . . . 6
3 SEPARATION 83.1 EQUATIONS . . . . . . . . . . . . . . . . . . . . . . . . . . . . . . . . . . . . . . 133.2 GRAVITY SEPARATORS . . . . . . . . . . . . . . . . . . . . . . . . . . . . . . 143.3 SWIRL SEPARATORS . . . . . . . . . . . . . . . . . . . . . . . . . . . . . . . . 173.4 CYCLONE SEPARATORS . . . . . . . . . . . . . . . . . . . . . . . . . . . . . . 21
4 SLUGGING 26
5 MONITORING AND MEASUREMENTS 315.1 CONTROL AND INSTRUMENTATION . . . . . . . . . . . . . . . . . . . . . . 405.2 MODELING . . . . . . . . . . . . . . . . . . . . . . . . . . . . . . . . . . . . . . 42
6 CONCLUSION 44
References 47
ii
2 INTRODUCTION
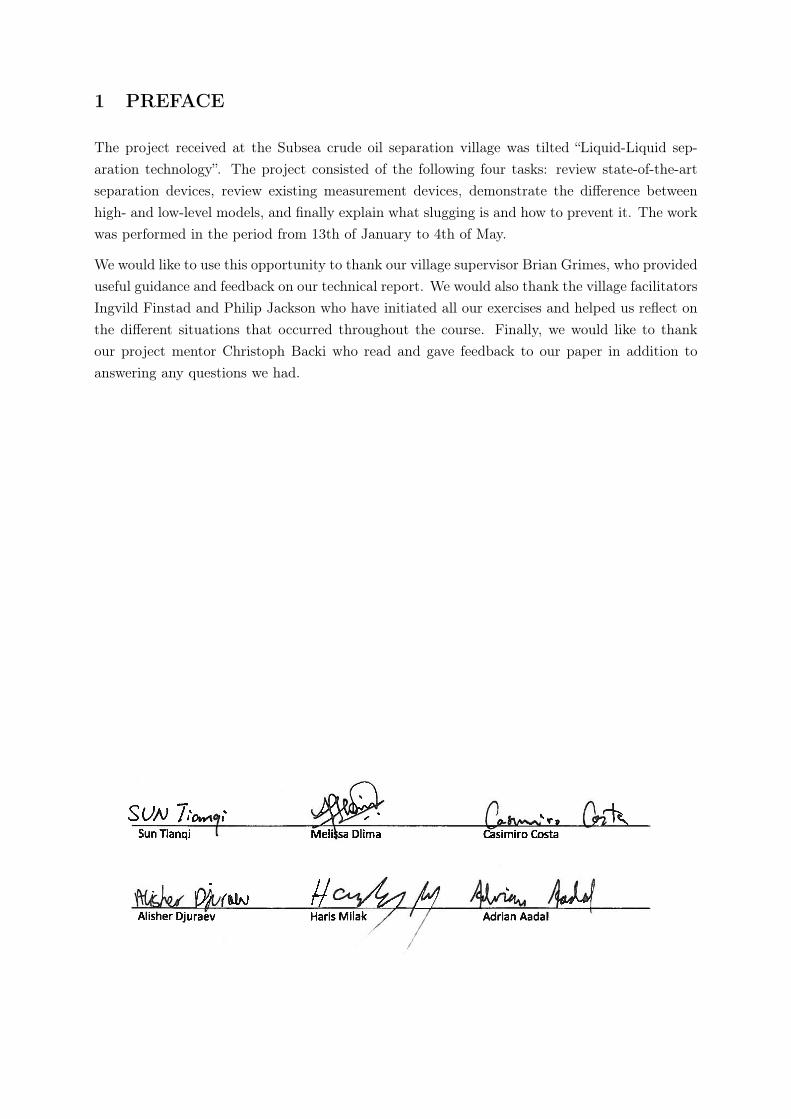
Once a new hydrocarbon field (greenfield) has been discovered, producing oil and gas is a straight-forward process. Because oil and gas are naturally confined at high pressure, when a pipe isinstalled the high pressure will push the fluids up to the platform and so hydrocarbons are pro-duced. However, after the early stage of production (primary recovery) the pressure drops, eventhough only 5-30% of hydrocarbons was extracted from the reservoir [1]. In order to prolongproduction of an existing field (brownfield), once the pressure starts to drop, it is necessary tomaintain the pressure underground. This process is achieved by injecting pressurized water, gasor both into the reservoir, as shown in figure 1.
Figure 1: Hydrocarbon reservoir with water (a) and gas (b) injection wells [1]
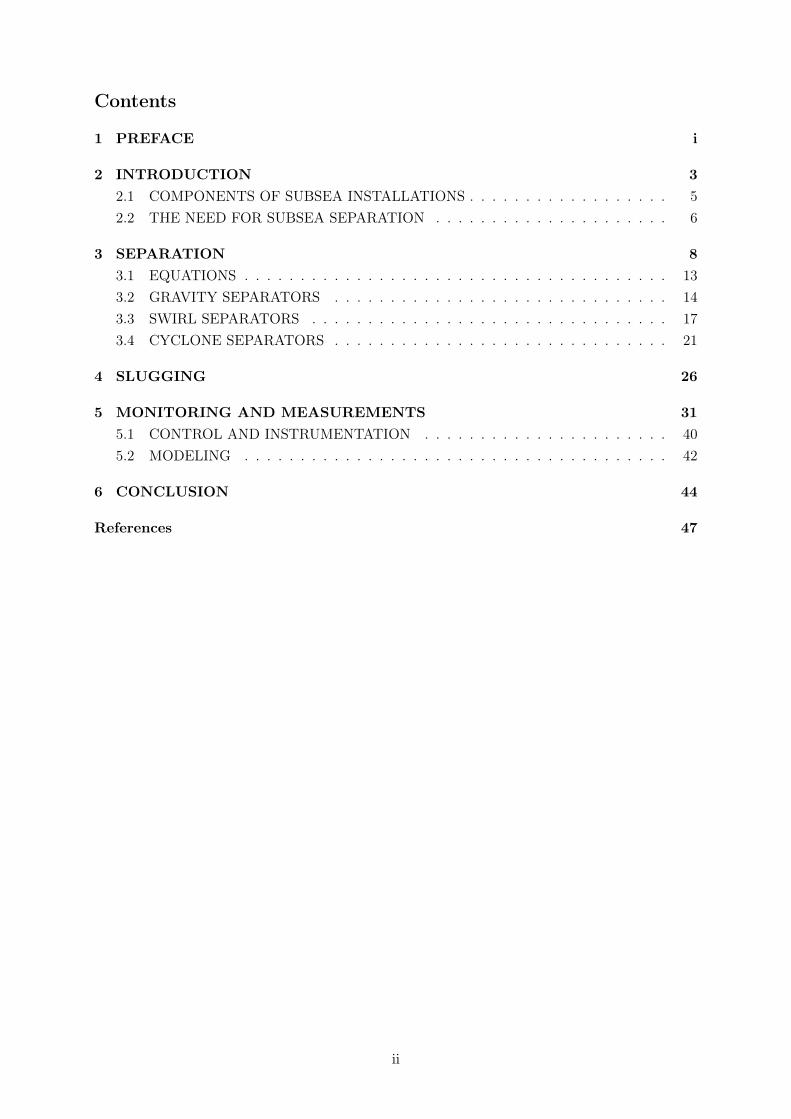
Traditionally, offshore functions such as drilling, preparing water or gas for reinjection, liq-uid–liquid separation, processing the oil and gas before sending it onshore, and cleaning theproduced water for disposal into the sea has solely been performed by platforms. Nowadays thistrend has been changing [2]. The increasing need of oil and gas energy has forced the searchto harsher environments, ultra-deep waters and increased the need for better recovery of theexisting fields. Subsea installations are better suited for these new challenges than platformsbecause in some cases they are safer and more viable, both economically and environmentally.Figure 2 shows the components of (a) a subsea installation with storage vessels (FPSO) attachedto a platform, and (b) a conventional platform [1].
Figure 2: (a) Subsea installation used in conjunction with a host fixed jacket structure (and anFPSO). Source: Fluor Corporation (2009) (b) floating platform [1]
3
One of the main advantages of subsea, as compared to solely using platforms, is that it increasesand accelerates the production capacity of brownfields by finding out the flow rate-limitingequipment and fixing (or changing) them [3]. This process is called debottlenecking. Becauseproduction of a brownfield typically declines due to the decrease in the reservoir pressure, usingsubsea equipment to boost production by preventing pressure drop saves the companies a lot ofmoney. Notice that debottlenecking is also possible with platforms. In fact, prior to 2008, therecovery factor using platform (secondary recovery) was 7% higher than with subsea wells [3].However, since then technological advances have greatly reduced and, in some cases, surpassedthe gap in the recovery factor between the two methods. According to Toine Hendriks, CDSEngineering’s senior process engineer, subsea technology can exploit an oilfield much deeper andincrease recovery up to 10% more from the original reserves [4]. Furthermore, subsea is stillattractive due to the following additional advantages:
First, it enables challenging fields to be developed. Some greenfields, due to their location andsize, may experience low reservoir pressure or are too small for a profitable platform exploration.Subsea installations connected with a nearby platform may be used to boost the pressure orsimply to make production profitable, since no costly platform is installed solely for that givenfield. In addition, subsea installations bypass the problem of freezing temperatures in harshenvironment, such as in the Arctic where topside exploration is difficult due to low tempera-tures, abrupt weather changes and sea ice. According to the US Geological Survey, 30% of theworld’s undiscovered gas and 13% of the world’s undiscovered oil is located in the deep watersof the Arctic. Hence, subsea technologies which enable exploration and development in harshenvironments are more important than ever before, now that most of the "easy oil and gas" hasbeen discovered [3, 5].
Second, it reduces investment costs (CAPEX). By utilizing existing infrastructure and withoutthe need of costly topside modifications, companies could save greatly on CAPEX [5].
Finally, health, safety and environment (HSE) are improved. Subsea is invisible at sea level andso it does not disturb marine life and other activities happening there. It is safer than platformsbecause fewer workers are directly at risk of losing their lives in case of a workplace accident,an un-forecasted storm or other natural disaster [5]. Due to the above advantages and severalothers, subsea installations have attracted the attention of many companies for about half acentury.
4
2.1 COMPONENTS OF SUBSEA INSTALLATIONS
As figure 2 (a) indicated, current subsea installations serve as support for fixed receiving facilities.They are used as an alternative to satellite or minimum-facility platforms for recovering reserveslocated beyond the reach of the drillstring. In addition, they can also be used in conjunctionwith floating production storage vessels (FPS), and floating production storage and offloadingvessels (FPSO).
For any active treatment and handling of hydrocarbons at the seabed, today’s technology allowsthree types of subsea installations, namely: boosting (or pumping), separation and compression.
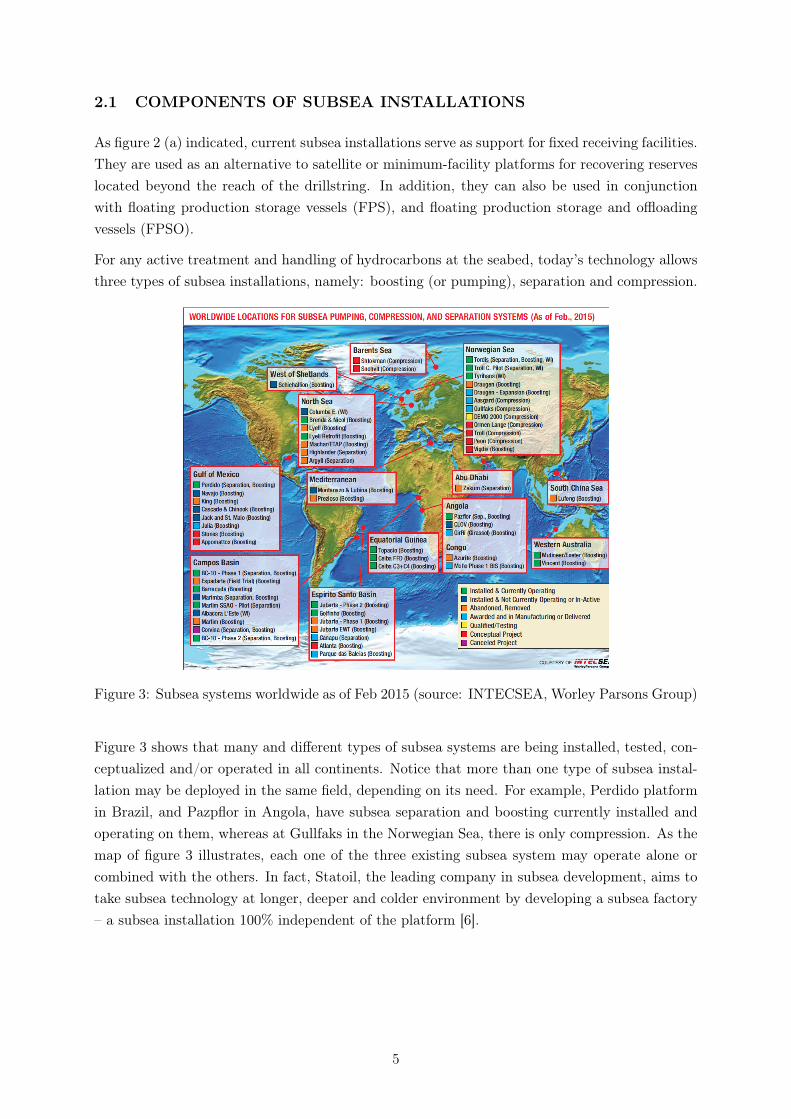
Figure 3: Subsea systems worldwide as of Feb 2015 (source: INTECSEA, Worley Parsons Group)
Figure 3 shows that many and different types of subsea systems are being installed, tested, con-ceptualized and/or operated in all continents. Notice that more than one type of subsea instal-lation may be deployed in the same field, depending on its need. For example, Perdido platformin Brazil, and Pazpflor in Angola, have subsea separation and boosting currently installed andoperating on them, whereas at Gullfaks in the Norwegian Sea, there is only compression. As themap of figure 3 illustrates, each one of the three existing subsea system may operate alone orcombined with the others. In fact, Statoil, the leading company in subsea development, aims totake subsea technology at longer, deeper and colder environment by developing a subsea factory– a subsea installation 100% independent of the platform [6].
5

Figure 4: Statoil’s model of a subsea factory (source: Statoil ASA)
A subsea factory will function as a platform at the seabed by integrating boosting, separation,compression and storage of hydrocarbons, as indicated in figure 4. Boosting installations enhanceproduced fluids (in the liquid or multiphase state) by allowing better pressure management of thereservoir. This leads to an extended tail-end production of the reservoir as well as the reservoirhaving a higher, longer and earlier plateau production. Separators separate oil or gas fromwater or other substances and reinject the water into the reservoir in order to boost production.Compressors compress and cool the gas so that it could be either stored, for sale, or reinjectedinto the reservoir [3]. The magic of a subsea factory is that all the three components would worktogether instead of simply having a combination of one or two as it happens today [6]. In thiswork we focus only on subsea separation, in particular, on liquid-liquid separation.
2.2 THE NEED FOR SUBSEA SEPARATION
When oil is produced, it also produces water, sand, drilling fluids and drill cuttings. Thesesubstances, which are unintentionally produced during oil production, are called productionwaste, or simply waste. Produced water is the most critical of the wastes because it is producedat a very high quantity. During a lifetime of a reservoir, on average, four barrels of waterare produced for each barrel of oil [1]. This trend increases even more as we move into morechallenging fields, as indicated by figure 5(b). As the pressure of a typical brownfield decreaseswith time, the waste increases. For a subsea well, this scenario creates problems in the topsidereceiving facilities because they are not designed to handle increasing amounts of water. Inaddition, the extra water leads to further pressure drop in the flow lines and risers from the wellto topside [5]. This will eventually stop the production or drop the pressure to an unprofitablelevel of production. Subsea separation is used as one way of fixing this problem, shown in figure
6

5(a).
Figure 5: (a) Diagram of a subsea separator system [7] (b) Producible water per barrel [1]
As the diagram in figure 5(a) shows, subsea separators prevent the producible waste from goingdirectly to topside by separating the gas and water from the oil, and sending them separatelyto the platform. While subsea separators separate all the waste from the oil or gas from oil,liquid-liquid separators deal only with water-oil separation. By separating the water from oilbefore sending topside, liquid-liquid separators overcome the problem of pressure drop (causedby excess water in the topside) and emulsion (caused by the presence of water in oil). Thisprocess leads to positive pressure balance and increased production. In addition, the producedwater that has been separated can be used as water injection, as shown in figure 1 (a), andfurther increase pressure in the reservoir. Hence, due to its importance, many subsea separatorshave been implemented around the world, as shown on table in figure 6.
Besides increased production, subsea separators also enable companies to comply with environ-mental requirements regarding disposal of producible waste, including water. Produced wateris composed by elements which can greatly harm the environment, hence discharge of such wa-ter into the ocean are becoming increasingly stricter. Many regulations such as the Baltic SeaConvention and Helcom, the Barcelona Convention (on the Mediterranean Sea), the KuwaitConvention (on the Red Sea), the OSPRARCOM (on the North Sea), the US regulations forthe Gulf of Mexico, among others set stringent rules about the maximum concentration of oil inwater that could be discharged into the sea daily and the monthly average [1]. Therefore, dueto its economic and environmental advantages, subsea separators constitute a vital componentfor any subsea installation.
7
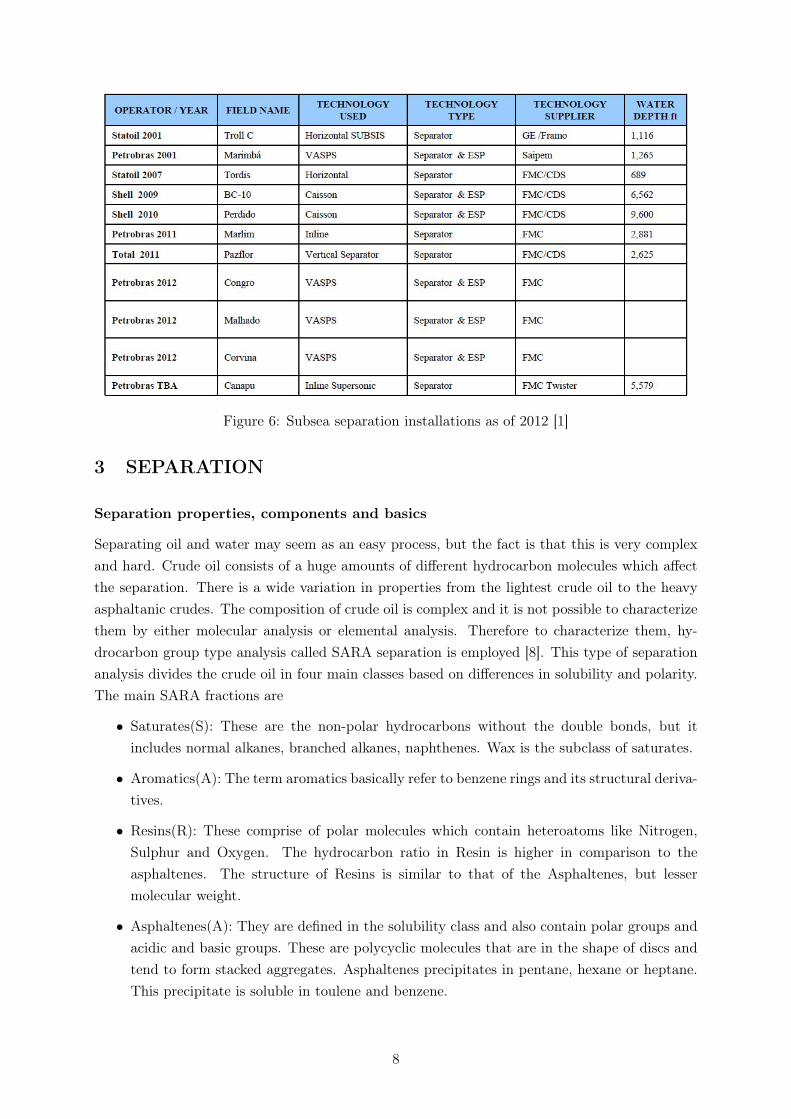
Figure 6: Subsea separation installations as of 2012 [1]
3 SEPARATION
Separation properties, components and basics
Separating oil and water may seem as an easy process, but the fact is that this is very complexand hard. Crude oil consists of a huge amounts of different hydrocarbon molecules which affectthe separation. There is a wide variation in properties from the lightest crude oil to the heavyasphaltanic crudes. The composition of crude oil is complex and it is not possible to characterizethem by either molecular analysis or elemental analysis. Therefore to characterize them, hy-drocarbon group type analysis called SARA separation is employed [8]. This type of separationanalysis divides the crude oil in four main classes based on differences in solubility and polarity.The main SARA fractions are
• Saturates(S): These are the non-polar hydrocarbons without the double bonds, but itincludes normal alkanes, branched alkanes, naphthenes. Wax is the subclass of saturates.
• Aromatics(A): The term aromatics basically refer to benzene rings and its structural deriva-tives.
• Resins(R): These comprise of polar molecules which contain heteroatoms like Nitrogen,Sulphur and Oxygen. The hydrocarbon ratio in Resin is higher in comparison to theasphaltenes. The structure of Resins is similar to that of the Asphaltenes, but lessermolecular weight.
• Asphaltenes(A): They are defined in the solubility class and also contain polar groups andacidic and basic groups. These are polycyclic molecules that are in the shape of discs andtend to form stacked aggregates. Asphaltenes precipitates in pentane, hexane or heptane.This precipitate is soluble in toulene and benzene.
8

Emulsions
To understand separation, it is necessary to understand the emulsions. An emulsion is a dis-persion of one liquid in another immiscible liquid. The phase which is in droplet form is thedispersed phase, and the phase which the droplets are present is called the continuous phase.There can either be water-in-oil or oil-in-water emulsions. An oil-in-water emulsion is easier toseparate [9]. The amount of oil and water in the phases can be very different in the separationsystems. Even though it only looks like there is one phase in the separation process, it usuallyconsists of multiple emulsions, which are more complex, which makes it harder to separate. Forinstance, a water-in-oil-in-water emulsion consists of oil droplets dispersed in the water phase,and this in turn is dispersed in continuous water phase. These are called double emulsions, whichare unstable and hence they quickly form single emulsions [10].
The emulsions from the oil field contains oil, water and emulsifying agents. The emulsifyingagents include the surface active agents and finely divided solids. Surface active agents are morecommonly known as surfactants. The surfactants have a hydrohobic part that has a strongaffinity for oil particles and the hydrophillic part that has a strong affinity for water particles.These surfactants tend to accumulate at the oil water interface forming interfacial films whichfurther leads to the lowering of the interfacial tensions. Asphaltenes, resins, oil soluble organicacids and bases are the emulsifiers in the crude that occur naturally. Heavy crude oils containlarge quantities of asphaltenes and it is their surface active nature which makes them betteremulsifiers than the other naturally occurring emulsifiers present in the crude oil [11].
Figure 7: The picture to the left is W/O and the picture to the right is O/W emulsions
Figure 8: Water-in-oil-in-water emulsion
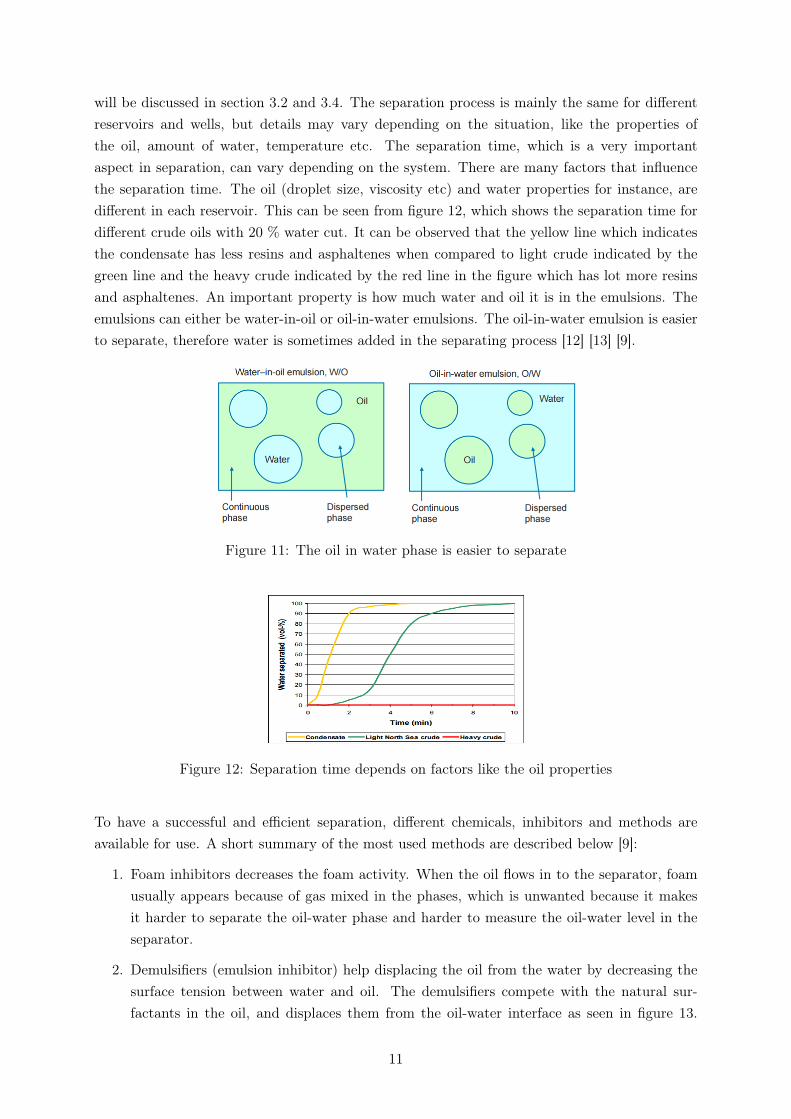
The first step of separation is flocculation. Droplets of oil gather together, and if the interfacialfilm is weak, the flocculation force may be sufficient to break the film and cause coalescence, whichis basically when droplets melt together and form a bigger droplet. The amount of the differenthydrocarbon components in the crude oil, amount of water etc, will effect the flocculation and
9
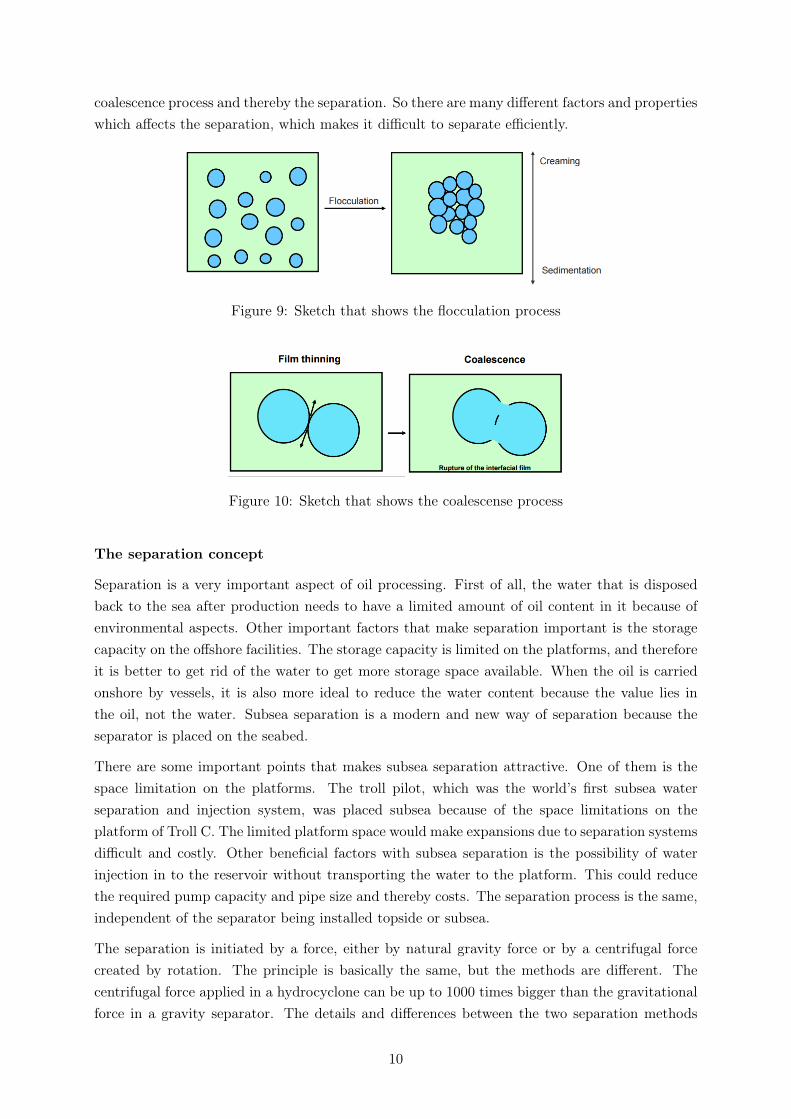
coalescence process and thereby the separation. So there are many different factors and propertieswhich affects the separation, which makes it difficult to separate efficiently.
Figure 9: Sketch that shows the flocculation process
Figure 10: Sketch that shows the coalescense process
The separation concept
Separation is a very important aspect of oil processing. First of all, the water that is disposedback to the sea after production needs to have a limited amount of oil content in it because ofenvironmental aspects. Other important factors that make separation important is the storagecapacity on the offshore facilities. The storage capacity is limited on the platforms, and thereforeit is better to get rid of the water to get more storage space available. When the oil is carriedonshore by vessels, it is also more ideal to reduce the water content because the value lies inthe oil, not the water. Subsea separation is a modern and new way of separation because theseparator is placed on the seabed.
There are some important points that makes subsea separation attractive. One of them is thespace limitation on the platforms. The troll pilot, which was the world’s first subsea waterseparation and injection system, was placed subsea because of the space limitations on theplatform of Troll C. The limited platform space would make expansions due to separation systemsdifficult and costly. Other beneficial factors with subsea separation is the possibility of waterinjection in to the reservoir without transporting the water to the platform. This could reducethe required pump capacity and pipe size and thereby costs. The separation process is the same,independent of the separator being installed topside or subsea.
The separation is initiated by a force, either by natural gravity force or by a centrifugal forcecreated by rotation. The principle is basically the same, but the methods are different. Thecentrifugal force applied in a hydrocyclone can be up to 1000 times bigger than the gravitationalforce in a gravity separator. The details and differences between the two separation methods
10
will be discussed in section 3.2 and 3.4. The separation process is mainly the same for differentreservoirs and wells, but details may vary depending on the situation, like the properties ofthe oil, amount of water, temperature etc. The separation time, which is a very importantaspect in separation, can vary depending on the system. There are many factors that influencethe separation time. The oil (droplet size, viscosity etc) and water properties for instance, aredifferent in each reservoir. This can be seen from figure 12, which shows the separation time fordifferent crude oils with 20 % water cut. It can be observed that the yellow line which indicatesthe condensate has less resins and asphaltenes when compared to light crude indicated by thegreen line and the heavy crude indicated by the red line in the figure which has lot more resinsand asphaltenes. An important property is how much water and oil it is in the emulsions. Theemulsions can either be water-in-oil or oil-in-water emulsions. The oil-in-water emulsion is easierto separate, therefore water is sometimes added in the separating process [12] [13] [9].
Figure 11: The oil in water phase is easier to separate
Figure 12: Separation time depends on factors like the oil properties
To have a successful and efficient separation, different chemicals, inhibitors and methods areavailable for use. A short summary of the most used methods are described below [9]:
1. Foam inhibitors decreases the foam activity. When the oil flows in to the separator, foamusually appears because of gas mixed in the phases, which is unwanted because it makesit harder to separate the oil-water phase and harder to measure the oil-water level in theseparator.
2. Demulsifiers (emulsion inhibitor) help displacing the oil from the water by decreasing thesurface tension between water and oil. The demulsifiers compete with the natural sur-factants in the oil, and displaces them from the oil-water interface as seen in figure 13.
11
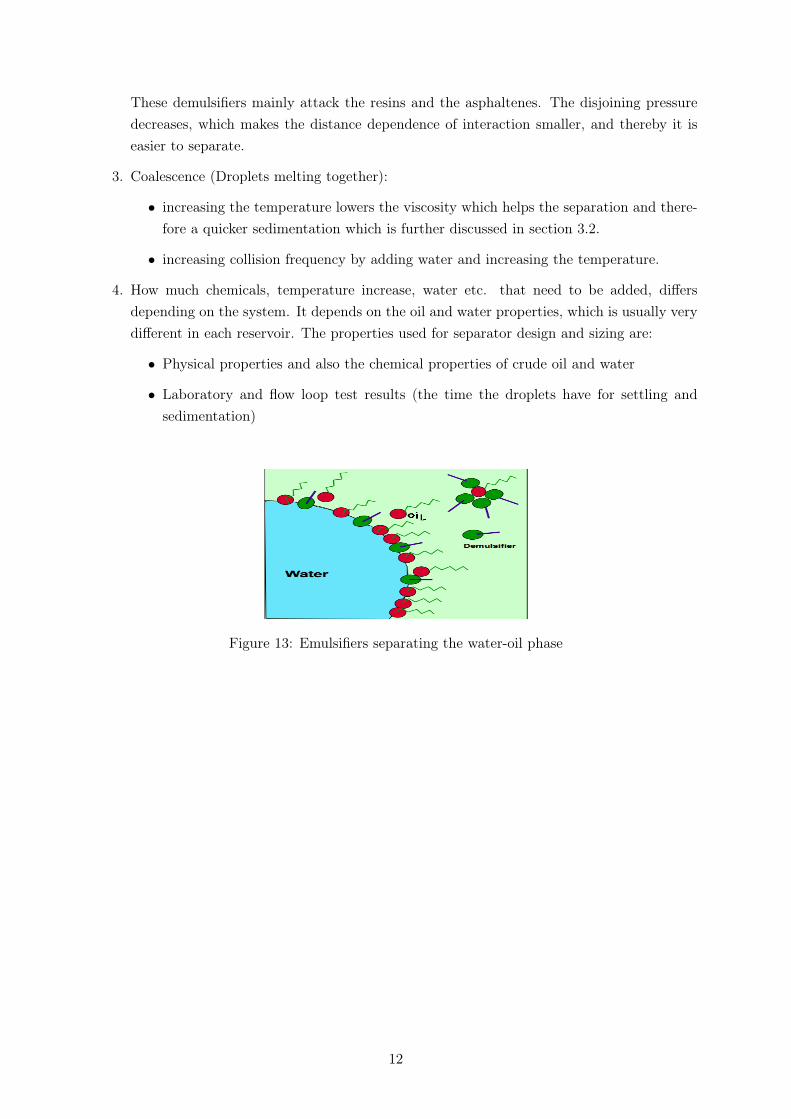
These demulsifiers mainly attack the resins and the asphaltenes. The disjoining pressuredecreases, which makes the distance dependence of interaction smaller, and thereby it iseasier to separate.
3. Coalescence (Droplets melting together):
• increasing the temperature lowers the viscosity which helps the separation and there-fore a quicker sedimentation which is further discussed in section 3.2.
• increasing collision frequency by adding water and increasing the temperature.
4. How much chemicals, temperature increase, water etc. that need to be added, differsdepending on the system. It depends on the oil and water properties, which is usually verydifferent in each reservoir. The properties used for separator design and sizing are:
• Physical properties and also the chemical properties of crude oil and water
• Laboratory and flow loop test results (the time the droplets have for settling andsedimentation)
Figure 13: Emulsifiers separating the water-oil phase
12
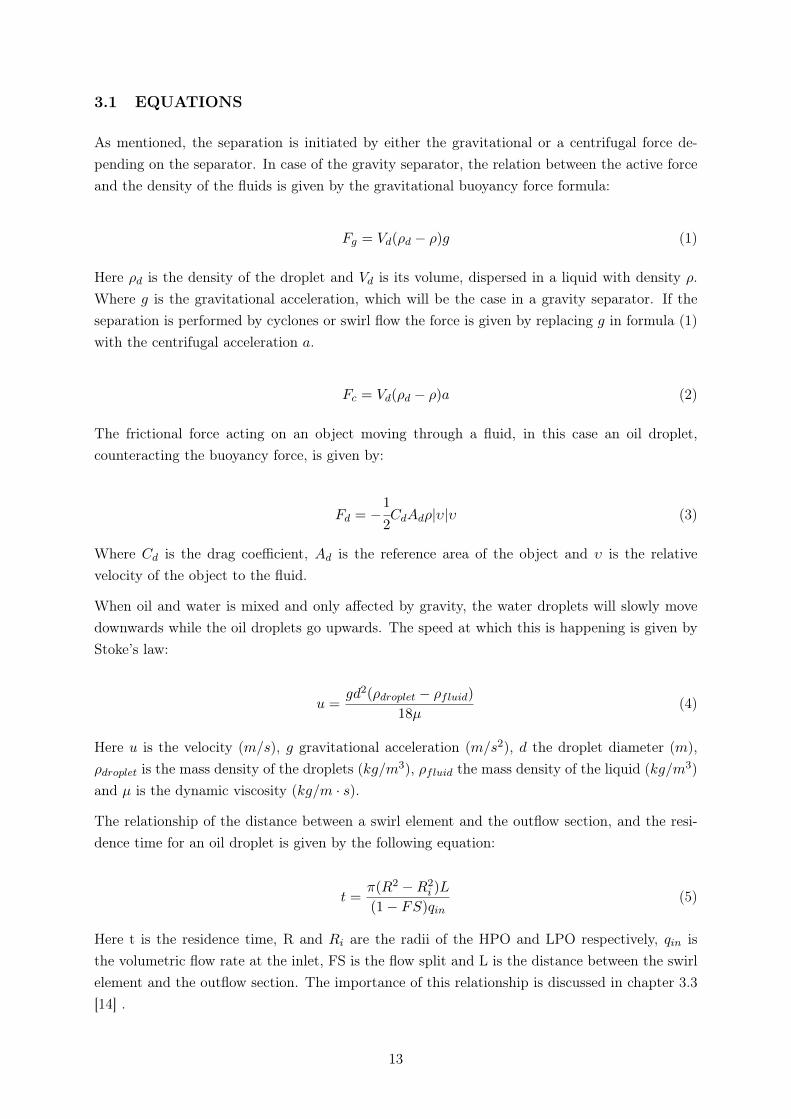
3.1 EQUATIONS
As mentioned, the separation is initiated by either the gravitational or a centrifugal force de-pending on the separator. In case of the gravity separator, the relation between the active forceand the density of the fluids is given by the gravitational buoyancy force formula:
Fg = Vd(ρd − ρ)g (1)
Here ρd is the density of the droplet and Vd is its volume, dispersed in a liquid with density ρ.Where g is the gravitational acceleration, which will be the case in a gravity separator. If theseparation is performed by cyclones or swirl flow the force is given by replacing g in formula (1)with the centrifugal acceleration a.
Fc = Vd(ρd − ρ)a (2)
The frictional force acting on an object moving through a fluid, in this case an oil droplet,counteracting the buoyancy force, is given by:
Fd = −1
2CdAdρ|υ|υ (3)
Where Cd is the drag coefficient, Ad is the reference area of the object and υ is the relativevelocity of the object to the fluid.
When oil and water is mixed and only affected by gravity, the water droplets will slowly movedownwards while the oil droplets go upwards. The speed at which this is happening is given byStoke’s law:
u =gd2(ρdroplet − ρfluid)
18µ(4)
Here u is the velocity (m/s), g gravitational acceleration (m/s2), d the droplet diameter (m),ρdroplet is the mass density of the droplets (kg/m3), ρfluid the mass density of the liquid (kg/m3)and µ is the dynamic viscosity (kg/m · s).
The relationship of the distance between a swirl element and the outflow section, and the resi-dence time for an oil droplet is given by the following equation:
t =π(R2 −R2
i )L
(1− FS)qin(5)
Here t is the residence time, R and Ri are the radii of the HPO and LPO respectively, qin isthe volumetric flow rate at the inlet, FS is the flow split and L is the distance between the swirlelement and the outflow section. The importance of this relationship is discussed in chapter 3.3[14] .
13
3.2 GRAVITY SEPARATORS
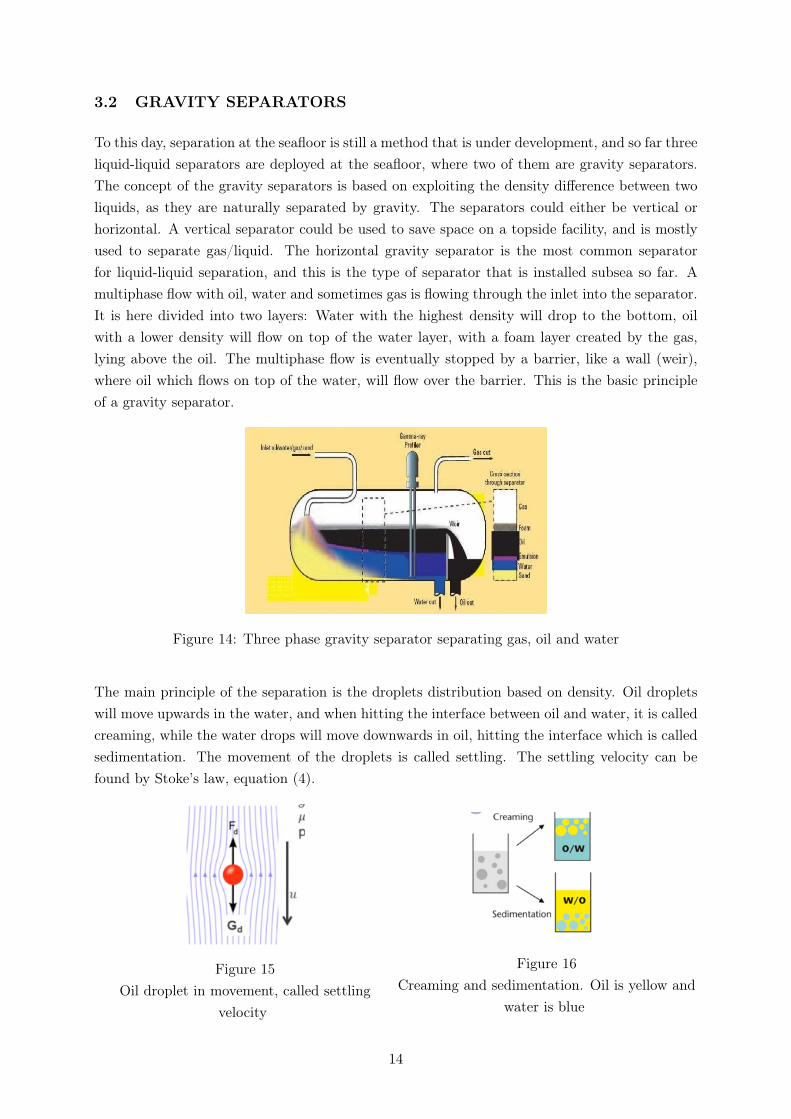
To this day, separation at the seafloor is still a method that is under development, and so far threeliquid-liquid separators are deployed at the seafloor, where two of them are gravity separators.The concept of the gravity separators is based on exploiting the density difference between twoliquids, as they are naturally separated by gravity. The separators could either be vertical orhorizontal. A vertical separator could be used to save space on a topside facility, and is mostlyused to separate gas/liquid. The horizontal gravity separator is the most common separatorfor liquid-liquid separation, and this is the type of separator that is installed subsea so far. Amultiphase flow with oil, water and sometimes gas is flowing through the inlet into the separator.It is here divided into two layers: Water with the highest density will drop to the bottom, oilwith a lower density will flow on top of the water layer, with a foam layer created by the gas,lying above the oil. The multiphase flow is eventually stopped by a barrier, like a wall (weir),where oil which flows on top of the water, will flow over the barrier. This is the basic principleof a gravity separator.
Figure 14: Three phase gravity separator separating gas, oil and water
The main principle of the separation is the droplets distribution based on density. Oil dropletswill move upwards in the water, and when hitting the interface between oil and water, it is calledcreaming, while the water drops will move downwards in oil, hitting the interface which is calledsedimentation. The movement of the droplets is called settling. The settling velocity can befound by Stoke’s law, equation (4).
Figure 15Oil droplet in movement, called settling
velocity
Figure 16Creaming and sedimentation. Oil is yellow and
water is blue
14

Gravity separators are the most common separator type in the offshore industry, and is thefirst separator type to be used subsea. The biggest difference between subsea separators andtopside separators is the size and robustness. The subsea separators need to withstand externaland internal pressures, harsh environment etc, and need to be compact. The differences ininternal pressures in topside and subsea, is that a subsea separator does not have the sameopportunity to flare the gas as you can do topside. The lack of this opportunity can cause highinternal pressure, and therefore compact and robust separators are very important. Anotherusual difference is that on topside, cooling of the liquid is needed before separation, this is notthe case subsea. Subsea separators can also be used to clean out the gas in the inlet to reducethe size. Compact separators will reduce size, weight and also cost. Lighter separators allowthe system retrieval, maintenance and installation process without the use of heavy-lift vessels,which reduces the cost significantly. In addition, the separators can be tested as an integratedsystem on the surface prior to installation. This will increase the reliability. These are the threefollowing subsea separator installations:
1. Troll Pilot, 1999 - Horizontal gravity separator. Installed at 340 meter depth.
2. Tordis, 2007 - Compact horizontal with desander tank. Installed at 200 meter depth.
3. Marlim, 2011 - Pipeseparator, hydrocyclones for sand removal and water polishing. In-stalled at 800 meter water depth.
Troll pilot separator: This is a three-phase gravitational separator. This means that it sepa-rates water and oil, but also the the gas. For the oil-water separation, two weir plates are installedat the end of the separator. The inlet has a cyclonic device that slows down the incoming flowand also decreases the amount of emulsion. This cyclonic inlet is also removing gas bubbles, andthen transporting the gas through a separate gas line. This minimizes the separator size [9].
Figure 17: (a) Troll separator, (b) Hydraulic scheme
Tordis Separator: This is also a three-phase gravity separator with the cyclonic inlet device.The separator has about 30-40% water in the oil and the produced water which is separatedcontains 500 ppm of oil (30 ppm is the limit, before it can be released in the sea) and is pumpedback to the Utsira reservoir. There is a lot of sand production in this case, and a sand removalsystem which contains flushing systems with nozzles are installed to remove the sand. Thisseparator has very limited maintenance access. One important difference from this separatorcompared with all other separators, is the missing weir plate. This separator does not use aplate to separate the oil and water, but has simply an outlet at the top in the oil region, andone in the water region [9] [15].
15
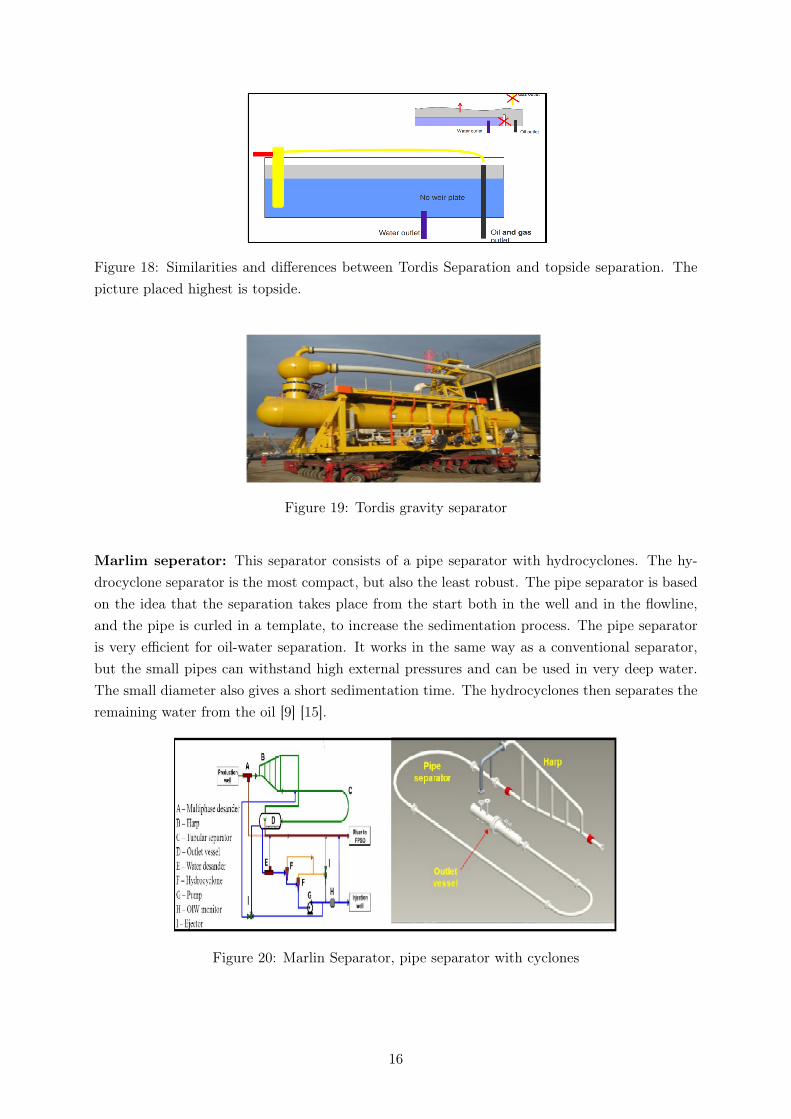
Figure 18: Similarities and differences between Tordis Separation and topside separation. Thepicture placed highest is topside.
Figure 19: Tordis gravity separator
Marlim seperator: This separator consists of a pipe separator with hydrocyclones. The hy-drocyclone separator is the most compact, but also the least robust. The pipe separator is basedon the idea that the separation takes place from the start both in the well and in the flowline,and the pipe is curled in a template, to increase the sedimentation process. The pipe separatoris very efficient for oil-water separation. It works in the same way as a conventional separator,but the small pipes can withstand high external pressures and can be used in very deep water.The small diameter also gives a short sedimentation time. The hydrocyclones then separates theremaining water from the oil [9] [15].
Figure 20: Marlin Separator, pipe separator with cyclones
16
3.3 SWIRL SEPARATORS
The separators used subsea today are only gravity separators, but they have some drawbacks.Mainly the large size and weight that makes them unattractive to install at small wells or atremote locations caused by ship limitations. This creates a need in the industry for solutionsthat use small separators, like the swirl separator. The benefits of using a swirl separator arelower investment cost and easier installation because they weigh less. They can also be installeddirectly in the pipes of the flow, eliminating the need to build dedicated structures for theseparation. With the benefits of a small separator, comes new challenges to control and designdue to short residence time, and optimization becomes more vital [16].
Even though it may be better, the “compact solution” is yet to be used subsea mainly becauseof the lack of operational experience even topside. This could lead to unforeseen problems forthe first commercial use of this technology that the oil companies does not want to risk, whichis why most work done concerning the swirl separators today are research related [17].
What is a swirl separator?
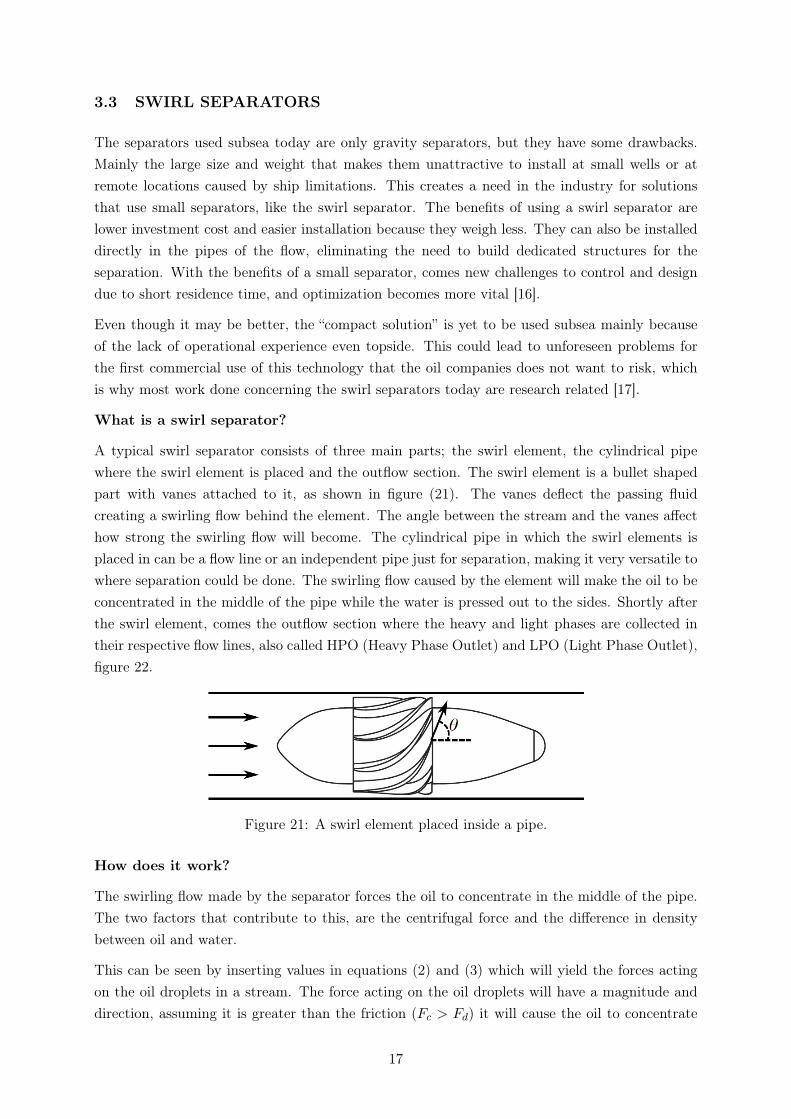
A typical swirl separator consists of three main parts; the swirl element, the cylindrical pipewhere the swirl element is placed and the outflow section. The swirl element is a bullet shapedpart with vanes attached to it, as shown in figure (21). The vanes deflect the passing fluidcreating a swirling flow behind the element. The angle between the stream and the vanes affecthow strong the swirling flow will become. The cylindrical pipe in which the swirl elements isplaced in can be a flow line or an independent pipe just for separation, making it very versatile towhere separation could be done. The swirling flow caused by the element will make the oil to beconcentrated in the middle of the pipe while the water is pressed out to the sides. Shortly afterthe swirl element, comes the outflow section where the heavy and light phases are collected intheir respective flow lines, also called HPO (Heavy Phase Outlet) and LPO (Light Phase Outlet),figure 22.
Figure 21: A swirl element placed inside a pipe.
How does it work?
The swirling flow made by the separator forces the oil to concentrate in the middle of the pipe.The two factors that contribute to this, are the centrifugal force and the difference in densitybetween oil and water.
This can be seen by inserting values in equations (2) and (3) which will yield the forces actingon the oil droplets in a stream. The force acting on the oil droplets will have a magnitude anddirection, assuming it is greater than the friction (Fc > Fd) it will cause the oil to concentrate
17

in the middle of the pipe as in figure 22.
An important parameter for swirl separators is the distance between the swirl element and theoutflow section, as all oil droplets will have a residence time. The distance must therefore beshorter than the residence time, allowing the droplets to pass through the LPO which is locatedin the center of the pipe. The distance can however be too short in some cases. For instance, ifthe amount of oil that has travelled the necessary distance is greater than the flow rate throughthe LPO, the oil core will simply grow wider than the radius of the inner pipe (Ri) and theresidual oil will exit through the HPO. The relationship between the distance and residence timefor an oil droplet can be seen in equation (5).
Figure 22: Mixed flow before the swirl element, separation occurring after passing the element.Further downstream there is a LPO in the middle and a HPO behind the LPO.
Separation by swirling flow is successfully used for separation of solids from either gas or liquids.However, the use of swirl separators for liquid-liquid separation has proven to be more difficult,because of the much smaller difference in density between the phases and high volume fractionof the dispersed phase [18]. Research of the effectiveness is therefore important to find a gooddesign for the separator.
Research
Most work done concerning the liquid-liquid swirl separators is focused on measuring the sep-aration effectiveness and optimizing it. For this purpose, good models that describe the flowbehavior are needed. Having a model that correlates well with the real world will save a lot ofwork by allowing a computer to calculate optimal parameters like LPO and HPO diameter, vaneangle and distance between swirl element and LPO for a given set of inlet conditions. Good sepa-ration models can also be applied under operating conditions for consistent monitoring, providingestimates of the outlet stream composition.
A good model should be accurate, yet simple to avoid high computational cost and time. It istherefore important to identify what the model shows and try to express it as simple and realisticas possible.
Work done by two people from different universities are compared further down, to see if therewere any differences between their results using different models. The first work is done byPreben Fürst Tyvold at the Norwegian University of Science and Technology. He made a modeldescribing separation efficiency and compared it to experimental data given by Van Campento see how good it corresponds. The model showed good fit with experimental data but haddeviations for some operation conditions.
In the model, he assumed two axial velocity profiles one inner and one outer. Tangential velocityis also divided into two profiles, one inner solid body rotation and one outer free vortex.
He then found the inlet position of the oil droplet that would cause it to exit through the inner
18

pipe (LPO). An assumption was made, that all droplets entering at a specific area would exitthrough the LPO, and all droplets entering outside of that area would exit through the HPO.He also added re-entrainment of the fluids to the formula.
After making the model, he ran several simulations and found out the following: the modeledseparation performance is sensitive to changes in flow rate, centrifugal forces, droplet breakupand residence time. Separation performance can therefore be optimized by finding an optimalbalance between those factors for given inlet and geometry conditions. The optimal distancebetween the swirl element and the LPO is governed by the residence time of an oil droplet.
The simulated and experimental values show good agreement for low oil cut values, the accuracydecreases for oil cut equal to or higher than 0.45, that was most likely because part of the liquidchanges from oil-in-water to water-in-oil emulsion. Increasing feed rate decreases performanceand a stronger swirl flow is achieved, but the droplet breakup is increased. For the pipe diameterPreben used, the model was in best agreement with the experimental data for the followingconditions:
• Inlet oil cut between 0.2 and 0.45
• Flow rates between 10 and 20 m3h−1
Because the swirl separator is not effective for high oil cuts, it should be used in a combinationwith other separators like the gravity separator for increased performance. Preben in his design,also worked on a gravity separator initially for coarse separation and two swirl separators afterit for finer separation of oil in water and water in oil [14].
Van Campen made an experimental setup and compared the measurements with the simulationmodels he made. In his work, he used a so-called Euler-Euler model combined with separatecontinuity and momentum equations for both phases to describe the two-phase flow. He tested themodel with two forms of drag laws and compared the results with experimental data. The draglaws used were the Schiller-Naumann and the Ishii-Zuber, with the Schiller-Naumann correlationnot taking into account hindrance effect other droplets have on the movement of a droplet, whileIshii-Zuber is doing so.
He defined the separation efficiency by measuring the amount of oil that entered the inlet andcompared it with the amount of oil that left through the LPO. The oil cut was set to 0.25at the inlet, representing a high watercut wellstream. By applying the Schiller-Naumann dragrelation, a separation efficiency of 98% was achieved and by applying the Ishii-Zuber drag relation,a separation efficiency of 89% was achieved. The experimental result indicated a separationefficiency of 65%, it appears therefore that in both cases the models overestimated the results.The main reason for this was determined to be the effect of turbulence on segregation of the oil,which was not taken into account. The highest axial velocity was observed when the Schiller-Naumann model was used, which also yielded the highest separation. He also found out thatthe oil volume fraction of the "pure" oil region in the centre of the flow could only reach 80%.The reason for this was high mixture viscosity caused by the high oil cut, for instance at an oilvolume fraction of 0.80 the mixture viscosity was 40 times higher than the water viscosity whichprevented further separation [18].
19
The conclusion of both works was that further research is needed to understand the flow betterand improve on the separation models. If however a model that was good enough is developedit is important to have instrumentation that can feed the input data for monitoring purposes,different kind of monitoring devices are discussed in chapter 5. Control of this separator underoperating conditions may be virtually impossible as most elements are fixed. This makes itmore important to have good models which can be used to design the optimal system beforeinstallation.
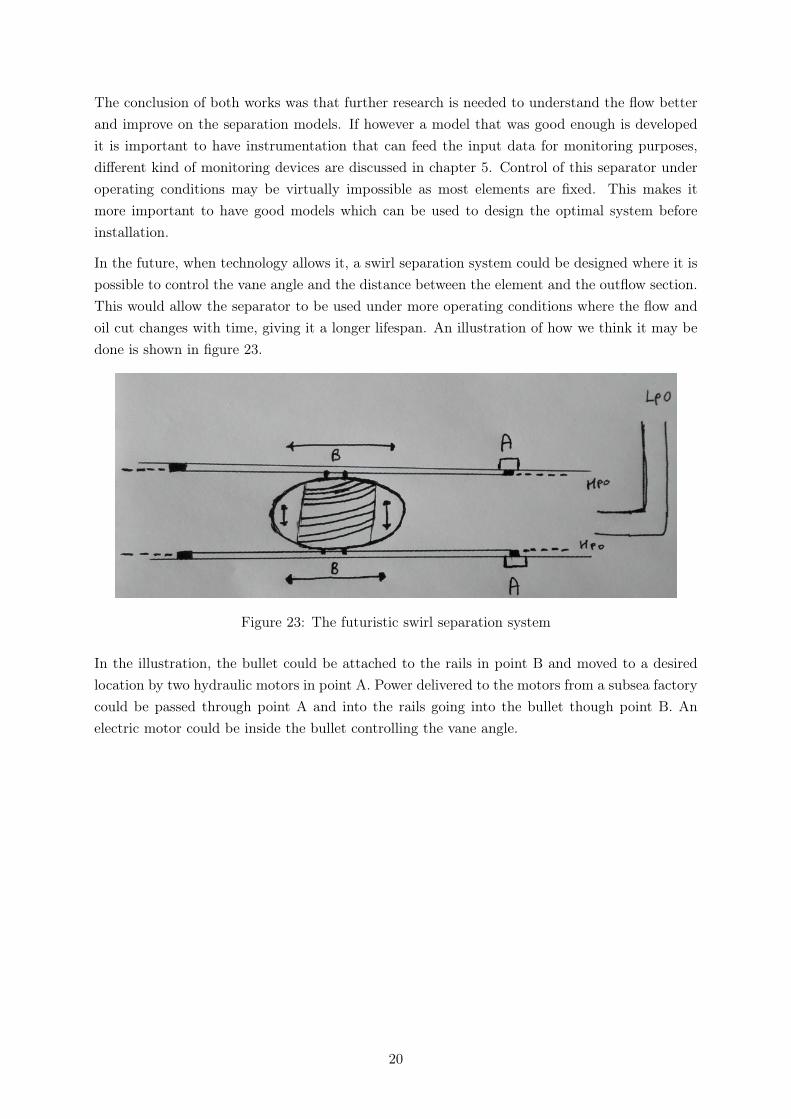
In the future, when technology allows it, a swirl separation system could be designed where it ispossible to control the vane angle and the distance between the element and the outflow section.This would allow the separator to be used under more operating conditions where the flow andoil cut changes with time, giving it a longer lifespan. An illustration of how we think it may bedone is shown in figure 23.
Figure 23: The futuristic swirl separation system
In the illustration, the bullet could be attached to the rails in point B and moved to a desiredlocation by two hydraulic motors in point A. Power delivered to the motors from a subsea factorycould be passed through point A and into the rails going into the bullet though point B. Anelectric motor could be inside the bullet controlling the vane angle.
20
3.4 CYCLONE SEPARATORS
In the past, oil-water-gas separation technology has been based on conventional vessel typeseparators which are bulky, heavy and expensive. As the petroleum industry is currently morefocused on producing hydrocarbons from offshore fields keeping in mind the economic challengesto reduce the production costs, the research interest is currently more inclined towards compactseparation using low weight, low cost and efficient separators.
Cyclone separator
Cyclones are devices used to separate dispersed phase from a continuous phase based on cen-trifugal forces. There are three types of cyclone separators
a) Conical Liquid Hydrocyclones (LLHC)
b) Liquid Liquid Cylindrical Cyclones (LLCC)
c) Gas Liquid Cylindrical Cyclones (GLCC)
The main difference between the cylindrical cyclone separator (LLCC) and the conical hydrocy-clone separator (LLHC) lies in the design or geometry, since LLCC has a cylindrical body andthe LLHC has a cylindrical top portion and it is tapered down to a conical structure.
Most of the studies on liquid-liquid separation have been focused on conical liquid hydrocyclones(LLHC). Studies on the use of cylindrical hydrocyclones for the liquid-liquid separation have beenhindered because at high velocities they perform as mixers rather than separators. However, itis said that while operating at moderate velocities, the cylindrical hydrocyclone can be used toperform as a free water knockout system [19].
Principle of Cyclonic Separation
A cyclone separator is a vertical pipe with a tangential/horizontal inlet and two outlets, oneat the top and other at the bottom, which uses the centrifugal separation technology. Theimmiscible mixture of two liquids flow through the inlet into the cyclone separator. Thereforea strong swirling flow field is formed causing the lighter phase to migrate to the centre line andthe heavier phase towards the wall. Due to the density difference, the denser component tendsto be accumulated near the wall and spirals down the bottom outlet while the lighter componentflows to the core region of the cylindrical cyclone and leaves through the top outlet.
In the case of oil water separation, produced water from the gravity separators enters the cyclonicseparator tangentially and flows down the conical vortex. The oil droplets which have a lowerdensity than the water, flow into the centre of the separator and are removed through the overflow,while the treated water flows out through the underflow.
Performance of a cyclonic separation
For the studies on cyclone separators, two parameters have been used to define the total separa-tion efficiency, namely the flow split ratio and the pressure differential ratio.
21
The flow Split Ratio is defined as the ratio of the underflow rate to the inlet flow rate.
SR = (Qunderflow/Qinlet) ∗ 100
Optimal split ratio: This is defined as a particular split, wherein maximum free water knockoutis obtained.
Pressure Differential Ratio: This is defined as the ratio of overflow to underflow pressure drop.
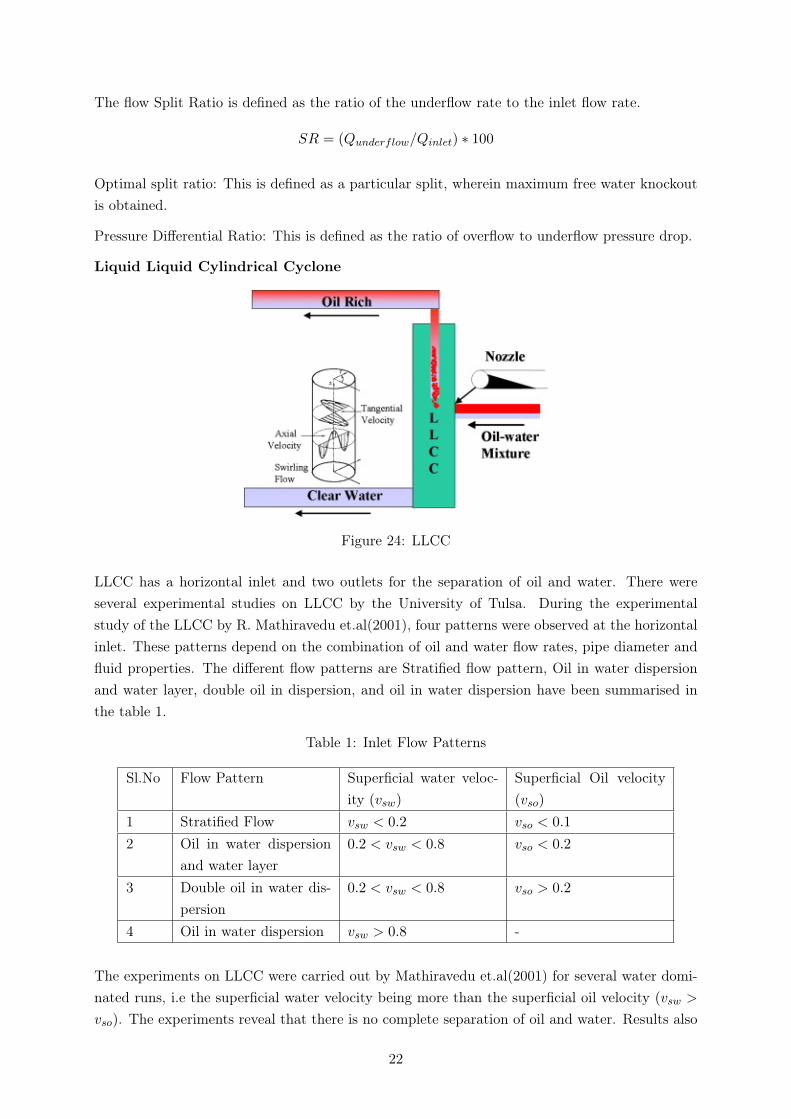
Liquid Liquid Cylindrical Cyclone
Figure 24: LLCC
LLCC has a horizontal inlet and two outlets for the separation of oil and water. There wereseveral experimental studies on LLCC by the University of Tulsa. During the experimentalstudy of the LLCC by R. Mathiravedu et.al(2001), four patterns were observed at the horizontalinlet. These patterns depend on the combination of oil and water flow rates, pipe diameter andfluid properties. The different flow patterns are Stratified flow pattern, Oil in water dispersionand water layer, double oil in dispersion, and oil in water dispersion have been summarised inthe table 1.
Table 1: Inlet Flow Patterns
Sl.No Flow Pattern Superficial water veloc-ity (vsw)
Superficial Oil velocity(vso)
1 Stratified Flow vsw < 0.2 vso < 0.1
2 Oil in water dispersionand water layer
0.2 < vsw < 0.8 vso < 0.2
3 Double oil in water dis-persion
0.2 < vsw < 0.8 vso > 0.2
4 Oil in water dispersion vsw > 0.8 -
The experiments on LLCC were carried out by Mathiravedu et.al(2001) for several water domi-nated runs, i.e the superficial water velocity being more than the superficial oil velocity (vsw >
vso). The experiments reveal that there is no complete separation of oil and water. Results also
22
say that at low split ratios, the effluent in the underflow is clean water and at some split ratio,the oil droplets appear in the underflow. For an optimal split ratio, the water stream at the un-derflow has 100% watercut. This optimal water-cut depends on the various inlet flow patterns,oil content and the velocity of the mixture. The results were plotted as watercut underflow vs thesplit ratio and it was concluded that the better separation efficiency is achieved for the stratifiedflow and double oil in water dispersion flow pattern [19].
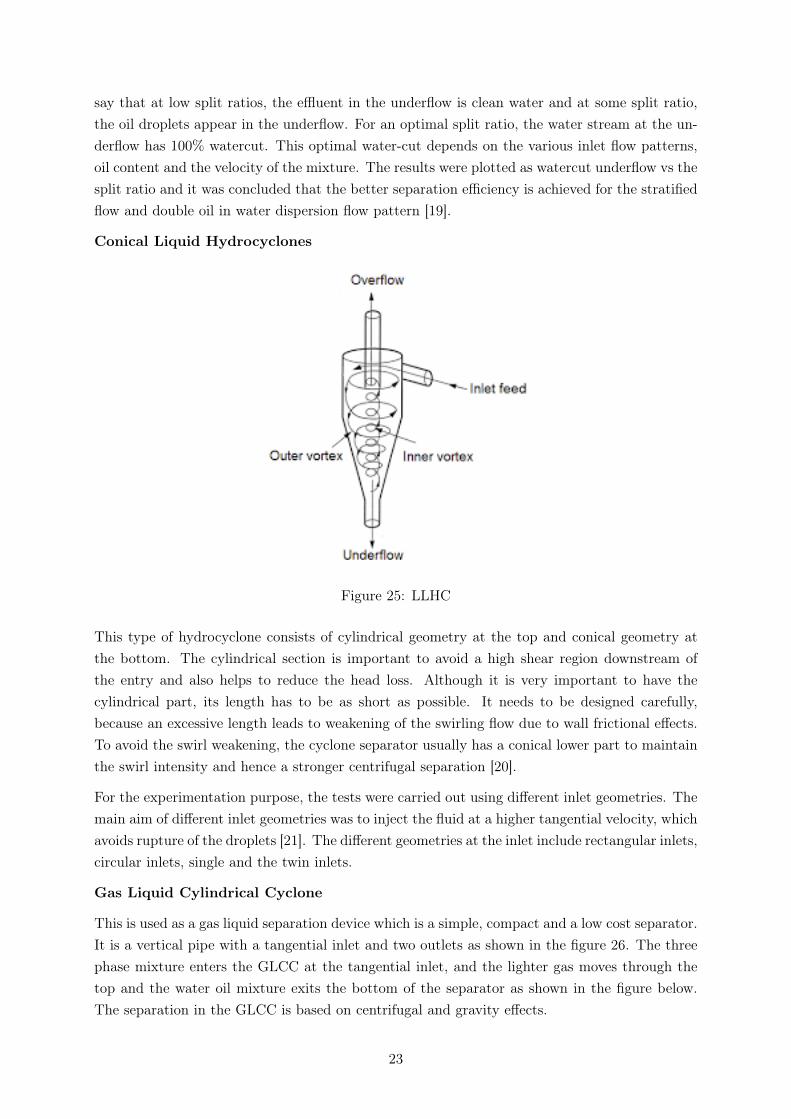
Conical Liquid Hydrocyclones
Figure 25: LLHC
This type of hydrocyclone consists of cylindrical geometry at the top and conical geometry atthe bottom. The cylindrical section is important to avoid a high shear region downstream ofthe entry and also helps to reduce the head loss. Although it is very important to have thecylindrical part, its length has to be as short as possible. It needs to be designed carefully,because an excessive length leads to weakening of the swirling flow due to wall frictional effects.To avoid the swirl weakening, the cyclone separator usually has a conical lower part to maintainthe swirl intensity and hence a stronger centrifugal separation [20].
For the experimentation purpose, the tests were carried out using different inlet geometries. Themain aim of different inlet geometries was to inject the fluid at a higher tangential velocity, whichavoids rupture of the droplets [21]. The different geometries at the inlet include rectangular inlets,circular inlets, single and the twin inlets.
Gas Liquid Cylindrical Cyclone
This is used as a gas liquid separation device which is a simple, compact and a low cost separator.It is a vertical pipe with a tangential inlet and two outlets as shown in the figure 26. The threephase mixture enters the GLCC at the tangential inlet, and the lighter gas moves through thetop and the water oil mixture exits the bottom of the separator as shown in the figure below.The separation in the GLCC is based on centrifugal and gravity effects.
23

Figure 26: GLCC
University of Tulsa has carried out studies to extend their research on cylindrical cyclone tothree phase gas oil water separation as shown in figure 27 based on the integration of GLCC andLLCC to separate the two phase mixture from the bottom of the GLCC [22].
Figure 27: Schematic of GLCC and LLCC: Two stage separation system
The GLCC has several installations (more than 1000) mainly onshore, and a lot of study onthis has been done by University of Tulsa [23]. GLCC being compact, performance under theslugging environment is expected to be hard. Consequently, a slug damper system was developedto provide volume for liquid accumulation.
Subsea Applications
Saipem has partnered with Veolia to develop subsea water treatment solutions for the deepwaterapplications. One of the major shortcomings of the large diameter vessels used on Troll and Tordiswas a very thick wall which required to sustain high pressure. Therefore, Saipem is currentlydeveloping two bulk liquid separation systems to fit deepwater requirements to overcome theshortcoming [24].
The first system is called SpoolSep. Here, the fluid is divided into several spools working in
24
parallel. The separation efficiency is increased based on the spool lengths, because the lengthsprovides long residence time [24]. The second system is called the 3C-Cyclone. This cycloneseparator has been designed specifically for subsea applications. The advantages of this systemis that it works over a large range of water cuts and there is no requirement of any fast actingcontrol device. Compliance to the variations in the inlet flow rate and watercuts, is achievedby innovative cyclone geometry and the pressure regulating vessel. Experiments have beenperformed with two synthetic oils and salt water under different flow conditions. The test resultshave shown very good separation performance at the outlet of the 3C-Cyclone system.
Addition of cyclonic deoiler helps to reduce the concentration of oil in water to less than 100ppmfor a few reservoirs [24]. If the oil at the outlet better than 100 ppm is to be achieved, a polishingstage is to be added. There are two solutions described below.
The first solution is to use the floatation unit. Induced Gas floatation (IGF) equipment iscommonly used to remove oil further, when the performance of the hydrocyclone is not capableto meet the injection requirements of the reservoir or the discharge requirements by the regulatoryboard. There have been conventional IGF’s in use for many years, but due to their high retentiontime and huge weight led to the development of Compact Floatation Unit (CFU). Most CFU’smade use of recirculation pumps to drive eductors, and hence their use in subsea applicationswas not appropriate. To overcome this problem,the VWS CophaseTM CFU came up with thenovel solution of LoHeadTM eductors allowing the floatation unit to operate without the needfor the power and a very minimal requirement of process control, and hence it makes it a verygood prospect for subsea application.
The second solution for polishing is to use Ceramic membranes. In most oilfields, due to alarge concentration of oil remaining in the treated produced water, the only option left behindwas hydraulic fracturing. Therefore, Cermamic membranes have been identified as a technologythat has the promise of allowing produced water treatment without hydraulic fracturing. Thesemembranes are capable of removing suspended solids above 0.05 microns in size and also removedispersed oil to below 5 ppm [24]. One of the disadvantages associated with ceramic membraneis that there is continuous clogging of the membranes due to the fine oil droplets, and hence thecleaning of the membranes by steam blowing becomes very difficult.
25
4 SLUGGING
Slugging is a phenomenon that may occur in risers and pipelines carrying a two-phase fluidof liquid and gas. It is in general bursts of liquid pushed by pockets of gas. It causes largepressure variations and kinematic forces, because of varying flow-rates in the fluid. This cancause problems in the design and operation because of the kinematic forces, the pressure cycling,control instability, and inadequate phase separation. It also greatly affects the design of thereceiving facilities [25]. The development of slug flow regime starts from stratified flow due tothree main factors. The first is natural growth of small disturbances present in the flow, calledhydrodynamic slugging. The second is accumulation of the fluid caused due to the slope changesin the profile of the duct, called terrain induced slugging. The third is related to instabilities dueto start up and shutdown of the flow [26], which will not be examined further in this report.
Hydrodynamic slugging
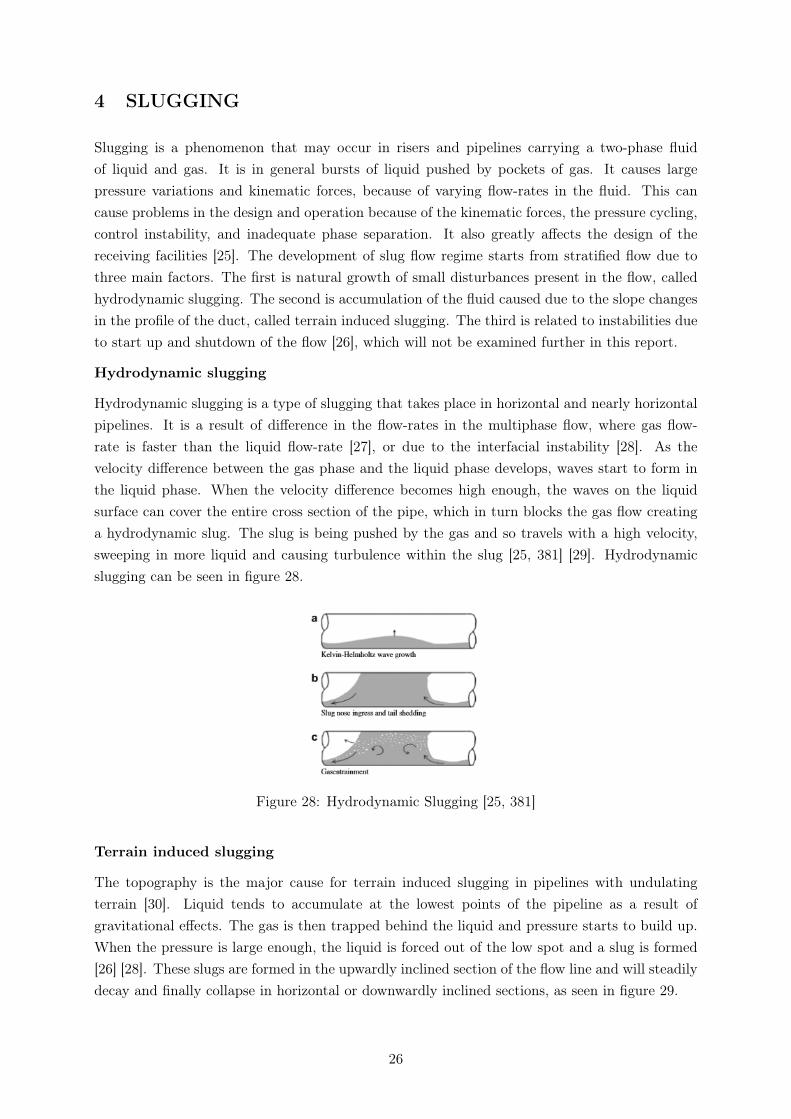
Hydrodynamic slugging is a type of slugging that takes place in horizontal and nearly horizontalpipelines. It is a result of difference in the flow-rates in the multiphase flow, where gas flow-rate is faster than the liquid flow-rate [27], or due to the interfacial instability [28]. As thevelocity difference between the gas phase and the liquid phase develops, waves start to form inthe liquid phase. When the velocity difference becomes high enough, the waves on the liquidsurface can cover the entire cross section of the pipe, which in turn blocks the gas flow creatinga hydrodynamic slug. The slug is being pushed by the gas and so travels with a high velocity,sweeping in more liquid and causing turbulence within the slug [25, 381] [29]. Hydrodynamicslugging can be seen in figure 28.
Figure 28: Hydrodynamic Slugging [25, 381]
Terrain induced slugging
The topography is the major cause for terrain induced slugging in pipelines with undulatingterrain [30]. Liquid tends to accumulate at the lowest points of the pipeline as a result ofgravitational effects. The gas is then trapped behind the liquid and pressure starts to build up.When the pressure is large enough, the liquid is forced out of the low spot and a slug is formed[26] [28]. These slugs are formed in the upwardly inclined section of the flow line and will steadilydecay and finally collapse in horizontal or downwardly inclined sections, as seen in figure 29.
26
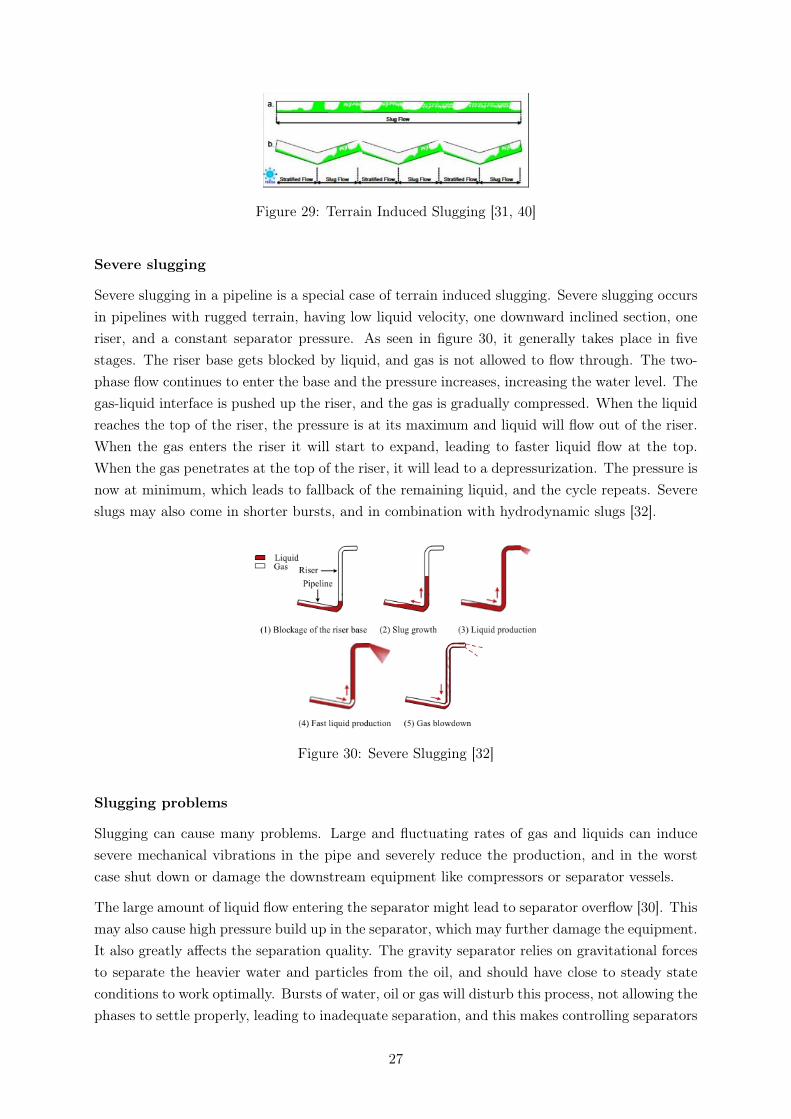
Figure 29: Terrain Induced Slugging [31, 40]
Severe slugging
Severe slugging in a pipeline is a special case of terrain induced slugging. Severe slugging occursin pipelines with rugged terrain, having low liquid velocity, one downward inclined section, oneriser, and a constant separator pressure. As seen in figure 30, it generally takes place in fivestages. The riser base gets blocked by liquid, and gas is not allowed to flow through. The two-phase flow continues to enter the base and the pressure increases, increasing the water level. Thegas-liquid interface is pushed up the riser, and the gas is gradually compressed. When the liquidreaches the top of the riser, the pressure is at its maximum and liquid will flow out of the riser.When the gas enters the riser it will start to expand, leading to faster liquid flow at the top.When the gas penetrates at the top of the riser, it will lead to a depressurization. The pressure isnow at minimum, which leads to fallback of the remaining liquid, and the cycle repeats. Severeslugs may also come in shorter bursts, and in combination with hydrodynamic slugs [32].
Figure 30: Severe Slugging [32]
Slugging problems
Slugging can cause many problems. Large and fluctuating rates of gas and liquids can inducesevere mechanical vibrations in the pipe and severely reduce the production, and in the worstcase shut down or damage the downstream equipment like compressors or separator vessels.
The large amount of liquid flow entering the separator might lead to separator overflow [30]. Thismay also cause high pressure build up in the separator, which may further damage the equipment.It also greatly affects the separation quality. The gravity separator relies on gravitational forcesto separate the heavier water and particles from the oil, and should have close to steady stateconditions to work optimally. Bursts of water, oil or gas will disturb this process, not allowing thephases to settle properly, leading to inadequate separation, and this makes controlling separators
27
much more difficult.
Effect of corrosion is directly proportional to the slug frequency, although it is not correct at lowslug frequencies. In catenary risers, inclination changes continuously from horizontal to verticalover large distances. Analysis of corrosion indicates that the severity of corrosion is proportionalto the deviation angle because the corrosion is severe at the water hang up [33].
Controlling slugging topside
Severe slugging topside is controllable with subsea equipment, for instance it is possible to reducethe slugging by either manipulating the flow-rate of liquid going into the pipeline subsea, or byequalizing the pressure difference with valves when slugs appear. A smaller diameter of theflow-line will lead to a faster velocity in the fluid and reduce slugging, but will increase the flow-line pressure drop and reduce the capacity. An effective strategy to eliminate the probability ofslugging is the automatic feed back control which has been discussed in Section 5.1.
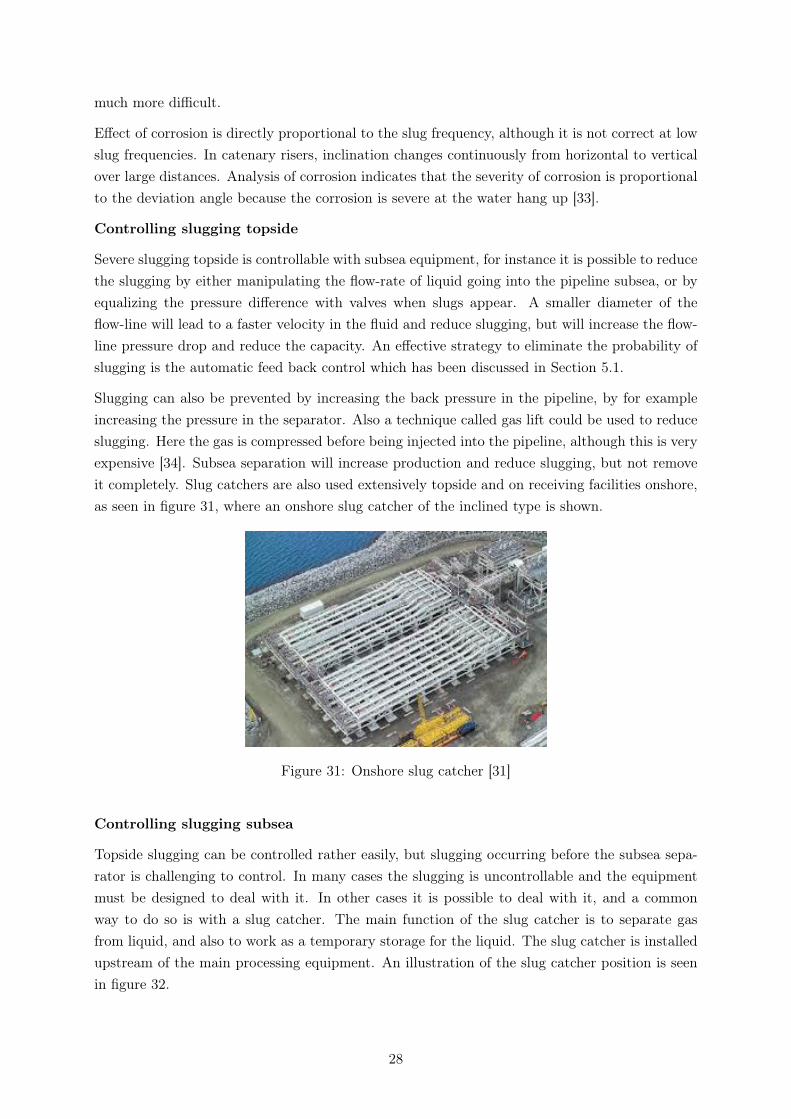
Slugging can also be prevented by increasing the back pressure in the pipeline, by for exampleincreasing the pressure in the separator. Also a technique called gas lift could be used to reduceslugging. Here the gas is compressed before being injected into the pipeline, although this is veryexpensive [34]. Subsea separation will increase production and reduce slugging, but not removeit completely. Slug catchers are also used extensively topside and on receiving facilities onshore,as seen in figure 31, where an onshore slug catcher of the inclined type is shown.
Figure 31: Onshore slug catcher [31]
Controlling slugging subsea
Topside slugging can be controlled rather easily, but slugging occurring before the subsea sepa-rator is challenging to control. In many cases the slugging is uncontrollable and the equipmentmust be designed to deal with it. In other cases it is possible to deal with it, and a commonway to do so is with a slug catcher. The main function of the slug catcher is to separate gasfrom liquid, and also to work as a temporary storage for the liquid. The slug catcher is installedupstream of the main processing equipment. An illustration of the slug catcher position is seenin figure 32.
28
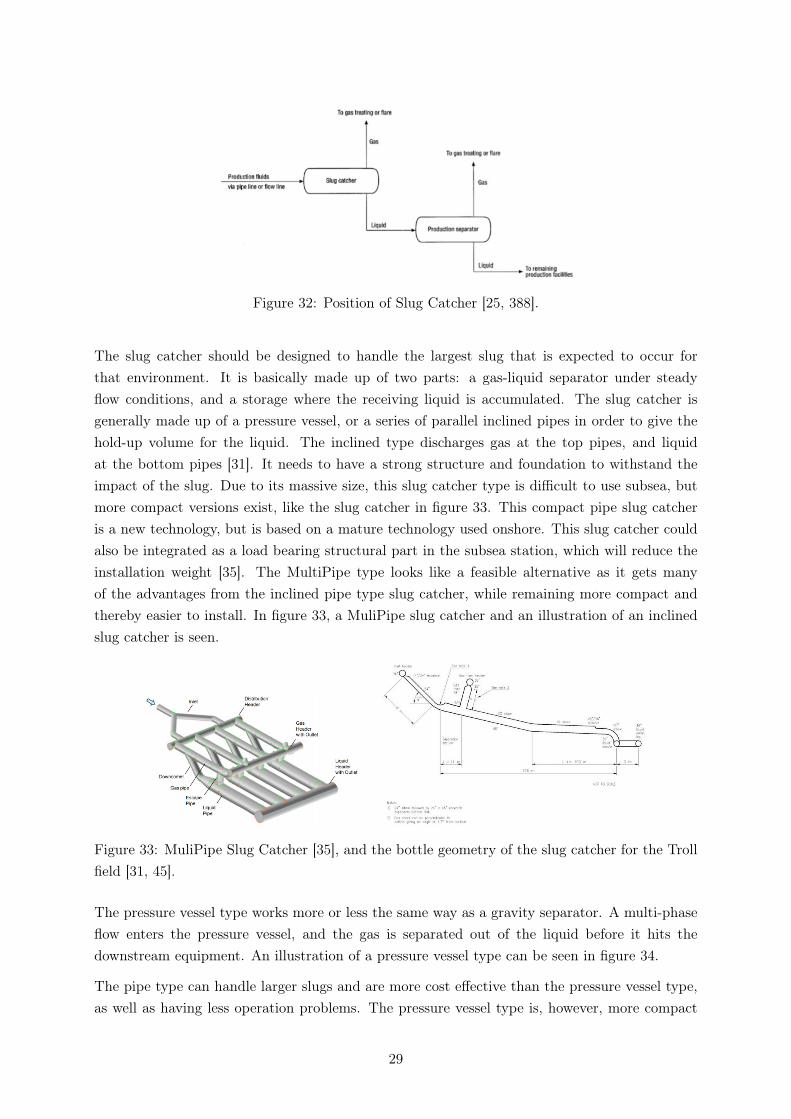
Figure 32: Position of Slug Catcher [25, 388].
The slug catcher should be designed to handle the largest slug that is expected to occur forthat environment. It is basically made up of two parts: a gas-liquid separator under steadyflow conditions, and a storage where the receiving liquid is accumulated. The slug catcher isgenerally made up of a pressure vessel, or a series of parallel inclined pipes in order to give thehold-up volume for the liquid. The inclined type discharges gas at the top pipes, and liquidat the bottom pipes [31]. It needs to have a strong structure and foundation to withstand theimpact of the slug. Due to its massive size, this slug catcher type is difficult to use subsea, butmore compact versions exist, like the slug catcher in figure 33. This compact pipe slug catcheris a new technology, but is based on a mature technology used onshore. This slug catcher couldalso be integrated as a load bearing structural part in the subsea station, which will reduce theinstallation weight [35]. The MultiPipe type looks like a feasible alternative as it gets manyof the advantages from the inclined pipe type slug catcher, while remaining more compact andthereby easier to install. In figure 33, a MuliPipe slug catcher and an illustration of an inclinedslug catcher is seen.
Figure 33: MuliPipe Slug Catcher [35], and the bottle geometry of the slug catcher for the Trollfield [31, 45].
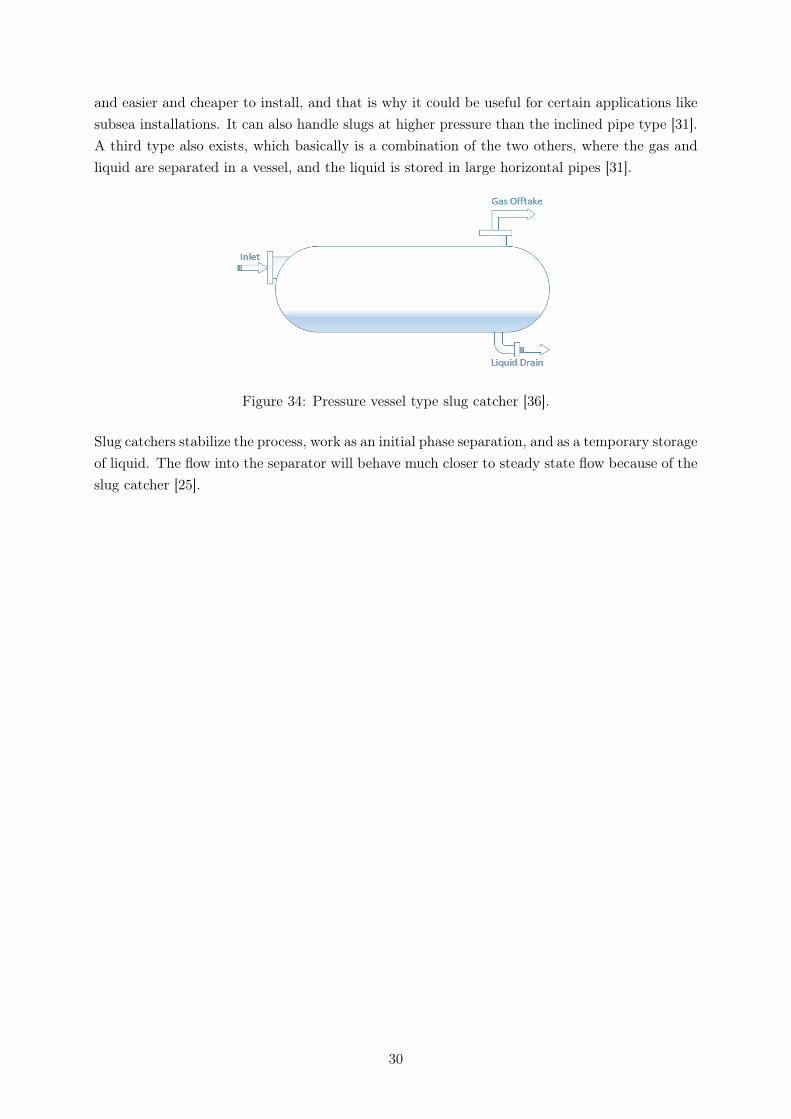
The pressure vessel type works more or less the same way as a gravity separator. A multi-phaseflow enters the pressure vessel, and the gas is separated out of the liquid before it hits thedownstream equipment. An illustration of a pressure vessel type can be seen in figure 34.
The pipe type can handle larger slugs and are more cost effective than the pressure vessel type,as well as having less operation problems. The pressure vessel type is, however, more compact
29
and easier and cheaper to install, and that is why it could be useful for certain applications likesubsea installations. It can also handle slugs at higher pressure than the inclined pipe type [31].A third type also exists, which basically is a combination of the two others, where the gas andliquid are separated in a vessel, and the liquid is stored in large horizontal pipes [31].
Figure 34: Pressure vessel type slug catcher [36].
Slug catchers stabilize the process, work as an initial phase separation, and as a temporary storageof liquid. The flow into the separator will behave much closer to steady state flow because of theslug catcher [25].
30

5 MONITORING AND MEASUREMENTS
In a well-integrated subsea processing system, one of the most important issues is to deal withthe produced water, either by re-injecting back to the reservoir or by simply discharging intothe sea after separation. A highly reliable and real-time measurement and monitoring systemis thus needed to ensure the water meets the requirements and not cause severe damage to theenvironment.
It is obvious that measurement is indispensable before the water is discharged into the sea. Butas the water comes from the reservoir, there might be some doubts as to why measure is neededif we just re-inject the water back to where it comes from. This is because after separation, thereare still some residual oil droplets and solid particles in the produced water, which may depositin porous media if the produced water is re-injected to the reservoir directly. This depositioncan cause severe damage to the formation with a significant reduction in permeability. And anydecrease in permeability would decrease the injectivity index and consequently the production,both oil production rate and the total amount of oil that can be ultimately recovered from anoil field, which is obviously not favorable at all. Therefore it is very important to measure theamount of oil droplets and solid particles to ensure the quality of the water meet the requirements.
Composition of produced water
The properties of the produced water mainly depend on the location, type of formation and typeof hydrocarbons of the field which always differ from one to another. Since the produced watermainly comes from the geological formations, which develops in millions of years, its compositionis highly field-dependent.
Produced water contains majorly water, and minor amounts of organic and inorganic constituentsfrom the source geologic formation and the associated hydrocarbons. This might change duringthe lifetime of the reservoir due to the water injected to maintain the pressure. Besides, it mayalso consist of small amounts of chemicals such as Hydrate Inhibitors, Dehydrators, and ScaleInhibitors etc. which are injected for the treatment of water.
Regulations and standards
Since it is impossible to remove all the oil and chemicals out of the water, here comes anotherquestion: to what extent should we deal with this water in consideration of cost and environmentat the same time? The general way is to refer to some standards, which are shown in table 2.
Besides, there is also a great concern about the toxicity of the water since there could be a lot ofchemicals which are poisonous to sea creatures. In the US, people use shrimps to test the qualityof water [37].
Measurement method in existing equipments
At present, there are only three liquid-liquid separation systems installed subsea, two in theNorth Sea, operated by Statoil and one outside Brazil, operated by Petrobras. All of them havea system for water injection from the seabed included. For either Troll Pilot or Tordis SSBI,there have been no on-line continuous water quality measurement devices installed. The water
31
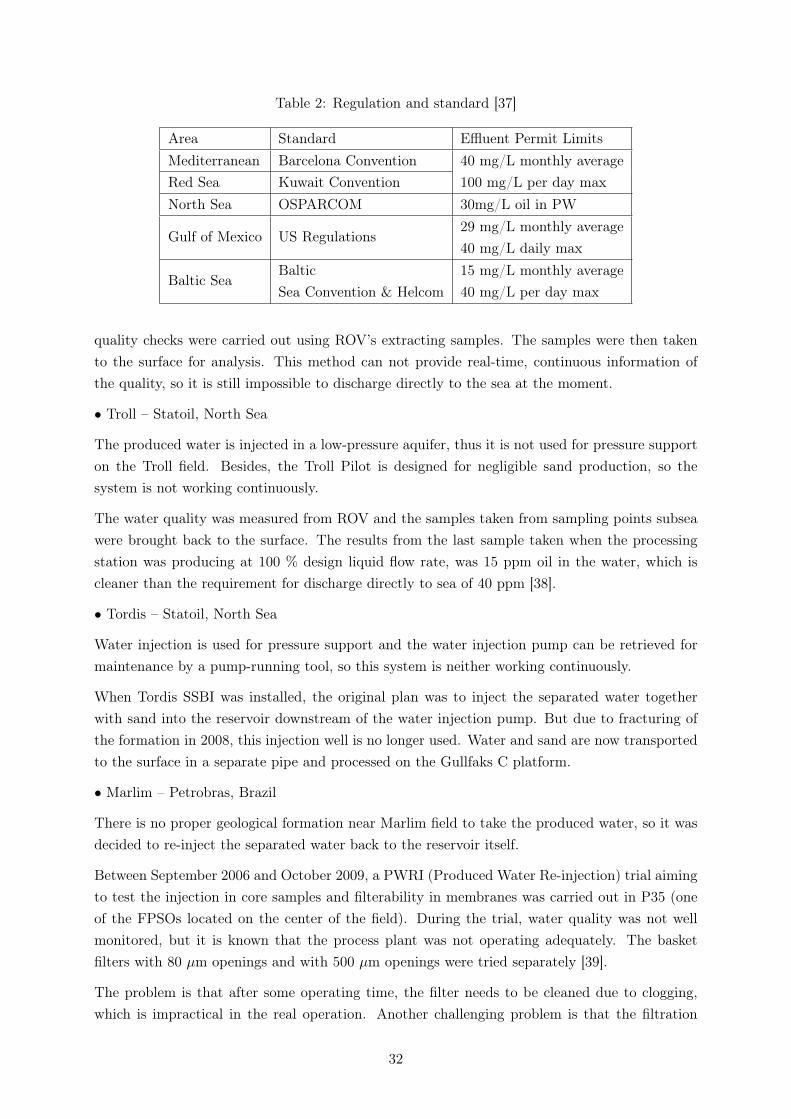
Table 2: Regulation and standard [37]
Area Standard Effluent Permit LimitsMediterranean Barcelona Convention 40 mg/L monthly average
100 mg/L per day maxRed Sea Kuwait ConventionNorth Sea OSPARCOM 30mg/L oil in PW
Gulf of Mexico US Regulations29 mg/L monthly average40 mg/L daily max
Baltic SeaBalticSea Convention & Helcom
15 mg/L monthly average40 mg/L per day max
quality checks were carried out using ROV’s extracting samples. The samples were then takento the surface for analysis. This method can not provide real-time, continuous information ofthe quality, so it is still impossible to discharge directly to the sea at the moment.
• Troll – Statoil, North Sea
The produced water is injected in a low-pressure aquifer, thus it is not used for pressure supporton the Troll field. Besides, the Troll Pilot is designed for negligible sand production, so thesystem is not working continuously.
The water quality was measured from ROV and the samples taken from sampling points subseawere brought back to the surface. The results from the last sample taken when the processingstation was producing at 100 % design liquid flow rate, was 15 ppm oil in the water, which iscleaner than the requirement for discharge directly to sea of 40 ppm [38].
• Tordis – Statoil, North Sea
Water injection is used for pressure support and the water injection pump can be retrieved formaintenance by a pump-running tool, so this system is neither working continuously.
When Tordis SSBI was installed, the original plan was to inject the separated water togetherwith sand into the reservoir downstream of the water injection pump. But due to fracturing ofthe formation in 2008, this injection well is no longer used. Water and sand are now transportedto the surface in a separate pipe and processed on the Gullfaks C platform.
• Marlim – Petrobras, Brazil
There is no proper geological formation near Marlim field to take the produced water, so it wasdecided to re-inject the separated water back to the reservoir itself.
Between September 2006 and October 2009, a PWRI (Produced Water Re-injection) trial aimingto test the injection in core samples and filterability in membranes was carried out in P35 (oneof the FPSOs located on the center of the field). During the trial, water quality was not wellmonitored, but it is known that the process plant was not operating adequately. The basketfilters with 80 µm openings and with 500 µm openings were tried separately [39].
The problem is that after some operating time, the filter needs to be cleaned due to clogging,which is impractical in the real operation. Another challenging problem is that the filtration
32
properties might change as time goes on, thus the opening diameter needs to be changed. Forinstance, in 2005, 0.45 µm membranes seemed to have good filtration properties, but one or twoyears later, even the 80 µm basket filter was clogged pretty fast, and this also happened to theplate type heat exchangers [39].
Methods
Although for the existing subsea separators, no measurement method is under use except theROV (and they already stop doing this), some methods have been used topside and a lot ofworks have been done to explore the feasibility of different methods and promising results areshown. In addition to the environmental aspects, cost is another reason why measurement isdemanding. For instance, a measurement error of just 0.1 % water content in the multiphaseflow will lead to a loss of $ 25 000 (according to Gimson, 1989). In this chapter, several differentmethods that might be used in subsea separation are introduced.
Tomography method
Tomography is a non-invasive technique used to get visualized information over a cross-sectionalsegment of a vessel or pipeline. This kind of method has been used in many different placesfor monitoring the properties of heterogeneous mixtures. The data can be collected based onseveral different measurement techniques, such as the optical, electrical, microwave, ultrasonic,radioactive and so on. Since for oil and gas production applications, the electrical tomographyis fast, sensitive and meanwhile structurally robust, this paper will only focus on this method.
In the electrical tomography method, the data are collected from the sensors installed on the pe-riphery of the vessel or pipelines to reconstruct the dielectric properties. Under this measurementmethod, there are mainly two types which are discussed below.
Electrical resistivity tomography (ERT)
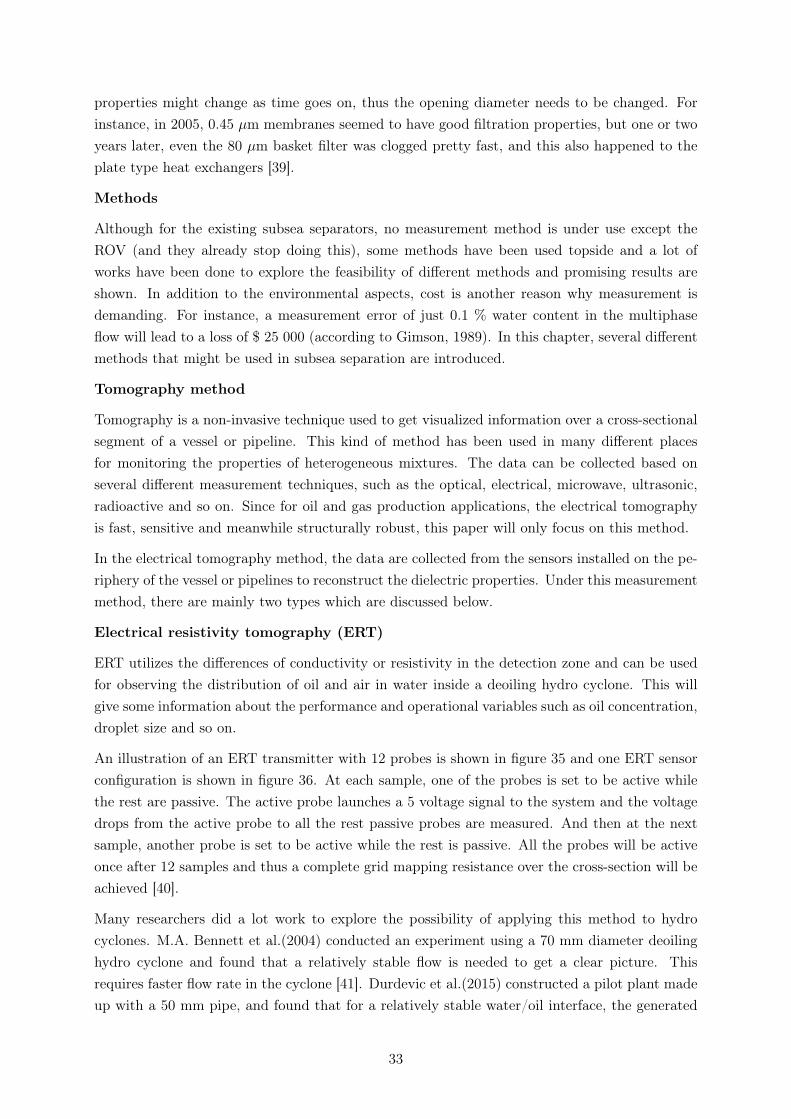
ERT utilizes the differences of conductivity or resistivity in the detection zone and can be usedfor observing the distribution of oil and air in water inside a deoiling hydro cyclone. This willgive some information about the performance and operational variables such as oil concentration,droplet size and so on.
An illustration of an ERT transmitter with 12 probes is shown in figure 35 and one ERT sensorconfiguration is shown in figure 36. At each sample, one of the probes is set to be active whilethe rest are passive. The active probe launches a 5 voltage signal to the system and the voltagedrops from the active probe to all the rest passive probes are measured. And then at the nextsample, another probe is set to be active while the rest is passive. All the probes will be activeonce after 12 samples and thus a complete grid mapping resistance over the cross-section will beachieved [40].
Many researchers did a lot work to explore the possibility of applying this method to hydrocyclones. M.A. Bennett et al.(2004) conducted an experiment using a 70 mm diameter deoilinghydro cyclone and found that a relatively stable flow is needed to get a clear picture. Thisrequires faster flow rate in the cyclone [41]. Durdevic et al.(2015) constructed a pilot plant madeup with a 50 mm pipe, and found that for a relatively stable water/oil interface, the generated
33
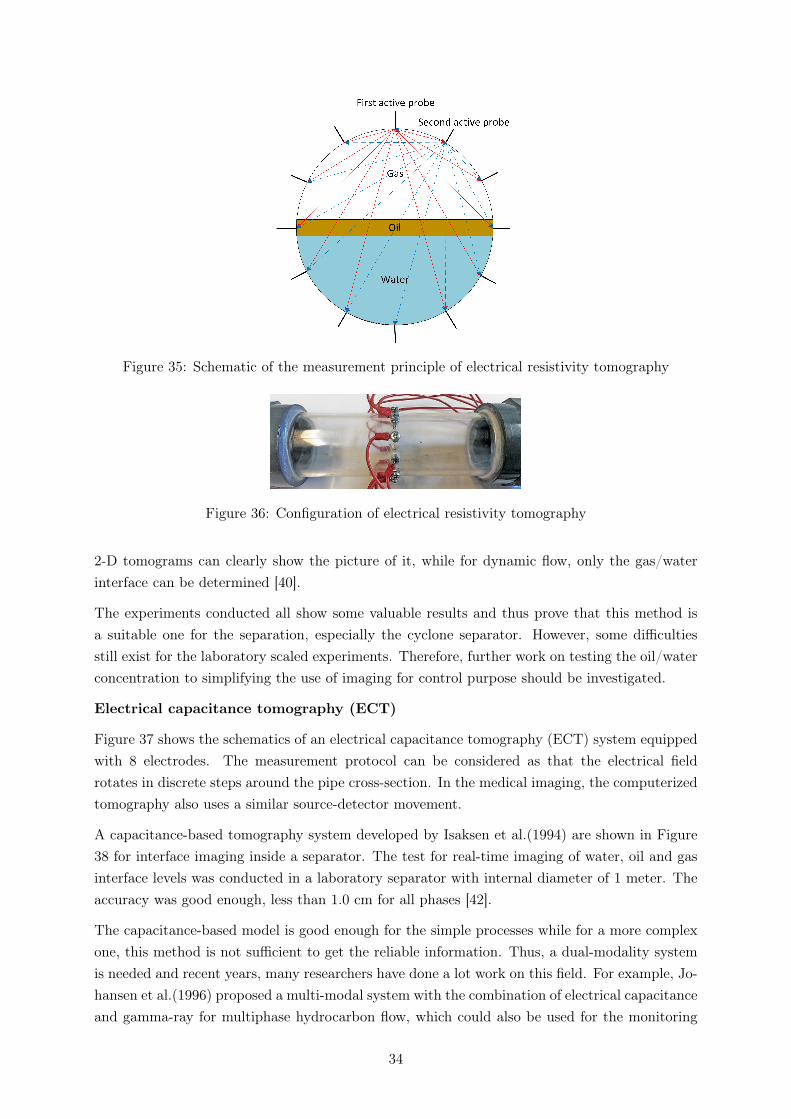
Figure 35: Schematic of the measurement principle of electrical resistivity tomography
Figure 36: Configuration of electrical resistivity tomography
2-D tomograms can clearly show the picture of it, while for dynamic flow, only the gas/waterinterface can be determined [40].
The experiments conducted all show some valuable results and thus prove that this method isa suitable one for the separation, especially the cyclone separator. However, some difficultiesstill exist for the laboratory scaled experiments. Therefore, further work on testing the oil/waterconcentration to simplifying the use of imaging for control purpose should be investigated.
Electrical capacitance tomography (ECT)
Figure 37 shows the schematics of an electrical capacitance tomography (ECT) system equippedwith 8 electrodes. The measurement protocol can be considered as that the electrical fieldrotates in discrete steps around the pipe cross-section. In the medical imaging, the computerizedtomography also uses a similar source-detector movement.
A capacitance-based tomography system developed by Isaksen et al.(1994) are shown in Figure38 for interface imaging inside a separator. The test for real-time imaging of water, oil and gasinterface levels was conducted in a laboratory separator with internal diameter of 1 meter. Theaccuracy was good enough, less than 1.0 cm for all phases [42].
The capacitance-based model is good enough for the simple processes while for a more complexone, this method is not sufficient to get the reliable information. Thus, a dual-modality systemis needed and recent years, many researchers have done a lot work on this field. For example, Jo-hansen et al.(1996) proposed a multi-modal system with the combination of electrical capacitanceand gamma-ray for multiphase hydrocarbon flow, which could also be used for the monitoring
34
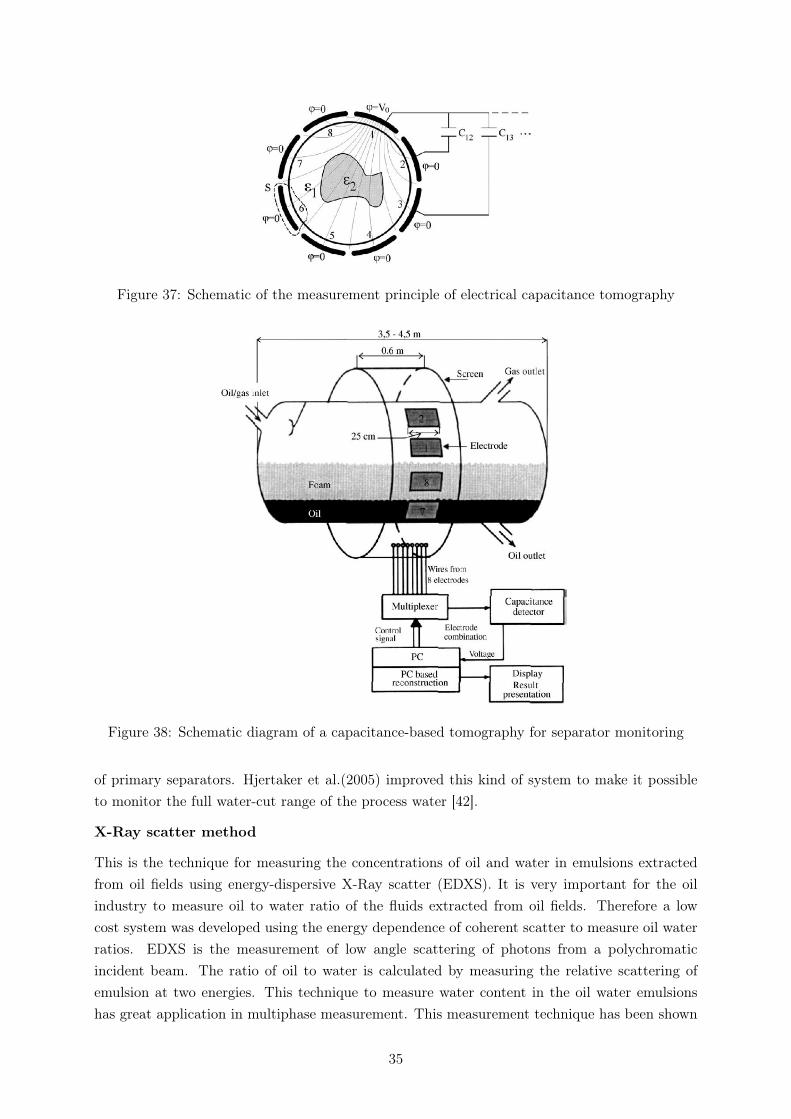
Figure 37: Schematic of the measurement principle of electrical capacitance tomography
Figure 38: Schematic diagram of a capacitance-based tomography for separator monitoring
of primary separators. Hjertaker et al.(2005) improved this kind of system to make it possibleto monitor the full water-cut range of the process water [42].
X-Ray scatter method
This is the technique for measuring the concentrations of oil and water in emulsions extractedfrom oil fields using energy-dispersive X-Ray scatter (EDXS). It is very important for the oilindustry to measure oil to water ratio of the fluids extracted from oil fields. Therefore a lowcost system was developed using the energy dependence of coherent scatter to measure oil waterratios. EDXS is the measurement of low angle scattering of photons from a polychromaticincident beam. The ratio of oil to water is calculated by measuring the relative scattering ofemulsion at two energies. This technique to measure water content in the oil water emulsionshas great application in multiphase measurement. This measurement technique has been shown
35
to be independent of the flow rate of gas and hence suitable for online multiphase monitoring fora range of flow rates.
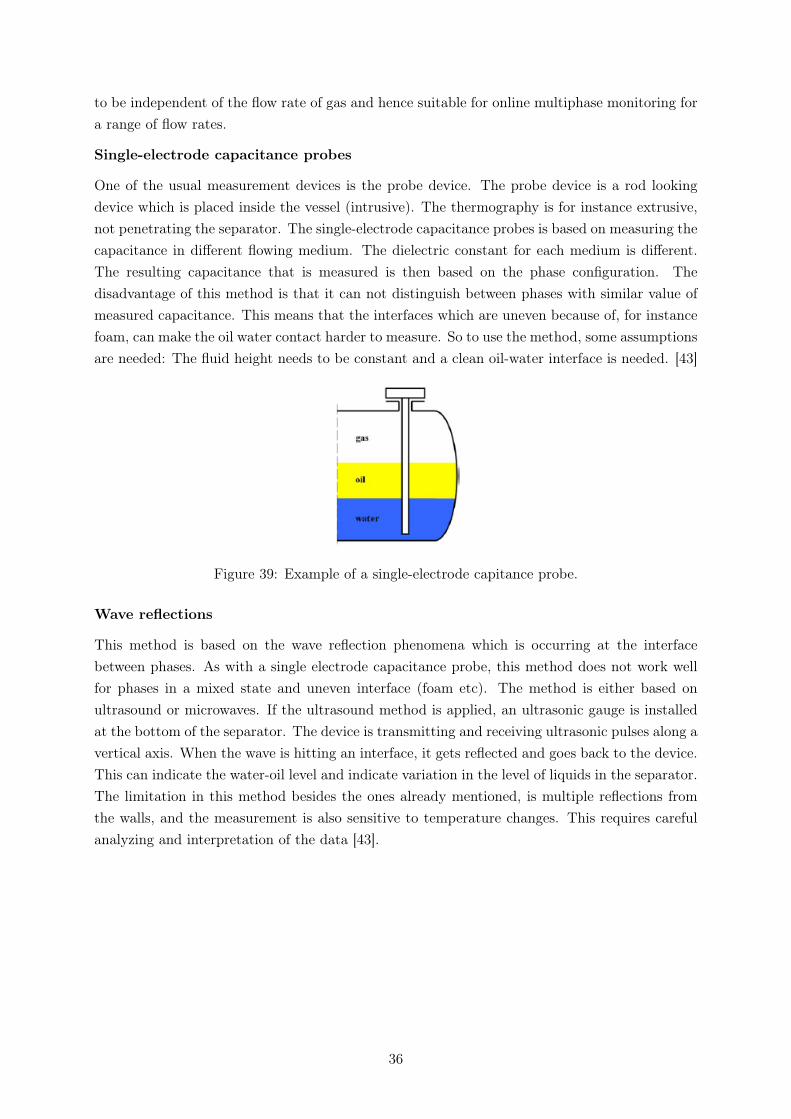
Single-electrode capacitance probes
One of the usual measurement devices is the probe device. The probe device is a rod lookingdevice which is placed inside the vessel (intrusive). The thermography is for instance extrusive,not penetrating the separator. The single-electrode capacitance probes is based on measuring thecapacitance in different flowing medium. The dielectric constant for each medium is different.The resulting capacitance that is measured is then based on the phase configuration. Thedisadvantage of this method is that it can not distinguish between phases with similar value ofmeasured capacitance. This means that the interfaces which are uneven because of, for instancefoam, can make the oil water contact harder to measure. So to use the method, some assumptionsare needed: The fluid height needs to be constant and a clean oil-water interface is needed. [43]
Figure 39: Example of a single-electrode capitance probe.
Wave reflections
This method is based on the wave reflection phenomena which is occurring at the interfacebetween phases. As with a single electrode capacitance probe, this method does not work wellfor phases in a mixed state and uneven interface (foam etc). The method is either based onultrasound or microwaves. If the ultrasound method is applied, an ultrasonic gauge is installedat the bottom of the separator. The device is transmitting and receiving ultrasonic pulses along avertical axis. When the wave is hitting an interface, it gets reflected and goes back to the device.This can indicate the water-oil level and indicate variation in the level of liquids in the separator.The limitation in this method besides the ones already mentioned, is multiple reflections fromthe walls, and the measurement is also sensitive to temperature changes. This requires carefulanalyzing and interpretation of the data [43].
36
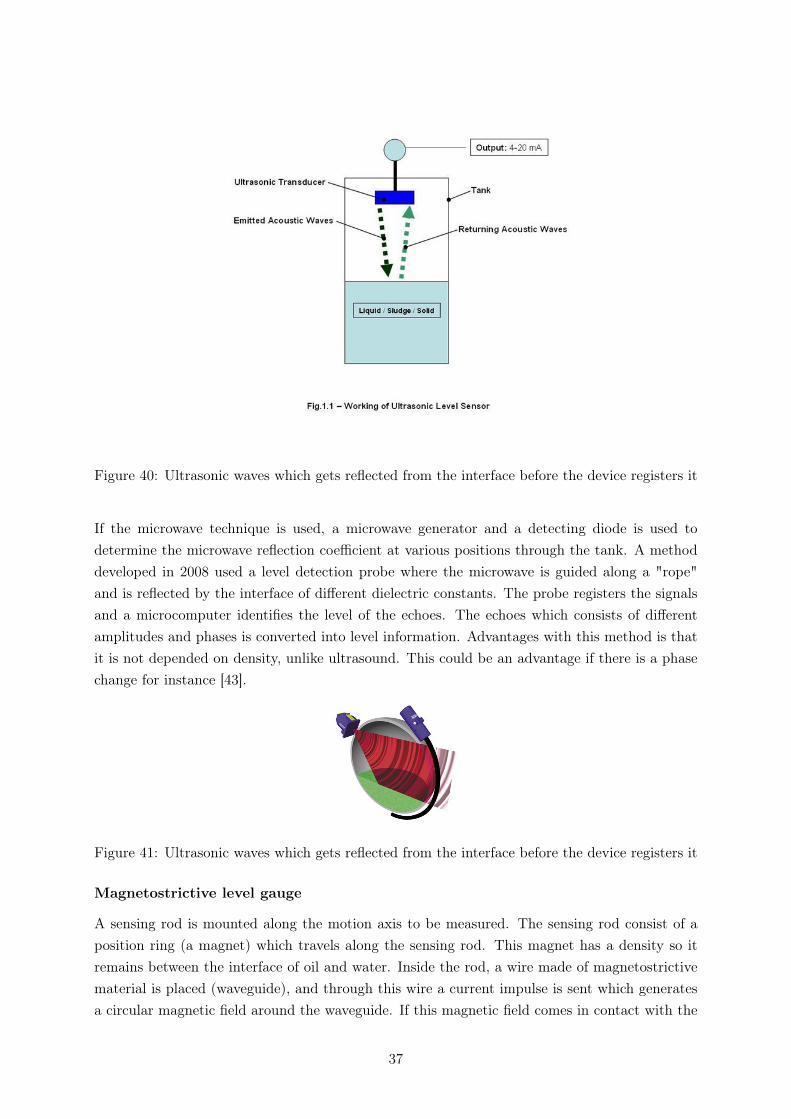
Figure 40: Ultrasonic waves which gets reflected from the interface before the device registers it
If the microwave technique is used, a microwave generator and a detecting diode is used todetermine the microwave reflection coefficient at various positions through the tank. A methoddeveloped in 2008 used a level detection probe where the microwave is guided along a "rope"and is reflected by the interface of different dielectric constants. The probe registers the signalsand a microcomputer identifies the level of the echoes. The echoes which consists of differentamplitudes and phases is converted into level information. Advantages with this method is thatit is not depended on density, unlike ultrasound. This could be an advantage if there is a phasechange for instance [43].
Figure 41: Ultrasonic waves which gets reflected from the interface before the device registers it
Magnetostrictive level gauge
A sensing rod is mounted along the motion axis to be measured. The sensing rod consist of aposition ring (a magnet) which travels along the sensing rod. This magnet has a density so itremains between the interface of oil and water. Inside the rod, a wire made of magnetostrictivematerial is placed (waveguide), and through this wire a current impulse is sent which generatesa circular magnetic field around the waveguide. If this magnetic field comes in contact with the
37

magnetic field from the magnet ring which is free to slide, a density wave is triggered where thetwo magnetic fields are in contact. This new wave will propagate in the waveguide towards asensor head. The distance between the magnetic ring and the sensor head can then be calculated.This can be used to measure multi-interphases, for instance gas-foam, foam-oil, water-solids etc.By inserting several probes, emulsions could also be detected [43] [44] [45].
Figure 42: Schematic example of how a magnetostrictive level gauge works
Other promising methods
In addition to the methods mentioned above, there are also many other potential technologiesthat have already been developed for several years, including erosion, microscopy image analysis,Laser-Induced Fluorescence (LIF), light scattering, so on and so forth. Erosion and acoustic basedtechnologies are now used to provide useful information for sand detection and monitoring, but forproduced water applications, they are not sensitive enough. For the measurement of producedwater quality, image analysis, ultrasonic and a combination of LIF and image analysis basedsystems are very promising in today’s market. But they are all relatively new technologies to theoil and gas industry and still facing a lot of problems especially fouling of the optical windows[46].
In our view, the Tomography methods especially the Electrical Resistivity Tomography methodsmight be the best choice for subsea separator. First of all, the tomography method is non-invasiveand thus will not reduce the robustness of the separator. In addition, ERT has been used forclay refining solid-solid hydrocyclones previously and proved to be suitable for water-oil cycloneseparator. Although further development is still needed to put this method into commercial use,it seems to be the most promising one for subsea separation.
Calibration
After the collection of data, a calibration is needed to test whether the value is correct or not,whether they are trustable. This is extremely difficult for the real-time oil in produced watermonitoring. This is because the great variation of the produced water stream and also it’s hardto simulate the water in a laboratory environment.
38
In our view, two kind of solutions are practicable for this issue: the first one is that we canhave two measurement instruments to compare the value with each other. When the valuesfrom the two instruments are almost the same, we consider this to be correct since it is almostimpossible to have the same wrong value at the same time. The other one is that we can setthe ROV periodically to take some samples and analyze in the surface lab to check whether theinstrument is working properly.
39
5.1 CONTROL AND INSTRUMENTATION
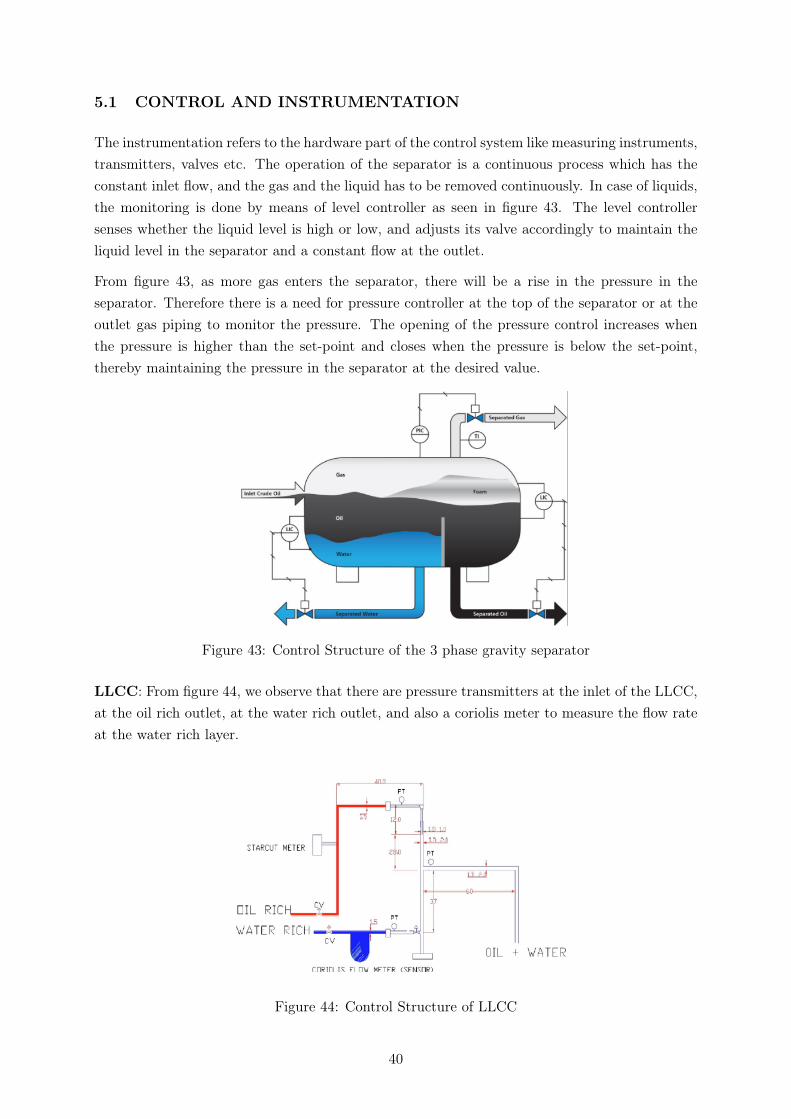
The instrumentation refers to the hardware part of the control system like measuring instruments,transmitters, valves etc. The operation of the separator is a continuous process which has theconstant inlet flow, and the gas and the liquid has to be removed continuously. In case of liquids,the monitoring is done by means of level controller as seen in figure 43. The level controllersenses whether the liquid level is high or low, and adjusts its valve accordingly to maintain theliquid level in the separator and a constant flow at the outlet.
From figure 43, as more gas enters the separator, there will be a rise in the pressure in theseparator. Therefore there is a need for pressure controller at the top of the separator or at theoutlet gas piping to monitor the pressure. The opening of the pressure control increases whenthe pressure is higher than the set-point and closes when the pressure is below the set-point,thereby maintaining the pressure in the separator at the desired value.
Figure 43: Control Structure of the 3 phase gravity separator
LLCC: From figure 44, we observe that there are pressure transmitters at the inlet of the LLCC,at the oil rich outlet, at the water rich outlet, and also a coriolis meter to measure the flow rateat the water rich layer.
Figure 44: Control Structure of LLCC
40

Anti-Slug Control: As mentioned in Section 4, severe slugging usually takes place in pipelinescarrying multiphase mixture from the seabed to the surface. As shown in figure 45, at a givenpressure set point, the topside choke valve is used to control the riser base pressure. It can beseen that the topside choke valve is the manipulated variable and the pressure at the riser is thecontrolled variable [47].
Figure 45: Topside choke "anti-slug control" [47].
Design Safety: There is a need for safety system to prevent overpressure, equipment rupture,pollution, fire and personnel injury. Two layers of protection exist in a safety system, namelyprimary and secondary protection.
Primary protection is a sensor on the equipment that detects the undesirable occurrence. Forexample, the equipment usually had the level, pressure or temperature sensor to detect values thatare too high or low in comparison to the set-point. When the primary protection fails to operate,there is a secondary protection system consisting of Pressure Safety Valve (PSV). This safetyvalve relieves the excess pressure in the vessel which is resulted by the over-pressurization andvents to the flare. A separator with a given operating pressure will have a design pressure whichis termed as Maximum Allowable Working Pressure (MAWP) to prevent over-pressurization dueto small fluctuations in the process conditions.
41
5.2 MODELING
Models
Modeling is used in nearly all parts of science and engineering, and is the basis for design andoperations. It is used from the design of specific parts of equipment, to design and optimizationof the parameters for a whole system. For operations, models are used for control design purposesfrom a basic-level, to an intermediate-level where more advanced technologies for model-controlis used, up to a high-level model for controlling and coordinating the actions for a whole plant.Models are also used on a top level for production planning and logistics. For chemical engi-neering, the modeling, in terms of operations, is often split into three parts: low-level models forbasic controllers, medium-level models for model-predictive controllers, and high-level models forcontrol-optimization [48].
What is a model?
Models are used to mimic the physical behavior, and to map behaviors into objects. Thereforethey are very important for any kind of work where the objective is to exploit the objectsbehavior. To base the model on a mathematical formulation provides answers and guidanceuseful for the originating application, and it enables a better understanding of the system beingmodeled. Hence, from now on the model will refer to a mathematical model. We can define themathematical model taking place in three major steps [48]:
• Primary mapping : The first major step is to convert the plant into models based onmechanistic equations derived from physics, fluid mechanics, thermodynamics, etc. Theresults of this operation are either a set of ODE’s, algebraic equations (AE’s), or a set ofPDE’s.
• Model simplification: Here we take into account the order-of-magnitude assumptions whichleads to the simplification of the model. Additionally mathematical simplification may beintroduced, such as polynomial approximation to simplify the model.
• Model fitting : Adjusts the model to the plant by minimizing prediction-result mismatch.
Based on these principles the model can be constructed in two different ways. The first is amechanistic model, often referred to as White Box Models or First Principles Models, which isderived purely from physics. The second is referred to as Black Box Models, and the reason forusing this more often, is due to the unavailability of the process mechanics, or it is too compli-cated for the intended application. Another reason to use it is because of lower computationalcomplexity and reduced computation time. Both the "boxes" do not exist purely, therefore acombination of the two approaches is used, which is termed as Grey Box Modeling. Simulationof process models is very important for the design, safety analysis and controller synthesis of theprocess. Therefore there is a necessity of prior trial of the controller on a process model beforethe implementation of the plant.
42
Models for the separator
A separator is controlled using the outlet flow rates of gas and water. The water outlet qualityand oil outlet quality are variables of significant interest, though they are not always measured.Modeling helps to estimate the variables of interest based on available measurements. TamalDas, a PhD candidate from NTNU, is carrying out research on developing control orientedprocess models for separators such as gravity separators, cyclonic separators for subsea oil andgas processing. One way of doing this is by designing state observers, Leunberger observers, toestimate the unmeasured states like the quality using the known measurements such as pressureand level.
43
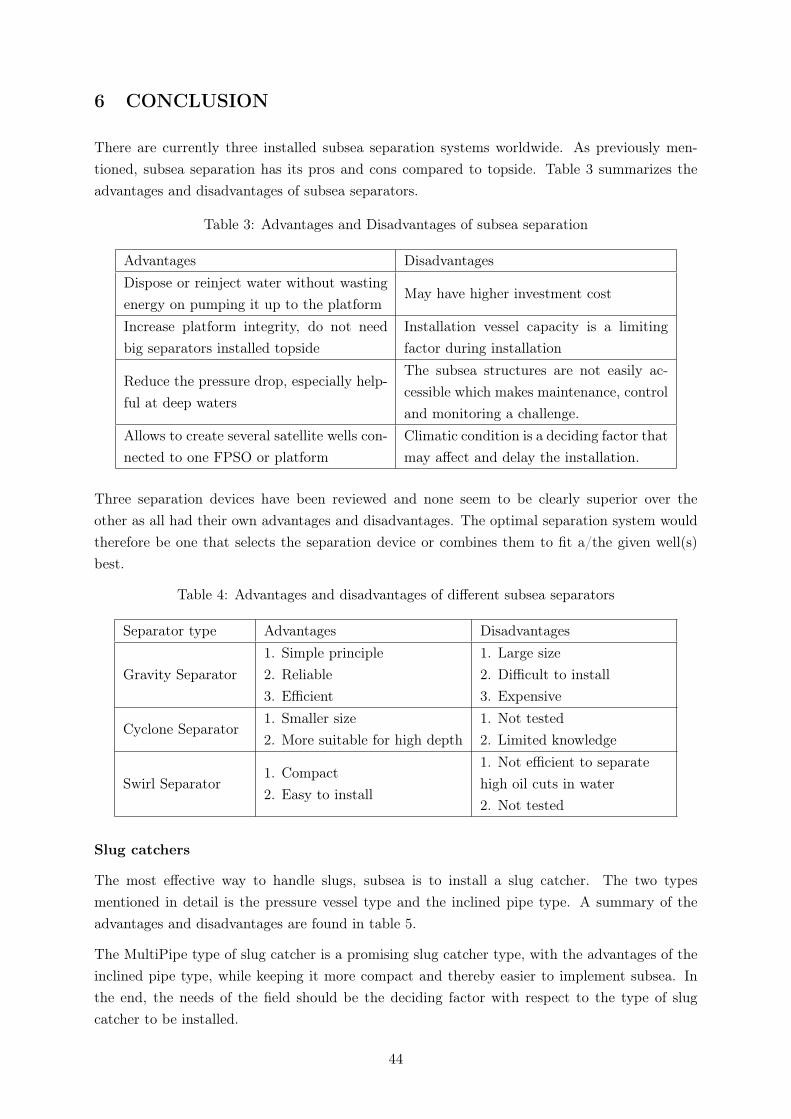
6 CONCLUSION
There are currently three installed subsea separation systems worldwide. As previously men-tioned, subsea separation has its pros and cons compared to topside. Table 3 summarizes theadvantages and disadvantages of subsea separators.
Table 3: Advantages and Disadvantages of subsea separation
Advantages DisadvantagesDispose or reinject water without wastingenergy on pumping it up to the platform
May have higher investment cost
Increase platform integrity, do not needbig separators installed topside
Installation vessel capacity is a limitingfactor during installation
Reduce the pressure drop, especially help-ful at deep waters
The subsea structures are not easily ac-cessible which makes maintenance, controland monitoring a challenge.
Allows to create several satellite wells con-nected to one FPSO or platform
Climatic condition is a deciding factor thatmay affect and delay the installation.
Three separation devices have been reviewed and none seem to be clearly superior over theother as all had their own advantages and disadvantages. The optimal separation system wouldtherefore be one that selects the separation device or combines them to fit a/the given well(s)best.
Table 4: Advantages and disadvantages of different subsea separators
Separator type Advantages Disadvantages
Gravity Separator1. Simple principle2. Reliable3. Efficient
1. Large size2. Difficult to install3. Expensive
Cyclone Separator1. Smaller size2. More suitable for high depth
1. Not tested2. Limited knowledge
Swirl Separator1. Compact2. Easy to install
1. Not efficient to separatehigh oil cuts in water2. Not tested
Slug catchers
The most effective way to handle slugs, subsea is to install a slug catcher. The two typesmentioned in detail is the pressure vessel type and the inclined pipe type. A summary of theadvantages and disadvantages are found in table 5.
The MultiPipe type of slug catcher is a promising slug catcher type, with the advantages of theinclined pipe type, while keeping it more compact and thereby easier to implement subsea. Inthe end, the needs of the field should be the deciding factor with respect to the type of slugcatcher to be installed.
44
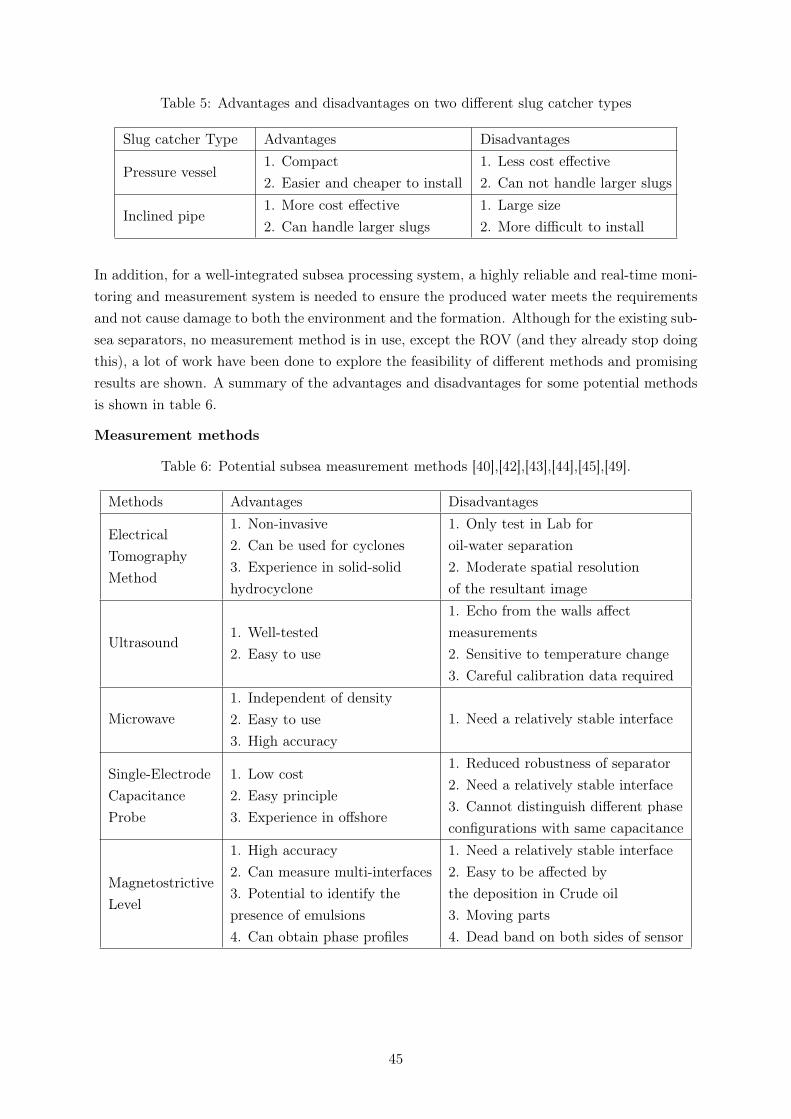
Table 5: Advantages and disadvantages on two different slug catcher types
Slug catcher Type Advantages Disadvantages
Pressure vessel1. Compact2. Easier and cheaper to install
1. Less cost effective2. Can not handle larger slugs
Inclined pipe1. More cost effective2. Can handle larger slugs
1. Large size2. More difficult to install
In addition, for a well-integrated subsea processing system, a highly reliable and real-time moni-toring and measurement system is needed to ensure the produced water meets the requirementsand not cause damage to both the environment and the formation. Although for the existing sub-sea separators, no measurement method is in use, except the ROV (and they already stop doingthis), a lot of work have been done to explore the feasibility of different methods and promisingresults are shown. A summary of the advantages and disadvantages for some potential methodsis shown in table 6.
Measurement methods
Table 6: Potential subsea measurement methods [40],[42],[43],[44],[45],[49].
Methods Advantages Disadvantages
ElectricalTomographyMethod
1. Non-invasive2. Can be used for cyclones3. Experience in solid-solidhydrocyclone
1. Only test in Lab foroil-water separation2. Moderate spatial resolutionof the resultant image
Ultrasound1. Well-tested2. Easy to use
1. Echo from the walls affectmeasurements2. Sensitive to temperature change3. Careful calibration data required
Microwave1. Independent of density2. Easy to use3. High accuracy
1. Need a relatively stable interface
Single-ElectrodeCapacitanceProbe
1. Low cost2. Easy principle3. Experience in offshore
1. Reduced robustness of separator2. Need a relatively stable interface3. Cannot distinguish different phaseconfigurations with same capacitance
MagnetostrictiveLevel
1. High accuracy2. Can measure multi-interfaces3. Potential to identify thepresence of emulsions4. Can obtain phase profiles
1. Need a relatively stable interface2. Easy to be affected bythe deposition in Crude oil3. Moving parts4. Dead band on both sides of sensor
45
The future
Currently the oil recovery factor is around 60% for offshore platforms and 50% for subsea instal-lations [50]. We have discussed a lot of advantages with subsea separation and subsea in general,and even though the current recovery factor is usually bigger for platforms, the goal is to changethis in the future. Subsea separation is very expensive and a lot of people still wonder whythe separators and other components should be installed at the seabed despite the advantagesdiscussed in this paper. Subsea separation is still in an experimental phase, and new innovativemethods is needed to make new steps in the oil industry to get increased oil recovery and reducedcosts, which is crucial at this stage (low oil price, high costs etc). Subsea separation is one ofthose new innovative methods and has shown promising results. This is still in an early stage ofthe experimental phase and with new technology and time, a lot of improvements will appear.Based on the positive progress which have been done, subsea separation and subsea in generalwill be the future. When Statoil was planning on building a subsea gas compression device,engineers thought they had lost their minds and meant it was impossible. Some years later whenit was installed and started to operate successfully in 2005, engineers and oil companies whereenvious and had to bury their words. This compression device increased the oil recovery a lot,and there were still room for a lot of improvements. This shows that there is a bright futurefor subsea, and subsea separation will with time be cheaper and more efficient. This expensiveexperimental phase is necessary, since the easy oil has been recovered, and the more difficult oilremains, which requires more complex technology in the future.
46
References
[1] Clifford Neal Prescott. Subsea separation and processing of oil, gas and produced water -past, present and future: Why we need it now. 2012.
[2] Petrowiki. Offshore and subsea facilities.
[3] Gro Mogseth. Ekspert i team - subsea intro course.
[4] Eureka. E! 3040 subsea separator.
[5] M. Storvik O.F. Janhnsen. Subsea processing and boosting in a global perspective. 2011.
[6] R. M. Ramberg H. RognøO. Ø kland, S. Davies. Steps to the subsea factory. 2013.
[7] Jarle Michaelsen Stig Gustafson, William B. Norsk. Subsea separation: The way into thenew millennium. 2000.
[8] Tan Chew Fern. Characterisation of crude oil components, asphaltene aggregation andemulsion stability by means of near infrared spectroscopy and multivariable analysis. 2002.
[9] Statoil. Presentation from statoil in the course tpg4135.
[10] Petrowiki. Oil emulsions.
[11] Narve Aske. Characterisation, demulsification and transportation of heavy crude oil via oilin water emulsion. 2012.
[12] Petrowiki.
[13] Terje Horn and Nils Arne Soelvik. Troll c subsea separation station proves viability ofseafloor system.
[14] Preben Fürst Tyvold. Steps to the subsea factory. 2015.
[15] FMC Technologies. Statoil tordis ssbi project.
[16] Laurens van Campen, Robert Frank Mudde, Jesse Slot, and Harry Hoeijmakers. A numericaland experimental survey of a liquid-liquid axial cyclone. 10, 2012.
[17] C. Moraes, F da Silva, A. Monteiro, D. Oliveira, L.P. Marins, and Petrobas. Subsea versustopside processing - conventional and new technologies. 2013.
[18] Laurens van Campen, Robert Frank Mudde, and Harry Hoeijmakers. In-line oil-water sep-aration in swirling flow. 2011.
[19] C. Oropeza-Vazquez, E. Afanador, S. Wang L. Gomez, R. Mohan, and O. Shoham. Oil-water separation in a novel liquid-liquid cylindrical cyclone compact separator-experimentsand modeling. 2003.
[20] N.Kharoua, L. Khezzar, and Z.Nemouchi. Hydrocyclones for deoiling applications - a review.Petroleum Science and Technology - PET SCI TECHNOL, 2010.
47
[21] Carlos Hernan Gomez. Oil-water separation in liquid-liquid hydrocyclones(llhc)-experimentand modeling. 2001.
[22] C. Oropeza-Vazquez. Multiphase flow separation in liquid-liquid cylindrical cyclone andgas-liquid -liquid cylindrical cyclone. 2001.
[23] Andreas Hannisdal, Remko Westra, Mohamed Reda Akdim, Adam Bymaster, Ed Grave,and Daniel Terng Teng. Compact separation technologies and their applicability for subseafield development in deep water. Offshore Technology Conference, 2012.
[24] Stephane Jean Anres, Nicolas Butin, Wayne Evans, and Didier Bigeonneau. New solutionsfor subsea produced water separation and treatment in deepwater. Offshore TechnologyConference, 2011.
[25] Yong Bai and Qiang Bai. Subsea Structural Engineering Handbook. Gulf Professional Pub-lishing, 2010.
[26] Paulo Correia Monteiro, Luciana Loureiro Silva, Edson Vidal, and Theodoro AntonumNetto. Study of slug control techniques in pipeline systems. 2014.
[27] B.T Enilari and Dr.F. Kara. Slug flow and its mitigation techniques in the oil and gasindustry. Society of Petroleum Engineers, 2015.
[28] Pengfei Han and Liejin Guo. Numerical simulation of terrain-induced severe slugging coupledby hydrodynamic slugs in a pipeline–riser system. International Journal of Heat and FluidFlow, 2015.
[29] Tine Bauck Irmann-Jacobsen. Flow assurance – a system perspective. MEK4450-FMCSubsea technologies.
[30] Saeid Mokhatab, William A. Poe, and John Y. Mak. Handbook of Natural Gas Transmissionand Processing: Principles and Practices. Gulf Professional Publishing, 2015.
[31] Thereza Karam. Slug catchers in natural gas production. 2012.
[32] R. Malekzadeh, R.A.W.M. Henkes, and R.F. Mudde. Severe slugging in a long pipeline-risersystem: Experiments and predictions. 2012.
[33] Andrew Clennel Palmer and Roger A. King. Subsea Pipeline Engineering. PennWell Books,2008.
[34] J. Godhavn, M.P. Fard, and P.H. Fuchs. New slug control strategies, tuning rules andexperimental results. 2004.
[35] Andreas Hannisdal, Remko Westra, Mohamed Reda Akdim, Adam Bymaster, Ed Grave,and Daniel Terng Teng. Compact separation technologies and their applicability for subseafield development in deep water. Offshore Technology Conference, 2012.
[36] Prasanna Parthasarathy. Olga surge volume bug?
[37] C. Neal Prescott. Subsea separation and processing of oil, gas & produced water.
48
[38] Soelvik, Nils Arne, and Terje Horn. Troll c subsea separation station proves viability ofseafloor system.
[39] Alexandre G. de Siqueira. Marlim 3 phase subsea separation system - introduction to theinvolved reservoir background. Offshore Technology Conference, 2012.
[40] Petar Durdevic, Leif Hansen, Christian Mai, Simon Pedersen, and Zhenyu Yang. Cost-effective ert technique for oil-in-water measurement for offshore hydrocyclone installations.2nd IFAC workshop on Automatic Control in Offshore Oil and Gas Production,May 27-29,2015, Florianópolis, Brazil, pages 153–159, 2015.
[41] M.A.Bennett and R.A. Williams. Monitoring the operation of oil/water separator usingimpedance tomography. Minerals Engineering, 17:605–614, 2004.
[42] Artur J. Jaworski and Guangtian Meng. On-line measurement of separation dynamics inprimary gas/oil/water separators:challenges and technical solutions—a review. Journal ofPetroleum Science and Engineering, 68:47–59, 2009.
[43] Meng Jaworski. Measuring methods.
[44] MTS System Corp. USA. Magnetostrictive sensor.
[45] Magnetostrictive sensor.
[46] Ming Yang. Measuring oil in produced water.
[47] Esmaeil Jahanshahi and Sigurd Skogestad. Anti-slug control solutions based on identifiedmodel. Journal of Process Control, 2014.
[48] Heinz A. Preisig. The ABC of Modelling. 2016.
[49] I.Ismail, J.C.Gamio, S.F.A Bukhari, and W.Q.Yang. Tomography for multi-phase flowmeasurement in the oil industry. Flow Measurement and Instrumentation, 16:145–155, 2005.
[50] TPG4200. Lecture notes from tpg4200.
49