specialization project 2012 -...
TRANSCRIPT

NTNU Fakultet for naturvitenskap og teknologi
Norges teknisk-naturvitenskapelige Institutt for kjemisk prosessteknologi
universitet
SPECIALIZATION PROJECT 2012
TKP 4550
PROJECT TITLE:
MODELLING OF BIODIESEL PRODUCTION WITH SIMULINK
Conventional Plug Flow Reactor
Followed by Separation and Purification
By
Marianne Øien
Supervisor for the project: Sigurd Skogestad and Chriss Grimholt
Date: 07.12.2012

1
Acknowledgement
A great thanks to supervisors Sigurd Skogestad, and Chriss Grimholt for allhelp, support, guidance and inputs. I am grateful for their willingness to helpand for an open door for questions. A thank to fellow students and especiallyEmilie Ø. Houge working on reactive distillation for discussion and sharing ofinformation on the field biodiesel production.
i

ii

Abstract
A model for biodiesel production by plug flow reactor has been programmed andevaluated. The main parts of the process being modelled in this study are thereactor, the separation of glycerol and biodiesel in a centrifuge, and purificationof product stream by removal of methanol. The centrifuge will for simplicitybe modelled as a settling tank and split. In the reactor the kinetics are takenfrom publications and for now the operating conditions are taken as the optimalvalues given by articles. The process was reduced to these three main step infour units as a start to make sure the most important part of the process wascovered first. The purification units will be assumed binary for simplicity andintermediate products are neglected.
The model has been evaluated for disturbances in the amount and compo-sition of the feed flow for all units and complete plant model. The reactor unitby CSTRs in series follows the expected pattern from the reaction stoichiome-try and kinetics literature. The settling tank for buffer effect and splitting ofphases, smooth out the inlet disturbances for the downstream equipment wherethe product streams are purified by removal of methanol. By control of thedifferent units, the required purification for selling the product was achievedthrough expected model response.
iii

iv

Contents
1 Nomenclature ix
2 Introduction 12.1 Aim . . . . . . . . . . . . . . . . . . . . . . . . . . . . . . . . . . 12.2 Biodiesel . . . . . . . . . . . . . . . . . . . . . . . . . . . . . . . . 12.3 Industry . . . . . . . . . . . . . . . . . . . . . . . . . . . . . . . . 22.4 Feedstock . . . . . . . . . . . . . . . . . . . . . . . . . . . . . . . 32.5 Biodiesel in engine . . . . . . . . . . . . . . . . . . . . . . . . . . 32.6 Biodiesel production methods . . . . . . . . . . . . . . . . . . . . 3
3 Theory 53.1 Reactor . . . . . . . . . . . . . . . . . . . . . . . . . . . . . . . . 5
3.1.1 Reactions . . . . . . . . . . . . . . . . . . . . . . . . . . . 53.1.2 Reactor design equations . . . . . . . . . . . . . . . . . . 63.1.3 Plug Flow Reactor . . . . . . . . . . . . . . . . . . . . . . 63.1.4 Continuous-Stirred Tank Reactor . . . . . . . . . . . . . 63.1.5 Temperature dependence . . . . . . . . . . . . . . . . . . 83.1.6 Operating conditions . . . . . . . . . . . . . . . . . . . . . 9
3.2 Settling tank . . . . . . . . . . . . . . . . . . . . . . . . . . . . . 103.3 Split . . . . . . . . . . . . . . . . . . . . . . . . . . . . . . . . . . 103.4 Distillation . . . . . . . . . . . . . . . . . . . . . . . . . . . . . . 12
3.4.1 Vapour pressure . . . . . . . . . . . . . . . . . . . . . . . 143.4.2 Raoult’s law . . . . . . . . . . . . . . . . . . . . . . . . . . 143.4.3 Relative volatility . . . . . . . . . . . . . . . . . . . . . . 14
3.5 Flash tank . . . . . . . . . . . . . . . . . . . . . . . . . . . . . . . 153.5.1 Molar volume . . . . . . . . . . . . . . . . . . . . . . . . . 16
3.6 Control . . . . . . . . . . . . . . . . . . . . . . . . . . . . . . . . 163.6.1 Proportional controller . . . . . . . . . . . . . . . . . . . 163.6.2 Proportional-Integral controller . . . . . . . . . . . . . . . 163.6.3 First order process . . . . . . . . . . . . . . . . . . . . . . 163.6.4 Integrating process . . . . . . . . . . . . . . . . . . . . . . 173.6.5 Tight and smooth control . . . . . . . . . . . . . . . . . . 173.6.6 Backoff . . . . . . . . . . . . . . . . . . . . . . . . . . . . 18
4 Generation of model with Simulink 194.1 Solvers . . . . . . . . . . . . . . . . . . . . . . . . . . . . . . . . . 194.2 Reactor . . . . . . . . . . . . . . . . . . . . . . . . . . . . . . . . 194.3 Settling tank and split . . . . . . . . . . . . . . . . . . . . . . . . 204.4 Distillation . . . . . . . . . . . . . . . . . . . . . . . . . . . . . . 20
4.4.1 Control of distillation column . . . . . . . . . . . . . . . . 214.5 Flash . . . . . . . . . . . . . . . . . . . . . . . . . . . . . . . . . . 21
5 Case study of model 235.1 Reactor . . . . . . . . . . . . . . . . . . . . . . . . . . . . . . . . 235.2 Settling tank and split . . . . . . . . . . . . . . . . . . . . . . . . 235.3 Distillation . . . . . . . . . . . . . . . . . . . . . . . . . . . . . . 245.4 Flash . . . . . . . . . . . . . . . . . . . . . . . . . . . . . . . . . . 245.5 Plant . . . . . . . . . . . . . . . . . . . . . . . . . . . . . . . . . . 24
v
6 Model validation 256.1 Tuning of system . . . . . . . . . . . . . . . . . . . . . . . . . . . 25
6.1.1 Tuning of distillation column . . . . . . . . . . . . . . . . 256.1.2 Smooth control of settling tank . . . . . . . . . . . . . . . 29
6.2 Reactor . . . . . . . . . . . . . . . . . . . . . . . . . . . . . . . . 306.2.1 Plug Flow Reactor . . . . . . . . . . . . . . . . . . . . . . 306.2.2 Approximation of PFR by CSTRs . . . . . . . . . . . . . 316.2.3 Result of case study of reactor . . . . . . . . . . . . . . . 33
6.3 Settling tank . . . . . . . . . . . . . . . . . . . . . . . . . . . . . 376.3.1 Result of case study of settling tank . . . . . . . . . . . . 37
6.4 Distillation . . . . . . . . . . . . . . . . . . . . . . . . . . . . . . 406.4.1 Result of case study of distillation column . . . . . . . . . 40
6.5 Flash tank . . . . . . . . . . . . . . . . . . . . . . . . . . . . . . . 446.5.1 Result of case study of flash tank . . . . . . . . . . . . . . 44
6.6 System response to increased feed flow . . . . . . . . . . . . . . . 46
7 Discussion 49
8 Conclusion 51
A CD with Simulink model 55
List of Tables
2.1 Composition of a typical soybean oil. . . . . . . . . . . . . . . . . 32.2 Biodiesel production methods in use and in research phase. . . . 43.1 Kinetic data for transesterification of soybean oil with NaOH
catalyst. . . . . . . . . . . . . . . . . . . . . . . . . . . . . . . . . 83.2 Nominal feed composition from the reactor, assumed ternary
composition. . . . . . . . . . . . . . . . . . . . . . . . . . . . . . 103.3 Nominal outlet composition from settling tank, assumed ternary
composition. . . . . . . . . . . . . . . . . . . . . . . . . . . . . . 113.4 The fraction of the inlet flow leaving in the biodiesel phase. . . . 123.5 Boiling temperatures. . . . . . . . . . . . . . . . . . . . . . . . . 123.6 Antoine coefficients. . . . . . . . . . . . . . . . . . . . . . . . . . 153.7 Molar volume [m3/mol] . . . . . . . . . . . . . . . . . . . . . . . 166.1 Tuning parameters for bottom composition. . . . . . . . . . . . . 266.2 Tuning parameters for distillate composition. . . . . . . . . . . . 27
List of Figures
2.1 Plant overview, where the model has been built for the main parts. 23.1 Production composition as a function of the excess methanol. . . 93.2 The ternary diagram for Methyl ester(oleate)(1), Methanol(2)
and Glycerol(3). . . . . . . . . . . . . . . . . . . . . . . . . . . . 113.3 The total balance over stages in the distillation column. . . . . . 133.4 Balance over feed stage in distillation column. . . . . . . . . . . . 133.5 First order response. . . . . . . . . . . . . . . . . . . . . . . . . . 173.6 Integrating response. . . . . . . . . . . . . . . . . . . . . . . . . . 17
vi

4.1 Example of a Simulink unit will look like. . . . . . . . . . . . . . 194.2 450 line and equilibrium lines for given α values from approximate
method and literature. . . . . . . . . . . . . . . . . . . . . . . . . 216.1 Response in bottom composition when step disturbance in VB
was applied. . . . . . . . . . . . . . . . . . . . . . . . . . . . . . . 266.2 Response in bottom composition when a change in the setpoint
for the bottom composition was performed. . . . . . . . . . . . . 276.3 Response in distillate composition when step in reflux, LT, was
applied. . . . . . . . . . . . . . . . . . . . . . . . . . . . . . . . . 286.4 Response in bottom composition to a step in feed flow for the
distillation column. . . . . . . . . . . . . . . . . . . . . . . . . . . 286.5 PFR concentration profiles with the length of reactor reduced to
half. . . . . . . . . . . . . . . . . . . . . . . . . . . . . . . . . . . 306.6 Illustration of CSTRs in serie. . . . . . . . . . . . . . . . . . . . . 316.7 Modelling of PFR by two CSTRs of same volume in series. . . . 316.8 Modelling of PFR by 20 CSTRs of same volume in series. . . . . 326.9 Modelling of PFR by ten CSTRs of same volume in series. . . . . 326.10 Case 1, Steady state out of the last reactor with nominal inlet
composition when methanol is in 100 % excess. . . . . . . . . . . 336.11 Case 2, A applied step in inlet flow and response in the outlet
flow of triglyceride of the first and last reactor. . . . . . . . . . . 346.12 Case 3, No methanol in the feed stream leading to unreacted
triglyceride in the outlet stream. . . . . . . . . . . . . . . . . . . 346.13 Case 4, No methanol in the inlet flow. The figure shows the
changes for the first to the last reactor. The first reactor is to theleft while the last reactor is to the right. . . . . . . . . . . . . . . 35
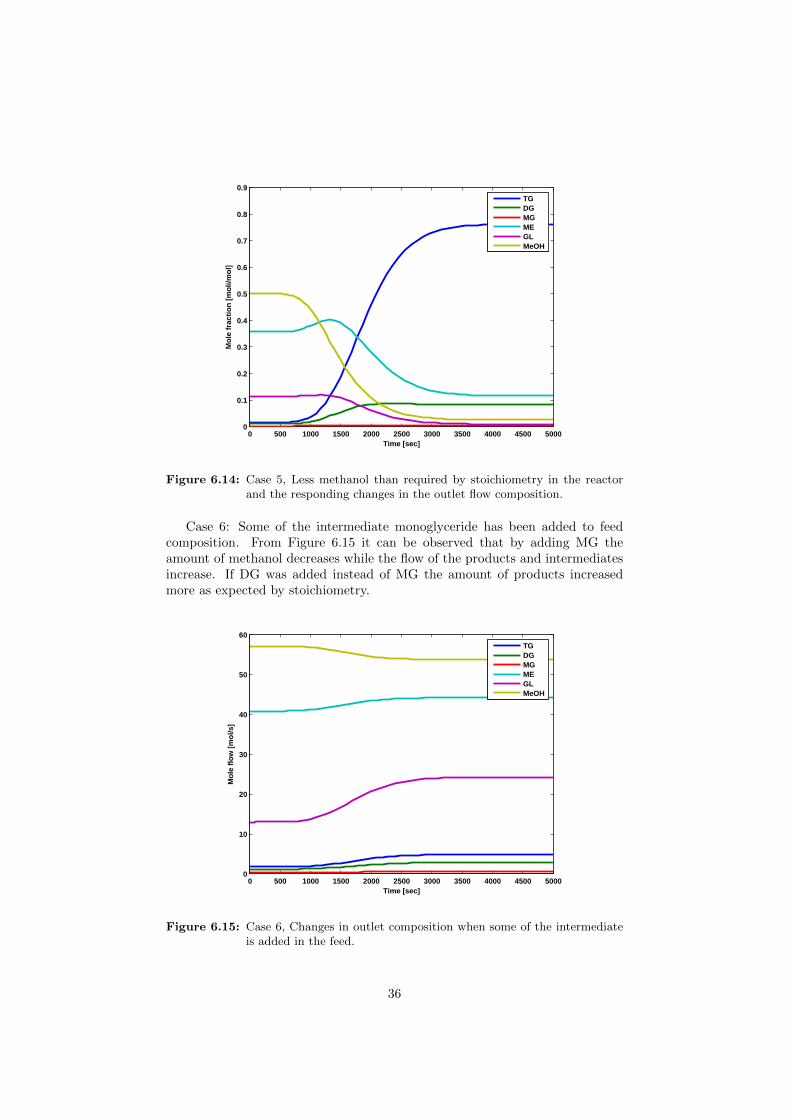
6.14 Case 5, Less methanol than required by stoichiometry in the re-actor and the responding changes in the outlet flow composition. 36
6.15 Case 6, Changes in outlet composition when some of the inter-mediate is added in the feed. . . . . . . . . . . . . . . . . . . . . 36
6.16 Case 7, Response in the total outlet flow from settling tank whena disturbance in the inlet flow was introduced. . . . . . . . . . . 37
6.17 Case 7, Response in the flow of the different phases from settlingtank when a disturbance in inlet flow occurred. . . . . . . . . . . 38
6.18 Case 8, The changes in flow of the different phases with a changein inlet composition. . . . . . . . . . . . . . . . . . . . . . . . . . 39
6.19 Case 8, The variation in outlet tank composition with a changein inlet composition. . . . . . . . . . . . . . . . . . . . . . . . . . 39
6.20 Case 9, Response in bottom composition when a step change wasapplied in the feed composition. . . . . . . . . . . . . . . . . . . . 40
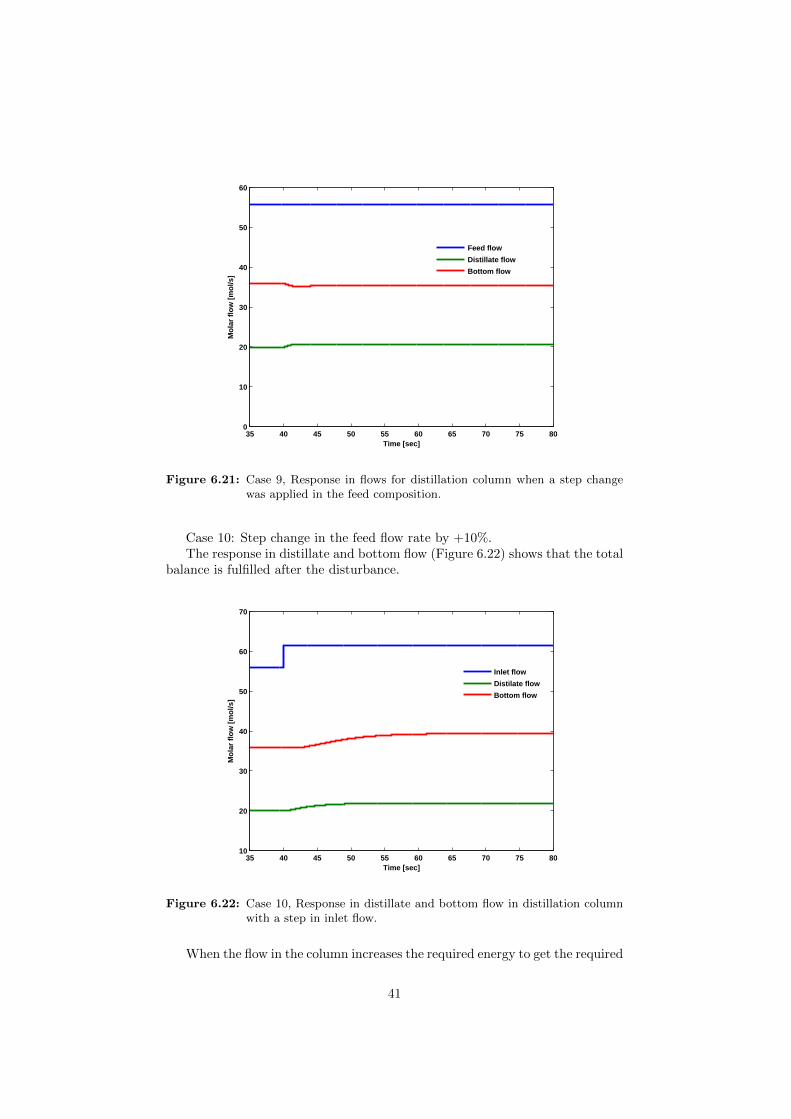
6.21 Case 9, Response in flows for distillation column when a stepchange was applied in the feed composition. . . . . . . . . . . . . 41
6.22 Case 10, Response in distillate and bottom flow in distillationcolumn with a step in inlet flow. . . . . . . . . . . . . . . . . . . 41
6.23 Case 10, Increased demand of boilup(VB), with increased inletflow. . . . . . . . . . . . . . . . . . . . . . . . . . . . . . . . . . . 42
6.24 Case 10, Response in bottom composition when an increased inletflow step was applied to the distillation column. . . . . . . . . . . 43
6.25 Case 11, The flow response in the flash tank due to increasedinlet flow. . . . . . . . . . . . . . . . . . . . . . . . . . . . . . . . 44
vii

6.26 Case 12, Response in vapour and liquid flow due to increasedfraction of methanol in inlet flow to flash tank. . . . . . . . . . . 45
6.27 Case 13, Nominal fraction of methanol in flash tank streams. . . 466.28 Overview response in the system with a step in the feed flow. . . 46
viii

1 Nomenclature
Symbol Meaning
α Relative volatility
β Coefficient
∆u Change in input
∆y Change in output
γ Activity coefficient
τ1 Integral time [s]
τC Controller time [s]
τholdup Holdup time [sec]
τI Integral time [s]
θ Time delay [s]
A Area [m2]
Aa Arrhenius constant
AA Antoine coefficient
B Bottom flow [mol/s]
BA Antoine coefficient
C Concentration [mol/L]
CA Antoine coefficient
Ci Concentration of component i [mol/L]
D Distillate flow [mol/s]
DA Antoine coefficient
Di Distillate flow of component i [mol/s]
e Error in controller
EA Antoine coefficient
E Activation energy [mol/s]
F Feed flow [mol/s]
Fi Flow of component i [mol/s]
h Height in settling tank [mol]
k Reaction rate constant [l/mol·s]KC Controller gain
ix

l Length of reactor [m]
L Liquid flow [mol/s]
m Controller output
m Bias value in controller output
M Molar holdup [mol]
n Mole in flash tank [mol]
ni Mole of component i in flash tank [mol]
nG Mole in gas phase [mol]
nL Mole in liquid phase [mol]
N Number of moles [mol]
Ni Number of moles of component i [mol]
P Total pressure [Pa]
Pi Component pressure [Pa]
P sati Saturation pressure of component i [Pa]
ri Rate of reaction component i [mol/l · sec]
R Gas constant [J/K ·mol]
t Residence time [s]
T Temperature [K]
Tb Boiling temperature [K]
v Velocity [m/s]
V Volume [m3]
V Vapour flow flow [mol/s]
Vtot Total volume [m3]
VL Volume in liquid phase [m3]
VG Volume in gas phase [m3]
Vm Molar volume in gas phase [m3/mol]
xi Molefraction of component i in liquid
yi Molefraction of component i in vapour
x

2 Introduction
2.1 Aim
The aim of the project was to create a simplified model of a biodiesel plantoperating with plug flow reactor. The model was decided to be built by Matlaband Simulink. For the author the goal with the project has been to get a betterinsight in the biodiesel production and extending the experience with working inSimulink. The motivation for creating a biodiesel model has been related to theincreased energy demand and the development towards new energy resources asbiofuel. The use of sustainable energy sources have increased focus amongst thepopulation and the necessity will only increase over the years to come so a studyof biodiesel can be related to a society interest in addition to the engineeringperspective. For this project mainly the rector, settling tank and methanolremoval in a distillation column and flash tank will be studied in detailed andcontrolled.
2.2 Biodiesel
Vegetable oil for engine gain its place as a result of the energy crises of the1970’s [1], but was already used as emergency fuel during World War II. Theinterest for vegetable oil as fuel has just increased since and is still increasing.Already in 1938 Walton recommended that glycerol should be removed from theoil, this is the practice in today’s biodiesel (esters) production. Ester formationis an important class of reactions for adding value to oil, and some of the typicalways for doing this today is given in equation 2.1-2.3 where R, R’, R” and R”’is an alkyl group [2].
Esterification
ROH +R′COOH → R′COOR+H2O (2.1)
Transesterification
RCOOR′ +R′′COOR′′′ → RCOOR′′′ +R′′COOR′ (2.2)
Acidolysis
RCOOR′ +R′′COOH → RCOOH +R′′COOR′ (2.3)
This study will only cover the transesterification.Several nations have long-term national goals in energy policy where the
increased use of biodiesel is included in the targets [2] . Due to a closed carboncycle biodiesel will have lower carbon emmision and will thereby not contributeto the global warming in the same extend as petrodiesel. Unfortunately theNOx emission from biodiesel is higher than conventional petrodiesel. Some ofthe sustainability issues related to the use of biodiesel are the required land use,water resources, air emissions and social impact related to the reduced foodsupply.
1
2.3 Industry
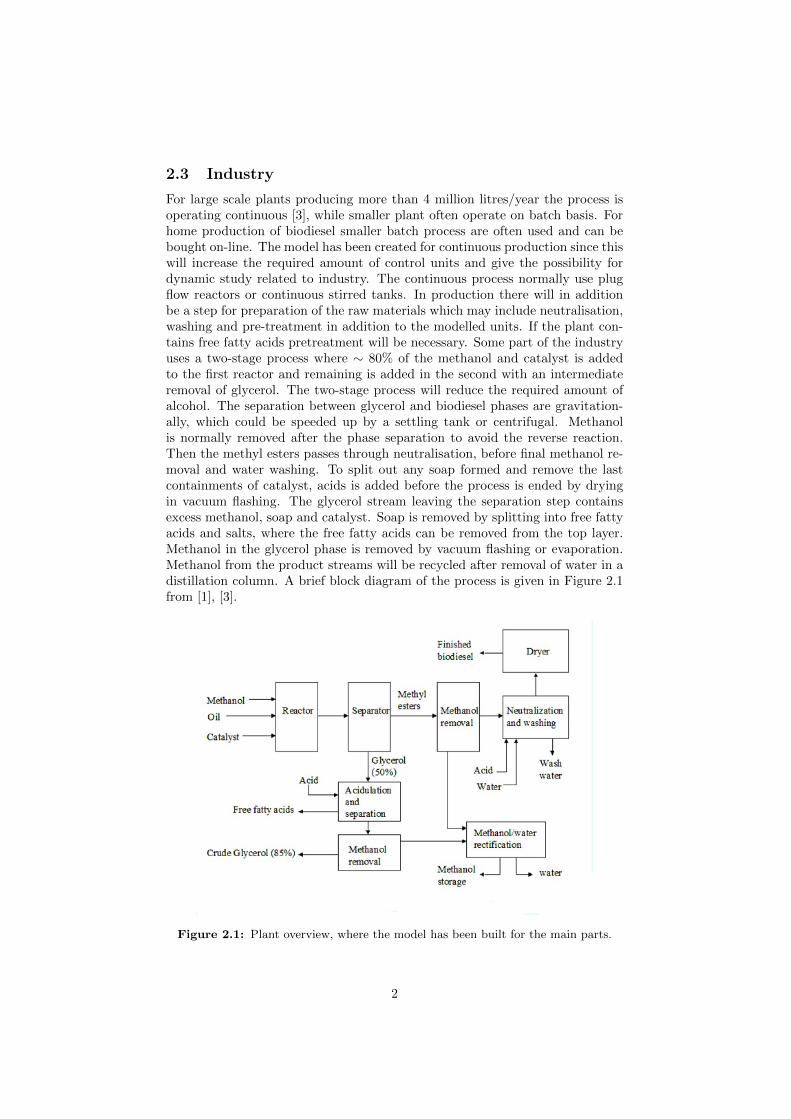
For large scale plants producing more than 4 million litres/year the process isoperating continuous [3], while smaller plant often operate on batch basis. Forhome production of biodiesel smaller batch process are often used and can bebought on-line. The model has been created for continuous production since thiswill increase the required amount of control units and give the possibility fordynamic study related to industry. The continuous process normally use plugflow reactors or continuous stirred tanks. In production there will in additionbe a step for preparation of the raw materials which may include neutralisation,washing and pre-treatment in addition to the modelled units. If the plant con-tains free fatty acids pretreatment will be necessary. Some part of the industryuses a two-stage process where ∼ 80% of the methanol and catalyst is addedto the first reactor and remaining is added in the second with an intermediateremoval of glycerol. The two-stage process will reduce the required amount ofalcohol. The separation between glycerol and biodiesel phases are gravitation-ally, which could be speeded up by a settling tank or centrifugal. Methanolis normally removed after the phase separation to avoid the reverse reaction.Then the methyl esters passes through neutralisation, before final methanol re-moval and water washing. To split out any soap formed and remove the lastcontainments of catalyst, acids is added before the process is ended by dryingin vacuum flashing. The glycerol stream leaving the separation step containsexcess methanol, soap and catalyst. Soap is removed by splitting into free fattyacids and salts, where the free fatty acids can be removed from the top layer.Methanol in the glycerol phase is removed by vacuum flashing or evaporation.Methanol from the product streams will be recycled after removal of water in adistillation column. A brief block diagram of the process is given in Figure 2.1from [1], [3].
Figure 2.1: Plant overview, where the model has been built for the main parts.
2
The separation block in Figure 2.1 is modelled by a settling tank and split,the methanol removal in methyl ester phase by a distillation column and methanolremoval in the glycerol phase by a flash tank.
2.4 Feedstock
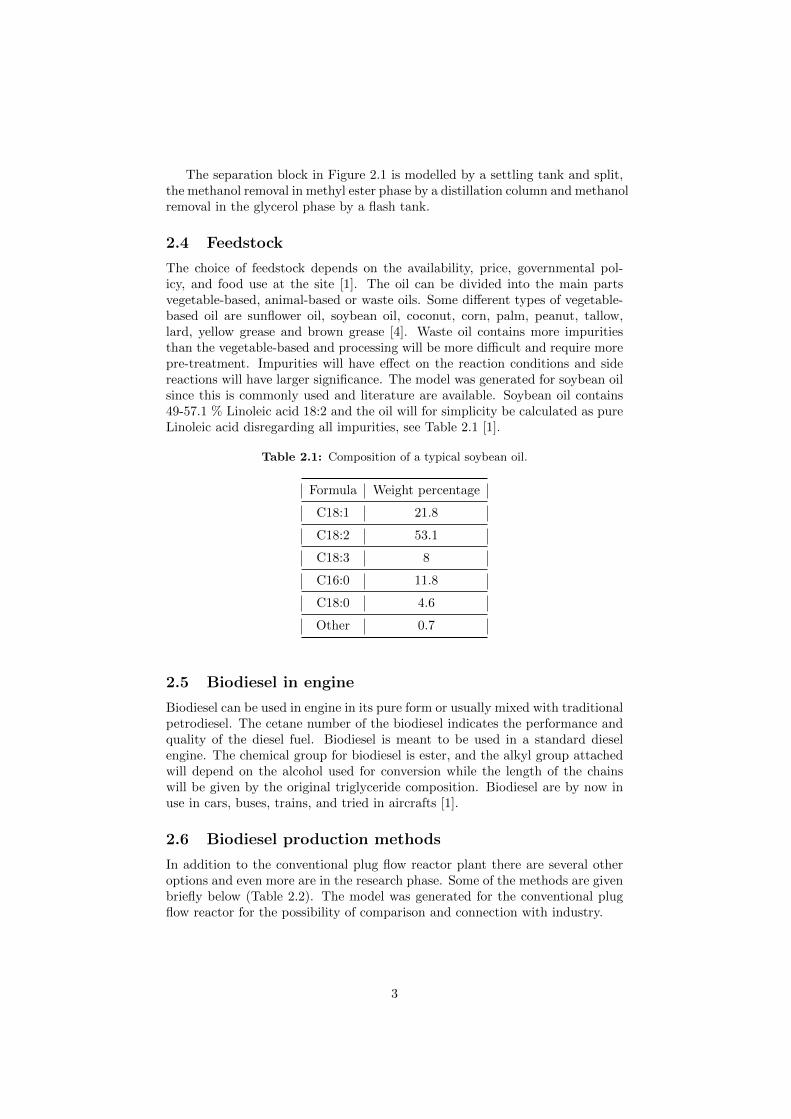
The choice of feedstock depends on the availability, price, governmental pol-icy, and food use at the site [1]. The oil can be divided into the main partsvegetable-based, animal-based or waste oils. Some different types of vegetable-based oil are sunflower oil, soybean oil, coconut, corn, palm, peanut, tallow,lard, yellow grease and brown grease [4]. Waste oil contains more impuritiesthan the vegetable-based and processing will be more difficult and require morepre-treatment. Impurities will have effect on the reaction conditions and sidereactions will have larger significance. The model was generated for soybean oilsince this is commonly used and literature are available. Soybean oil contains49-57.1 % Linoleic acid 18:2 and the oil will for simplicity be calculated as pureLinoleic acid disregarding all impurities, see Table 2.1 [1].
Table 2.1: Composition of a typical soybean oil.
Formula Weight percentage
C18:1 21.8
C18:2 53.1
C18:3 8
C16:0 11.8
C18:0 4.6
Other 0.7
2.5 Biodiesel in engine
Biodiesel can be used in engine in its pure form or usually mixed with traditionalpetrodiesel. The cetane number of the biodiesel indicates the performance andquality of the diesel fuel. Biodiesel is meant to be used in a standard dieselengine. The chemical group for biodiesel is ester, and the alkyl group attachedwill depend on the alcohol used for conversion while the length of the chainswill be given by the original triglyceride composition. Biodiesel are by now inuse in cars, buses, trains, and tried in aircrafts [1].
2.6 Biodiesel production methods
In addition to the conventional plug flow reactor plant there are several otheroptions and even more are in the research phase. Some of the methods are givenbriefly below (Table 2.2). The model was generated for the conventional plugflow reactor for the possibility of comparison and connection with industry.
3
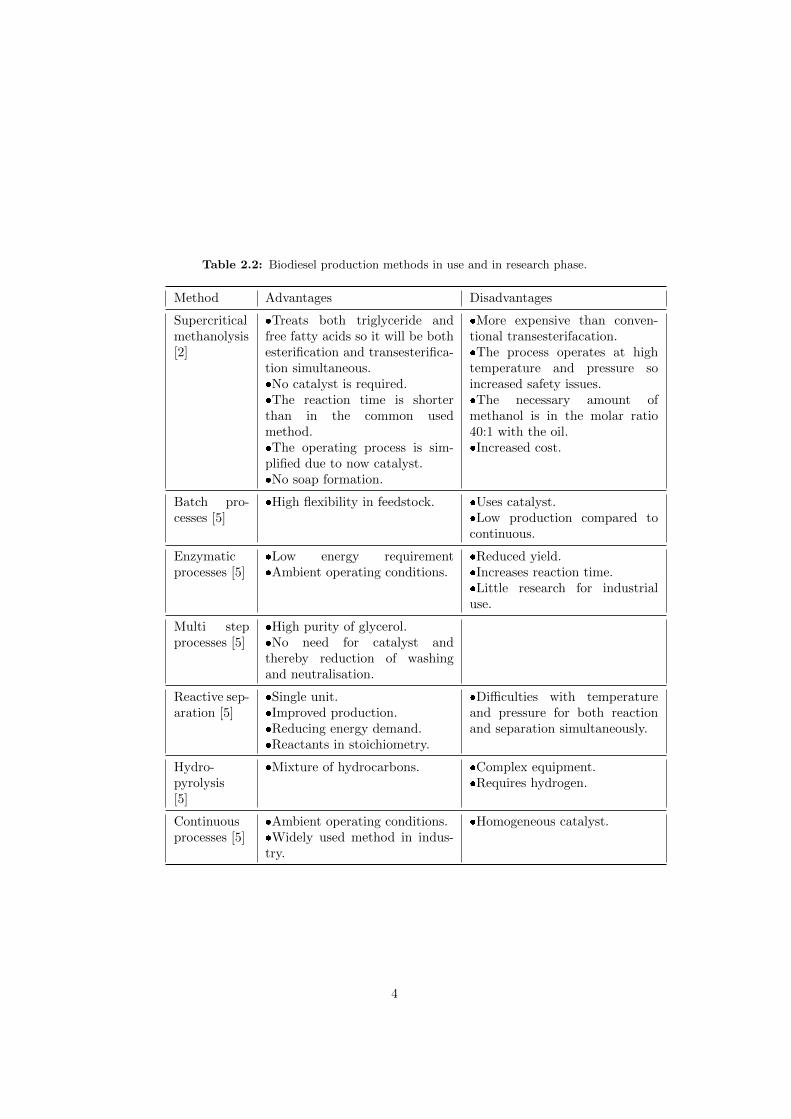
Table 2.2: Biodiesel production methods in use and in research phase.
Method Advantages Disadvantages
Supercriticalmethanolysis[2]
�Treats both triglyceride andfree fatty acids so it will be bothesterification and transesterifica-tion simultaneous.�No catalyst is required.�The reaction time is shorterthan in the common usedmethod.�The operating process is sim-plified due to now catalyst.�No soap formation.
�More expensive than conven-tional transesterifacation.�The process operates at hightemperature and pressure soincreased safety issues.�The necessary amount ofmethanol is in the molar ratio40:1 with the oil.�Increased cost.
Batch pro-cesses [5]
�High flexibility in feedstock. �Uses catalyst.�Low production compared tocontinuous.
Enzymaticprocesses [5]
�Low energy requirement�Ambient operating conditions.
�Reduced yield.�Increases reaction time.�Little research for industrialuse.
Multi stepprocesses [5]
�High purity of glycerol.�No need for catalyst andthereby reduction of washingand neutralisation.
Reactive sep-aration [5]
�Single unit.�Improved production.�Reducing energy demand.�Reactants in stoichiometry.
�Difficulties with temperatureand pressure for both reactionand separation simultaneously.
Hydro-pyrolysis[5]
�Mixture of hydrocarbons. �Complex equipment.�Requires hydrogen.
Continuousprocesses [5]
�Ambient operating conditions.�Widely used method in indus-try.
�Homogeneous catalyst.
4

3 Theory
The theory for the model has been divided into the main production sectionsnecessary for modelling each of the main sections i.e. reactor, settling tank,split and purification in flash and distillation column.
3.1 Reactor
For plants producing more than 4 million litres of biodiesel per year the pro-duction is normally continuous while smaller production units are batch [3].Conventionally the reactor has been plug flow reactor, but lately more researchhas been done on rotating, and oscillatory reactor for improved conversion andsize reduction [6]. For the simulation the reactor is modelled as continuous-stirred tank reactors in series.
3.1.1 Reactions
The most common used alcohol is methanol, which will result in methyl ester.Other alcohol used are ethanol, isopropanol and butanol, the choice betweenmethanol and ethanol are often related to price and availability on site. Onlythe main reactions given below has been accounted for in the model. The by-product of the transesterification process are glycerol which can be sold andtreated further. The hydrolysis and saponification are possible side reactionsneglected here, the extend of the side reactions depend on the quality of thefeedstock. Reaction 3.2 - 3.4 below are the first order reversible transesterifi-cation reactions for biodiesel production. The transesterification equations aregiven below, where equation 3.1 is the overall reaction [2],[7].
Triglyceride(TG)+3·Methanol(MeOH)↔ Glycerol(GL)+3·Methylester(ME)(3.1)
Triglyceride(TG)+Methanol(MeOH)⇔ Diglyceride(DG)+Methylester(ME)(3.2)
Diglyceride+Methanol(MeOH)⇔Monoglyceride(MG)+Methylester(ME)(3.3)
Monoglyceride(MG)+Methanol(MeOH)⇔ Glycerol(GL)+Methylester(ME)(3.4)
The rate of reaction is assumed to only be dependent of the temperature, butwill also depend on the catalyst concentration. Literature values for kinetics areoften given for a specific catalyst and catalyst amount, and the kinetics for anindustrial comparison should be based on the correlated kinetics. The conversionin the reactor is given by how many moles of component i is reacted comparedto number of moles of i in the feed [8].
5

3.1.2 Reactor design equations
All the reactor equations are based on the general balance given in equation 3.5.
In−Out+Generation = Accumulation (3.5)
3.1.3 Plug Flow Reactor
The general design equation on differential form for a plug flow reactor (PFR)in given in equation 3.6 [8].
dFidV
= ri (3.6)
Volume is given as in equation 3.7, so that dV in equation 3.6 can be replacedwith equation 3.8 when the cross sectional area is assumed given.
V = A · l (3.7)
dV = A · dl (3.8)
The molar flow F of component i can be expressed in concentrations as inequation (3.9) where A and v is assumed constant.
Fi = A · v · Ci (3.9)
Inserting equation 3.9 and equation 3.8 into the general equation for PFR 3.6equation 3.10 can be expressed:
dCidl
=riv
(3.10)
3.1.4 Continuous-Stirred Tank Reactor
The general equation for the continuous-stirred tank reactor (CSTR) in equation3.11 is based on the balance equation 3.5 [8].
dNidt
= (Fi,in − Fi,out) + V · ri (3.11)
The number of mole of component i can be expressed as equation 3.12.
Ni = xi ·N (3.12)
With a given residence time in each tank, the number of moles in the tank canbe expressed by the flow and residence time as given in equation 3.13.
N = F · t (3.13)
By combination of the three equations given above the changes in mole fractionof component i is given as 3.14.
dxidt
= ((xi,in − xi,out)/t) + V · ri (3.14)
The reaction rate ri can be expressed by the reaction constant and the concen-trations as given in equation 3.15.
ri = k · Cj · Ck (3.15)
6

transferred into mole fractions the equation becomes
ri = k · xj · xk ·F 2 · t2
V 2(3.16)
Inserting this in equation 3.14 the design equations for changes in mole fractionswill be given in equation 3.17:
dxidt
=xi,0 − xi
t+k · F · t · xi · xk
V(3.17)
From the general equation given above and reaction stoichiometry in equa-tion 3.2 - 3.4, the equations for the components are given below in equation 3.18- 3.23 [7]:
dxTGdt
=xTG,0 − xTG
t+F · tV· (−k1 · xTG · xMeOH + k2 · xDG · xME) (3.18)
dxDGdt
=xDG,0 − xDG
t+F · tV· (k1 · xTG · xMeOH − k2 · xDG · xME
−k3 · xDG · xMeOH + k4 · xMG · xME)(3.19)
dxMG
dt=xMG,0 − xMG
t+F · tV· (k3 · xDG · xMeOH − k4 · xMG · xME
−k5 · xMG · xMeOH + k6 · xGL · xME)(3.20)
dxME
dt=xME,0 − xME
t+F · tV· (k1 · xTG · xMeOH − k2 · xDG · xME
+k3 · xDG · xMeOH − k4 · xMG · xME
+k5 · xMG · xMeOH − k6 · xME · xGL)
(3.21)
dxGLdt
=xGL,0 − xGL
t+F · tV· (k5 · xMG · xMeOH − k6 · xME · xGL) (3.22)
dxMeOH
dt=xMeOH,0 − xMeOH
t+F · tV· (−k1 · xTG · xMeOH + k2 · xDG · xME
−k3 · xDG · xMeOH + k4 · xMG · xME
−k5 · xMG · xMeOH + k6 · xME · xGL)
(3.23)
Even though the industrial reactor will be a plug flow reactor it is modelledas CSTRs in series in this study to make it time dependent instead of lengthdependent. This will do the simulation in Simulink easier since Simulink isoperating on time basis. By modelling on time basis instead of length basis, thesame profiles will be created and the trends for the response to disturbances willbe the same. The number of CSTRs inserted in Simulink will be based on thereactors having the same volume. A better approach might be to have smallerreactors in the beginning where the composition is changing most quickly.
7

3.1.5 Temperature dependence
The kinetics of the reactions will be temperature dependent and the Arrheniusequation 3.24 is often used for the temperature dependence for the reactions[8]. For the most basic model k(T) was assumed constant, and the temperaturedependence could be introduced later. By inserting the temperature depen-dence the model will slow down due to increased stiffness of the problem. Thetemperature of the alcohol and the oil will often be different and it should beincluded a mixing device upstream of the reactor.
k(T ) = Aa · e−E/RT (3.24)
The values for Aa and the activation energy can be found in several articles [9]and [10] where data is used from [9]. The kinetics will in additon to temperaturedepend on the oil used, the composition of the oil, the alcohol used, the type ofcatalyst, concentration of catalyst and the quality of the catalyst. By findingliterature for other oils under different conditions it was checked that the datafound was within the expected range [11].
Table 3.1: Kinetic data for transesterification of soybean oil with NaOH catalyst.
Equation number Average reaction rate constant [l/mol ·min]
k1 0.049
k2 0.102
k3 0.218
k4 1.28
k5 0.239
k6 0.007
The catalysts normally used for transesterification include KOH, NaOH, andH2SO4 [4], [2].
8
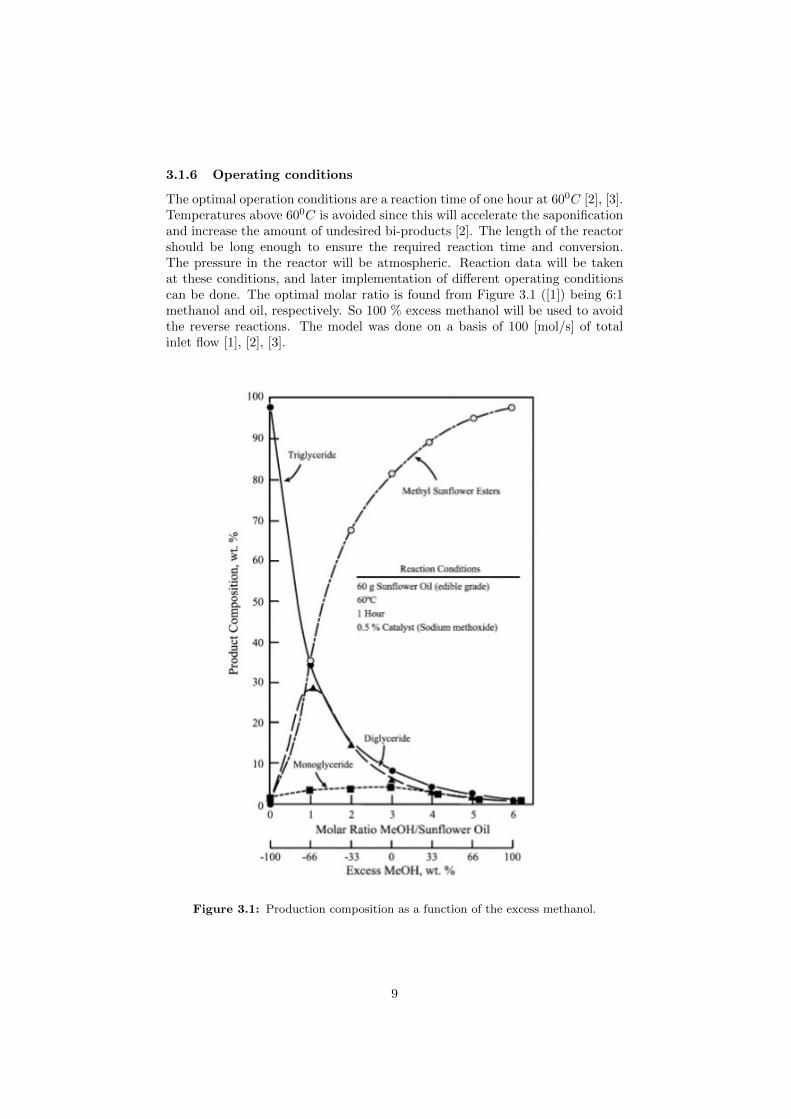
3.1.6 Operating conditions
The optimal operation conditions are a reaction time of one hour at 600C [2], [3].Temperatures above 600C is avoided since this will accelerate the saponificationand increase the amount of undesired bi-products [2]. The length of the reactorshould be long enough to ensure the required reaction time and conversion.The pressure in the reactor will be atmospheric. Reaction data will be takenat these conditions, and later implementation of different operating conditionscan be done. The optimal molar ratio is found from Figure 3.1 ([1]) being 6:1methanol and oil, respectively. So 100 % excess methanol will be used to avoidthe reverse reactions. The model was done on a basis of 100 [mol/s] of totalinlet flow [1], [2], [3].
Figure 3.1: Production composition as a function of the excess methanol.
9

3.2 Settling tank
The settling tank will have the task of separating the methyl ester from glycerol,but also to make sure the flow downstream are changing smoothly to avoid largedisturbances in sensitive equipment. The outlet is desired to be changing slowlywhile the inventory of the tank can change quickly. Assuming the bottom area isconstant only the height in the tank is changing due to flow changes. The molarholdup will change with the variation in inlet flow compared to the outlet flow.The total volume of the tank should have a safety margin in case of emergencyshut down, or problems downstream. The change in molar holdup is given byequations 3.25.
dM
dt= (Fin − Fout) (3.25)
The changes for the different components is given in equation 3.26
dxi ·Mdt
= (xi,in · Fin − xi,out · Fout) (3.26)
By having a settling tank significantly larger than the flow rate disturbances theflow composition will be smoothed out. When the hold up is significantly largerthan the flow, the molar hold up for the change in component can be assumedconstant. The less dense phase will be floating on top of the heavier phase andcan be drained off. Most off the impurities will follow the glycerol phase, butthe methanol will be distributed between the two phases.
3.3 Split
Excess methanol is usually not removed from the reaction until after the phaseseparation to avoid reverse transesterification reaction. Water might be addedto the reaction mixture to improve the separation [2]. The ternary diagramgiven below with the indicated nominal composition, Table 3.2, from the outletof the reactor [12] is used for finding the methanol distribution. The methylester in this case is methyl oleate and not methyl linoleate, this is due to lackof literature. The diagram for methyl oleate was used due to similar physicalproperties and same chain length [1].
Table 3.2: Nominal feed composition from the reactor, assumed ternary composition.
Component Mole fraction
Methyl ester 0.37
Glycerol 0.12
Methanol 0.51
From the diagram given in Figure 3.2 the composition in the two liquidphases can be found by the feed composition and the tie line. The tie line usedfor the nominal composition is indicated in Figure 3.2.
From Figure 3.2 the composition in the methyl ester and glycerol phase(Table 3.3), the flow in each phase and the split of methanol between the twophases can be found. The split of methanol is assumed to be constant eventhough this will not be the real case. Since temperature is assumed constant it
10

Figure 3.2: The ternary diagram for Methyl ester(oleate)(1), Methanol(2) and Glyc-erol(3).
Table 3.3: Nominal outlet composition from settling tank, assumed ternary compo-sition.
Component Mole fraction biodiesel phase Mole fraction glycerol phase
Methyl ester 0.64 0.01
Glycerol 0 0.72
Methanol 0.36 0.27
will be within range to assume constant methanol split. The level-arm rule [13]is used to find the amount of flow in each phase and can be derived as given inequation 3.27- 3.32.
The total balance over the splitting section is given in equation 3.27.
Lfattyphase + Lglycerolphase = Finflow (3.27)
The component balance for component i is given in equation 3.28.
Lfattyphase · xi,fattyphase + Lglycerolphase · xi,glycerolphase = Finflow · xi,inflow(3.28)
By combination of equation 3.28 and 3.27 the level-arm rule can be derived.
Lfattyphase · xi,fattyphase + Lglycerolphase · xi,glycerolphase= (Lfattyphase + Lglycerolphase) · xi,inflow
(3.29)
Lfattyphase(xi,fattyphase − xi,inflow) = Lglycerolphase(xi,inflow − xi,glycerolphase)(3.30)
LfattyphaseLglycerolphase
=(xi,inflow − xi,glycerolphase)(xi,fattyphase − xi,inflow)
(3.31)
11

The separation of the phases can be found from the level-arm rule in equatoin
3.32 as the distance between the inlet point and the outlet point.
LfattyphaseLglycerolphase
=LglycerolphaseFinflow
LfattyphaseFinflow(3.32)
Lfattyphase =(xi,inflow − xi,glycerolphase)(xi,fattyphase − xi,inflow)
Lglycerolphase (3.33)
From the nominal composition it can be found that 40% of the methanolfollows the biodiesel phase and the rest follows the glycerol phase. It is assumedthat most of the intermediates and triglyceride will stay in the glycerol phase,see Table 3.4.
Table 3.4: The fraction of the inlet flow leaving in the biodiesel phase.
Component %
Triglyceride 5
Diglyceride 5
Monoglyceride 5
Biodiesel 100
Glycerol 0
Methanol 40
3.4 Distillation
Distillation is based on difference in boiling temperatures, see Table 3.5 andthe methanol will leave as the distillate for both purifications processes. Theoperating temperature for the column must be between the boiling tempera-tures for the two components separated and can therefore be higher for glycerolpurification. Since the distillation is taking place at a higher temperature thanthe reaction this will be an energy consuming step in the production.
Table 3.5: Boiling temperatures.
Component Boiling temperature[C]
Methyl ester 168-170 [1]
Glycerol 288 [14]
Methanol 64.7 [15]
The number of stages for methanol and biodiesel separation in the modelhas been set to approximately 3, due to the high relative volatility of ∼ 70. Forthe distillation there will be assumed constant molar overflow, and equilibriumover the stages. For the total balance over the column equation 3.34 gives theconservation of mass and moles for the given system.
12

F = D +B (3.34)
And equations 3.35 gives the component balance over the whole column.
xi,F · F = yi,D ·D + xi,B ·B (3.35)
Fi = Di +Bi (3.36)
Over each stage, see figure 3.3, the flows leaving the stage will be in equilib-rium.
Figure 3.3: The total balance over stages in the distillation column.
And the balance over the feed stage (figure 3.4).
Figure 3.4: Balance over feed stage in distillation column.
The total balance equation over each stage will be given as in equation 3.37and the component balance will be given as in equation 3.38
Li+1 + Vi−1 = Li + Vi (3.37)
xi,i+1 · Li+1 + yi,i−1 · Vi−1 = xi · Li + yi · Vi (3.38)
With a molar hold up on the stages the liquid flow from the stage will also beaffected by the molar holdup compared to the nominal molar holdup equation3.39.
Li = Li,nominal +Mi −Mi,nominal
τholdup(3.39)
13

3.4.1 Vapour pressure
The saturation pressure of a component is given by Antoine equation 3.40[14]. The vapour pressure for glycerol and biodiesel will be marginally lowerthan methanol indicating that they will mainly stay in the liquid phase whilemethanol mainly will be in the vapour phase.
P sat = e(AA+BA/T+CA·ln(T )+DA(T )(EA)
(3.40)
3.4.2 Raoult’s law
Raoult’s law defines the vapour liquid phase equilibrium. Raoult’s law on idealform is given by equation 3.41 [13].
P =
n∑i=1
xiPSati (3.41)
If taken into consideration the non ideality, the activity coefficients will be in-troduced in equation 3.42. The activity coefficients can be found experimentally,and some articles [16] have studied the binary VLE (Vapour liquid equlibrium).
P =
n∑i=1
γixiPSati (3.42)
The fraction in the vapour phase will be given by Raoult’s law for component iin ideal mixture 3.43.
yi =xiP
Sati
P(3.43)
3.4.3 Relative volatility
Relative volatility is a measurement of phase separation of components, andindicates the distance from equilibrium line. The greater the distance the easierthe separation and less stages and energy will be required. For a binary systemthe relative volatility will be given by equation 3.44 [13], [17]. The two purifi-cation units will be approximately binary due to high conversion in the reactorand excess methanol leaving little triglyceride and intermediate in the productstreams for purification.
α =yi/xiyj/xj
(3.44)
For an ideal mixture and by Raoult’s law α will be given by the differencein saturation pressure of the two components in equation 3.45.
α = (Pi)sat/(Pj)
sat (3.45)
Dalton’s law says that the total pressure is the sum of the partial pressures:
P =
N∑i=1
Pi (3.46)
14
A rough estimate of the relative volatility can be given by equation 3.47 [18].
α = eβ(Tbj−Tbi)/Tb) (3.47)
Where β often can be taken as 13 in many cases and Tb is given below in equation3.48:
Tb =√TbjTbi (3.48)
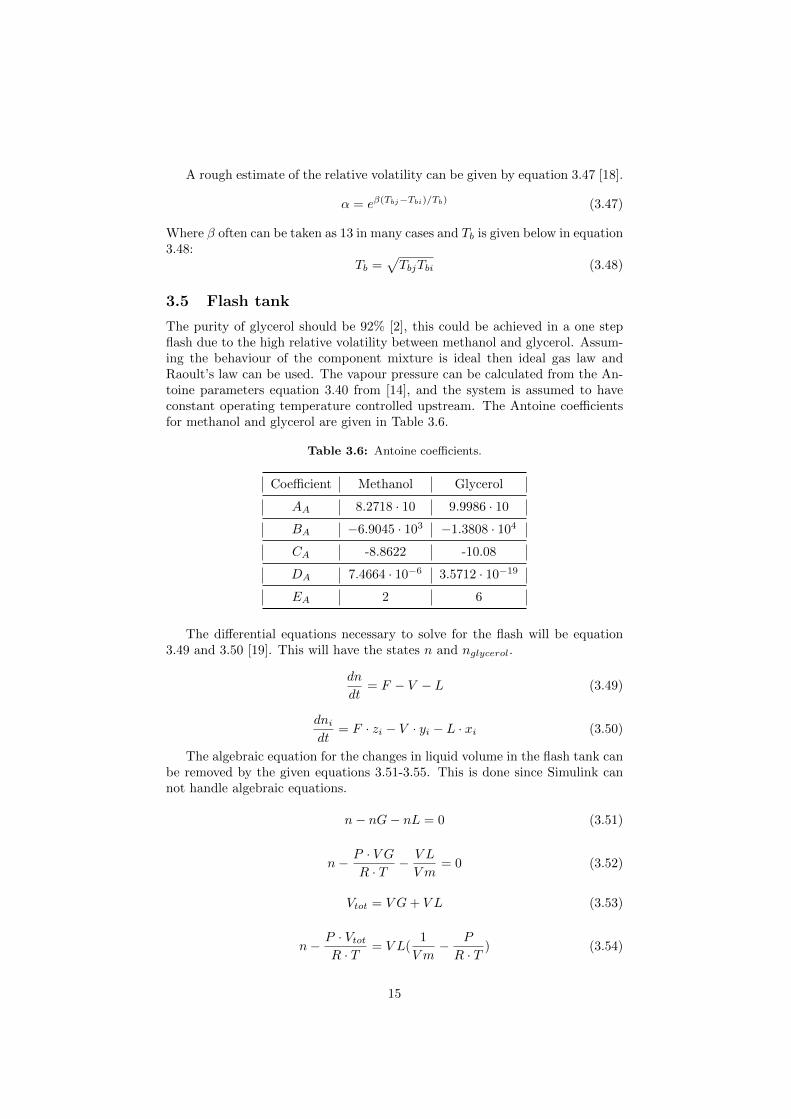
3.5 Flash tank
The purity of glycerol should be 92% [2], this could be achieved in a one stepflash due to the high relative volatility between methanol and glycerol. Assum-ing the behaviour of the component mixture is ideal then ideal gas law andRaoult’s law can be used. The vapour pressure can be calculated from the An-toine parameters equation 3.40 from [14], and the system is assumed to haveconstant operating temperature controlled upstream. The Antoine coefficientsfor methanol and glycerol are given in Table 3.6.
Table 3.6: Antoine coefficients.
Coefficient Methanol Glycerol
AA 8.2718 · 10 9.9986 · 10
BA −6.9045 · 103 −1.3808 · 104
CA -8.8622 -10.08
DA 7.4664 · 10−6 3.5712 · 10−19
EA 2 6
The differential equations necessary to solve for the flash will be equation3.49 and 3.50 [19]. This will have the states n and nglycerol.
dn
dt= F − V − L (3.49)
dnidt
= F · zi − V · yi − L · xi (3.50)
The algebraic equation for the changes in liquid volume in the flash tank canbe removed by the given equations 3.51-3.55. This is done since Simulink cannot handle algebraic equations.
n− nG− nL = 0 (3.51)
n− P · V GR · T
− V L
Vm= 0 (3.52)
Vtot = V G+ V L (3.53)
n− P · VtotR · T
= V L(1
V m− P
R · T) (3.54)
15

V L =n− P ·Vtot
R·T1Vm −
PR·T
(3.55)
3.5.1 Molar volume
Molar volume in liquid phase [m3/mol] indicates the liquid volume taken byone mole of a given component [14]. The molar volume will be used in the flashtank for removal of the algebraic equation, values given in Table 3.7.
Table 3.7: Molar volume [m3/mol] .
Methanol Glycerol
4.058 · 10−2 7.3202 · 10−2
3.6 Control
To achieve the necessary purity and responses for the system control structuresneed to be included.
3.6.1 Proportional controller
This is the simplest type of controller, and its operation can be described byequation 3.56 [20]. The advantage by a proportional controller is that KC isthe only tuning parameter. A proportional controller can often be used for levelcontroller.
m(t) = m+Kc · e(t) (3.56)
3.6.2 Proportional-Integral controller
This is the most common used controller [20], close to 85% of all controllers areof this type, equation 3.57.
m(t) = m+KC · e(t) +KC
τI
∫e(t)dt (3.57)
3.6.3 First order process
For a first order response the tuning parameters can be calculated from the thegiven equations 3.58, where k can be found by making a step change in theinput and observe the response in the output (Figure 3.5) [21].
k =∆y(∞)
∆u(3.58)
The SIMC rules for first order response is given in equation 3.59 and 3.60[21].
KC =1
k· τ1τC + θ
(3.59)
τI = min(τ1, 4(τC + θ)) (3.60)
When implementing PI controller in Simulink, P=Kc and I = Kc
τI.
16
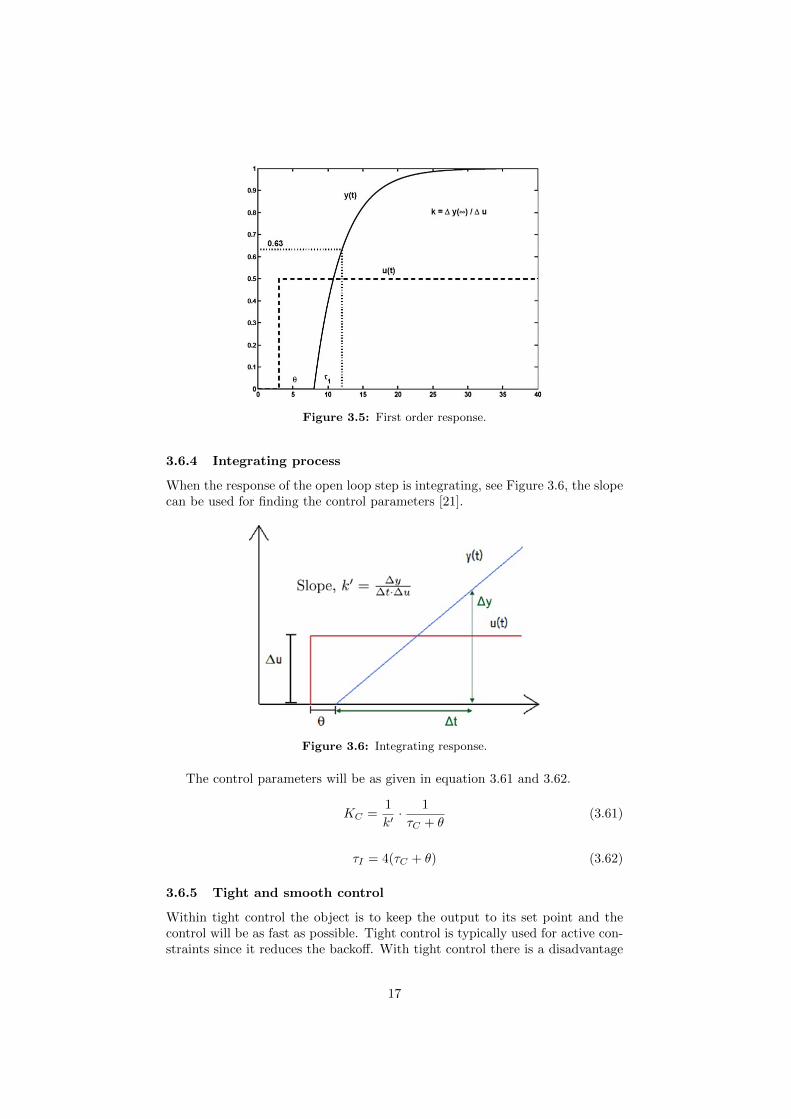
Figure 3.5: First order response.
3.6.4 Integrating process
When the response of the open loop step is integrating, see Figure 3.6, the slopecan be used for finding the control parameters [21].
Figure 3.6: Integrating response.
The control parameters will be as given in equation 3.61 and 3.62.
KC =1
k′· 1
τC + θ(3.61)
τI = 4(τC + θ) (3.62)
3.6.5 Tight and smooth control
Within tight control the object is to keep the output to its set point and thecontrol will be as fast as possible. Tight control is typically used for active con-straints since it reduces the backoff. With tight control there is a disadvantage
17

of input disturbances continue throughout the process. In smooth control wemake the controller slower, but we still want acceptable control of the system.Even if the control is smooth it should not reject disturbances.
3.6.6 Backoff
Backoff is the necessary change in setpoint for a variable to avoid it from gettingaway from operating conditions. Backoff is a safety margin to keep withinconstraints. Like avoiding the bottom composition from getting less pure thanbuyer requires at any time.
backoff =| constraint− setpoint | (3.63)
To reduce the backoff the squeeze and shift can be used to reduce the variance,by squeeze, and change the set point, shift.
18

4 Generation of model with Simulink
The Simulink model for the process contains three main part. The first level-2Matlab S-function block is the ten CSTRs in serie. Then the settling tank andsplit for assuring constant flow downstream and at the end the Column A ([22])and flash are included. The Simulink model with matlab script can be found inAppendix A being a CD with all separate units and the complete model. Due tomany operation units the matlab code is not included on paper, but collected onCD in Appendix A. Figure 4.1 shows what the units will look like in Simulink,this is the reactor block, and all units and the system model can be found inAppendix A.
Figure 4.1: Example of a Simulink unit will look like.
The different parts of the process were modelled separately and their be-haviour and response was checked for the single models. When the model isput together it slows down due to the complexity and the number of equationsnecessary to solve.
4.1 Solvers
By using different ordinary differential equation (ODE) solvers in Simulink thetime for solving the problem was reduced. The different units seems to havedifferent solver being the best fitted, but it was necessary for all to use a stiffsolver like ode15 or ode23s. The solver used should be efficient, stable andconvergent.
4.2 Reactor
The numbers of CSTRs necessary for modelling the PFR was first included asseparate boxes in Simulink. This was a less elegant way to do it since a changein the number of CSTRS would lead to the model itself being modified. Thiswas also a model which was solving very slowly. The solution to this problem
19
was to generate one unit with the states for all the CSTRS, see Appendix A”bioreactoronly” file.
4.3 Settling tank and split
The settling tank was first modelled as one unit including the split of the com-ponents and the buffer tank behaviour. It was found that when implementingthe flow controller for the outlet flow, it is better to have the settling tank andthe split in separate units, see Appendix A ”Settlingtanko” file . For imple-menting the flow controller, the outlet flow should be set as an input in the unitand the molar holdup will be one of the outputs. Related to the settling tank itwas a problem with the flow downstream the split being ”not a number” whenstarting the unit, this was solved by introduction of a transfer delay unit. Thesplit between the two phases is assumed constant, even though in reality thesplit will change as the inlet composition changes.
4.4 Distillation
When implementing the distillation column ” Column A” [22] into the biodieselmodel (see Appendix A ”colas PIBi” file), it was first converted into [mol/s]basis so that it is operating in connection with the rest of the units. Thedistillation unit solves the flows on each stage, three stages excluding condenserand reboiler. It is assumed that the inlet flow is at saturation, but this mightnot always be the case in reality and for verification towards industrial processthis might be necessary to change. For control units on the distillation column,the molar holdups in the reboiler and condenser will be used for the bottom anddistillate flow respectively. The composition in the flows will be controlled bythe reflux and the flow from the reboiler. For the distillation of methanol frombiodiesel the relative volatility was taken as 70, found from [16] when lookingat the two experiments with the low mole fraction of methanol in liquid. Thisvalues is higher than the one found from the approximate method, 34 [18], thisis probably due to non ideality of the mixture.
By a large relative volatility 34-70 the required number of stages will bethree equilibrium stages. It can be seen from Figure 4.2 that the number ofstages will not change for ideal or non-ideal system when the value of α is sohigh.
20

0 0.1 0.2 0.3 0.4 0.5 0.6 0.7 0.8 0.9 10
0.1
0.2
0.3
0.4
0.5
0.6
0.7
0.8
0.9
1
Molefraction x
Mo
lefr
acti
on
y
45 lineAlpha=35Alpha=70
Figure 4.2: 450 line and equilibrium lines for given α values from approximatemethod and literature.
4.4.1 Control of distillation column
The most important part of the distillation column is the purity in the bottomproduct/the biodiesel since this is the main product for sale. The top productdoes not necessary need to be that pure since the this will be recycled, andprocessed further, purity of glycerol 92 % [2]. So when tuning the controllers inSimulink, the bottom was tuned first.
4.5 Flash
The flash unit was modelled based on a flash model given in [19], and the inletis also here assumed saturated. When taken into Simulink (see Appendix A”Flashtank” file), all the moles of glycerol is assumed to be in the liquid phasedue to the low vapour pressure of glycerol compared to methanol. The totalnumber of moles in the tank and the number of moles of glycerol are given asthe states. It is now assumed that the vapour leaves the tank quickly and thetank content is mainly given by the liquid. The relative volatility of methanol inglycerol is taken as 2440 [1] and the flash unit will provide the required purity.
21

22

5 Case study of model
The model was checked by performing different cases, observing the responseand examining the results against the expected response. By doing this somemistakes in the codes were found and improved, and necessity of control struc-tures was highlighted when unexpected responses were discovered.
5.1 Reactor
Even though the temperature dependence of the reactor is disregarded severalstudies of the reactor is possible. For example what happens if the feed conditionchanges, how will this disturbance move through the reactor? The responsesshould be considered based on the kinetics and stoichiometry.
Case 1: Shows the steady state response of the last reactor.Case 2: Making a step change in the inlet flow rate without changing the
composition. When pushing more into the reactor, it is expect that the reactorrespond immediately by increasing the outlet flow if the reactor is full.
Case 3: Let the fraction of methanol in the inlet stream be zero and look atthe responses for the last reactor. The fraction of triglyceride should reach one.
Case 4: Looking at the response in composition through the reactor when themethanol is removed. By removing methanol, the reactions can be expected tostop leaving triglyceride unconverted. It will be expected that the last reactor,being at the end of the PFR respond later than the first.
Case 5: Removing methanol in the feed stream to less than required bystoichiometry. It is expected that some reactant and intermediate will be in theoutlet flow.
Case 6: What would happen if some of the intermediate products was in-cluded in the feed stream? As long as the amount of methanol is high enoughone would expect the amount of products to increase. How much the amountof product increases will be dependent one the intermediate. It can be expectthat the product will increase more by adding diglyceride than monoglyceridedue to reaction stoichiometry.
5.2 Settling tank and split
The settling tank for separation of the phases is often a centrifuge in industryfor separation of the two phases. In the model the settling tank will also havethe purpose as a buffer tank to smooth out the upstream disturbances for thedistillation downstream. The cases for the settling tank will be to check that itactually smooth out disturbances applied upstream.
Case 7: Changing the inlet flow into the settling tank by +10% withoutany other disturbances. From this disturbance it is desired that the outlet flowchanges towards the inlet flow over time. The flows in the different phases shouldchange by the same percentage as the inlet flow. The composition should stayconstant.
Case 8: Reducing the fraction of glycerol and increasing the fraction ofmethyl linoleate in the inlet flow. The total flow from the settling tank shouldbe constant, but the biodiesel phase flow should increase while the glycerol phaseflow decrease.
23

5.3 Distillation
For the purification units it was performed several different scenarios: 1) whathappens if the inlet feed conditions changes from units upstream 2) what hap-pens if the requirement to the product changes. Both this scenarios are possiblein the industry, as the supplier of oil might change their delivery or the cus-tomer might change their request. New product specification is required andthis could introduce new operational conditions for the biodiesel plant. It isalways desired that the existing unit can be used in its present form withoutthe necessity of reconstruction or retuning of controller units.
Case 9: Making a step change in the feed composition by increasing theamount of methanol in the feed. How will this effect the amount of outletstreams?
Case 10: Increase the flow into the distillation column by 10 %. How will thiseffect the reflux, the vapour etc. And can the controller keep the compositionat set point?
5.4 Flash
The flash will have some of the same possible industrial scenarios as the distilla-tion column, but since biodiesel is the main product the restrictions to glycerolpurity is not as strict.
Case 11: By changing the inlet flow without changing the composition itcould be expected that both flows will increase by the same percentage as theinlet.
Case 12: Increasing the fraction of methanol in the feed. By increasing theamount of methanol it is expected that the vapour flow out will increase whilethe glycerol phase flow decreases.
Case 13: Showing the nominal fractions of methanol in the different phases.This should be a significant difference indicating the large difference in relativevolatility.
5.5 Plant
Only one case has been done for the whole model due to the slow model, butsince all the units has been properly tested separately case 14 only verify whatwas found in case 1-13.
Case 14: Step change in the inlet flow to the system of +10% and checkingthe response of the plant.
24

6 Model validation
The model has been validated for all units given in Appendix A.
6.1 Tuning of system
The controllers will be tune for the nominal flows, and for operation with largedisturbances it could be necessary with re tuning.
6.1.1 Tuning of distillation column
Since the number of stages in the column is low, the interactions between thetwo composition controllers will be high. Due to this interactions the controllerfor the distillate product should be slower than the one for the bottom productso that the controllers are not working against each others actions. The distillateflow contain mainly methanol which will be recycled back to the reactor andas long as the methanol ratio is high enough in the reactor some glycerol ormethyl ester in this stream should not effect the plant much. Attention shouldbe applied to the recycle loop to avoid snowballing. If the distillate streamincreases to much, leading to increased inflow in the reactor this will reduced theresidence time in the reactor and can possibly reduced the over all conversion.
Tuning of holdup
P-controllers with gain of -10 was used for molar holdup in condenser and bot-tom. The controller gain was found from integrating process when disturbanceswas applied in holdup and response in distillate and bottom flow was observed.
Tuning of bottom composition
The main objective to tune for the biodiesel distillation column is the bottomproduct containing the biodiesel which will be sold. The biodiesel purity shouldbe 99.6% [2]. Since xB is of greatest importance of boilup, VB, will be tunedfirst. It is first done an open loop response by making a step change in VB of-10% and observe the response in xB . The step is done in the negative directiondecreasing VB since the bottom flow already is pure and future purification willrequire large amount of energy.
With the given step in VB the response in xB was as given in Figure 6.1.This is a first-order process with no time delay. Since the important part ofthe column to control is the bottom composition τC is taken to be 1/3 of τI toensure tight control.
25

20 30 40 50 60 70 800
0.01
0.02
0.03
0.04
0.05
0.06
0.07
0.08
0.09
0.1
Time [sec]
xb [−
]
xb
Figure 6.1: Response in bottom composition when step disturbance in VB was ap-plied.
Tuning parameters for the bottom composition with the given disturbanceand response is given in Table 6.1:
Table 6.1: Tuning parameters for bottom composition.
Parameter Value
∆y(∞) 0.057
∆u -2.3
τ1 0.57
θ 0
KC -116
τI 0.57
I -205
After the open loop tuning it can be observed that the bottom composi-tion moved towards the given setpoint of 0.004 mole fraction of methanol inthe methyl ester phase. When applying a step in the setpoint for the bottomcomposition the response in the bottom composition is plotted in Figure 6.2.
To make this happen it can be observed that the amount of VB shoulddecreases as more methanol is allowed in the bottom.
26

30 35 40 45 50 55 603.5
4
4.5
5x 10
−3
Time [sec]
xb m
etha
nol [
−]
xb
xb setpoint
Figure 6.2: Response in bottom composition when a change in the setpoint for thebottom composition was performed.
Tuning of distillate composition
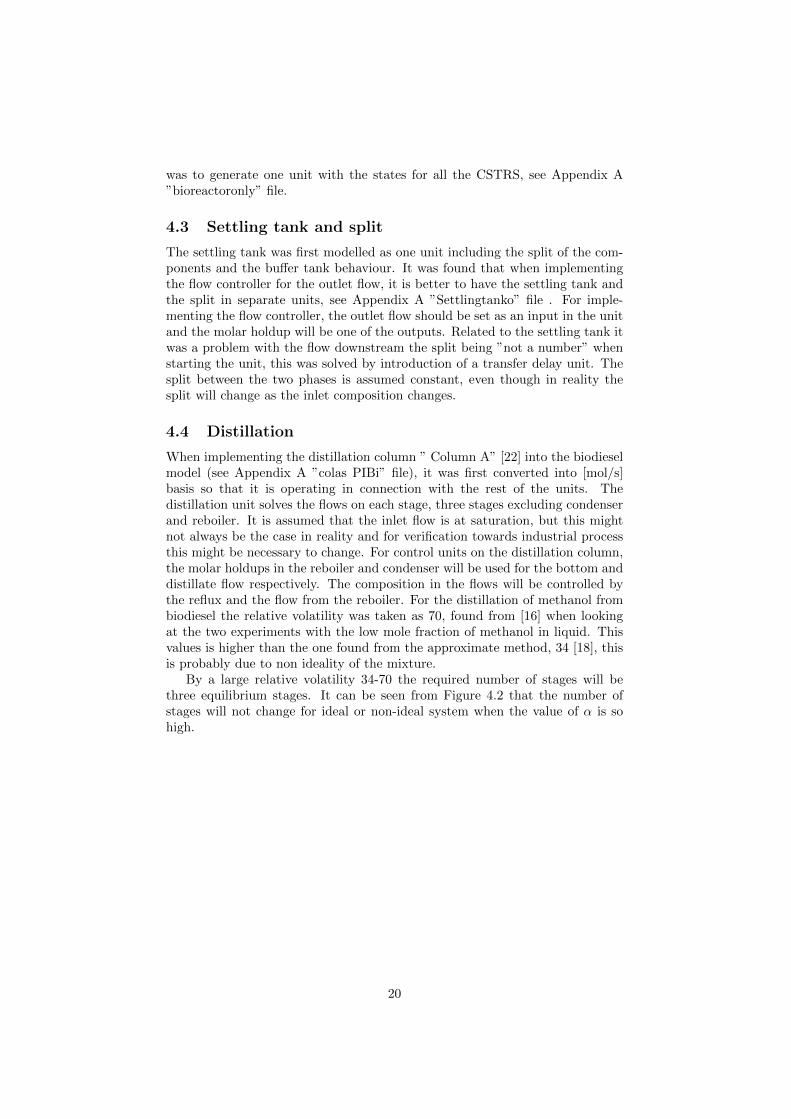
The distillate is not the important product in the production and do not needtight control. When making a step change in reflux, LT, of +10% the controllerfor the bottom composition will also effect the distillate composition, so thechanges for yd was only studied in the beginning. The response in yd to LT istaken as integrating (Figure 6.3).
Due to the low number of stages the interactions between the top and bot-tom controller are large. For this reason only the response at the beginning isconsidered since the bottom controller is already connected and will interact.The first response is integral response and the controller is tuned for this. Sincethe top composition are not of that great importance the controller is used as aP controller and tuned by making τC large, see Table 6.2.
Table 6.2: Tuning parameters for distillate composition.
Parameter Value
∆y 0.0001
∆u 0.25
∆t 0.38
θ 0
k′ 0.001
τC 200
KC 5
27
39.5 39.6 39.7 39.8 39.9 40 40.1 40.2 40.3 40.4 40.50.996
0.9961
0.9962
0.9963
0.9964
Time [sec]
yd [−
]
Figure 6.3: Response in distillate composition when step in reflux, LT, was applied.
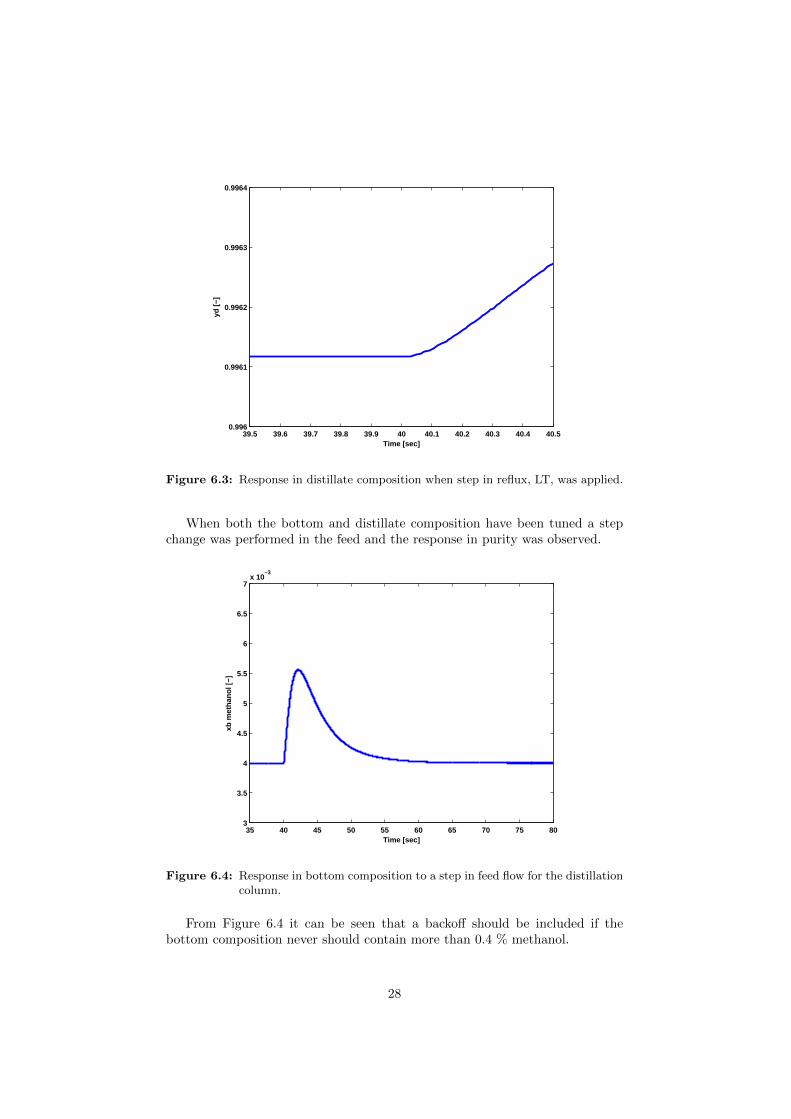
When both the bottom and distillate composition have been tuned a stepchange was performed in the feed and the response in purity was observed.
35 40 45 50 55 60 65 70 75 803
3.5
4
4.5
5
5.5
6
6.5
7x 10
−3
Time [sec]
xb m
etha
nol [
−]
Figure 6.4: Response in bottom composition to a step in feed flow for the distillationcolumn.
From Figure 6.4 it can be seen that a backoff should be included if thebottom composition never should contain more than 0.4 % methanol.
28

6.1.2 Smooth control of settling tank
For a settling tank where the output is the input to a distillation column whichis being sensitive for disturbances a tight control upstream will give bad per-formance in the column. By using smooth control on the settling tank we canassure more constant inflow conditions to the distillation column. The impor-tance of the settling tank is to have a large enough residence time to make surephase separation is good enough and smooth out disturbances. The response inthe holdup in the tank when making a disturbance in the inlet flow was inte-grating, and a P-controller with large τC was used to pair the holdup and outletflow giving a KC as -0.01.
29

6.2 Reactor
6.2.1 Plug Flow Reactor
For the PFR the concentration profiles will be as in Figure 6.5. The reactorwas originally taken as double the length but with the given flow rate, crosssectional area and kinetics of the reactor, the reactor was unnecessary long andhad a longer residence time than required for reaching steady state and desiredpurity. By reducing the length to half and thereby reducing the operating timeto half, see Figure 6.5 the steady state condition is reached at the end of thereactor (in the last reactor).
0 5 10 15 20 250
2
4
6
8
10
12
length [m]
Co
nce
ntr
atio
n C
i [m
ol/l
]
TGDGMGMEGLMeOH
Figure 6.5: PFR concentration profiles with the length of reactor reduced to half.
Reduction of reactor size and operating time will be highly economicallybeneficial.
30

6.2.2 Approximation of PFR by CSTRs
The number of CSTRs necessary to imitate the PFR was found and then im-plemented into the Simulink model. After all the reactors have been includedinto one Simulink block their response was tested. Since the reaction is quick inthe beginning it could be considered that instead of a given number of CSTRwith equal size it would be better to have smaller reactors in the beginning andbigger at the end [8].
By putting CSTRS in series the behaviour of the plug flow reactor can besimulated, illustration in Figure 6.6.
Figure 6.6: Illustration of CSTRs in serie.
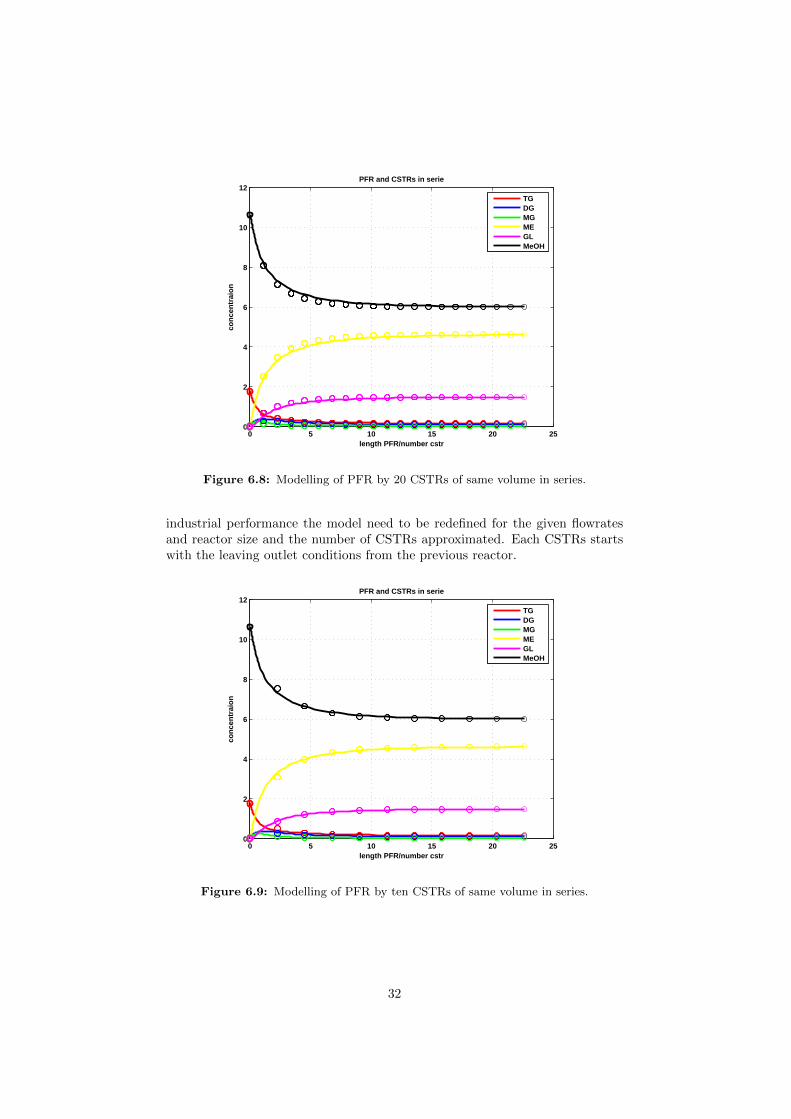
By running with different numbers of CSTRs, but constant residence timeand volume of the tanks the number of CSTRs to represent the PFR can befound. From Figure 6.7 it can be observed that approximation by two CSTRsare too few and 20 from Figure 6.8 can be seen to be more CSTRs than necessary.This was found for the total residence time when the length of the plug flowreactor was half of the original.
0 5 10 15 20 250
2
4
6
8
10
12
length PFR/number cstr
con
cen
trai
on
PFR and CSTRs in serie
TGDGMGMEGLMeOH
Figure 6.7: Modelling of PFR by two CSTRs of same volume in series.
The plug flow reactor ended up being approximated by ten tank reactors inseries (Figure 6.9) literature uses six reactors in series [23] and ten can be takenas a good rough estimate . If the model should be used for comparison with
31
0 5 10 15 20 250
2
4
6
8
10
12
length PFR/number cstr
con
cen
trai
on
PFR and CSTRs in serie
TGDGMGMEGLMeOH
Figure 6.8: Modelling of PFR by 20 CSTRs of same volume in series.
industrial performance the model need to be redefined for the given flowratesand reactor size and the number of CSTRs approximated. Each CSTRs startswith the leaving outlet conditions from the previous reactor.
0 5 10 15 20 250
2
4
6
8
10
12
length PFR/number cstr
con
cen
trai
on
PFR and CSTRs in serie
TGDGMGMEGLMeOH
Figure 6.9: Modelling of PFR by ten CSTRs of same volume in series.
32
6.2.3 Result of case study of reactor
The case study on the reactor was performed to check that the behaviour of thereactor was as expected.
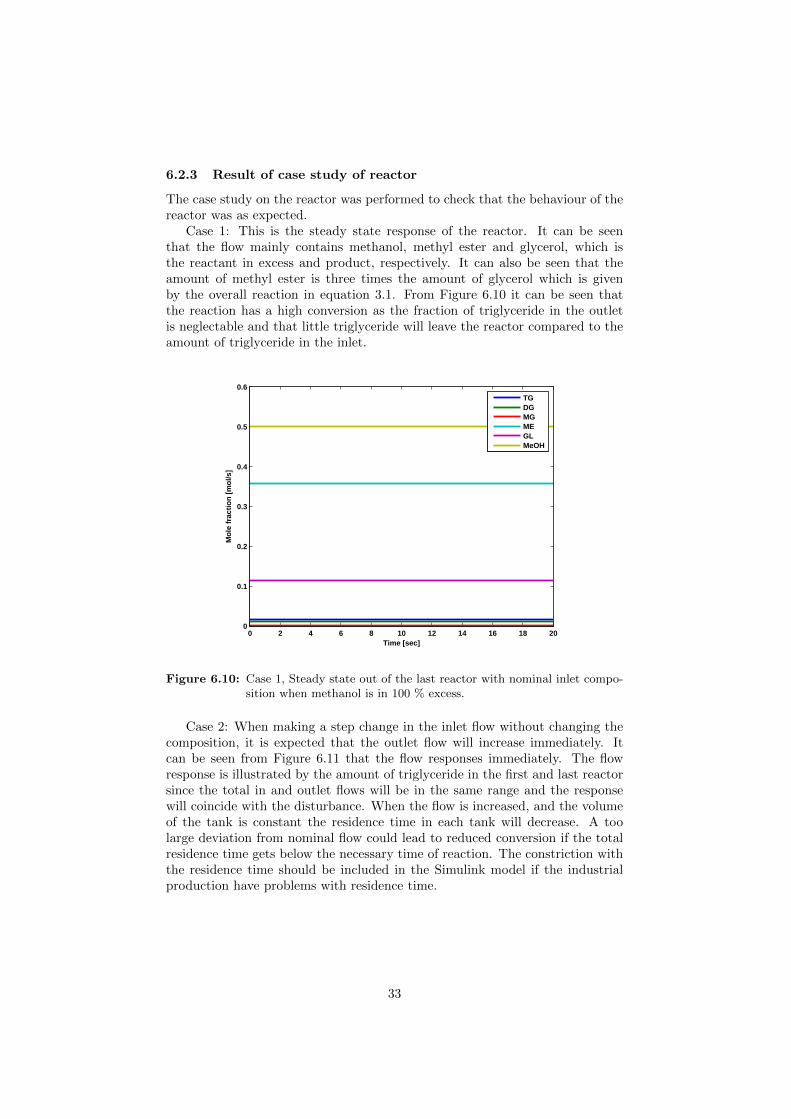
Case 1: This is the steady state response of the reactor. It can be seenthat the flow mainly contains methanol, methyl ester and glycerol, which isthe reactant in excess and product, respectively. It can also be seen that theamount of methyl ester is three times the amount of glycerol which is givenby the overall reaction in equation 3.1. From Figure 6.10 it can be seen thatthe reaction has a high conversion as the fraction of triglyceride in the outletis neglectable and that little triglyceride will leave the reactor compared to theamount of triglyceride in the inlet.
0 2 4 6 8 10 12 14 16 18 200
0.1
0.2
0.3
0.4
0.5
0.6
Time [sec]
Mo
le f
ract
ion
[m
ol/s
]
TGDGMGMEGLMeOH
Figure 6.10: Case 1, Steady state out of the last reactor with nominal inlet compo-sition when methanol is in 100 % excess.
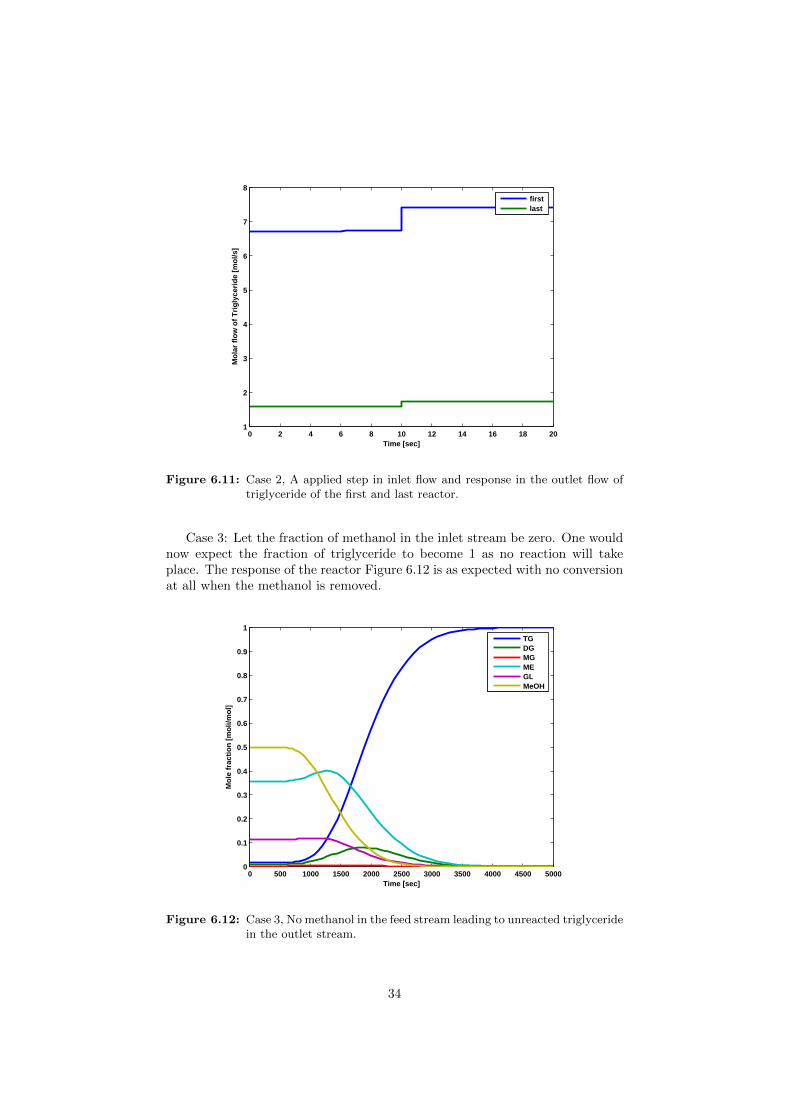
Case 2: When making a step change in the inlet flow without changing thecomposition, it is expected that the outlet flow will increase immediately. Itcan be seen from Figure 6.11 that the flow responses immediately. The flowresponse is illustrated by the amount of triglyceride in the first and last reactorsince the total in and outlet flows will be in the same range and the responsewill coincide with the disturbance. When the flow is increased, and the volumeof the tank is constant the residence time in each tank will decrease. A toolarge deviation from nominal flow could lead to reduced conversion if the totalresidence time gets below the necessary time of reaction. The constriction withthe residence time should be included in the Simulink model if the industrialproduction have problems with residence time.
33
0 2 4 6 8 10 12 14 16 18 201
2
3
4
5
6
7
8
Time [sec]
Mo
lar
flo
w o
f T
rig
lyce
rid
e [m
ol/s
]
firstlast
Figure 6.11: Case 2, A applied step in inlet flow and response in the outlet flow oftriglyceride of the first and last reactor.
Case 3: Let the fraction of methanol in the inlet stream be zero. One wouldnow expect the fraction of triglyceride to become 1 as no reaction will takeplace. The response of the reactor Figure 6.12 is as expected with no conversionat all when the methanol is removed.
0 500 1000 1500 2000 2500 3000 3500 4000 4500 50000
0.1
0.2
0.3
0.4
0.5
0.6
0.7
0.8
0.9
1
Time [sec]
Mo
le f
ract
ion
[m
oli/
mo
l]
TGDGMGMEGLMeOH
Figure 6.12: Case 3, No methanol in the feed stream leading to unreacted triglyceridein the outlet stream.
34

Case 4: Looking at the response in composition through the reactor whenthe methanol is removed in the inlet. From Figure 6.13 it can be seen thatthe first reactor change first and most rapidly, while the later reactors changesmore smoothly and later in time. The smoothing is due to the fact that adisturbance in the inlet flow will be ”diluted” in the previous reactor before itflows downstream to the next reactor. The time delay is related to the fluidmotion assumption of complete mixing in each tank.
0 500 1000 1500 2000 2500 3000 35000
0.1
0.2
0.3
0.4
0.5
0.6
0.7
0.8
0.9
1
Time [sec]
Fra
ctio
n tr
igly
cerid
e [−
]
Figure 6.13: Case 4, No methanol in the inlet flow. The figure shows the changesfor the first to the last reactor. The first reactor is to the left while thelast reactor is to the right.
Case 5: Less methanol into the reactor than required by stoichiometry. Itcan be seen that by removal of methanol the reactions will not take place inthe desired extend and it will end up with mainly triglyceride flowing throughthe reactors. It can be seen that the amount of diglyceride increases as theintermediate are not reacted further. Methanol will now be the limiting reactantfor the reactions. The amount of products will now be given by the amount ofmethanol in the feed, and it can be seen that no glyceride will be produced.From Figure 6.14 it looks like only the first reaction is taking place since theamount of methyl ester is approximately 1/3 of the original.
35
0 500 1000 1500 2000 2500 3000 3500 4000 4500 50000
0.1
0.2
0.3
0.4
0.5
0.6
0.7
0.8
0.9
Time [sec]
Mo
le f
ract
ion
[m
oli/
mo
l]
TGDGMGMEGLMeOH
Figure 6.14: Case 5, Less methanol than required by stoichiometry in the reactorand the responding changes in the outlet flow composition.
Case 6: Some of the intermediate monoglyceride has been added to feedcomposition. From Figure 6.15 it can be observed that by adding MG theamount of methanol decreases while the flow of the products and intermediatesincrease. If DG was added instead of MG the amount of products increasedmore as expected by stoichiometry.
0 500 1000 1500 2000 2500 3000 3500 4000 4500 50000
10
20
30
40
50
60
Time [sec]
Mo
le f
low
[m
ol/s
]
TGDGMGMEGLMeOH
Figure 6.15: Case 6, Changes in outlet composition when some of the intermediateis added in the feed.
36

The cases given above indicate that the reactor response is as expected.
6.3 Settling tank
The case study for the settling tank was used to check that the flow wassmoothed out and that the flows of the different phases were changing by dis-turbances in the inlet.
6.3.1 Result of case study of settling tank
From case 7 and 8 where a large τC has been introduced to make sure thecontroller is operating smoothly it looks like the settling tank is working withits purpose.
Case 7: Changing the inlet flow by + 10% to the settling tank withoutany other changes it can be seen in Figure 6.16 that the total outlet flow goestowards the new inlet flow, but over significantly larger time. This is the desiredresponse to avoid disturbances in sensitive downstream equipment.
900 1000 1100 1200 1300 1400 150088
90
92
94
96
98
100
102
Time [sec]
Mo
lar
ou
tlet
flo
w [
mo
l/s]
Outlet flow
Inlet flow
Figure 6.16: Case 7, Response in the total outlet flow from settling tank when adisturbance in the inlet flow was introduced.
From Figure 6.17 it can be seen that the flow of both phases changes withthe same percentage as the disturbance in the inlet flow. This is expected asthe composition is the same as before and only the amount changes.
37

900 1000 1100 1200 1300 1400 150030
35
40
45
50
55
60
Time [sec]
Mo
lar
flo
w [
mo
l/s]
Bio phase flowGlycerol phase flow
Figure 6.17: Case 7, Response in the flow of the different phases from settling tankwhen a disturbance in inlet flow occurred.
Case 8: The fraction of glycerol was reduced and the fraction of methyllinoleate was increased in the inlet flow. It can be seen from Figure 6.18 thatthe biodiesel phase increases while the glycerol phase decreases. It can also beobserved that the changes happens very smoothly so that disturbances down-stream will be small. The response is as predicted since the disturbance will be”diluted” in the settling tank.
From Figure 6.19 it can be seen that the total outlet composition beforesplitting into phases changes slowly as the volume of the tank is significantlylarger than the inlet flow. This shows how the composition in the tank changeswith disturbances in the inlet composition. This is what could be expectedwhen the tank is perfect mixing.
38

1000 1500 2000 2500 3000 3500 4000 4500 500035
40
45
50
55
60
Time [sec]
Mo
lar
flo
w [
mo
l/s]
Biodiesel phase flow
Glycerol phase flow
Figure 6.18: Case 8, The changes in flow of the different phases with a change ininlet composition.
1000 1500 2000 2500 3000 3500 4000 4500 50000
0.1
0.2
0.3
0.4
0.5
0.6
Time [sec]
Mol
ar fr
actio
n [−
]
TG
DG
MG
ME
GL
MeOH
Figure 6.19: Case 8, The variation in outlet tank composition with a change in inletcomposition.
39

6.4 Distillation
The distillation column is for purification of biodiesel phase.
6.4.1 Result of case study of distillation column
Case 9: Step change in the feed composition into the distillation column forpurification of biodiesel, by increased amount of methanol.
When the fraction of methanol into the column increases and the bottomcomposition is tightly controlled to its setpoint the fraction of methanol in thevapour phase increases. From Figure 6.20 it can be seen that the controller forthe bottom composition leads the composition back to the given setpoint. Itcould also be said that if the purity of biodiesel never should get below 99.6 % abackoff should be included and the setpoint in the model should be reduced bythe shift rule. Biodiesel will not be sold directly as it is produced, but probablystored in tanks before shipped. Since disturbances in flow composition canfluctuate in both directions the setpoint probably do not need to be set as lowas 0.002 from the peak in Figure 6.20 as the disturbances will cancel each otherout when biodiesel is stored.
35 40 45 50 55 60 65 70 75 803
3.5
4
4.5
5
5.5
6
6.5
7x 10
−3
Time [sec]
xb m
etha
nol [
−]
Figure 6.20: Case 9, Response in bottom composition when a step change was ap-plied in the feed composition.
When the fraction of methanol in the inlet flow increases it can be expectedthat the vapour flow increases while the liquid decreases when the relativevolatility is constant (Figure 6.21).
40
35 40 45 50 55 60 65 70 75 800
10
20
30
40
50
60
Time [sec]
Mo
lar
flo
w [
mo
l/s]
Feed flow
Distillate flow
Bottom flow
Figure 6.21: Case 9, Response in flows for distillation column when a step changewas applied in the feed composition.
Case 10: Step change in the feed flow rate by +10%.The response in distillate and bottom flow (Figure 6.22) shows that the total
balance is fulfilled after the disturbance.
35 40 45 50 55 60 65 70 75 8010
20
30
40
50
60
70
Time [sec]
Mo
lar
flo
w [
mo
l/s]
Inlet flow
Distilate flow
Bottom flow
Figure 6.22: Case 10, Response in distillate and bottom flow in distillation columnwith a step in inlet flow.
When the flow in the column increases the required energy to get the required
41

purity will increase as more methanol should be distillate off (Figure 6.23). Thereflux will also increase to ensure the column performance.
35 40 45 50 55 60 65 70 75 8020
20.5
21
21.5
22
22.5
23
23.5
24
24.5
25
Time [sec]
VB
[m
ol/s
]
Figure 6.23: Case 10, Increased demand of boilup(VB), with increased inlet flow.
It is desired that the tight controller for the bottom composition always con-trols the expensive product at is specifications. The controller for the bottomcomposition leads the fraction in the bottom back to the set point after distur-bance in the feed, see Figure 6.24. This is consistent with the desired responsesince biodiesel is the expensive product.
42

35 40 45 50 55 60 65 70 75 803
3.5
4
4.5
5
5.5
6
6.5
7x 10
−3
Time [sec]
xb m
etha
nol [
−]
Figure 6.24: Case 10, Response in bottom composition when an increased inlet flowstep was applied to the distillation column.
43

6.5 Flash tank
The flash tank is for purification of glycerol by removal of methanol.
6.5.1 Result of case study of flash tank
Case 11: Changing the inlet flow without changing the composition it couldbe expected that both flow will increase by the same percentage. The peaksin Figure 6.25 could be related to pressure build up before it get corrected forby the controllers. The opposite response was observed with reduced inlet flowsince the pressure is reduced before the control units reduces the outlet streamso the inventory builds up again.
400 500 600 700 800 900 10000
10
20
30
40
50
60
Time [sec]
Mo
lar
flo
w [
mo
l/s]
Feed
Vapour
Liquid
Figure 6.25: Case 11, The flow response in the flash tank due to increased inlet flow.
Case 12: Increasing the fraction of methanol in the inlet, it will be expectedthat the vapour flow increases while the bottom flow decreases (Figure 6.26).Due to the high relative volatility between the two components the vapour flowwill mainly be the methanol entering the tank, and an increase in methanolfraction in will result in increased vapour flow. If the fraction of glycerol to theflash increases the opposite response was observed with an increased liquid flowand decreased vapour flow.
44

400 500 600 700 800 900 10000
10
20
30
40
50
60
Time [sec]
Mo
lar
flo
w [
mo
l/s]
Feed
Vapour
Liquid
Figure 6.26: Case 12, Response in vapour and liquid flow due to increased fractionof methanol in inlet flow to flash tank.
Case 13: Mole fraction of methanol in the different phases at nominal op-eration. It can be seen in Figure 6.27 that the top product mainly containsmethanol, while the bottom product contains glycerol in a purity above therequired 92 % [1]. This high purification in the flash is due to the high relativevolatility between the components and explains the behaviour observed in thetwo previous cases.
45

0 100 200 300 400 500 600 700 800 900 10000
0.1
0.2
0.3
0.4
0.5
0.6
0.7
0.8
0.9
1
Time [sec]
Mol
e fr
actio
n m
etha
nol [
−]
Feed fraction
Vapour fraction
Bottom fraction
Figure 6.27: Case 13, Nominal fraction of methanol in flash tank streams.
6.6 System response to increased feed flow
By applying a step change to the inlet flow the responses out from the plantwas as expected with an even percentage increase in all flows (Figure 6.28). Thesettling tank smooth out the disturbances downstream, but the total balance ofthe system is satisfied. It was also observed that the composition in the differentflows was constant indicating correct performance of the model.
100 200 300 400 500 600 700 800 900 10000
20
40
60
80
100
120
Time [sec]
Mo
lar
flo
w [
mo
l/s]
Inlet flow
Total amount of vapour out
Total amount of liquid out
Total flow out
Figure 6.28: Overview response in the system with a step in the feed flow.
46

When the reaction conditions is nominal with an excess of methanol of 100 %the composition from the reactor is ∼50 % methanol and the rest is triglyceride,diglyceride, monoglyceride, methyl ester and glycerol. The given compositioncontains approximately ∼50 % light component and ∼50 % heavy componentand as observed it is expected that the total vapour and liquid flows are ap-proximately the same.
It was only performed a disturbance case for the amount of feed flow andnone for composition disturbance due to slow model.
47

48

7 Discussion
From the case studies in front the model seems to operate as expected, butthere is still room for improvements in tuning, better parameter fit, and morevariable dependence like temperature, catalyst quality etc. The case studies aredone for fictive disturbances and a better validation would be to know the rangeof an industry plant operating condition, tune and then perform disturbancesexpected in industry. If the model then respond as observed in the field, it canbe used to predict the response of new disturbances. If the cases are unrealisticthe reliability of the model can be less than first predicted. The model is verysimplified and will therefore never represent a plant in detail, but it can reflectthe main transfer of disturbance through the units. If disturbances to sensitiveequipment are significantly larger or quicker than applied in model validation,the conditions might fall outside the operation range of the model.
Some of the values are taken from different articles or calculated from ar-ticles, and ideally all data should have been taken from one consistent sourcein industry to have the desired reliability. If all data are from the same sourceeventually impurities will be the same in all measurements and predicted val-ues. The literature values given in different articles are over a wider range thandesired and all data should be evaluated more extensively before the model isapplied in industry.
The weakest units at the moment are the purification units. The flash tankand the distillation column should operate at nominal values and new steadystates should be implemented before they are investigated more extensivelyto get desired model reliability. The control on the flash unit has not beentuned and checked in the desired extend for application on industrial cases. Byincluding industrial nominal flash and resizing, the model could have practicaluse for checking responses.
The pairing for the control of the distillation column is taken as the mostcommon configuration with LV. In reality another configuration might be thebest suited and all the possible configurations should be checked. A betterconfiguration might be to use a constant ratio between the boilup and feed flowfor bottom composition control. A useful result of the model could then be totest new control structures, before applied on site.
Methanol from the two purification units will be a recycle stream and themodel could be completed by including recycling. By including the recycle loop,the danger for snowballing can also be simulated.
At the moment the model script for all units together is slow and an improve-ment in solution time will be necessary to get the desired practical application.The long solution time is the reason for only one case study on feed flow for thesystem as one unit. With a quicker model more complex disturbances can be ap-plied and the responses checked. In industry a disturbance seldom occur aloneso the model should be able to handle complex disturbances with reasonablesolving time.
49

50
8 Conclusion
The model including continuous-stirred reactor tanks in series, settling tankwith phase separation, and purification of products by methanol removal hasbeen created. A model for each units have been created separately for quickdisturbance response check. The system model is slow and difficulties withcase studies here are related to long computational time. The model is a verysimplified version of a real plant and will only cover main aspects of disturbanceresponse.
When disturbances are applied to the system, the model with its simplifica-tions seems to react as expected (Figure 6.28). The very simplified model can beused for rough observation of system response to disturbances. The simplifiedmodel will further be used in connection with industry for plant response andcontrol purposes. For connection to industry the model must be sized for thegiven flow, with the given equipment volumes.
Further work should focus on reducing model solution time and introducemore system affecting variables like temperature, catalyst, without making themodel too complex. All units should in addition be made sure they are atsteady state from the beginning by finding the optimal flow values for reflux,boilup, and outlet flows for setpoints. Literature values used in industry shouldbe found and introduced for better validation and increased practical use of themodel.
51

52

References
[1] G. Knoth, J. Krahl, and J. V. Gerpen, eds., The Biodiesel Handbook. AOCSpress, 2nd ed., 2009.
[2] Bart, Palmeri, and Cavallero, Biodiesel science and technology From soilto oil. Woodhead, 2010.
[3] J. V. Gerpen, “Biodiesel processing and production,” Fuel processing tech-nology, no. 86, pp. 1097–1107, 2005.
[4] C. M. Drapcho, N. P. Nhuan, and T. H. Walker, Biofuels engineering pro-cess technology. McGraw Hill, 2008.
[5] A. A. Kiss and C. S. Bildea, “A review of biodiesel production by integratedreactive separation technologies,” Wiley online library, 2012.
[6] A. P. Harvey, M. R. Mackley, and T. Seliger, “Process intensification ofbiodiesel production using a continuous oscillatory flow reactor,” Journalof chemical technology and biotechnology, 2003.
[7] T. Issariyakul and A. K. Dalai, “Comparative kinetics of transesterificationfor biodiesel production from palm oil and mustard oil,” The canadianjournal of chemical engineering, vol. 90, 2012.
[8] H. S. Fogler, Elements of chemical reaction engineering. Prentice-Hall nowknown as Pearson Education Inc, fourth ed., 2006.
[9] H. Noureddini and D. Zhu, “Kinetics of transesterification of soybean oil,”Journal of the American Oil Chemists’ Society, 1997.
[10] K. Kapilakarn and A. Peugtong, “A comparison of costs of biodiesel pro-duction from transesterification,” International energy journal, 2007.
[11] T. Issariyakul and A. K. Dalai, “Comparative kinetics of transesterificationfor biodiesel production from palm oil and mustard oil,” The canadianjournal of chemical engineering, 2012.
[12] A. E. Andretta, L. M. Casas, P. Hegel, S. B. Bottini, and E. A. Brig-nole, “Phase equilibria in ternary mixtures of methyl oleate, glycerol andmethanol,” Industrial and engineering chemistry research, 2008.
[13] C. J. Geankoplis, Transport processes and separation process principles.Prentice, fourth ed., 2003.
[14] A. I. of Chemical Engineers, “Dippr 801,” http://dippr.byu.edu/students/.
[15] G. Aylward and T. Findley, SI chemical Data. Wiley, 6th ed., 2008.
[16] C.-W. Chiu, M. J. Goff, and G. J. Suppes, “Distribution methanol andcatalyst between biodiesel and glycerin phases,” Wiley InterScience, 2005.
[17] R. Sinnott and G. Towler, Chemical engineering design. Coulson andRichardson’s chemical engineering series, Elsevier, fifth ed., 2009.
53

[18] I. J. Halvorsen, Minimum Energy Requirements in complex distillation ar-rangements. PhD thesis, Norwegian University of Science and Technology,2001.
[19] S. Skogestad, Prosessteknikk Masse- og energibalanser. Tapir akademiskeforlag, 2 ed., 2003.
[20] C. A. Smith and A. Corrpio, Principles and practice of automatic processcontrol. Wiley, third ed., 2006.
[21] S. Skogestad and C. Grimholt, PID Control in the Third Millennium, ch. 5.Springer-Verlag London Limited, 2012.
[22] S. Skogestad, “”column a”,” http://www.nt.ntnu.no/users/skoge/distillation/.
[23] T. Leevijit, W. Wisutmethangon, G. Prateepchaikul, C. Tondurai, andM. Allen, “Trans-esterification of palm oil in series of continuous stirredtank reactors,” Asian Journal on Energy and Environment, pp. 336–346,2006.
54

A CD with Simulink model
55