linking biodiversity and recreational merits of urban ... · 3.2.2 scale and size of urban...
TRANSCRIPT
Linking Biodiversity and Recreational Merits of Urban Green Spaces
Methodological Development
Ling Qiu Faculty of Landscape Architecture, Horticulture and Crop Production Science
Department of Landscape Architecture, Planning and Management Alnarp
Doctoral Thesis Swedish University of Agricultural Sciences
Alnarp 2014

Acta Universitatis agriculturae Sueciae 2014:16
ISSN 1652-6880 ISBN (print version) 978-91-576-7980-2 ISBN (electronic version) 978-91-576-7981-9 © 2014 Ling Qiu, Alnarp Print: SLU Repro, Alnarp 2014
Cover: A view of Ramlösa Brunnspark, Helsingborg (photo: Ling Qiu)

Linking Biodiversity and Recreational Merits of Urban Green Spaces. Methodological Development
Abstract Urban green spaces play an important role in promoting both biodiversity and human recreation. This thesis therefore attempted to link biodiversity and recreational values of urban green spaces through an interdisciplinary research of trade-offs and synergies between biodiversity conservation and human recreation.
The interdisciplinary research comprised a methodological review followed by three interlinked case studies in Helsingborg employing different methods and having different research questions, but conducted partly on the same sites. The review focused on biotope mapping where a biotope mapping model integrated with vegetation structure was developed as a further contribution to the methodology. In the first case study the modified biotope mapping model was tested to identify biodiversity values in an urban green space. In the second case study, different user groups’ perceptions of urban green spaces were examined by self-reported identification of the eight perceived sensory dimensions and linked to the green spaces’ biotope characteristics. The third case study was an in-depth and on-site exploration of the relationship between preference and biodiversity in an urban green space context adopting the Visitor-Employed Photography (VEP) method. The results suggest that Biodiversity values in urban green spaces can be indicated through modified
biotope mapping involving vegetation structures. People can perceive recreational values in urban green spaces through eight
sensory dimensions. Each dimension is furthermore associated with biotopes. The more diverse biotopes an urban green space encompasses, the more frequently the eight sensory dimensions could be perceived. Urban forests were more frequently perceived as nature and rich in species than open green spaces.
Preference is not positively related to high biodiversity. The VEP study revealed on-site preference for biodiversity to be highly context-specific, mainly triggered by specific features rather than the overall scenery and character of the setting.
These results can be used for urban green space planning and management to maximize both biodiversity and recreational benefits in urban green spaces in practice.
Keywords: biodiversity, biotope mapping, eight perceived sensory dimensions, human health, landscape perception, preference, urban green space, vegetation structure, Visitor-Employed Photography (VEP), well-being.
Author’s address: Ling Qiu, SLU, Department of Landscape Architecture, Planning and Management, P.O. Box 66, 230 53 Alnarp, Sweden E-mail: [email protected]

Dedication To my parents and my daughter Emeli, for the endless support and love.
Try not be become a man of success but rather try to become a man of value. Albert Einstein

Contents List of Publications 7
1 Introduction 9 1.1 Research background 9 1.2 The benefits of urban green spaces 10 1.3 Biodiversity of urban green spaces and challenges of biodiversity
conservation 11 1.4 People’s perceptions of urban green spaces 11 1.5 Perceptions of and preference for biodiversity 13
2 Objectives of the thesis 15
3 Development of urban green space and its ecological and social issues 17
3.1 A brief history of urban green spaces 17 3.2 Ecological aspects of urban green spaces 18
3.2.1 Urban ecology and biodiversity of urban areas 18 3.2.2 Scale and size of urban biodiversity and its measurement 18 3.2.3 Importance of urban biodiversity and conservation 19 3.2.4 Biotope mapping for urban biodiversity conservation 19
3.3 Social aspects of urban green spaces 21 3.3.1 Benefits of contact with nature in urban areas 21 3.3.2 Perceptions and preferences of urban green spaces 22 3.3.3 Perceptions of urban green spaces through the eight perceived
sensory dimensions 23 3.3.4 Perceptions of and preference for biodiversity based on Visitor-
Employed-Photography (VEP) 24
4 Methodology and research design 27 4.1 Research flow 27 4.2 Case study 28 4.3 Strategic choice of case study 29
5 Papers I-IV ̶ methods and summary of results 33 5.1 Proposal of a biotope mapping model for urban biodiversity assessment
(Paper I) 33

5.2 Testing the modified biotope mapping model for urban biodiversity assessment (Paper II) 37
5.3 Public perceptions of urban green spaces through the eight perceived sensory dimensions (Paper III) 45
5.4 On-site VEP study for exploration of the relationship between preference and real and perceived biodiversity (Paper IV) 50
6 Discussion 55 6.1 Linking biotopes and the eight perceived sensory dimensions in urban
green spaces 55 6.2 Linking biodiversity and the eight perceived sensory dimensions in urban
green spaces 57 6.3 Linking preference and the eight perceived sensory dimensions in urban
green spaces 58 6.4 Methodological development for urban biodiversity conservation and
human recreation 59 6.5 Conclusion and proposed future research 60
7 References 63
8 Acknowledgements 73

List of Publications This thesis is based on the work contained in the following papers, referred to by Roman numerals in the text:
I Qiu, L., Gao, T., Gunnarsson, A., Hammer, M. & von-Bothmer, R. (2010). A methodological study of biotope mapping in nature conservation. Urban Forestry & Urban Greening 9(2), 161-166.
II Gao, T., Qiu, L., Hammer, M. & Gunnarsson, A. (2012). The importance of temporal and spatial vegetation structure information in biotope mapping scheme: A case study in Helsingborg, Sweden. Environmental Management 49(2), 459-472.
III Qiu, L. & Nielsen, A.B. (201X). Are perceived sensory dimensions reliable tools for urban green space assessment and planning? (Manuscript).
IV Qiu, L., Lindberg, S. & Nielsen, A.B. (2013). Is biodiversity attractive? – On-site perception of recreational and biodiversity values in urban green space. Landscape and Urban Planning 119, 136-146.
Papers I-II and IV are reproduced with the kind permission of the publishers.
7

The contribution of Ling Qiu to the papers included in this thesis was as follows:
I Carried out the literature search and analysed the collected data. Wrote the article with feedback and co-writing from the other authors.
II Together with the other authors planned the research project and wrote the article. Was responsible for the field survey and data collection and together with the other authors analysed the collected data and co-wrote the article.
III Conducted on-site questionnaire survey on which the paper is based. Collected and analysed the data, and wrote the article with feedback and input from the co-author.
IV Conducted the case study on which the paper is based. Conducted statistical analysis, interpreted the results and wrote the paper in close collaboration with the other authors.
8

1 Introduction
1.1 Research background
Rapid urbanisation is usually accompanied by undesirable environmental and social problems, such as drastic habitat loss and fragmentation, environmental deterioration (Grimm et al., 2008) and urban lifestyle˗related diseases (e.g. mental stress) due to less provision of green spaces (Nielsen & Hansen, 2007). These problems can result in a failure to maintain not only biodiversity and ecological integrity (Haines-Young & Potschin, 2010), but also social values (Özgüner & Kendle, 2006) or social aspects of urban areas (Mostyn, 1979).
Due to accelerating urbanisation, interest in urban green spaces has increased and the ways in which green spaces can benefit cities and their inhabitants have become key issues in urban planning (Sandström, 2002; Qiu, 2011). Evidence has been accumulating of the recreational benefits that urban green spaces provide for human quality of life (Niemelä et al., 2010), and the biodiversity of urban green spaces is essential for the provision of these benefits (Haines-Young & Potschin, 2010; Bezák & Lyytimäki, 2011). In an evaluation study of seven Swedish green plans, Sandström (2002) showed that recreation and biodiversity are the two main focus points for the cities’ urban green planning, while contribution to city structure, cultural identity, environmental quality and biological solutions to technical problems is much less addressed. In another green plans study of Swedish cities, Elander et al. (2005) concluded that urban biodiversity, for its successful implementation, needs to be related to and accommodated with other values that are given priority in current policy making, such as recreation.
In urban environments the pressure on green spaces to service both biodiversity and human recreation is thus greater than ever (Young et al., 2005). However, many conservation biologists have found that it is increasingly challenging to mesh conservation priorities with recreational motivations for maintaining and enhancing green spaces (Dearborn & Kark,
9

2010). It is therefore imperative to better understand to what extent biodiversity and recreation are compatible and how to link both objectives in urban green spaces. To this end, an interdisciplinary research project was carried out in order to identify and inform better trade-offs and synergies between biodiversity conservation and human recreation. While the study was conducted in the Swedish context, many parallels can be drawn with the situation in other countries.
1.2 The benefits of urban green spaces
Urban green space, as valuable urban biotopes, generate a diverse set of substantial ecosystem services for human well-being (Niemelä et al, 2010; Konijnendijk et al., 2013). The concept of ecosystem services is defined as the benefits people directly or indirectly derive from ecosystem functions, which can be classified as provisioning, regulating, cultural and supporting services according to the Millennium Ecosystem Assessment (2005).
Urban green spaces have many environmental benefits for humans through, for example, their cooling effect on urban areas (Bowler et al., 2010), the reduction of air pollution (Cavanagh et al., 2009), carbon sequestration (Davies et al., 2011), and the reduction of surface run-offs (Pataki et al., 2011). Urban green spaces also have a positive impact on the value of nearby property (Crompton, 2001). Most importantly, urban green spaces can contribute to public health and well-being through, for example, increasing the level of physical activity (Mitchell, 2013), reducing stress (Thompson et al., 2012), improving self-reported general health (Stigsdotter et al., 2010) and offering opportunities for recreation, psychological well-being and social support (Maas et al., 2009; Weber & Anderson, 2010).
The definition of urban green spaces is public and private open spaces in urban areas, primarily covered by vegetation, which include parks, woodlands, street trees and square plantings, cemeteries, private gardens, green roofs, community and allotment gardens, sports complexes, and so forth (Haq, 2011). This thesis deals with all types of urban green space, but mainly focuses on the cultural ecosystem services of urban green spaces. Cultural ecosystem services usually result partly from specific landscape features in the natural area and partly from the biologically diverse nature of the area (Yli-Pelkonen, 2013).
10

1.3 Biodiversity of urban green spaces and challenges of biodiversity conservation
Many studies have indicated that people can benefit from urban green spaces both physically and psychologically substantially due to these spaces’ capability of supporting biodiversity (Brown & Grant, 2005; Haines-Young & Potschin, 2010; Bezák & Lyytimäki, 2011). Biodiversity has been shown to play a key role at all levels of the ecosystem services hierarchy (Mace et al., 2012). In the last couple of decades, biodiversity concerns have been in the forefront of conservation efforts worldwide in response to the global decline in biodiversity (UNEP, 1995). Many countries have adopted a variety of strategies for long-term preservation of biodiversity following the Rio-Convention on Biodiversity (UNEP, 1995).
Despite these efforts to manage threats and pressures to urban biodiversity, practical objectives have not been achieved. One reason is that the efforts to preserve biodiversity are mainly concerned with large and relatively untouched habitats or with individual animal or vegetal species, either endangered or threatened with extinction. Much research has pointed out that the strategy of looking at individual spaces and of preserving land parcel-by-parcel is unable to efficiently protect habitats from the encroachment of development (Shih et al., 2009). Another reason is due to a lack of basic data on ecological characteristics and effective conservation measures, which has been a great hindrance to the development of biodiversity conservation (Hong et al., 2005). Sukopp and Weiler (1988) indicated that the prerequisite for successful nature conservation strategies is knowledge of the individual biotope, their ecological characteristics, location and distribution in the city and the composition of their plant and animal communities. Biotope mapping is one feasible method to provide this prerequisite for protection. However, traditional biotope mapping mainly focused on the investigation of biological characteristics of biotopes such as floristic and phytosociological features, not taking biodiversity greatly into account. Therefore, how to develop biotope mapping to obtain more specific biodiversity information of each green space in urban environmental settings was addressed in this thesis.
1.4 People’s perceptions of urban green spaces
Interestingly, urban green spaces can support biodiversity (Nielsen et al., 2013) and biodiversity, in turn, enables people to have stimulating recreational contact with nature in cities (Fuller et al., 2007). In this context, nature can be defined as a great variety of outdoor settings that have substantial amounts of
11

vegetation, such as yards, gardens, street trees, vacant lots, and fields or forests (Kaplan & Kaplan, 1989).
A more detailed understanding of urban green spaces requires integration of natural and social sciences, since urban green spaces are used and perceived differently by different people and species (Kinzig et al., 2005; Tyrväinen et al., 2007). It is strongly believed that creating more recreational opportunities for people to come into contact with nature in cities is not just about exploring the values of urban biodiversity; it is also about the social aspects of urban green spaces, that is – among others – about how people perceive urban green spaces (Kaymaz Cakci, 2012). Perception is the process in which information is derived through senses, then organised and interpreted (Zube, 1982). Landscape perception is an active process that takes place between the organism and the environment (Kaplan & Kaplan, 1989). Personal perceptions have a significant impact on shaping the characteristics of a place for local people (Tyrväinen et al., 2007). Urban green spaces, for instance, are perceived as the place that can provide both the possibilities of being on your own and of socialising, due to different personal perceptions, such as ‘to contemplate and meditate’, ‘to get artistic inspiration’, ‘to meet others for a picnic’ and ‘to be with children’ (Chiesura, 2004). A number of perception and preference studies have found that perceived values in green spaces can be classified into certain characteristics that largely correspond to different human recreational needs (e.g. Grahn, 1991; Ståhle & Sandberg, 2002; Van Herzele & Wiedemann, 2003; Kyttä & Kahila, 2005; Maikov et al., 2008).
In recent decades, these perceived characteristics have been used as tools by experts to qualitatively evaluate the qualities of a green space (Skärbäck, 2007) and to assist in the design process (Flodmark, 2004), as well as in forming policy (e.g. Region of Southern Denmark, 2011). Little knowledge of lay people’s perceptions of these characteristics has been learned, which might constitute an important knowledge gap in ascertaining public preferences for urban green spaces. Because experts frequently hold different views from lay people in judging the perceived characteristics of landscape due to their different mental constructs of naturalness (Burgess et al., 1988; Coles & Bussey, 2000; Hunter, 2001), this thesis tested the reliability of the perceived characteristics as a landscape assessment tool among lay persons. Furthermore, due to mapping the quality of urban green spaces from different ecological and social perspectives, the links between perceived characteristics and biotope and biodiversity was also explored.
12

1.5 Perceptions of and preference for biodiversity
It is desirable for people to derive recreational and aesthetic pleasure from cityscapes that also embody beneficial ecological functions. Due to a lack of knowledge about the relationship between biodiversity and preference, maximizing both biodiversity and recreational benefits becomes increasingly difficult in practice. The major gaps in knowledge concern people’s perceptions of biodiversity, the specific effect of biodiversity on preference and human well-being, and the impact of previous ecological knowledge on perception and preference for biodiversity. In order to fill these knowledge gaps, understanding if and how people perceive and appreciate biodiversity in a recreational context and to what extent biodiversity and preference are compatible is indispensable.
However, there seems to be no obvious relationship between biodiversity and preference. Studies of different landscape scenes, such as a garden landscapes, river, and brownfield, have demonstrated that high biodiversity scenes tend to be preferred to low biodiversity scenes (Junker & Buchecker, 2008; Lafortezza et al., 2008; Kurz & Baudains, 2012). Conversely, several studies indicated that people prefer to visit low biodiversity settings for recreation (Nassauer, 1995; Parsons, 1995; Gobster, 1999). For example, Gobster (1999) found that people prefer low biodiversity scenes of open areas with groups of bushes and trees rather than high biodiversity scenes of dense vegetation in the forest. These inconsistencies require further attention to expose the underlying factors.
In general, without a clear view of the relationship between biodiversity and preference, it is difficult to come to clear conclusions about which particular features of urban green spaces, including ecological and social characteristics respectively, might cause conflicts between biodiversity conservation and human recreation. This thesis thus explored the specific relationship for trade-offs and synergies between them.
13

14

2 Objectives of the thesis In response to the need to combine biodiversity conservation and human recreation in urban green space planning and management processes, the overall aim of this thesis was to explore trade-offs and synergies between biodiversity conservation and human recreation in urban green spaces.
Derived from this, the specific objectives were to: Construct and test a biotope mapping model for identifying
biodiversity values in urban green space. Understand lay people’s perceptions of urban green space and the
link to biotopes Explore the relationship between preference and biodiversity within
their perceptions.
The work was guided by the following research questions: How can biotope mapping be developed and used to efficiently
collect biodiversity information in urban green space? How do lay people perceive urban green space settings and do
perceptions differ between populations segments? How are these perceptions linked to biotopes?
Is biodiversity perceived and appreciated by people using urban green spaces for recreation? What kinds of factors influence their perceptions and preference for biodiversity?
15

16

3 Development of urban green space and its ecological and social issues
This chapter provides a description of how urban green space has developed and its related ecological and social issues. Some key concepts within urban green space, urban ecology, biodiversity, landscape perception and preference are also presented.
3.1 A brief history of urban green spaces
The concept of leisure, at least in the sense of public recreation, has its origin in 19th century industrialisation, when the conservation and establishment of green areas became a means to curb the discontent among the growing urban working class due to poor working and living conditions (Konijnendijk, 1999). During the late 19th century, city beautification was emphasized due to the extensive and unexpected population movement from the country into cities. In response to a growing interest in public health and wellbeing, the UK “Garden City Movement”, which focused on providing the public an opportunity to receive all of the perceived health and lifestyle benefits of having access to green space within urban environments, won many supporters (Domhardt, 2012). Later, many architects focused on more functionalistic ideas about the relationship between the built and the natural environment. One of the ground-breaking views on functionalistic ideas was from the architect Le Corbusier, who addressed the need to create more urban green spaces by using modern building techniques to construct high buildings, thus releasing ground space for human recreational purposes (Righini, 2000).
Nowadays, with the growing interest in urban ecology and sustainable urban development, the questions of how to deal with the negative environmental consequences of urban sprawl and how to achieve environmental-friendly solutions for human contact with nature at the neighbourhood or household level, have been addressed in many countries,
17

especially in Europe. For example, the ideals of the “compact city” in the UK and the “green city” in Denmark were initiatives towards sustainable urban development (Næss, 2000; Clark, 2005).
3.2 Ecological aspects of urban green spaces
3.2.1 Urban ecology and biodiversity of urban areas
Urban ecology is not detached from the laws of general ecology, but it does describe the study of humans in cities, of nature in cities, and of the relationship between them (Alberti, 2009). In this thesis, the relevant aspects of urban ecology and biodiversity were focused on in order to approach a better understanding of their importance and unique characteristics. Biodiversity means “the variability among living organisms from all sources including, inter alia, terrestrial, marine and other aquatic ecosystems and the ecological complexes of which they are part; this includes diversity within species, between species and of ecosystems” (United Nations, 1992).
This is just as true in an urban context as elsewhere, but urban ecology is a special one with unique and important characteristics that need to be understood to fully comprehend the benefits of urban biodiversity. This unique ecology is usually a result of the specific appearance and function of urban areas. Farinha-Marques et al. (2011) pointed out four characteristics of urban areas: Distinctive physical attributes and ecological conditions. Heterogeneous and small-scaled habitat mosaics. A combination of local and introduced species that create unique habitats. Habitat types and biological communities that significantly differ from
others elsewhere.
3.2.2 Scale and size of urban biodiversity and its measurement
When considering urban biodiversity, two levels of organization should be included: the landscape level and the habitat level (Werner & Zahner, 2010). The landscape level encompasses a range from local to regional in scale. It ranges from neighbourhoods via the city/town itself and its suburbs to its urbanised surrounding areas. The habitat level encompasses the meso to micro scale from urban neighbourhoods and land-use types to individual urban habitats i.e. urban green space. In this study, we mainly focused on the habitat level to study urban biodiversity. From a landscape ecology point of view, the habitat level could be described as a patch within the matrix of the landscape level, although the relationship between matrices and patches varies with the
18

scale (Garden et al., 2006). Several researchers have stated that the area of urban patches could be an important factor in determining the presence of a large number of plants and species (Cornelis & Hermy, 2004; Muratet et al., 2007). Nielsen et al. (2013) found that species diversity increases with patch area. While in the case of smaller urban areas, Godefroid and Koedam (2003) indicated that these areas can serve as stepping stones between larger patches and can guarantee the survival of species adapted to small habitats.
More research on measurement of urban biodiversity has focused on species richness, simply because it is well defined, quantifiable and easily monitored (Farinha-Marques et al., 2011). Accordingly, this study was limited to the species dimension of biodiversity, mainly focused on vascular plants.
3.2.3 Importance of urban biodiversity and conservation
Urban biodiversity can contribute significantly to the quality of life in an increasingly urban global society. It contributes to essential services including water filtration and absorption, nutrient cycling, air filtration and noise buffering. Other important services provided by urban biodiversity include recreational, cultural and spiritual nourishment that maintain personal and social well-being (Keniger et al., 2013). Urban biodiversity conservation is therefore an important task for all people. Dearborn and Kark (2010) highlight the importance of urban biodiversity conservation using seven key arguments ranging from ecological to anthropic benefits: Preserve local biodiversity in an urbanising environment and protect
important populations or rare species. Create stepping stones or corridors for natural populations. Understand and facilitate responses to environmental changes. Connect people with nature and provide environmental education. Provide ecosystem services. Fulfil ethical responsibilities. Improve human well-being.
3.2.4 Biotope mapping for urban biodiversity conservation
In order to cope with immense natural habitats and species loss in cities due to urbanisation, many European countries have developed a variety of programmes for nature conservation in urban areas (Cilliers et al., 2004). One of the leading projects that focused on nature conservation in cities was the urban biotope mapping scheme, first conducted in Germany which was gradually developed in other countries such as the UK, Sweden, New Zealand, Brazil, Korea, etc. (Qiu et al., 2010).
19

Biotope refers to a distinct space, which is endowed with specific environmental conditions and suitable for particular flora and fauna (Hong et al., 2005). Biotope mapping is the process of identification and specification of existing habitats and landscape units (Qiu et al., 2010). For mapping of biotopes in urban areas, two methods are employed: ‘selective biotope mapping’ where only the biotopes worthy of protection are mapped and ‘comprehensive biotope mapping’ where all biotopes are mapped (Sukopp & Weiler, 1988). There are generally three main steps in the process of mapping, which are: field survey, categorisation of biotopes and evaluation. In this process, the condition of the environment, such as land-use, flora, fauna and soil, is evaluated and graded by various ecological values on the map. The map can then offer an evidence-based foundation to assist in the decision making around nature conservation (Yilmaz et al., 2010).
Urban biotope maps were initially produced for the protection of native species and rare habitats in cities, but they have gradually served a wider range of applications in landscape planning, delineation of protection zones, design of habitat connection corridors or biotope linkage systems, environmental impact assessment and environmental management in urban ecosystems (Weiers et al., 2004; Hong et al., 2005). Biotope mapping in urban areas has become an important policy tool that provides data for urban planning as well as to forecast the impact of urbanisation on the ecosystem, while enabling us to evaluate the ecosystem elements more objectively (Hong et al., 2005).
However, from a biodiversity point of view, the lack of consistent and biodiversity-oriented information on structure, type, size and quality of biotopes in the process of mapping has been identified as a major constraint for the implementation of biodiversity conservation strategies (Weiers et al., 2004). In response to different applications of urban biotope mapping, a well-structured classification of biotopes provides a fundamental basis, mainly focused on land use and habitat type (Werner, 1999). Nevertheless, vegetation structure has not been comprehensively taken into account, though it has been shown to have a close relationship with biodiversity (Gao et al., 2012). Tilghman (1987) claimed that the abundance of undergrowth and shrub layers has been observed to correlate positively with bird species richness and diversity in urban parks. Schadek et al. (2009) indicated that plant species richness increased with vegetation height but decreased with vegetation density in urban brownfield sites. Pinna et al. (2009) found that the maturity and structure of urban forests were positively correlated with carabid abundance and richness. Accomplishing the conservation of biodiversity in urban areas could potentially be greatly assisted, if vegetation structure information is added to the biotope mapping scheme.
20

3.3 Social aspects of urban green spaces
3.3.1 Benefits of contact with nature in urban areas
Urban green spaces not only act as an important refuge for biodiversity, but also have become important nodes of contact with nature in cities due to high-density urban living (Home et al., 2012). According to Keniger et al. (2013), people’s contact with nature can be divided into three main types ranging from passive to active: indirect, incidental and intentional (Table 1).
Table 1. Typology of contact between people and nature (modified from Keniger et al. 2013).
Types of contact with nature
Description
Indirect contact Experiencing nature but not physically present in nature, e.g. viewing nature in a picture/image/ motion picture/through a window
Incidental contact Experiencing nature as a by-product of another activity, e.g. encountering nature when walking to work or driving; encountering vegetation indoors
Intentional contact Experiencing/being in nature through direct intention, e.g. hiking, bird watching, camping, gardening.
The evidence of benefits that come from people’s contact with nature is clear and rich (Özgüner & Kendle, 2006). For example, evidence that living in close proximity to green spaces delivers health benefits could be used to encourage the design of landscapes with broader societal benefits such as reductions in health spending or crime rates. Mostyn (1979) found that people benefit from nature in many ways including emotional, intellectual, social and physical aspects. Keniger et al. (2013) identified that the benefits from contact with nature can be classified into six key types that range from physical health and cognitive benefits to spiritual benefits and the tangible outcomes associated with food production and wealth (Table 2).
Table 2. Typology of the benefits of interaction with nature (modified from Keniger et al. 2013).
Benefits from contact with nature
Description
Psychological benefits Positive effect on mental processes, e.g. promote self-esteem; mood/behaviour improvement; anger/frustration/anxiety reduction.
Cognitive benefits Positive effect on cognitive and emotional function, e.g. improved attention, working memory improvement, mental fatigue reduction.
Physical health benefits Positive effect on physical function and health, e.g. stress reduction, perceived health and well-being, faster healing.
21

Social benefits Positive social effect at an individual, community or national scale, e.g. recreational activity, facilitated social interaction between adults and children, crime rate reduction.
Spiritual benefits Positive effect on individual religious pursuit or spiritual well-being, e.g. aesthetic/cultural experiences, inspiration/spiritual well-being promotion.
Tangible benefits Material goods that an individual can accrue for wealth or possession, e.g. food supply, money.
3.3.2 Perceptions and preferences of urban green spaces
Despite the evidence suggesting that people can derive considerable benefits from contact with nature, research on how people perceive urban green space and which aspects of urban green space people appreciate are not consistent (Nielsen et al., 2012). People are often selective about what they see as natural, and nature means different things to different categories of people. For some people nature is reserved for wilder places and does not exist in the urban context (Kaplan, 1992), but for others nature can be found anywhere even on their doorstep (Millward, 2001). Gobster (2001) identified four different ‘visions of nature’ each emphasizing a different set of characteristics related to the landscapes’ perceived structure and function as well as its human values and uses.
Perception of nature is considered as a function of the interaction of humans and nature (Zube et al., 1982). Perception of nature may influence human behaviours and mirror their motives, preferences and attitudes (Thompson et al., 2005; Nielsen et al., 2012). Ulrich (1991) argued that human emotional responses to nature are immediate and subconscious, automatically triggered by contact with natural content. Several emotions, such as aesthetic preference, sadness, fear, are claimed to be provoked in this manner. These immediate emotional responses are often associated with instant physiological behaviour, such as attractiveness (in the case of perceived serenity) or avoidance (in the case of perceived danger) (Ulrich, 1991). Depending on different environmental settings, the perception can range from negative to positive (Qiu et al., 2013). Positive perception can promote environment attraction, whereas a negative one can limit visitation and modify use pattern (Bixler & Floyd, 1997).
Since urban green spaces can be regarded as resembling excerpts from natural environments, many conclusions from general perception and preference research should be applicable to them. Several studies indicated that people have complex and ambivalent perceptions of urban green spaces (Crewe, 2001; Hunter, 2001). People appreciate and aspire to the multiple benefits of urban green spaces, while also associating them with insecurity and
22

crime (Crewe, 2001). People often interpret urban green spaces in terms of their own needs and prefer those in which they, as humans, are likely to function effectively. According to the framework of Kaplan and Kaplan (1989), human preference can be viewed as an expression of bias towards adaptively suitable environments, environments that include elements and spaces that are useful and supportive for human functioning. Hudson (1992) claimed that landscape preference is linked to those spatial arrangements, colours, shapes or other visual features that resemble beneficial environments and hence evoke spontaneous aesthetic satisfaction in the observer. Numerous variables predicted by several landscape-preference models, such as complexity, novelty, incongruence, surprisingness, coherence, legibility, mystery, prospect, and refuge could explain preference for landscapes (Berlyne, 1970; Kaplan & Kaplan, 1989; Appleton, 1996).
3.3.3 Perceptions of urban green spaces through the eight perceived sensory dimensions
People seeking different types of experiences may require different environmental conditions for satisfaction (Schreyer & Lime, 1984). Simultaneously, different environments can be shaped and characterized by people’s perceptions and experiences. The characteristics of an environment are based on the experience of the human-environment interaction, whereby both are shaping and being shaped by the interactive process (Zube et al., 1982). These environmental characteristics are often regarded as a landscape’s perceived values. The perceived values of an environment have the potential to enhance the positive qualities of urban life in terms of opportunities, physical settings, sociability and cultural diversity (Malek et al., 2011).
A number of environmental psychology studies have tried to classify green space characteristics in urban environmental settings (e.g. Van Herzele & Wiedemann, 2003; Gyllin & Grahn, 2005; Kyttä & Kahila, 2005; Tyrväinen et al., 2007). One of these classifications that has been developed over the last 30 years has become widely applied in the Nordic countries. The latest version is called the perceived sensory dimensions which is based on a questionnaire survey of almost 1000 randomly selected participants in four Swedish cities who reported their preferences from a long list of qualities of nature (Grahn & Stigsdotter, 2010). Eight characteristics of green space that largely correspond to different basic human needs were identified by factor analysis of all variables from the list: serene (e.g. silent and calm), nature (e.g. wild and untouched), rich in species (e.g. many animals and plants), space (e.g. spacious and free); prospect (e.g. flat and well-cut lawns with scattered trees), refuge (e.g. an enclosed and safe place), social (e.g. entertainment and exhibition),
23

culture (e.g. decorated with fountains and ornamental plants) (Grahn & Stigsdotter, 2010).
Despite the fact that the eight perceived sensory dimensions have been widely applied as a landscape assessment ‘tool’ for the determination of landscape quality and management of landscapes, they were really only used by experts (Grahn & Stigsdotter, 2010). Experts are seen to have a more sensitive appreciation of landscape quality and are also thought to be able to articulate their feelings more expressively (Dearden, 1981). However, expert assessments are still a dubious source of objective judgments about what people care about in a landscape (Kaplan, 1988). Roth and Gruehn (2012) indicated that the status of expert assessments in general has no more considerable effect than that of lay people. This, together with results from the considerable body of research exploring public preferences for urban green spaces, illustrates that the lack of empirical studies exploring lay people’s perceptions of the eight perceived sensory dimensions might constitute an important knowledge gap. There is also a potential risk that the eight perceived sensory dimensions have been directly used in the practical assessment of projects before an understanding of their validity was gained. Therefore, understanding lay people’s perceptions of the eight perceived sensory dimensions is needed.
3.3.4 Perceptions of and preference for biodiversity based on Visitor-Employed-Photography (VEP)
Traditionally, green space studies have discussed ecological and social issues separately, which may lead to poor compatibility in the planning and management of green spaces. Compatibility is the match between what a person wants to do, what the environment supports and what the person is expected to do in the environment (Kaplan, 1995).
Uzzell (2000) claimed that environmental problems are always rooted in humanity’s emotional and perceptual relationship with the environment. To accommodate biodiversity and recreational values in urban green spaces, it is of great importance to understand people’s perception and preference associated with biodiversity (Qiu et al., 2013). Stokes (2007) noted that much of the world’s biodiversity can only survive if people choose to protect it, which implies that human preferences could be important determinants of many species’ prospects for survival. In a certain sense, human biodiversity preferences not only play a significant role in the implementation of biodiversity conservation, but can also predict which aspects of biodiversity appeal to people and which aspect repel them (Qiu et al., 2013). This would allow conservationists and urban green space planners to share people’s
24

preference information and use it, making better trade-offs and synergies between biodiversity conservation and human recreation in the process of decision making.
Despite the fact that there is a large body of knowledge on landscape preference and perception, the research rarely considers how people perceive and appreciate urban green spaces in relation to biodiversity. In this study, Visitor-Employed Photography (VEP) was applied to explore people’s perceptions of and preferences for biodiversity. VEP is a method introduced by G.J. Cherem in the 1970s that allows people to take their own photos to describe their environment graphically. Over the years the VEP technique has been successfully used to assess people’s landscape perceptions and to explore the process inherent in their outdoor experiences (e.g. Dorwart et al., 2006; Heyman, 2012). Compared with conventional off-site photo elicitation methods, the VEP approach may better represent the actual experiences on-site and has the potential to dynamically register a wider set of factors and elements, such as smells, sounds and tactile experiences. All of these can positively or negatively influence the actual experience of biodiversity (Oku & Fukamachi, 2006).
25

26

4 Methodology and research design
4.1 Research flow
The overall aim of this thesis, to make trade-offs and synergies between biodiversity conservation and human recreation, was approached through interdisciplinary research methods integrating ecological issues and social issues of urban green spaces. The research flow consisted of two parallel strands (Figure 1). One strand reflects the biotope mapping study that is related to ecological issues, and the other represents the perception and preference study based on the eight sensory dimensions and VEP tools related to social issues.
The thesis starts with Paper I – a methodological study of biotope mapping and development of an urban biotope classification related to biodiversity. Paper II applied this urban biotope classification in a biotope mapping scheme to test its validity in identifying biodiversity values in urban green spaces. Since human recreation is always influenced by people’s perceptions and preferences, Paper III turned to social aspects to study people’s perceptions of urban green spaces through the eight sensory dimensions. Based on these perceptions and the overlapping part of these study areas in Paper II, the specific links between biotope type, biodiversity and the eight sensory dimensions were also identified. Paper IV then took the preference concept into account. An on-site VEP study was conducted employing both lay people and ecology experts. The relationship between preference, real and perceived biodiversity was explored.
27

Figure 1. Research flow of the thesis based on papers I-IV. The research flow consisted of three parts indicated by different colours: grey is the research context; green is the study themes; and purple is the applied methods.
4.2 Case study
A scientific discipline without a large number of thoroughly executed case studies is a discipline without a systematic production of exemplars, and a discipline without exemplars is an ineffective one (Flyvbjerg, 2006). A case study usually employs a combination of different methods, designed to describe and understand the complexity of particular cases. Many researchers regard case studies as offering a particularly useful approach in fields of research that are practice-orientated and deal with ‘real world contexts’, such as landscape architecture, architecture and planning (Francis, 2001; Johansson, 2005). The use of case studies is one approach that supports deeper and more detailed investigation of the type that is normally necessary when trying to
Preference
Tools:
Paper II
Paper III
Paper IV
Paper III
Paper IV
Biodiversity Recreation
PerceptionBiotopes
Cultural services
Quality of urban green space
Biotope mapping
(Paper I)
Eight perceived
sensory dimensions
Visitor-Employed
Photography (VEP)
Urban green space
Urban ecosystems services
28

answer how and why questions. The how or why question is often being asked about a contemporary set of events over which the investigator has little or no control (Yin, 1994). In this thesis, why biodiversity conservation conflicts with human recreation and how to make trade-offs and synergies between them are the essential questions that demand immediate attention. Moreover, the most significant strength of case studies is that one can form generalizations on the basis of a single case, which could be central to scientific development via generalization or as a supplement or alternative to other methods (Flyvbjerg, 2006). The overall method used in this thesis was thus case study. Although Paper I was a theoretical study from the literature review, the methodological development of biotope mapping was generalized from case studies.
4.3 Strategic choice of case study
Johansson (2005) indicated that the strategic choice of case might greatly add to the generalizability of a case study. Case study often investigates a complex, functioning unit within its natural context through using many variables, qualities and factors (Johansson, 2005). In this thesis, three different case studies were selected to deal with the ‘how’ and ‘why’ questions. In order to facilitate exploration and comparison of individual cases to accumulate new knowledge within a study field, the three case studies were executed in the same city – Helsingborg, on the south-west coast of Sweden (Figure 2). Compared with other cities in Scania County of Sweden, Helsingborg has many urban parks and green spaces distributed around the centre of the city and within the city limits that are suitable for this study.
The study area of Paper II covered a west-east running transect from the centre of the city to its outskirts (Figure 2). The transect borders to a number of major roads, acting as barriers for people using green spaces in the adjacent areas. The reasons for selecting this transect as a study area where a biotope mapping scheme associated with biodiversity was tested were that: (1) it comprises a variety of biotopes and; (2) the relevant historical documents relating to the continuity of land use are available, which show that continuity has a close relationship with biodiversity (Gao et al., 2012). To link Paper II and compare individual cases from different perspectives for broadening knowledge within the research, Paper III selected six pre-coded urban green spaces within the study area of Paper II to conduct a perception case study (Figure 2). According to the results from Paper II, these six sites were the most representative biotopes with distinctive differences in character, size, and shape within the study area. Detailed information of the six sites is shown in the results section of Paper III.
29

Figure 2. Location of the case studies in Papers II-IV.
As for Paper IV, it would have been ideal, if it had conducted a biodiversity preference case study within the same area as that in Papers II-III. Instead, Ramlösa Brunnspark (RB) in the south-eastern part of Helsingborg was finally selected as a case study (Figure 2), because RB corresponded more closely to the following criteria: Commonly used as recreational area. Includes a variety of environments, ranging from high to low levels of
species richness. Includes a variety of design/management schemes, ranging from highly
ornamental to wild-looking habitat and from very open to very dense vegetation structure.
A walkable trail could be easily established that would traverse all characteristic environments of the park for a VEP survey.
Flyvbjerg (2006) indicated that extreme cases often reveal more information because they activate more actors and more basic mechanisms in the situation studied. In addition, from both an understanding-oriented and an action-oriented perspective, it is often more important to clarify the deeper causes
30

behind a given problem and its consequences. In this sense, RB is a favourable case as it offers the possibility of further exploration of the relationship between biodiversity and preference. Moreover, with the unique characteristics of RB that almost embodied all the features of the six sites, it was easy to link these three cases for in-depth comparisons to enable identification of the interrelationship between biodiversity, perception and preference across the subsequent case studies. The relevant comparisons across the individual papers are addressed in the discussion section.
31

32
5 Papers I-IV ̶ methods and summary of results
In this chapter, the results of Papers I-IV are summarized and discussed. The key results from each paper are presented, but the reader can refer to the full papers that are appended to this thesis for a more in-depth description of the work.
5.1 Proposal of a biotope mapping model for urban biodiversity assessment (Paper I)
In Paper I, the development and applications of biotope mapping in nature conservation and the new perspectives on biotope mapping in relation to urban biodiversity were addressed. The objectives of Paper I were to: 1) show the main changes of perspectives on biotope mapping in nature conservation, 2) highlight the importance of biotope mapping as a tool for producing functional information to be used when promoting urban biodiversity to be experienced by people, and 3) propose a modified biotope classification involving the concept of vegetation structure for urban biodiversity assessment.
Biotope mapping has increasingly become an indispensable tool of landscape planning for nature conservation. However, the status of using biotope mappings and their challenges for urban biodiversity conservation has seldom been discussed, which could be a hindrance to the implementation of urban biodiversity conservation. This study thus provided an overview of biotope mapping through a literature review and case-based analysis.
Based on the overview of biotope mapping in nature conservation, it was found that the perspectives of biotope mapping have changed from the protection of valuable biotopes for rare and endangered species to a more modern nature conservation strategy, i.e. maintaining and increasing biodiversity as a component of human daily life. In order to accomplish these modern goals, comprehensive surveys of all land parcels are necessary,
33

especially the investigation of ordinary and small-scale biotopes close to people’s living places such as neighbourhood parks, private gardens, hedgerows, etc. that still have potential biodiversity values.
It was also found that a well-structured classification of biotopes provides a fundamental basis for biotope mapping that determines what type of biotope information can be collected. Given that vegetation structure has a close relationship with biodiversity but is not comprehensively taken into account, a biotope classification integrated with three structural variables for urban biodiversity assessment was proposed (Table 3). The three structural variables are: The approximate mean age of individuals of the dominant tree-layer. Young trees. Middle-aged trees. Old trees.
Horizontal structure – divided by the canopy cover ratio of trees and shrubs. Open green area (< 10% canopy cover of trees and shrubs). Partly-open green area (10-30% canopy cover of trees and shrubs). Partly-closed green area (30-80% canopy cover of trees and shrubs). Closed green area (> 80% canopy cover of trees/shrubs).
The vertical structure One-layered (canopy layer or understory). Two-layered (any combination of shrub layer, understory and canopy
layer). Multi-layered (more than two layers).
This modified classification system identifies land cover in areas by identifying the structure of the vegetation present, regardless of the area’s land use or habitat type. The first level is the division among grey space, green space and blue space. The grey space category is designed to identify the presence of abiotic surfaces and associated vegetation patterns. The green space category is composed of vegetation patterns and structures. There are five subclasses in this category, which identify the hydrology of the soil condition, the horizontal structure, the age structure, the woody plant type and the vertical structure (Table 3). Little structure aspect was involved in the blue space category.
There are some advantages of this classification system. Firstly, it can accomplish comprehensive surveys of all land parcels and obtain more detailed structural information of biotopes related to biodiversity. Secondly, it can include small valuable biotopes that are often easily overlooked in practical mapping processes especially in urban grey spaces such as gardens attached to
34

public buildings, a solitary old grove with broad crown trees, etc. Lastly, it is easy to adjust the age profile and the percentage of vegetation cover required for a particular structure category according to the practical situation of the study area. Nevertheless, this system should be tested in practice in projects for urban biodiversity assessment.
35

Table 3. A proposal of hierarchical order of biotope categories: Level1-Level 6 for urban biodiversity development.
Level 1 Level 2 Level 3 Level 4 Level 5 Level 6
Grey space: areas are mainly covered by abiotic matters such as construction, extraction sites and beaches, etc.
% abiotic Mainly trees/shrubs Young trees Middle-aged trees Old trees
Deciduous Evergreen Mixed D&E
–
Mainly herbaceous vegetation Annual (biennial) Perennial
Short-cut grass/tall grass Vegetable/flower garden
–
Minimal/no vegetation – – Buildings/pavement Exposed earth/rock/sand
Green space: areas are vegetated land or water within or adjoining an urban area, which may contain small-lot abiotic surfaces.
Xerantic to mesic soil Mesic to wet soil
Open green area (< 10% canopy cover of trees/shrubs)
Annual (biennial) Perennial
– Short-cut grass/tall grass Moss/lichen Emergent plant
Partly open green area (10-30% canopy cover of trees/shrubs)
Partly closed green area (30-80% canopy cover of trees/shrubs)
Young trees Middle-aged trees Old trees
Deciduous Evergreen Mixed D&E
One-layered Two-layered Multi-layered Closed green area (> 80%
canopy cover of trees/shrubs) Blue space: open water with no emergent vegetation.
River/stream/pond/lake/ wetland open water
Submerged plant Floating leaved plant
– – –
36

5.2 Testing the modified biotope mapping model for urban biodiversity assessment (Paper II)
In order to test the functionality of the modified biotope classification system integrated with structure variables for urban biodiversity assessment in Paper I, a new case study was conducted and resulted in Paper II. The study was guided by the following two questions: 1) How to refine this modified biotope classification system so as to make biotope mapping more applicable in a practical study? and 2) how to validate the concept that the refined biotope mapping model integrated with structural variables can better indicate biodiversity values?
In response to the applicability of the modified biotope classification, Paper II mainly focused on the green spaces category and further refined it through integrating with four variables of vegetation structure (Table 4). The refined biotope classification was applied to a green structure system in Helsingborg city in southern Sweden, as mentioned in the methodology section. Besides the previous three structural variables (age, horizontal and vertical structure), the continuity of woodland was also added in this refined classification. The continuity of woodland cover was identified by using an Ancient Woodland Indicator (AWI) species. The presence of AWI species in woodland inventories is taken as evidence of a long continuity of woodland cover (Rose, 1976). According to the practical situation, the approximate mean age of dominant tree-layer individual was divided into less than 30 years, 30-80 years and more than 80 years.
37

Table 4. Refined biotope classification involving four structural variables shown for green spaces.
Level 1 Level 2 (horizontal) Level 3 (age and continuity) Level 4 Level 5 (vertical)
Green spaces
Open green area <10% trees/shrubs
With lawn area With grazed land area With meadow area With succession area
Dry/Fresh/Wet Poor/Rich
Partly open green area 10-30% trees/shrubs
With lawn area With grazed land area With meadow area With succession area
Dry/Fresh/Wet Mainly shrubs Mainly trees Mixed
Partly closed green area 30-80% trees/shrubs
Less than 30 years (with or without AWI species) 30-80 years (with or without AWI species) More than 80 years (with or without AWI species)
Deciduous Mixed D&C Conifer Swamp
One-layered Two-layered Multi-layered
Forest >80% trees/shrubs >10000 m2 (more than 50 m across)
Less than 30 years (with or without AWI species) 30-80 years (with or without AWI species) More than 80 years (with or without AWI species) Clear cut (with or without AWI species)
Deciduous Mixed D&C Conifer Swamp
One-layered Two-layered Multi-layered
Grove, clump of trees, thicket, tree belt or avenue (less than 50 m across)
Less than 30 years (with or without AWI species) 30-80 years (with or without AWI species) More than 80 years (with or without AWI species)
Deciduous Mixed D&C Conifer Swamp
One-layered Two-layered Multi-layered
38

Through the interpretation of panchromatic aerial photographs and field surveys, a set of modified biotope maps in relation to vegetation structure was plotted based on GIS (Figure 3 and Figure 4).
Figure 3. Finest level of biotope map in Helsingborg. The smallest biotope in the study area is 1000m2.
39
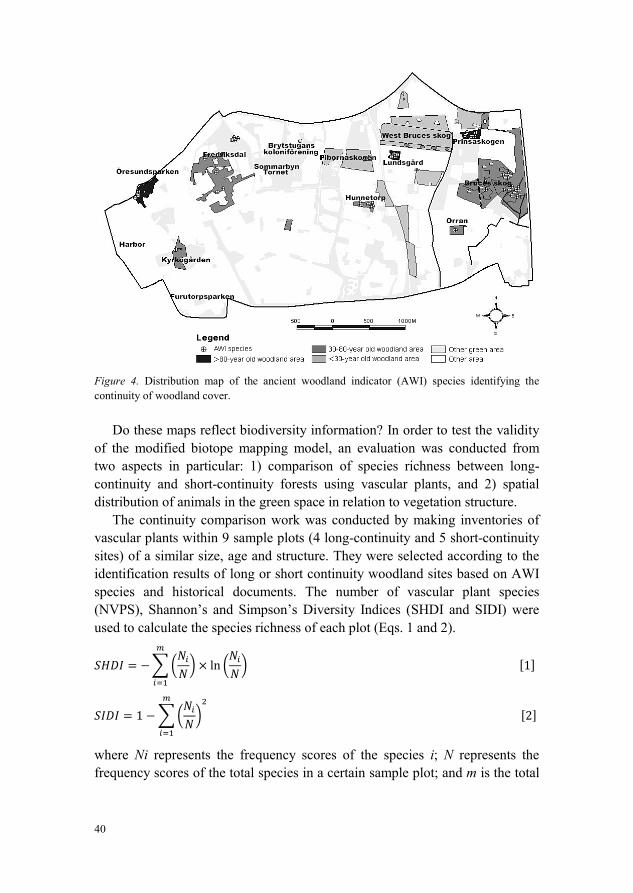
Figure 4. Distribution map of the ancient woodland indicator (AWI) species identifying the continuity of woodland cover.
Do these maps reflect biodiversity information? In order to test the validity of the modified biotope mapping model, an evaluation was conducted from two aspects in particular: 1) comparison of species richness between long-continuity and short-continuity forests using vascular plants, and 2) spatial distribution of animals in the green space in relation to vegetation structure.
The continuity comparison work was conducted by making inventories of vascular plants within 9 sample plots (4 long-continuity and 5 short-continuity sites) of a similar size, age and structure. They were selected according to the identification results of long or short continuity woodland sites based on AWI species and historical documents. The number of vascular plant species (NVPS), Shannon’s and Simpson’s Diversity Indices (SHDI and SIDI) were used to calculate the species richness of each plot (Eqs. 1 and 2).
𝑆𝐻𝐷𝐼 = −��𝑁𝑖𝑁�
𝑚
𝑖=1
× ln �𝑁𝑖𝑁� [1]
𝑆𝐼𝐷𝐼 = 1 −��𝑁𝑖𝑁�2𝑚
𝑖=1
[2]
where Ni represents the frequency scores of the species i; N represents the frequency scores of the total species in a certain sample plot; and m is the total
40

number of species in a particular sample plot. Independent-Samples T test method was used to compare the species richness between long-continuity and short-continuity sites.
As for the spatial distribution of animals, this was evaluated by measurement of the distance between targeted animals (small birds, medium-sized birds, large birds and rabbits) and the nearest trees or shrubs in open and partly open green areas; and the number of observed animals species within forests and partly closed green areas was also recorded.
The main results of Paper II are presented in Table 5 and Figure 5. Table 5 shows that the NVPS at long-continuity sites ranged between 38 and 51, and the range at short-continuity sites was between 15 and 28. The NVPS values (F=0.030, Sig.=0.868; t=5.147, p=0.001), the SHDI values (F=1.066, Sig.=0.336; t=3.889, p=0.006) and the SIDI values (F=3.160, Sig.=0.119; t=3.247, p=0.014) between long and short-continuity forests showed a very significant difference. The range of SHDI and SIDI values in long-continuity plots were all higher than in short-continuity plots (Table 5), which reveals that the long-continuity plots have higher species richness than the short-continuity plots.
41

Table 5. Area, NS, SHDI, SIDI, and main vascular plants of long-continuity and short-continuity plots.
Plots Area (ha) NVPS SHDI SIDI Ancient status Species of vascular plant (frequency scores ≥ 5)
I 2.11 51 3.34 0.95 Long continuity Anemone nemorosa, Convallaria majalis, Corylus avellana, Dryopteris filix-mas, Holcus lanatus, Impatiens parviflora, Juncus effuses, Lysimachia vulgaris, Maianthemum bifolium, Oxalis acetosella, Quercus robur, Rubus idaeus, Sambucus nigra, Stellaria holostea, Viola reichenbachiana
II 1.91 38 2.96 0.93 Long continuity Anemone nemorosa, Anemone ranunculoides, Corylus avellana, Dryopteris filix-mas, Fagus sylvatica, Lonicera periclymenum, Maianthemum bifolium, Milium effusum, Oxalis acetosella, Paris quadrifolia, Polygonatum multiflorum, Quercus robur, Rubus idaeus, Sorbus aucuparia, Stellaria holostea
III 1.94 43 3.21 0.95 Long continuity Alnus glutinosa, Anemone nemorosa, Anemone ranunculoides, Deschampsia cespitosa, Deschampsia flexuosa, Dryopteris filix-mas, Fragaria vesca, Fraxinus excelsior, Geum urbanum, Impatiens parviflora, Milium effusum, Oxalis acetosella, Prunus avium, Ribes rubrum, Rubus idaeus, Rubus laciniatus, Stellaria holostea, Valeriana dioica, Viola reichenbachiana
IV 2.19 40 3.23 0.95 Long continuity Acer pseudoplatanus, Alnus glutinosa, Anemone nemorosa, Betula pendula, Convallaria majalis, Corylus avellana, Fagus sylvatica, Galium odoratum, Maianthemum bifolium, Oxalis acetosella, Picea abies, Poa trivialis, Polygonatum multiflorum, Prunus padus, Quercus robur, Rubus idaeus, Sambucus nigra
V 2.05 24 2.58 0.89 Short continuity Anemone nemorosa, Betula pendula, Dryopteris filix-mas, Frangula alnus, Quercus robur, Rubus idaeus, Rubus nessensis, Sorbus aucuparia, Trientalis europaea
VI 2.19 28 2.69 0.89 Short continuity Convallaria majalis, Fagus sylvatica, Quercus robur, Rubus idaeus, Sambucus racemosa, Trientalis europaea
VII 2.07 15 1.95 0.79 Short continuity Acer pseudoplatanus, Anemone nemorosa, Anemone ranunculoides, Dryopteris
42

filix-mas, Fagus sylvatica VIII 1.85 28 2.70 0.89 Short continuity Acer pseudoplatanus, Anemone nemorosa, Anemone ranunculoides, Corylus
avellana, Quercus robur, Rubus idaeus, Sambucus nigra IX 2.16 25 2.61 0.89 Short continuity Acer pseudoplatanus, Epilobium montanum, Fagus sylvatica, Impatiens
parviflora, Sambucus nigra, Tilia cordata, Ulmus glabra
43
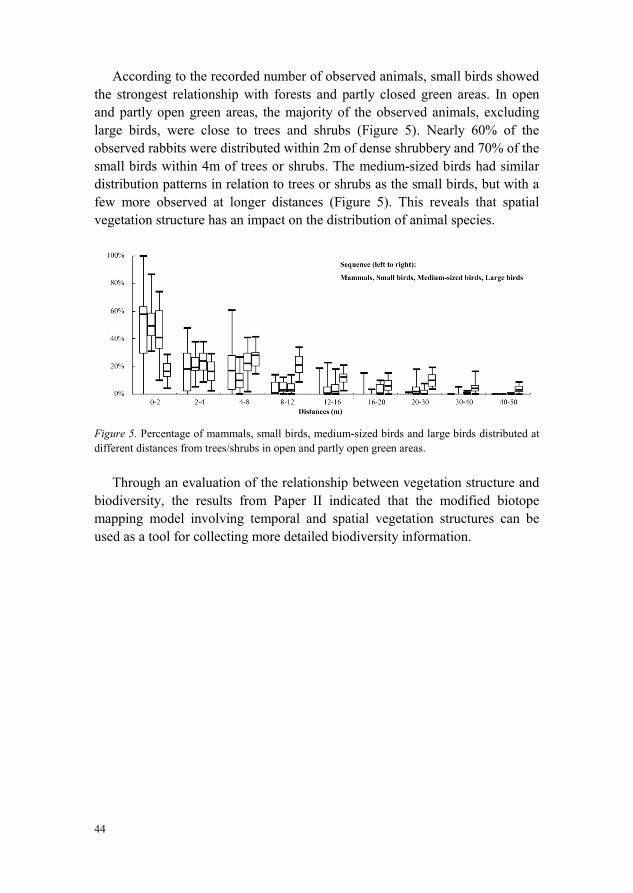
According to the recorded number of observed animals, small birds showed the strongest relationship with forests and partly closed green areas. In open and partly open green areas, the majority of the observed animals, excluding large birds, were close to trees and shrubs (Figure 5). Nearly 60% of the observed rabbits were distributed within 2m of dense shrubbery and 70% of the small birds within 4m of trees or shrubs. The medium-sized birds had similar distribution patterns in relation to trees or shrubs as the small birds, but with a few more observed at longer distances (Figure 5). This reveals that spatial vegetation structure has an impact on the distribution of animal species.
Figure 5. Percentage of mammals, small birds, medium-sized birds and large birds distributed at different distances from trees/shrubs in open and partly open green areas.
Through an evaluation of the relationship between vegetation structure and biodiversity, the results from Paper II indicated that the modified biotope mapping model involving temporal and spatial vegetation structures can be used as a tool for collecting more detailed biodiversity information.
44

5.3 Public perceptions of urban green spaces through the eight perceived sensory dimensions (Paper III)
To implement biodiversity development for human recreation, an assessment of how people perceive urban green spaces is required. In Paper III, people’s perceptions of urban green spaces were examined through identification of the eight perceived sensory dimensions among different user groups in urban green space settings. The objectives of Paper III were: 1) To identify the representation of the eight sensory dimensions in different types of urban green spaces, as experienced by lay people; and 2) to test whether the perceptions of the eight sensory dimensions differs between user groups.
As mentioned in the methodology section, the study area was comprised of six pre-coded green spaces selected from the biotope mapping results of Paper II. Detailed information and images are shown in Table 6 and Figure 6. This perception case study was conducted through an on-site questionnaire survey. The questionnaire contained three sections. The first section asked for the demographic characteristics (gender, age) of the respondents. The second section addressed the respondents’ actual use of, and familiarity with, the site, including questions concerning frequency and duration of visits and type of recreational activities. The last and main part of the questionnaire contained questions regarding the eight sensory dimensions, described in greater detail with informative texts and illustrated with photos. In total 121 users responded to the questionnaire. Women were more frequent respondents than men and the largest number of respondents came from the 21-50 years age group with only 4% under 21 years of age.
45

Table 6. Characteristics of the six pre-coded green spaces selected from the biotope mapping results from Paper II.
Site Size (ha) Type of green space No. of biotopes Characteristics of biotope type Intensity of use (≥1/week)
G1 6.1 Ornamental park 2 1) Partly-open lawn area with trees and shrubs 2) Grove
71%
G2 17.3 Allotment garden 1 1) Partly-open lawn area 95% G3 28.1 Semi-natural green area 4 1) Lake
2) Partly-open meadow area 3) One layered deciduous forest with < 30-year-old trees 4) Two layered deciduous forest with< 30-year-old trees
95%
G4 44.8 Urban Forest 3 1) Open lawn area 2) Two layered deciduous forest with < 30-year-old trees 3) One layered deciduous forest with 30-80-year-old trees
55%
G5 50.1 Urban Forest 5 1) Pond 2) Open grazed area with fresh soil conditions 3) Open grazed area with wet soil conditions 4) Multi layered deciduous forest with 30-80-year-old trees 5) One layered conifer forest with 30-80-year-old trees
60%
G6 10.8 Residential green area 1 1) Open lawn area with sporadic trees and shrubs 70%
46

Figure 6. Panoramic photos of the six green spaces: G1: Ornamental park with lawn and some trees and exotic species; G2: allotment with small houses, ornamental plants and lawn; G3: young urban woodland with a lake; G4: mature urban woodlands with open lawn; G5: mature urban woodland; G6: open lawn area with sporadic trees. (photos by Ling Qiu)
Paper III revealed that 121 respondents generally had a good understanding of the eight sensory dimensions, with only 8% ‘Do not know’ replies. However, the frequency of perception of the eight sensory dimensions was different. The respondents most frequently perceived prospect, followed by serene and space. Culture followed by social had the lowest frequency (Table 7).
Table 7. Arithmetic mean values concerning people’s perceptions of the eight perceived sensory dimensions in urban green spaces.
The eight sensory dimensions No. of respondents Mean SE Mean StDev Rank
Prospect 121 2.636 0.068 0.753 1 Serene 121 2.603 0.070 0.769 2 Space 121 2.116 0.088 0.968 3 Rich in species 121 2.099 0.085 0.935 4 Refuge 121 2.091 0.086 0.949 5 Nature 121 2.000 0.086 0.949 6 Social 121 1.736 0.085 0.938 7 Culture 121 1.562 0.076 0.836 8
47

The respondents showed different perceptions of the eight sensory dimensions in the six sites (Figure 7). Based on the statistical analysis, it was found that green space categories were the most decisive factor for perception of the eight sensory dimensions. According to differing proportions of respondents in different sites, three scale levels for perceiving each sensory dimension were determined: Low (0-30%), Medium (31-70%) and High (71%-100%). G3, G4 and G5 urban forests were the sites that had more high perceptions of sensory dimensions. G3 had four, G4 and G5 had five sensory dimensions featuring in the ‘high level’ category (Table 8). Only prospect was perceived as a high sensory dimension in allotment garden G2 and residential green space G6. Ornamental park G1 was perceived as having three sensory dimensions in the ‘high level’ category, which were, serene, prospect and refuge. Nature and rich in species relating to biodiversity aspects were most frequently perceived in G3-G5 (Table 8).
Figure 7. Distribution patterns on perceptions of each sensory dimension in the six green spaces (G1-G6) (Proportion of respondents, %)
Paper III also revealed that gender and age had no significant influences on users’ perceptions of the eight sensory dimensions in the study area. Although the regression model on site and type of recreational use showed two differences, these differences could be explained by the uneven distribution of respondents engaged in different types of recreational activity between the six
0%
10%
20%
30%
40%
50%
60%
70%
80%
90%
100%
Serene Nature Rich inspecies
Space Prospect Refuge Social Culture
G1
G2
G3
G4
G5
G6
48

sites. This means that the perception of the eight sensory dimensions was consistent across respondents of different gender, age and type of recreational use, which gives validity to the use of the eight sensory dimensions as a methodological tool for landscape analysis and assessment.
Table 8. Three scale levels for perceptions of each sensory dimension in the six green spaces: low, medium and high.
Site Extent of perceptions of the eight sensory dimensions in the six green spaces
High Medium Low G1 Serene
Prospect Refuge
Nature Rich in species Space Culture
Social
G2 Prospect Serene Space Social
Nature Rich in species Refuge Culture
G3 Serene Nature Rich in species Prospect
Space Refuge Social
Culture
G4 Serene Nature Rich in species Space Prospect
Refuge Social Culture
G5 Serene Nature Rich in species Space Refuge
Prospect Social Culture
G6 Prospect Serene Refuge Social
Nature Rich in species Space Culture
49

5.4 On-site VEP study for exploration of the relationship between preference and real and perceived biodiversity (Paper IV)
Paper IV deals with the problems with the relationship between preferences and biodiversity in urban green spaces. This triangular relationship included three factors (Figure 8). The overall aim of Paper IV was to explore whether biodiversity is perceived and appreciated by people using urban green spaces for recreation. The study was guided by the following four research questions: 1) are people able to distinguish biologically rich environments in urban green spaces? 2) are biologically rich environments appreciated as part of urban green spaces? 3) are perceptions of biodiversity and preferences affected by previous ecological knowledge? and 4) how do perceptions and preferences compare with real biodiversity?
Figure 8. Triangular relationship between the three factors of the study.
In order to conduct a VEP study in a recreational park (RB), a walkable trail traversing the main part of the park was established. The park landscape around the trail was divided into four visually distinguishable habitat types (Figure 9): Habitat A) ornamental park; Habitat B) transition area; Habitat C) moist multi-layered woodland; Habitat D) dry single-layered woodland. The triangular relationship between preferences and real and perceived biodiversity was explored through the comparative analyses of a biodiversity assessment and photos taken by experts and lay people to capture their perception of high and low species richness and positive and negative preferences. The biodiversity level of each habitat type was evaluated within six parameters mainly focusing on plant species richness and vegetation structure. Assessment of preferences and perceived biodiversity were accomplished through the statistical analysis of differences in the number of photos of liked and disliked
Biodiversity
Recreational preference
Perceived biodiversity
50

features and of high and low perceived species richness. Photos and written comments were then categorized for comparison based on the picture motif and the written motivation.
Figure 9. Panoramic photos of the four habitats: Habitat A) Ornamental park; Habitat B) Transition between residential area and mature woodland; Habitat C) Moist multi-layered woodland in valley, Habitat D) Dry single-layered woodland on ridge. (photos by Stefan Lindberg)
The results of Paper IV showed that among the four habitat types from ornamental to wild-looking within the RB, their biodiversity levels were fairly consistent with the participants’ perceived species richness (Table 9), which indicated that people can correctly perceive differences in biodiversity between urban green space habitat types.
However, the results also showed the inconsistency between preferences and biodiversity (Table 9). The large percentage of alien species and high level of maintenance in Habitat A (ornamental park) contributed to its low biodiversity level, while the preference level was high in this area and
51

prompted the most photos of liked features in the study (Table 9). The transition zones between residential gardens and woodland (Habitat B) were of medium biodiversity level but with a lower number of preference photos. The moist multi-layered woodland type (Habitat C) was the only habitat to be seen as having a high biodiversity level in the assessment. The significant dominance of disliked features in Habitat C actually indicates a conflict between preferences and biodiversity (Table 9). Habitat D (simply structured woodland type) was of medium biodiversity level due to its containing relatively high numbers of indicator species, while the distribution of photos of liked and disliked features was almost even (Table 9). These inconsistent results indicated that high biodiversity levels did not relate positively to preferences, as half-open park areas were preferred to areas of more complex vegetation. However, negative preferences for these richer habitat types were related to the presence or execution of human interventions.
Based on comparisons of the photos and written comments between experts and lay people, the results of Paper IV also revealed the driving force and impact of ecological knowledge on perception and preferences (Table 10). The results showed that preferences and perception are mainly triggered by specific features rather than the overall scenery and character of the setting. Vegetation was the most common feature, both positive and negative, motivating people’s preferences and perception of species richness. Differences in attitude between experts and lay people reflected that they captured different ranges of biodiversity in their preferences and perception of species richness (Table 10), which indicated that ecological knowledge could have a positive influence on preference for certain aspects of biodiversity.
52

Table 9. Results of the triangular relationship between preference and real and perceived biodiversity based on paired T-test of photos allocated to the four habitats in relation to 1) average difference in the number of liked and disliked photos per participant; and 2) average difference in the number of high and low perceived species richness photos per participant (results of post hoc comparison of differences between the four habitats are indicated by diminutive letters.), and biodiversity score test for habitat type.
Habitat Type Characteristics of habitat Preference Perceived species richness Biodiversity level Liked Disliked P-value Level High Low P-value Level
Habitat A Ornamental park 64 29 0.000a Like 44 76 0.003b Low Low Habitat B Transition: residential area and mature
woodland 11 22 0.062b Dislike 35 19 0.034a High Medium
Habitat C Moist multi-layered woodland in valley 41 60 0.009a Dislike 93 44 0.000a High High Habitat D Dry single-layered woodland on ridge 24 29 0.510b Dislike 23 56 0.001b Low Medium
53

Table 10. Paired T-test for (1) the average difference in the number of liked and disliked photos per participants; (2) the average difference in the number of preference photos distributed between lay people and expert groups; (3) the average difference in the number of high and low perceived species richness photos; and (4) the average difference in the number of perceived species richness photos distributed between lay people and expert groups, for spatial configurations and content and for each of the seven categories.
Theme Preference Perceived species richness Liked Disliked P-value Lay people Experts P-value High Low P-value Lay people Experts P-value
Spatial configurations 69 20 0.000 31 58 0.003 72 36 0.000 68 40 0.126 Content 71 120 0.000 109 82 0.003 123 159 0.000 142 140 0.126 Main category Setting of natural elements 45 11 0.000 20 36 0.013 63 31 0.001 55 39 0.356 Setting of natural and anthropic elements
24 9 0.001 11 22 0.204 9 5 0.302 13 1 0.606
Natural elements 43 39 0.515 50 32 0.034 103 136 0.001 122 117 0.268 Anthropic elements 23 78 0.000 57 44 0.187 0 15 0.002 12 3 0.081 Combined elements 5 3 0.573 2 6 0.255 20 8 0.050 8 20 0.065 Human influence 3 12 0.017 12 3 0.036 2 29 0.000 11 19 0.157 Human reflections 96 102 0.541 105 93 0.389 126 46 0.000 72 102 0.006
54

6 Discussion In order to know whether the biotope mapping studies match people’s perception and preferences when dealing with the problem between biodiversity conservation and human recreation, comparisons across the individual papers’ results were discussed. Relevant methodological development and future research are also addressed.
6.1 Linking biotopes and the eight perceived sensory dimensions in urban green spaces
Due to the overlapping of the study area used (G1-G6) in Papers II-III and the conducting of biodiversity studies from ecological and social perspectives in Papers II-IV, it was considered that comparative analyses across the studies could provide another step in the analysis of relationship between biotopes and biodiversity respectively preferences and perceptions.
Interestingly, it was found that G1 (ornamental park), G2 (allotment) and G6 (residential green space) with few biotopes were perceived to have few sensory dimensions in the ‘high’ category (Table 6 and 8). These three sites were mainly dominated by open lawn areas with a high level of human maintenance. Conversely, G3-G5 (urban forests) with more biotopes had more ‘high’ sensory dimensions. The positive relationship between number of biotopes and number of ‘high’ sensory dimensions in G1-G6 was illustrated in Figure 10, which indicates that the more diverse biotopes an urban green space encompasses, the greater the number of ‘high’ sensory dimensions have been perceived. This is consistent with the findings from another study of urban green spaces where Tyrväinen et al. (2007) revealed that the sites valued the most by the respondents provide a lot of landscape variation, such as natural ones with open landscapes and diverse forest.
55

In this study, G3 is young, urban woodland being developed into a nature park by means of selective cutting, supplementary plantings of understory and field layers and the establishment of wetlands and a lake in the centre. G4 and G5 are mature urban woodlands with a mosaic of stands of varying age from more than 80 years to recently regenerated. However, G4 has a large proportion of open areas and G5 includes part of a pasture areas. These specific features with diverse biotopes represented at each site inducing the variations in landscape could be the main reason why G3-G5 were more frequently perceived in the ‘high’ category from the eight sensory dimensions.
Coincidentally, there is also a positive relationship between size and the number of high sensory dimensions of urban green space (Figure 11). G3-G5 were all much larger than G1, G2 and G6. Grahn et al. (2005) found that the perceived sensory dimensions most sensitive to size are serene, space, rich in species and nature, which are all associated with large size of areas. This finding is in agreement with our studies (Table 6 and 8). Together with the similar distribution patterns of G1-G6 in Figures 10 and 11, it indicates that the perceived sensory dimensions of urban green space could increase with the number of biotopes and size.
Figure 10. Positive correlation between number of biotopes and number of high perceived sensory dimensions (G1-G6).
0
1
2
3
4
5
6
0 1 2 3 4 5 6Number of Biotopes
G1
G3
G4
G5
G6 G2
Num
ber o
f hig
h pe
rcei
ved
sens
ory
dim
ensi
ons
56

Figure 11. Positive correlation between size of green space and number of high perceived sensory dimensions (G1-G6).
6.2 Linking biodiversity and the eight perceived sensory dimensions in urban green spaces
As for the perceived sensory dimensions related to biodiversity – nature and rich in species - it was found that they were more frequently perceived in urban forests (G3-G5) than in open green spaces (G1, G2 and G6), which reveals that urban forests were perceived to be the most natural areas and containing more species than others in the cities (Gobster, 1999; Yli-Pelkonen, 2013). It also reveals that naturalistic landscapes may provide greater benefits related to biodiversity for people than a formal ornamental style. Özgüner and Kendle (2006) concluded that some benefits of nature that actually come from a ‘naturalistic’ or ‘wild nature’ are better than a ‘formal nature’ in cities. However, our biotope mapping study showed that the biodiversity of urban forests varies with their vegetation structure. G5 has higher species richness than G3-G4 due to its feature of long continuity with old and well-stratified vegetation. The comparison relating to biodiversity between Papers II and III seems to give us a hint that assessed biodiversity by expert measurements and perceived biodiversity by lay people are related but not equivalent.
0
1
2
3
4
5
6
0 10 20 30 40 50 60
Num
bero
fhig
hpe
rcei
ved
sens
ory
dim
ensi
ons
Size of green space (ha)
G6 G2
G1
G3
G4
G5
57

Biodiversity as a concept is interpreted differently by different stakeholders (DeLong, 1996), and studies that above for more in-depth analysis of their relationship is needed. This point, together with the impact of preferences on using urban green spaces for recreation, is the rationale behind Paper IV. In Paper IV, it was found that the assessed and perceived biodiversity of a multi-layered mature forest was higher than open lawn areas (Table 9). This is consistent with comparisons in Papers II-III, which indicate that people can reasonably accurately perceive species richness (Fuller et al., 2007). Several studies suggested that only when people are aware of the biodiversity level are they likely to display higher preferences for high biodiversity settings (Gobster, 1994; Hands & Brown, 2002), and would therefore willingly support biodiversity conservation (Vodouhe et al., 2010).
6.3 Linking preference and the eight perceived sensory dimensions in urban green spaces
Although G1 in paper III and Habitat A in paper IV respectively and G5 in paper III and Habitat C in paper IV represent different sites, they were of a similar size and biotope composition i.e. ornamental parks with open lawn area and multi-layered wild forests (Table 6 and 9). Therefore, a preference comparison across their results was considered worthwhile.
Paper IV found no positive relationship between preference and biodiversity. The ornamental park (Habitat A) and the moist multi-layered forest (Habitat C) showed a strong negative relationship between preference and biodiversity. Habitat A, with the lowest assessed biodiversity, was the only habitat type people preferred to use for recreation, while Habitat C with the highest biodiversity value received the most negative preference comments (Table 9). The study confirmed previous research suggesting a high preference for an ornamental type of landscape. Chiesura (2004) argued that ornamental landscape types are always strongly valued by urban people who have been repeatedly subjected to the neat and tidy appearance of flowerbeds and mown grass. As for Habitat C, participant sensitivity to the way human interventions were positioned in this context of a ‘natural’ setting is the most probable explanation for its negative preference.
However, in Paper III, G1 (ornamental park) was less frequently perceived to have sensory dimensions than G5 (urban forest with more complex structures) (Table 8). This might imply that the popularity of green space is not related to the number of perceived sensory dimensions. People do recognise the eight sensory dimensions in different urban green spaces but it doesn’t mean that an attractive environmental setting should be perceived to
58

have more sensory dimensions. This could appear to contradict the claim made in a previous study that the popularity of a green space increases the more perceived sensory dimensions it encompasses (Peschardt & Stigsdotter, 2013). Given that the comparison was confined to limited samples and not conducted in the same study, this presumption needs further examination.
6.4 Methodological development for urban biodiversity conservation and human recreation
The work described in this thesis intended to use and develop three different methods from ecological and social perspectives to explore biodiversity and recreational values in urban green spaces: biotope mapping, the eight perceived sensory dimensions and Visitor-Employed Photography (VEP).
Paper I and II focused on developing biotope mapping for exploration of more biodiversity values in urban green spaces. Our results showed that modified biotope mapping involving temporal and spatial structural variables can be used as an indicator tool for biodiversity levels in urban green spaces. Compared with traditional biotope mapping for detection of the quality of habitats, the modified one could be more biodiversity-oriented and easier to identify diversely structured biotopes. The collected biotope information will be of great importance as a data basis for urban biodiversity development. For instance, (1) the areas with long continuity and aged trees should be given more attention to avoid deterioration or loss, since they make a significant contribution to urban biodiversity and people’s appreciation (Kirby & Goldberg, 2002). The quality of urban fauna could be enriched by changing the design and management of urban green spaces. The target animal’s favourite vegetation structures could be imitated to meet requirements for both enhancing biodiversity and recreational purposes. In order to obtain trustworthy results from existing data bases used by decision-makers, a timely update of current biotope maps is necessary due to the constantly changing pattern of the urban landscape (Bochow et al., 2010). Rapidly remote sensing techniques together with advanced image processing methods can offer new possibilities for updating biotope maps (Bock, 2003; Bochow et al., 2010).
Paper III is the first to validate the eight perceived sensory dimensions as an assessment tool for mapping of lay people’s self-reported perceptions of urban green spaces, and to examine the representation of the sensory dimensions in different types of green space. It was found that the frequency of the perception of the eight sensory dimensions was different in differing urban green spaces settings. This might indicate that the respondents did not use the sensory dimensions to describe their perceptions of the green space purely for its
59

attributes, but also in relation to the surrounding cityscape. People’s inherent cognitions of green spaces, for instance, the green spaces allowed for larger sight depth and freer movement full of calmness and less noise, could explain why prospect, serene and space were the most commonly perceived sensory dimensions in this study (Kaplan & Kaplan, 1989; Hartig et al., 1997). In contrast to this, social and cultural were quite rarely perceived, probably due to the absence of well-organised rooms designated for social activities and a lack of monuments in the studied areas (Grahn & Stigsdotter, 2010). The consistency across the respondents’ perceptions of urban green spaces gives validity to use of the eight perceived sensory dimensions as a landscape assessment tool for determination of the recreational quality of urban green spaces. It means that people can perceive recreational qualities in urban green spaces through eight dimensions. Each dimension is furthermore associated with various recreational and outdoor activities (Lindholst et al., 2013).
Paper IV conducted a VEP study to explore the relationship between preferences and assessed and perceived biodiversity. The VEP method revealed on-site perception and preference to be highly context-specific, mainly triggered by specific features rather than the overall scenery and character of the setting. One possible explanation is that people expect a certain order of things in any given setting, for example a level of naturalness or tidiness, while an order is easily disrupted by features that are considered out of character (Kaplan & Kaplan, 1989). Specific features of urban green spaces would therefore be easier to identify and use as motivation for preference. The VEP study also revealed that people with a greater knowledge of ecosystems are more likely to prefer ecologically sustainable landscapes. Potential environmental education may increase the ability of green space users to appreciate elements of the natural environment (Gobster et al., 2007).
Gundersen and Frivold (2008) concluded that preference studies should favour visual methods, possibly combined with the stimulation of more senses than vision. The VEP method showed the potential for capturing and analysing people’s preferences for scenery. The findings of the VEP study could be an important contribution to the continued development of methods for exploring the relationship between preferences and biodiversity.
6.5 Conclusion and proposed future research
The results of this thesis work have shown that it is possible to link biodiversity and recreational merits of urban green spaces through several useful tools for measuring trade-offs and synergies between biodiversity conservation and human recreation. Biodiversity values in urban green spaces
60

can be explored through a modified biotope mapping tool involving vegetation structures. The eight perceived sensory dimensions can be used as a landscape assessment tool for mapping people’s recreational experience of urban green spaces and can also be linked to the study of biotopes. The on-site VEP study reflected that preference is not positively related to high biodiversity. The perceptions associated with biodiversity were closely linked to the participants’ attitudes towards urban green space management. A more conscious and site-specific approach to urban green space design and management should be taken into account, focusing on coherence, particularly in areas of remnant vegetation and other long-continuity habitats with natural character.
As the relationship between green space qualities and perceptions and preferences across landscapes have received relatively little attention, hopefully this work will contribute to creating a new interest in linking qualities of urban green spaces from biodiversity and recreational aspects. Stronger evidence and valid recommendations can be given to policy makers and urban green space designers and managers concerning trade-offs and synergies between biodiversity conservation and recreation provision, if future research can develop these novel results in more depth and across the individual case studies, i.e. exploring links between biotope and the perceived sensory dimensions of urban green spaces and links between preferences, biodiversity and the perceived sensory dimensions. The fact that this case study approach was confined to one Swedish city and a limited number of participants, may be considered an oversight, as geographical or cultural differences may have endowed the population involved with a different set of perceptions and preferences (Lindholst et al., 2013). Further investigation within different contexts and with different green space users should be examined.
61

62

7 References Alberti, M. (2009). Advances in urban ecology: Integrating humans and ecological processes in
urban ecosystems. New York: Springer-Verlag. Appleton, J. (1996). The experience of landscape. Revised edition. New York: Wiley & Sons. Berlyne, D.E. (1970). Novelty, complexity, and hedonic value. Perception & Psychophysics, 8(5),
279-286. Bezák, P. & Lyytimäki, J. (2011). Complexity of urban ecosystem services in the context of
global change. Ecologia Bratislava, 30(1), 22-35. Bixler, R.D. & Floyd, M.F. (1997). Nature is scary, disgusting, and uncomfortable.
Environmental and Behavior, 29(4), 443-467. Bochow, M., Peisker, T., Roessner, S., Segl, K. & Kaufmann, H. (2010). Towards an automated
update of urban biotope maps using remote sensing data: What is possible? In: Müller, N., et al. (eds.) Urban Biodiversity and Design. Oxford: Wiley-Blackwell, pp. 255-272.
Bock, M. (2003). Remote sensing and GIS-based techniques for the classification and monitoring of biotopes: Case examples for a wet grass-and moor land area in Northern Germany. Journal of Nature Conservation, 11(3), 145-155.
Bowler, D.E., Buyung-Ali, L., Knight, T.M. & Pullin, A.S. (2010). Urban greening to cool towns and cities: A systematic review of the empirical evidence. Landscape and Urban Planning, 97(3), 147-155.
Brown, C. & Grant, M. (2005). Biodiversity and human health: What role for nature in healthy urban planning. Built Environment, 31(4), 326-338.
Burgess, J., Harrison, C.M. & Limb, M. (1988). People, parks and the urban green: a study of popular meanings and values for open spaces in the city. Urban Studies, 25(6), 455–473.
Cavanagh, J.A.E., Zawar-Reza, P. & Wilson, J.G. (2009). Spatial attenuation of ambient particulate matter air pollution within an urbanised native forest patch. Urban Forestry and Urban Greening, 8(1), 21-30.
Chiesura, A. (2004). The role of urban parks for the sustainable city. Landscape and Urban Planning, 68(1), 129-138.
63

Cilliers, S.S., Müller, N. & Drewes, E. (2004). Overview on urban nature conservation: situation in the western-grassland biome of South Africa. Urban Forestry and Urban Greening, 3(1), 49-62.
Clark, M. (2005). The compact city: European ideal, global fix or myth? Global Built Environment Review, 4(3), 1-11.
Coles, R.W. & Bussey, S.C. (2000). Urban forest landscapes in the UK – Progressing the social agenda. Landscape and Urban Planning, 52(2-3), 181-188.
Cornelis, J & Hermy, M. (2004). Biodiversity relationships in urban and suburban parks in Flanders. Landscape and Urban Planning, 69(4), 385-401.
Crewe, K. (2001). Linear parks and urban neighbourhoods: A study of the crime impact of the Boston South-west Corridor. Journal of Urban Design, 6(3), 245-264.
Crompton, J.L. (2001). The impact of parks on property values: A review of the empirical evidence. Journal of Leisure Research, 33(1), 1-31.
Davies, Z.G., Edmondson, J.L., Heinemeyer, A., Leake, J.R. & Gaston, K.J. (2011). Mapping an urban ecosystem service: Quantifying above-ground carbon storage at a city-wide scale. Journal of Applied Ecology, 48(5), 1125-1134.
Dearden, P. (1981). Public participation and scenic quality analysis. Landscape Planning, 8(1), 3-19.
Dearborn, D.C. & Kark, S. (2010). Motivations for conserving urban biodiversity. Conservation Biology, 24(2), 432-440.
DeLong, D.C. (1996). Defining Biodiversity. Wildlife Society Bulletin, 24(4), 738-749. Domhardt, K.S. (2012). The garden city idea in the CIAM discourse on urbanism: A path to
comprehensive planning. Planning Perspectives, 27(2), 173-197. Dorwart, C.E., Moore, R.L. & Leung, Y.F. (2006). Visitor’s perceptions of a trail environment
and effects on experiences: A model for nature-based recreation experiences. Leisure Sciences, 32(1), 33-54.
Elander, I., Lundgren Alm, E., Malbert, B. & Sandström, U.G. (2005). Biodiversity in urban governance and planning: Examples from Swedish cities. Planning Theory and Practice, 6(3), 283-301.
Farinha-Marques, P., Lameiras, J.M., Fernandes, C., Silva, S. & Guilherme, F. (2011). Urban biodiversity: A review of current concepts and contributions to multidisciplinary approaches. Innovation: The European Journal of Social Science Research, 24(3), 247-271.
Flodmark, S. (2004). Sorgenfri industrial area: An analysis of spatial and landscape qualities (Sorgenfri industriområde: En analys av områdets kvaliteter i form av rumskaraktärer), Stadsbyggnadskontoret, Malmö.
Flyvbjerg, B. (2006). Five misunderstandings about case-study research. Qualitative Inquiry, 12(2), 219-245.
Francis, M. (2001). A case study method for landscape architecture. Landscape Journal, 20(1), 15-29.
64

Fuller, R.A., Irvine, K.N., Devine-Wright, P., Warren, P.H. & Gaston, K.J. (2007). Psychological benefits of greenspace increase with biodiversity. Biology Letters, 3(4), 390-394.
Gao, T., Qiu, L., Hammer, M. & Gunnarsson, A. (2012). The importance of temporal and spatial vegetation structure information in biotope mapping schemes: A case study in Helsingborg, Sweden. Environmental Management, 49 (2), 459-472.
Garden, J., McAlpine, C., Peterson, A., Jones, D. & Possingham, H. (2006). Review of the ecology of Australian urban fauna: A focus on spatially explicit processes. Austral Ecology, 31(2): 126-148.
Gobster, P.H. (1994). The urban savanna: Reuniting ecological preference and function. Ecological Restoration, 12(1), 64-71.
Gobster, P.H. (1999). An ecological aesthetic for forest landscape management. Landscape Journal, 18(1), 54-64.
Gobster, P.H. (2001). Visions of nature: conflict and compatibility in urban park restoration. Landscape and Urban Planning, 56(1-2), 35-51.
Gobster, P.H., Nassauer, J.I., Daniel, T.C. & Fry, G. (2007). The shared landscape: what does aesthetics have to do with ecology? Landscape Ecology, 22(7), 959-972.
Godefroid, S. & Koedam, N. (2003). How important are large vs. small forest remnants for the conservation of the woodland flora in an urban context? Global Ecology and Biogeography, 12(4). 287-298.
Grahn, P. (1991). Landscapes in our minds: people’s choice of recreative places in towns. Landscape Research, 16(1), 11-19.
Grahn, P., Stigsdotter, U. & Berggren-Bärring, A.M. (2005). Human issues: eight experienced qualities in urban open spaces. (Green structure and urban planning Final report of COST Action C, 2005: 11). Luxembourg: Office for Official Publications of the European Communities.
Grahn, P. & Stigsdotter, U.K. (2010). The relationship between perceived sensory dimensions of urban green space and stress restoration. Landscape and Urban Planning, 94(3-4), 264-275.
Grimm, N.B., Faeth, S.H., Golubiewski, N.E., Redman, C.L., Wu, J.G., Bai, X.M., & Briggs, J.M. (2008). Global change and the ecology of cities. Science, 319 (5864), 756-760.
Gundersen, V.S. & Frivold, L.H. (2008). Public preferences for forest structures: A review of quantitative survey from Finland, Norway and Sweden. Urban Forestry and Urban Greening, 7(4), 241-258.
Gyllin, M. & Grahn, P. (2005). A semantic model for assessing the experience of urban biodiversity. Urban Forestry and Urban Greening, 3(3-4), 149-161.
Haines-Young, R. & Potschin, M. (2010). The links between biodiversity, ecosystems services and human well-being. In: Raffaelli, D. & Frid, C. (eds.) Ecosystem Ecology: A new synthesis. Cambridge: Cambridge University Press, pp.1-31.
Hands, D.E. & Brown, R.D. (2002). Enhancing visual preference of ecological rehabilitation sites. Landscape and Urban Planning, 58(1), 57-70.
65

Haq, S.M.A. (2011). Urban green spaces and an integrative approach to sustainable environment. Journal of Environmental Protection, 2(5), 601-608.
Hartig, T., Kaiser, F.G. & Bowler, P.A. (1997). Further development of a measure of perceived environmental restorativeness. (Arbetsrapport, 1997: 5). Uppsala : Institutet för bostadsforskning, Uppsala Universitet. Available at: http://uu.diva-portal.org/smash/get/diva2:130237/FULLTEXT01.pdf
Heyman, E. (2012). Analysing recreational values and management effects in an urban forest with the visitor-employed photography method. Urban Forestry and Urban Greening, 11(3), 267-277.
Home, R., Hunziker, M. & Bauer, N. (2012). Psychosocial outcomes as motivations for visiting nearby urban green spaces. Leisure Sciences, 34(4), 350-365.
Hong, S.K., Song, I.J., Byun, B., Yoo, S. & Nakagoshi, N. (2005). Applications of biotope mapping for spatial environmental planning and policy: case studies in urban ecosystems in Korea. Landscape and Ecological Engineering, 1(2), 101-112.
Hudson, B.J. (1992). Hunting or a sheltered life: prospects and refuges reviewed. Landscape and Urban Planning, 22(1), 53-57.
Hunter, I.R. (2001). What do people want from urban forestry? – The European experience. Urban Ecosystems, 5(4), 277-284.
Johansson, R. (2005). On case study methodology. In: Vestbro, D.U., et al. (eds.) Methodologies in Housing Research. UK: The Urban International Press, pp. 30-39.
Junker, B. & Buchecker, M. (2008). Aesthetic preferences versus ecological objectives in river restorations. Landscape and Urban Planning, 85(3-4), 141-154.
Kaplan, S. (1988). Perception and landscape: Conceptions and misconceptions. In: Nasar, J.L., (ed.) Environmental aesthetics: Theory, research and application. Cambridge: Cambridge University Press, pp.45-55.
Kaplan, R. (1992). The psychological benefits of nearby nature. In: Relf, D. (ed.) The role of horticulture in human well-being and social development. Portland: Timber Press, pp. 125–133.
Kaplan, R. & Kaplan, S. (1989). The experience of nature: A psychological perspective. New York: Cambridge University Press.
Kaplan, S. (1995). The restorative benefits of nature: Towards an integrative framework. Journal of Environmental Psychology, 15, 169-182.
Kaymaz Cakci, I. (2012). Landscape perception. In: Ozyavuz, M. (ed.) Landscape planning. Croatia: InTech, pp. 251-276. Available at: http://www.intechopen.com/books/landscape-planning/landscape-perception
Keniger, L.E., Gaston, K.J., Irvine, K.N. & Fuller, R.A. (2013). What are the benefits of interacting with nature? International Journal of Environmental Research and Public Health, 10(3), 913-935.
66

Kinzig, A.P., Warren, P., Martin, C., Hope, D. & Katti, M. (2005). The effects of human socioeconomic status and cultural characteristics on urban patterns of biodiversity. Ecology and Society, 10(1), 23.
Kirby, K. & Goldberg. E. (2002). Ancient woodland: guidance material for local authorities. Peterborough: English Nature.
Konijnendijk, C.C. (1999). Urban forestry in Europe: A comparative study of concepts, policies and planning for forest conservation, management and development in and around major European cities. Diss. Joensuu: University of Joensuu.
Konijnendijk, C.C., Annerstedt, M., Maruthaveeran, S. & Nielsen, A.B. (2013). Benefits of urban parks – A systematic review of the evidence. (A report for International Federation of Parks and Recreation Administration, IFPRA). Copenhagen & Alnarp: University of Copenhagen and Swedish University of Agricultural Sciences.
Kurz, T. & Baudains, C. (2012). Biodiversity in the front yard: An investigation of landscape preference in a domestic urban context. Environment and Behavior, 44(2), 166-196.
Kyttä, M., Kahila, M., 2005. The perceived quality factors of the environment and their ecoefficient accessibility. In: Gallis, C.Th. (ed.), Forests, trees and human health and wellbeing. Proceeding of the 4th International QMOD Conference, Thessaloniki, 13-15 October, 2005, Greece. Medical and Scientific Publishers, pp. 337-351.
Lafortezza, R., Corry, R.C., Sanesi, G. & Brown, R.D. (2008). Visual preference and ecological assessments for designed alternative brownfield rehabilitations. Journal of Environmental Management, 89(3), 257-269.
Lindholst, A.C., Dempsey, N. & Burton, M. (2013). Introducing a method for mapping recreational experience. Proceedings of the ICE – Urban Design and Planning, 166(5), 296-308.
Maas, J., van-Dillen, S.M.E., Verheij, R.A. & Groenewegen, P.P. (2009). Social contacts as a possible mechanism behind the relation between green space and health. Health and Place, 15(2), 586-595.
Mace, G.M., Norris, K. & Fitter, A.H. (2012). Biodiversity and ecosystem services: A multilayered relationship. Trends in Ecology and Evolution, 27(1), 19-25.
Maikov, K., Bell, S. & Sepp, K. (2008). An evaluation of the design of room characteristics of a sample of healing gardens. In: Brebbia, C.A. (ed.) Design and Nature IV. Southampton: WIT Press, pp. 223-232.
Malek, N.A., Mariapan, M., Mohd Shariff, M.K. & Aziz, A. (2011). Assessing the needs for quality neighborhood parks. Australian Journal of Basic and Applied Sciences, 5(10), 743-753.
Millennium Ecosystem Assessment (MEA). (2005). Ecosystems and human well-being: Biodiversity synthesis. Washington: World Resource Institute (WRI).
Millward, A. (2001). How green is your doorstep? ECOS, 22(3-4), 2-6. Mitchell, R. (2013). Is physical activity in natural environments better for mental health than
physical activity in other environments? Social Science and Medicine, 91, 130-134.
67
Mostyn, B. (1979). Personal benefits and satisfactions derived from participation in urban wildlife projects: A qualitative evaluation undertaken by social and community planning research on behalf of the nature conservancy council. Shrewsbury: Nature Conservancy Council.
Muratet, A., Machon, N., Jiguet, F., Moret, J. & Porcher, E. (2007). The role of urban structures in the distribution of wasteland flora in the greater paris area, France. Ecosystems, 10(4), 661-671.
Nassauer, J.I. (1995). Messy ecosystem, orderly frames. Landscape Journal, 14(2), 161-170. Nielsen, A.B., Heyman, E. & Richnau, G. (2012). Liked, disliked and unseen forest attributes:
Relation to modes of viewing and cognitive constructs. Journal of Environmental Management, 113(30), 456-466.
Nielsen, A.B., van den Bosch, M., Maruthaveeran, S. & van den Bosch, C.K. (2013). Species richness in urban parks and its drivers: A review of empirical evidence. Urban Ecosystems, DOI 10.1007/s11252-013-0316-1. 1-23.
Nielsen, T.S. & Hansen, K.B. (2007). Do green areas affect health? Results from a Danish survey on the use of green areas and health indicators. Health and Place, 13 (4), 839-850.
Niemelä, J., Saarela, S.R., Söderman, T., Kopperoinen, L., Yli-Pelkonen, V., Väre, S. & Kotze, D.J. (2010). Using the ecosystem services approach for better planning and conservation of urban green spaces: a Finland case study. Biodiversity and Conservation, 19(11), 3225-3243.
Næss, P. (2000). Fysisk planlegging og bæredyktig utvikling. (Physical planning and sustainability) In Naturpolitik (2000): Dansk naturpolitik – i bæredygtighedens perspektiv (Danish nature policy – in the perspective of sustainability). Copenhagen: Danish Nature Council, pp. 132-147.
Oku, H. & Fukamachi, K. (2006). The differences in scenic perception of forest visitors through their attributes and recreational activity. Landscape and Urban Planning, 75(1-2), 34-42.
Özgüner, H. & Kendle, A.D. (2006). Public attitudes towards naturalistic versus designed landscapes in the city of Sheffield (UK). Landscape and Urban Planning, 74(2), 139-157.
Parsons, R. (1995). Conflict between ecological sustainability and environmental aesthetics: Conundrum canärd or curiosity. Landscape and Urban Planning, 32(3), 227-244.
Pataki, D.E., Carreiro, M.M., Cherrier, J., Grulke, N.E., Jennings, V., Pincetl, S., Pouyat, R.V., Whitlow, T.H. & Zipperer, W.C. (2011). Coupling biogeochemical cycles in urban environments: Ecosystem services, green solutions, and misconceptions. Frontiers in Ecology and the Environment, 9(1), 27-36.
Peschardt, K.K. & Stigsdotter, U.K. (2013). Associations between park characteristics and perceived restorativeness of small public urban green spaces. Landscape and Urban Planning, 112(1), 26-39.
Pinna, S., Varady-Szabo, H., Boivin, P. & Lucas, E. (2009). Relevance of using a vegetation-based method to conserve urban carabid diversity. Journal of Insect Conservation, 13(4), 387-397.
68

Qiu, L. (2011). 生态单元和社会单元制图在城市绿地规划中的应用. (The application of biotope and sociotope mapping in urban green areas planning). Diss. Yangling: Northwest A&F University.
Qiu, L., Gao, T., Gunnarsson, A., Hammer, M & von Bothmer, R (2010). A methodological study of biotope mapping in nature conservation. Urban Forestry and Urban Greening, 9(2), 161-166.
Qiu, L., Lindberg, S. & Nielsen, A.B. (2013). Is biodiversity attractive? – On-site perception of recreational and biodiversity values in urban green space. Landscape and Urban Planning, 119, 136-146.
Region of Southern Denmark, (2011). Bynær rekreativ nature ̶ I Region Syddanmark (Nature for recreation in and around cities ̶ In Region of Southern Denmark).
Righini, P. (2000). Thinking architecturally: An introduction to the creation of form and place. South Africa: University of Cape Town Press.
Roth, M. & Gruehn, D. (2012). Visual landscape assessment for large areas – using GIS, internet surveys and statistical methodologies in participatory landscape planning for the federal state of mecklenburg-western pomerania, Germany. Proceedings of the Latvian Academy of Sciences, Section A: Humanities and Social Sciences, 66 (3), 129-142.
Rose, F. (1976). Lichenological indicators of age and environmental continuity in woodlands. In: Brown, D.H., et al. (eds.) Lichenology: Progress and problems. New York: Academic Press, pp. 279-307.
Sandström, U.G. (2002). Green infrastructure planning in urban Sweden. Planning Practice and Research, 17(4), 373-385.
Schadek, U., Strauss, B., Biedermann, R. & Kleyer, M. (2009). Plant species richness, vegetation structure and soil resources of urban brownfield sites linked to successional age. Urban Ecosystems, 12(2), 115-126.
Schreyer, R. & Lime, D.W. (1984). A novice isn’t necessarily a novice – the influence of experience on subjective perceptions of recreation participation. Leisure Sciences, 6(2), 131-149.
Shih, W.Y., Handley, J. & White, I. (2009). Mapping biotope and sociotope for green infrastructure planning in urban areas. In: Schrenk, M., et al., (eds.) REAL CORP 2009: CITIES 3.0 – Smart, Sustainable, Integrative. Proceedings of the 14th International Conference on Urban Planning, Regional Development and Information Society. Centre de Disseny de Sitges 22-25 April, 2009, Spain.
Skärbäck, E. (2007). Landscape planning to promote well being: Studies and examples from Sweden. Environmental Practice, 9(3), 206-217.
Stigsdotter, U.K., Ekholm, O., Schipperijn, J., Toftager, M., Kamper-Jørgensen, F. & Randrup, T.B. (2010). Health promoting outdoor environments – Associations between green space, and health, health-related quality of life and stress based on a Danish national representative survey. Scandinavian Journal of Public Health, 38(4), 411-417.
69

Stokes, D.L. (2007). Things we like: Human preferences among similar organisms and implications for conservation. Human Ecology, 35(3), 361-369.
Ståhle, A. & Sandberg, A. (2002). Sociotop som redskap I grönomarådeplaneringen. (Stockholms Stadsbyggnadskontor Rapport, 2002: 4). Stockholm: Stockholms Stadsbyggnadskontor.
Sukopp, H. & Weiler, S. (1988). Biotope mapping and nature conservation strategies in urban areas of the Federal Republic of Germany. Landscape and Urban Planning, 15(1-2), 39-58.
Tilghman, N.G. (1987). Characteristics of urban woodlands affecting breeding bird diversity and abundance. Landscape and Urban Planning, 14, 481-495.
Tyrväinen, L., Mäkinen, K. & Schipperijn, J. (2007). Tools for mapping social values of urban woodlands and other green areas. Landscape and Urban Planning, 79(1), 5-19.
UNEP, 1995. Global Biodiversity Assessment. Cambridge: Cambridge University Press. United Nations. (1992). Convention on biological diversity. Rio de Janeiro: United Nations.
Available at: http://www.cbd.int/convention/text/ Ulrich, R.S., Simons, R.F., Losito, B.D., Fiorito, E., Miles, M.A. & Zelson, M. (1991). Stress
recovery during exposure to natural and urban environments. Journal of Environmental Psychology, 11(3): 201-230.
Uzzell, D.L. (2000). The psycho-spatial dimension of global environmental problems. Journal of Environmental Psychology, 20(4), 307-318.
Van Herzele, A. & Wiedemann, T. (2003). A monitoring tool for the provision of accessible and attractive urban green spaces. Landscape and Urban Planning, 63(2), 109-126.
Vodouhe, F.G., Coulibaly, O., Adegbidi, A. & Sinsin, B. (2010). Community perception of biodiversity conservation within protected areas in Benin. Forest Policy and Economics, 12(7), 505-512.
Weber, D. & Anderson, D. (2010). Contact with nature: recreation experience preferences in Australian parks. Annals of Leisure Research, 13(1/2), 46-49.
Weiers, S., Bock, M., Wissen, M. & Rossner, G. (2004). Mapping and indicator approaches for the assessment of habitats at different scales using remote sensing and GIS methods. Landscape and Urban Planning, 67(1-4), 43-65.
Werner, P. (1999). Why biotope mapping in populated areas? In: Reumer, J.W.F. & Epe, M.J. (eds.) Biotope Mapping in the Urban Environment. Rotterdam: Deinsea 5, pp. 9-26.
Werner, P. & Zahner, R. (2010). Urban patterns and biological diversity: A review. In: Müller, N., et al. (eds.) Urban biodiversity and design. Oxford: Wiley-Blackwell, pp. 145-173.
Thompson, C.W., Aspinall, P., Bell, S. & Findlay, C. (2005). It gets you away from everyday life: Local woodlands and community use, what makes a difference? Landscape Research, 30(1) 109-146.
Thompson, C.W., Roe, J., Aspinall, P., Mitchell, R., Clow, A. & Miller, D. (2012). More green space is linked to less stress in deprived communities: Evidence from salivary cortisol patterns. Landscape and Urban Planning, 105(3), 221-229.
70

Yilmaz, B., Gulez, S. & Kaya, L.G. (2010). Mapping of biotopes in urban areas: A case study of the city of Bartin and its environs, Turkey. Scientific Research and Essays, 5(4), 352-365.
Yin, R.K. (1994). Case study research: Design and methods. 2. ed. Thousand Oaks: Sage. Yli-Pelkonen, V. (2013). Importance of recreational ecosystem services in Helsinki, Finland.
Management of Environmental Quality, 24 (3), 365- 382. Young, J., Watt, A., Nowicki, P., Alard, D., Clitherow, J., Henle, K., Johnson, R., Laczko, E.,
McCracken, D., Matouch, S., Niemela, J. & Richards, C. (2005). Towards sustainable land use: identifying and managing the conflicts between human activities and biodiversity conservation in Europe. Biodiversity and Conservation, 14(7), 1641-1661.
Zube, E.H., Sell, J.L. & Taylor, J.G. (1982). Landscape perception: Research, application and theory. Landscape Planning, 9(1): 1-33.
71

72

8 Acknowledgements It would not have been possible to finish this thesis without the help and support of the kind people around me. Due to various complications, my PhD study experience has not been straightforward and I am very grateful to all of you in my department at SLU, Alnarp, but would also like to make a few particular mentions. First of all, I would like to thank my main supervisor, Anders Busse Nielsen, for his scientific advice and knowledge and many insightful discussions and suggestions and especially for his encouragement, critical thinking and confidence in me when I had doubts. He is a great supervisor on both an academic and a personal level. His enthusiasm, patience, optimism and conscientiousness have left a lasting impression. I am also very grateful to my co-supervisors Allan Gunnarsson and Mårten Hammer for their time, flexibility, ideas and constant support. I daresay that without Allan giving me an opportunity to study at Alnarp, I would definitely have missed a fabulously exotic journey in Sweden. Mårten, your hospitality always makes me feel at home. My special thanks should also be given to my previous main supervisor Roland von Bothmer for accepting me as a registered PhD student at SLU. I want to thank the Chinese Scholarship Council and Northwest A&F University and my department at Alnarp for financial support. I also appreciate Paul Jensén’s help to prolong my scholarship from Northwest A&F University to allow me to successfully finish my PhD study at Alnarp. My sincere thanks go to Tim Delshammar, Anders Kristoffersson and Cecil Konijnendijk for supporting my work at all times. Tim, thanks for your recommendation to Malmö municipality, which gave me a unique experience as a guide working at Shanghai Expo 2010. Life as a doctoral student has been promising if hard, but has always been improved by nice colleagues both in my department and other departments at Alnarp. A special thank goes to Anna Maria Palsdottir, Matilda Van Den Bosch, Patrik Grahn, Jan-Eric Englund, Helena Mellqvist, Björn Wiström,
73

Gustav Richnau, Cheng Chang, Gunnar Cerwén, Johan Pihel and Yanrong Lv for taking the time to discuss research strategies and data treatment with me. Mats Gyllin added many relevant aspects as opponent at my final seminal, as did Fredrika Mårtensson. Stefan Lindberg has been a good collaborator and discussion partner. I especially want to thank Märit Jansson, Anna Levinsson and Hanna Fors for sharing the joys and hardship of being a PhD mother. Our landscape babies’ get-togethers meant a lot to me. Åsa Bensch, your frequently working late meant I never felt “alone in the castle”. Also I would like to thank my friends in both Sweden and China: Yan Liu, Xing Fan, Cairong Chen, Gang Zhang, Niclas Danielsson, Mattew Pohl and Chunli Liu, for all the fun we have had in the last five years and for your help and support. Last but by no means least, I would like to thank my parents for giving me endless support in life and spirit. To help me focus on finalising this thesis, they and my mother in-law have sacrificed their time to help me to take care of my daughter Emeli. I can never repay their kindnesses to me except through completion of this doctoral thesis. To my husband Tian Gao, I just want to say – thank you for being you. To my lovely Emeli, I think you are my life’s greatest achievement.
Alnarp, 15th January, 2014 Ling Qiu
74