life cycle assessment for residential buildings: a ... cycle assessment for residential buildings: a...
TRANSCRIPT
Concrete Sustainability Hub Massachusetts Institute of Technology
Life Cycle Assessment for Residential Buildings: A Literature Review and Gap Analysis March 12, 2013 Randa Ghattas Jeremy Gregory Elsa Olivetti Suzanne Greene Concrete Sustainability Hub Massachusetts Institute of Technology 77 Massachusetts Avenue MIT Room 1-372 Cambridge MA 02139

Life Cycle Assessment for Residential Buildings March 2013
Concrete Sustainability Hub Page 1 Massachusetts Institute of Technology
TABLE OF CONTENTS EXECUTIVE SUMMARY .................................................................................... 2 INTRODUCTION ................................................................................................ 5 SIMILARITIES AND DIFFERENCES IN LCA DESIGN ........................................... 5
Functional unit ................................................................................................................. 5 Lifetime ........................................................................................................................... 6 System Boundaries .......................................................................................................... 6 Materials Under Consideration ....................................................................................... 8 Data sources .................................................................................................................... 8
RESULTS .......................................................................................................... 8 Quantitative Results ........................................................................................................ 8 Qualitative Results ........................................................................................................ 10
CONCLUSIONS ............................................................................................... 12 REFERENCES .................................................................................................. 13 Appendix A: Excerpt of quantitative data from literature ............................ 15 Appendix B: Glossary of Terms ................................................................... 19
Acknowledgments This research was carried out by the CSHub@MIT with sponsorship provided by the Portland Cement Association (PCA) and the Ready Mixed Concrete (RMC) Research & Education Foundation. Thank you to our reviewers, Donn Thompson (PCA) and Tien Peng (NRMCA), for their thoughtful input.

Life Cycle Assessment for Residential Buildings March 2013
Concrete Sustainability Hub Page 2 Massachusetts Institute of Technology
EXECUTIVE SUMMARY
As global populations swell, particularly in urban areas, sustainable housing development has become a major worldwide initiative. There have been promising advances in technology and building techniques that increase the energy efficiency of a home. However, some recent studies [1, 2] have shown that, depending on the choice of the energy efficiency measures, the greenhouse gas emissions impact of some materials associated with energy efficiency technologies or techniques may be significant; in some contexts, equivalent to the energy use of a home over the course of 30 years. Building codes and other energy efficiency standards typically address only the use phase of a building. This could inadvertently encourage manufacturing activities that will have an impact on environmental conditions today, contrasted with the use phase impact, which is metered over a home’s lifetime and also highly dependent on the environmental impact of the home’s electricity grid (i.e., coal vs. wind energy).
As concerns regarding climate change are very much in the present tense, it is important understand the impacts related to today’s construction activities as well as the use of the home into the future. This study aims to understand the impact of a building from the life cycle assessment (LCA) perspective. LCA is a widely accepted technique to evaluate environmental impact quantitatively. There is a wide range of published literature reporting on LCA for residential buildings, contributing valuable insight on the impact of building materials and design. This report extends previous work in this area by the Concrete Sustainability Hub, which focused on the impact of wall systems, to consider 23 diverse studies published in the last five years, analyzed regarding their similarities and differences in methodologies and results. Because most studies focused on the greenhouse gas emissions and energy use of buildings, that is the emphasis of this report, though it should be noted that LCA is a valuable tool for quantifying other key impacts, such as water use.
Because of the inherent variability in building construction as well as differences in LCA methodologies, most studies applied the technique according to their unique conditions and considerations. For instance, many studies focused on one or more building structure or material to understand their impacts. Buildings were typically between ~1000-2000 ft2 (100-200m2) set in a specific geographic area, such as a typical Belgian or New Zealand home. These geographic considerations create significant variation within the studies, ranging from size of building, heating/cooling measures, and the energy source for the grid supplying electricity. The materials used within buildings were also quite variable; clay, wood, and brick structures were under consideration, coupled with various combinations of energy efficiency measures.
Another major difference between the selected publications was the scope of the study. Each study considered different aspects of the life cycle of the building; some only focused on energy use or materials, while others considered the entire life cycle but left out, for example, transportation impacts. The use phase, or lifetime, of the home under question also varied considerably by study, ranging from 30 – 100 years. This spread affects the not only the total energy use of the building throughout its lifetime, but also the extent of renovation and maintenance activities.
Variations in building structure,
materials, and lifetime can impact results significantly, making meaningful
comparison challenging.
Life Cycle Assessment for Residential Buildings March 2013
Concrete Sustainability Hub Page 3 Massachusetts Institute of Technology
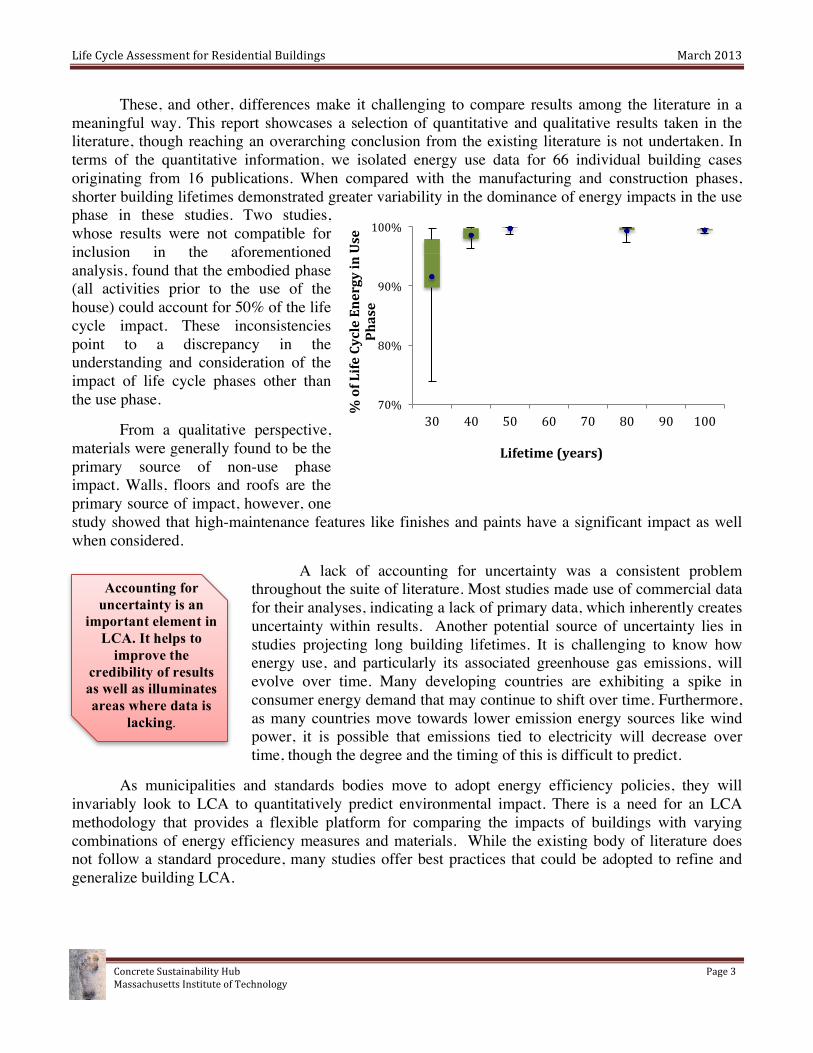
These, and other, differences make it challenging to compare results among the literature in a meaningful way. This report showcases a selection of quantitative and qualitative results taken in the literature, though reaching an overarching conclusion from the existing literature is not undertaken. In terms of the quantitative information, we isolated energy use data for 66 individual building cases originating from 16 publications. When compared with the manufacturing and construction phases, shorter building lifetimes demonstrated greater variability in the dominance of energy impacts in the use phase in these studies. Two studies, whose results were not compatible for inclusion in the aforementioned analysis, found that the embodied phase (all activities prior to the use of the house) could account for 50% of the life cycle impact. These inconsistencies point to a discrepancy in the understanding and consideration of the impact of life cycle phases other than the use phase.
From a qualitative perspective, materials were generally found to be the primary source of non-use phase impact. Walls, floors and roofs are the primary source of impact, however, one study showed that high-maintenance features like finishes and paints have a significant impact as well when considered.
A lack of accounting for uncertainty was a consistent problem throughout the suite of literature. Most studies made use of commercial data for their analyses, indicating a lack of primary data, which inherently creates uncertainty within results. Another potential source of uncertainty lies in studies projecting long building lifetimes. It is challenging to know how energy use, and particularly its associated greenhouse gas emissions, will evolve over time. Many developing countries are exhibiting a spike in consumer energy demand that may continue to shift over time. Furthermore, as many countries move towards lower emission energy sources like wind power, it is possible that emissions tied to electricity will decrease over time, though the degree and the timing of this is difficult to predict.
As municipalities and standards bodies move to adopt energy efficiency policies, they will invariably look to LCA to quantitatively predict environmental impact. There is a need for an LCA methodology that provides a flexible platform for comparing the impacts of buildings with varying combinations of energy efficiency measures and materials. While the existing body of literature does not follow a standard procedure, many studies offer best practices that could be adopted to refine and generalize building LCA.
70%
80%
90%
100%
30 40 50 60 70 80 90 100
% of Life Cycle Energy in Use
Phase
Lifetime (years)
Accounting for uncertainty is an
important element in LCA. It helps to
improve the credibility of results as well as illuminates areas where data is
lacking.

Life Cycle Assessment for Residential Buildings March 2013
Concrete Sustainability Hub Page 4 Massachusetts Institute of Technology
Of particular import is the need to understand the balance between the impact of materials used exterior envelope systems and their effect on the use phase of buildings. Improving building energy efficiency is a significant potential climate change mitigation strategy, though only if the full impact of the life cycle is understood. The impact of building materials, including materials related to energy efficiency measures, has proven to be significant in some cases. Understanding which energy efficiency measures are most appropriate in different regions and for different structures will insure that the industry is meeting energy reduction goals today and into the future.
KEY POINTS
♦ Existing literature on the life cycle analysis of buildings focuses primarily on the energy use and greenhouse gas emissions of small to mid-sized houses.
♦ Variations in building design (structure and materials), lifetime, and study scope limit the ability to compare study results.
♦ The use phase of buildings accounts for the majority of life cycle impacts, though there are indications that materials may play a large role, particularly in energy efficient homes.
♦ Uncertainty is typically not accounted for within data or shown in study results. ♦ There is a lack of a methodology that is scalable to various building designs and
geographic locations that also considers uncertainty. ♦ Designers, policymakers, and the general public must be aware of materials impacts in
order to meet long and short-term emissions reductions goals.

Life Cycle Assessment for Residential Buildings March 2013
Concrete Sustainability Hub Page 5 Massachusetts Institute of Technology
INTRODUCTION
It is widely reported that the renovation and occupation of buildings contributes one-third of global greenhouse gas (GHG) emissions and more than 40% of global energy use[3]. As population growth and migration to urban areas continue to necessitate the construction of new housing, the housing sector is an easy target for mitigation through GHG policy initiatives. In fact, the United Nations Intergovernmental Panel on Climate Change identified the building sector as the area with the most potential to deliver long-term and cost-effective GHG reduction[4]. Building codes and other standards are one means of mandating efficiency, but these codes should take into account the true impact of the home throughout its life cycle.
The means to quantifying environmental impacts as well as estimating potential reductions is often done through life cycle assessment (LCA). LCA is a broadly accepted technique for estimating the environmental impact (such as GHG emissions, the focus of this report) of products or processes. Many advances have been made in the understanding of best practices for applying LCA to buildings, particularly around modeling the impact of various building materials and energy efficiency measures. However, regional variations in housing styles and energy sources, among other issues, have created a body of LCA work that makes comparison and benchmarking challenging.
This report builds upon previous efforts around the impact of different wall systems by extending it to LCAs of residential buildings published in the last five years. We will review different approaches to LCA in an effort to give a sense of the state of the current research in the area, as well as identify gaps or inconsistencies that could be refined in order to provide accurate results.
SIMILARITIES AND DIFFERENCES IN LCA DESIGN
The design of a life cycle assessment for a building depends on the goal of the study. Most studies have an overarching goal of understanding the impact of a building, but take different angles towards reaching this number depending on the intended use of the study or the audience. For example, a researcher may be interested in understanding what building structure has the lowest GHG emissions in the construction phase. Alternately, a study might examine the effect of energy efficiency measures, like improved insulation, on the consumption of energy over the lifetime of the building. As such, variations in the study’s objectives can lead to potentially significant differences in the final results making comparison between studies challenging or impossible. This section will provide an overview of different considerations used in the key assumptions within life cycle assessments.
Functional unit
Defining the functional unit is a key step of an LCA. A functional unit is a quantitative measurement of the function that a product or service provides that serves as the basis of LCA calculations [5]. For example, a functional unit might be a light bulb providing a specified brightness and used in Europe for one year, or a single apple grown and eaten in the US. In this report, only studies examining residential buildings were considered; however, the definition of a residential building varies widely.

Life Cycle Assessment for Residential Buildings March 2013
Concrete Sustainability Hub Page 6 Massachusetts Institute of Technology
Most studies examined a house as the functional unit, and the size and structure of the house are two key considerations. Many studies rely on the building’s footprint, or floor area, as the base of measurement for the functional unit, allowing different scenarios to be applied to a standard structure size in a hypothetical context. For example, Ihm considers a typical 2379 ft2 (221m2) Tunisian home within the three main Tunisian climate regions [6]. In another example, Mithraratne describes a typical New Zealand home [wood frame, 1011 ft2 (94 m2)] under three conditions: light construction, concrete construction, and super-insulated construction [7]. Hacker considered options like heating and cooling mechanisms in life cycle energy use [8]. Other studies consider the impact of using different materials within a standard house frame. Utama analyzed the implications of substituting modern concrete for traditional clay in the construction of a traditional Indonesian home [9]. Monahan looks at a traditional United Kingdom house with wooden cladding, then compares its impact to the same house constructed using brick and masonry.
A smaller subset of studies applies the environmental assessment to a segment of the house, allowing results to be extrapolated to buildings of various sizes. Bolin uses 1000 board feet of framing within a 2225 ft2 (207 m2) building [10], while Allacker considers one square meter of flooring heated to 18˚ Celsius [11]. Zabalza looks at 1kg of building material as the metric [12]. Taking a different approach, Heinomen’s study uses one affluent building inhabitant with high consumption volume as the functional unit, which allows the impact of different life cycle phases to be compared and informs strategies cities or towns might take towards greenhouse gas mitigation [13].
Lifetime
In studies considering the use phase, the lifetime of the home is a key consideration. The lifetime is generally determined by how long residents tend to stay in a home, the functional lifetime of the building itself, or the length of time for a generation to pass. Lifetimes varied from 25 – 100 years in the literature assessed, most falling between 30-50 years. Studies using 100 year time frames, such as Borjesson’s [14], tend to include significant renovation activities as part of the longer term life cycle. Saynajoki recommends considering shorter lifetimes in order to make results relevant in terms of meeting climate change mitigation goals set for the next few decades [15].
System Boundaries
The life cycle of even the simplest products can become very complex. Where one “draws the line” is a key question in any life cycle assessment, creating a large potential difference in life cycle results. As such, it’s necessary to clearly define the activities one is including and excluding in a study in order to understand the results in the proper context. This section will provide an overview of the boundaries typically considered within an LCA.
Which life cycle phases are included in the study is one main element of boundary setting, an example of which is shown in Figure 1. The studies in this report considered life cycle phases in several ways:

Life Cycle Assessment for Residential Buildings March 2013
Concrete Sustainability Hub Page 7 Massachusetts Institute of Technology
1. Cradle-to-site, or embodied phase: The energy and GHG emissions from the materials extraction and manufacturing through a completion of building construction (excluding use and disposal).
2. Use Phase: The energy and GHG emissions consumed during the operation of the house.
3. Cradle-to-grave: The GHG or energy used from extraction and manufacturing of materials to the house’s eventual disposal. Monahan omitted the use and end-of-
life phases because only the embodied energy of the cladding materials was under examination [16]. Use phase is of particular importance for studies evaluating energy efficiency measures [2, 6-8, 15, 17-24]; however, studies differed in terms of how they considered the frequency and type of renovations that occur during use, i.e. repair, refurbishment, maintenance, etc. The end-of-life phase was considered differently across studies. Zabalza [24] and Alacker [11] considered the demolition of the building, whereas Gustavsson assumed demolition to be a minor impact and thus excluded it [2]. The inadequacy of many studies in their system boundary definitions was illuminated by Optis, who states that 60% of studies do not explicitly state which life cycle stages are included, and 85% of the same set of studies did not identify the unit processes (e.g. materials) included within the boundaries [25].
Geographic boundaries are a key differentiator between each study; each study considered in this review focused on a particular region, and oftentimes a specific location, like a city. The energy source for a region (i.e. coal vs. hydropower) can have a large impact on the use phase energy, making locality a critical factor. Different climactic zones may change the heating or cooling requirements, necessitating the use of different types of materials or appliances. Further, location is a factor for the transportation of materials to the construction site. This regional specificity should be a clear consideration of any building LCA, particularly those focused in the use phase.
Figure 1 An example of life cycle boundaries, adapted from Monahan's study
Extraction of raw materials or recycled materials
Transportation
Manufacture of components and products
Transportation to site
Construction
Occupation
Maintenance and renovation
Deconstruction
Removal from site
Disposal/recycling
Embodied
Use
End-‐of-‐life

Life Cycle Assessment for Residential Buildings March 2013
Concrete Sustainability Hub Page 8 Massachusetts Institute of Technology
Materials Under Consideration
The body of literature around building LCA is large and varied, and as such, many different materials, and combinations of materials, have been analyzed and compared. Which materials are considered in the analysis depends on the goal of the study and the audience. In many cases, a traditional building material, such as clay, is compared with a “modern” alternative, such as concrete [9, 14, 21]. Monahan compares cladding materials, contrasting the impact of traditional wood with that of brick and masonry [16]. Aktas considers materials used in interior renovations, such as paint, carpet and flooring, in order to evaluate the impact of lifetime in LCA [26].
Data sources
Most studies considered here use ecoinvent, a life cycle inventory database developed in Switzerland, as the primary source of data.1 One important note regarding the use of ecoinvent – if not explicitly excluded, ecoinvent includes capital goods, such as the buildings and machines associated with the manufacture of items included in a building. Other common data sources included the US Life Cycle Inventory Database, TRACI, BEES, US Census Data, US National Renewable Energy Laboratory, GEMIS, as well as other local information sources. Only Utama emphasizes the use of local data when available [9]. Some studies do not cite the data sources directly; in fact, Optis found that 20% of studies do not provide adequate references to the data [25].
RESULTS
This section will highlight a selection of quantitative and qualitative results from literature. As mentioned throughout this document, differences in the structure of each LCA study make it challenging to adequately compare quantitative results between the studies, therefore results stated below should not be treated as overarching trends but as examples of results that highlight sources of uncertainty or areas that could benefit from further analysis.
Quantitative Results
In an attempt to evaluate the studies’ data quantitatively, we pulled numerical information from studies that evaluated similar parameters on the impacts of buildings and individual materials. Quantitative data on materials impact was less abundant, making it challenging or imprecise to analyze. That said, the existing materials information may still be useful for future modeling exercises. As such, this section will focus solely on the data related the impact of buildings.
1 http://www.ecoinvent.ch/

Life Cycle Assessment for Residential Buildings March 2013
Concrete Sustainability Hub Page 9 Massachusetts Institute of Technology
For a case to be included in this analysis, the study had to include information on a building’s area, lifetime, and use and embodied phase impact. By this measure, we were able to find compatible information on the impact of 66 buildings from 16 of the focal studies; data is available in Appendix A. Many studies were thus left out of this analysis simply because they were not in the correct format to fit into this analytical framework. As with the materials data, we may be able to use this information for future modeling work. In some cases, data for multiple buildings were available from one study.
Figure 2 shows an overview of the area and lifetimes for the 66 residential buildings considered in the quantitative study. The majority of studies considered buildings smaller than 3200 ft2 (300m2), and most of those were between ~1000 – 2000 ft2 (100-200 m2). Those that did consider larger buildings only did so for a 50-year lifetime. This illuminates a gap in the literature for residential buildings of larger sizes as well as with longer lifetimes in general, pointing to the tendency for building LCA studies to be inflexible, considering only static sizes and lifetimes.
Figure 2 Number of building cases out of 66 surveyed in the literature organized by building area and lifetime.
Figure 3 shows the fraction of life cycle energy consumed in the use phase is correlated to the building’s lifetime. It illuminates the dominance of the use phase impact, particularly for longer lifetimes. For buildings with a relatively shorter lifetime, 30-40 years, there is a wider range of values for the ratio of use to embodied impact, which then grows smaller as the lifetime increases. This analysis points potentially to a higher range in uncertainty as to the dominance of the use phase in short lifetimes, though there were limited studies with longer lifetimes so it is not a clear distinction.

Life Cycle Assessment for Residential Buildings March 2013
Concrete Sustainability Hub Page 10 Massachusetts Institute of Technology
50%
60%
70%
80%
90%
100%
30 40 50 60 70 80 90 100
% of Life Cycle Energy in Use Phase
Lifetime (years)
Qualitative Results
Life Cycle Impacts As demonstrated by the quantitative data, it is commonly expected that the use phase of a
building will dominate the life cycle impact, mainly due to heating and cooling requirements. The embodied phase makes up a significantly smaller a small part of a building’s life cycle impacts, often expected to be less than 10% [27]. However, as additional energy efficiency techniques and materials continue to emerge in response to building codes and/or cost savings measures, there is a potential for this balance to shift, and understanding the tipping point for an individual building is a vital component. Concern for the increasing importance of embodied energy is reflected in the Architecture 2030 Challenge for Products [28]. In addition, for this new era of low energy construction, Saynajoki argues that many studies unfairly downplay the importance of the embodied phase [15]. In fact, Gustavsson found that for low energy buildings (which have a lower use phase impact), the embodied phase can represent as much as 50% of total life cycle impact [2]. Verbeeck came to the a similar conclusion, in the case of “extremely low energy” buildings [1].
Figure 3: The percent of the total life cycle energy impact attributed to the use phase. The bottom-most edge of the green boxes represents the 1st quartile or the 25th percentile. The upper edge of the box represents the 3rd quartile of the data, or the 75th percentile of the dataset. The edges of the upper and lower lines, or whiskers, are the 90th and the 10th percentile of the data respectively. The blue dots represent the means.

Life Cycle Assessment for Residential Buildings March 2013
Concrete Sustainability Hub Page 11 Massachusetts Institute of Technology
Balancing the carbon impact of the embodied phase with the use phase impact is often referred to as the environmental payback time of the project, e.g., how long many years will it take for the impact of efficiency measures to equal the impact savings during the home’s operation. Determining the environmental payback time is, of course, dependent on the use phase impact, which, in turn, is dependent on the habits of an inhabitant, the lifetime of the building, and the local energy grid’s impact.
Because buildings have such long lifetimes, projecting future use phase impact is a practice fraught with uncertainty. For one, trends in global energy consumption will continue to evolve, and likely increase, over time. In the US, while efficiency has generally increased, there has been a slight rise in energy consumption related to increased air conditioner use [29]. On the other hand, in the developing world, energy use has increased by 130% in the last two decades, mainly due to broader use of air conditioning [6]. This trend has been observed throughout the developing world; however projecting how the rate will shift over the next century is a challenge. Furthermore, some regions may experience a reduction in their energy grid impacts in response to climate mitigation efforts, which could conceivably reduce use phase impact [15]. For instance, US coal-fired power plants may be decommissioned over time, which would lower GHG emissions, however it’s unclear the extent to which this might happen. As such, Saynajoki concludes, considering shorter building lifetimes may yield more useful results [15].
Building Materials This section will provide examples of results from research focused on building materials; the
inconsistency between the studies’ boundaries and methods do not allow for sweeping conclusions across the literature. Several studies found that the extraction and production of building materials makes up the majority of the embodied phase impact [9, 16]. Monahan showed that timber framing had a lower impact when compared to brick and masonry due to the heavier walls and foundation needed to bear the additional weight, which in turn, increases the minerals required for building construction [16]. Bolin found wood treated with borate to emit 1.8 times less GHGs when compared to galvanized steel framing [10]. However, Marceau and VanGeem found the impact of wood to be higher than that of cement when the impact of land use change associated with timber harvest is considered [30], highlighting the importance of consistent LCA boundaries. Nassen also found wood has a lower impact than cement, except in cases where carbon capture and storage technologies are not used for wood incinerated during disposal [4]. When clay was compared with cement and clay in the case of Indonesia, clay was found to have a somewhat lower impact, mainly due to the high emissions related in the production of cement [9]. Utama went on to extrapolate this difference in reference to projected growth in Indonesia, finding that a switch from traditional clay to cement could result in an additional 9 million metric tons of GHG emissions by 2030.
Structural Elements The structure of the building, specifically, the floors, walls and roofs, dominate the impact in the
embodied phase according to many of the studies [7, 9, 31]. Mithraratne considered several common building components that are typically not included in these analyses. He found that floor and wall finishes can make up roughly 30% of the embodied phase impact over a 100 year life time due to their relatively shorter lifetime [7]. Similarly, furniture and appliances can contribute to more than 25% of embodied impact when considered.

Life Cycle Assessment for Residential Buildings March 2013
Concrete Sustainability Hub Page 12 Massachusetts Institute of Technology
CONCLUSIONS
An emerging trend in LCA literature shows that while energy consumption is decreased with improved energy efficiency, this can cause an increase in embodied energy due to the additional materials burden required for some energy efficiency measures. This point is significant for a number of reasons. Most energy efficiency standards focus on the use phase of a building, leaving the embodied phase out, This is due to the fact that operational energy will continue to account for 90% of the energy used in buildings. However, codes are becoming more stringent, environmental awareness is increasing, and demand for energy efficient buildings is increasing. As a result, it is becoming more relevant to consider the embodied phase as part of building codes and standards. Furthermore, if energy efficient construction inherently creates a spike in carbon emissions compared with traditional building construction, it may become an especially relevant consideration for regions adopting carbon mitigation plans. As such, it is important to fully understand both the embodied and use impacts of buildings constructed with energy efficiency measures in various combinations.
While the existing body of literature is robust and valuable, the lack of consistency within the methodologies makes it difficult to definitively reach such conclusions. Particularly, there is no common methodology to adequately address a wide range of building forms and lifetimes in various geographic regions. In addition, most studies relied on commercial databases as the main data source – there was an overall absence of local primary data. This lack of data illuminates the potential for considerable uncertainty within quantitative results, an aspect that was not adequately considered in most publications. It is vital that LCA studies report uncertainty, not only to understand the confidence of the results provided, but also to enable comparison and inform data collection efforts.
Furthermore, there is limited research on the renovation of existing housing with energy efficiency measures. Understanding the threshold where the impact of new construction or renovation exceeds the use phase benefits will shed light on what measures are most beneficial in which cases. As such, it is vital to develop a methodology that can accommodate variable building characteristics as well as provide insight into uncertainty in the results. Such a tool could add value to global initiatives that promote, or mandate, sustainable building.

Life Cycle Assessment for Residential Buildings March 2013
Concrete Sustainability Hub Page 13 Massachusetts Institute of Technology
REFERENCES
[1] G. Verbeeck and H. Hens, "Life cycle inventory of buildings: A contribution analysis," Building and Environment, vol. 45, pp. 964-967, 2010.
[2] L. Gustavsson and A. Joelsson, "Life cycle primary energy analysis of residential buildings," Energy and Buildings, vol. 42, pp. 210-220, Feb 2010.
[3] United Nations Environmental Programme, "Buildings and Climate Change," Sustainable Buildings & Climate Initiative, Ed., ed. Paris: UNEP, 2009.
[4] J. Nassen, F. Hedenus, S. Karlsson, and J. Holmberg, "Concrete vs. wood in buildings - An energy system approach," Building and Environment, vol. 51, pp. 361-369, May 2012.
[5] H. Baumann and A.-M. Tillman, The Hitch Hiker's Guide to LCA. Sweden: Studentlitteratur AB, 2004.
[6] P. Ihm and M. Krarti, "Design optimization of energy efficient residential buildings in Tunisia," Building and Environment, vol. 58, pp. 81-90, 2012.
[7] N. Mithraratne and B. Vale, "Life cycle analysis model for New Zealand houses," Building and Environment, vol. 39, pp. 483-492, 2004.
[8] J. N. Hacker, T. P. DeSaulles, A. J. Minson, and M. J. Holmes, "Embodied and Operational carbon dioxide emissions from housing: A case study on the effects of thermal mass and climate change," Energy and Buildings, vol. 40, pp. 375-384, 2008.
[9] N. A. Utama, B. McLellan, S. H. Gheewala, and K. N. Ishihara, "Embodied impacts of traditional clay versus modern concrete houses in a tropical regime," Building and Environment, vol. 57, pp. 362-369, Nov 2012.
[10] C. A. Bolin and S. T. Smith, "Life cycle assessment of borate-treated lumber with comparison to galvanized steel framing," Journal of Cleaner Production, vol. 19, pp. 630-639, 2011.
[11] K. Allacker, "Environmental and economic optimisation of the floor on grade in residential buildings," Int J Life Cycle Assess, vol. 17, pp. 813-827, 2012.
[12] I. Zabalza Bribián, A. Aranda Usón, and S. Scarpellini, "Life cycle assessment in buildings: State-of-the-art and simplified LCA methodology as a complement for building certification," Building and Environment, vol. 44, pp. 2510-2520, 2009.
[13] J. Heinonen, A. J. Saynajoki, M. Kuronen, and S. Junnila, "Are the Greenhouse Gas Implications of New Residential Developments Understood Wrongly?," Energies, vol. 5, pp. 2874-2893, Aug 2012.
[14] P. Borjesson and L. Gustavsson, "Greenhouse gas balances in building construction: wood versus concrete from life-cycle and forst land-use perspectives," Energy Policy, vol. 28, pp. 575-588, 2000.
[15] A. Saynajoki, J. Heinonen, and S. Junnila, "A scenario analysis of the life cycle greenhouse gas emissions of a new residential area," Environmental Research Letters, vol. 7, Jul-Sep 2012.
[16] J. Monahan and J. C. Powell, "An embodied carbon and energy analysis of modern methods of construction in housing: A case study using a lifecycle assessment framework," Energy and Buildings, vol. 43, pp. 179-188, 2011.
[17] K. Adalberth, "Energy use during the Life Cycle of Buildings: a Method," Building and Environment, vol. 32, pp. 317-320, 1997.

Life Cycle Assessment for Residential Buildings March 2013
Concrete Sustainability Hub Page 14 Massachusetts Institute of Technology
[18] G. Blengini and T. Di Carlo, "Energy-saving policies and low-energy residential buildings: an LCA case study to support decision makers in Piedmont (Italy)," The International Journal of Life Cycle Assessment, vol. 15, pp. 652-665, 2010.
[19] R. J. Cole, "Energy and greenhouse gas emissions associated with the construction of alternative structureal systems," Building and Environment, vol. 34, pp. 335-348, 1998.
[20] X. Z. Gong, Z. R. Nie, Z. H. Wang, S. P. Cui, F. Gao, and T. Y. Zuo, "Life Cycle Energy Consumption and Carbon Dioxide Emission of Residential Building Designs in Beijing A Comparative Study," Journal of Industrial Ecology, vol. 16, pp. 576-587, Aug 2012.
[21] T. Ramesh, R. Prakash, and K. K. Shukla, "Life cycle energy analysis of a residential building with different envelopes and climates in Indian context," Applied Energy, vol. 89, pp. 193-202, Jan 2012.
[22] B. Rossi, A. F. Marique, and S. Reiter, "Life-cycle assessment of residential buildings in three different European locations, case study," Building and Environment, vol. 51, pp. 402-407, May 2012.
[23] F. You, D. Hu, H. T. Zhang, Z. Guo, Y. H. Zhao, B. N. Wang, and Y. Yuan, "Carbon emissions in the life cycle of urban building system in China-A case study of residential buildings," Ecological Complexity, vol. 8, pp. 201-212, Jun 2011.
[24] I. Zabalza Bribián, A. Valero Capilla, and A. Aranda Usón, "Life cycle assessment of building materials: Comparative analysis of energy and environmental impacts and evaluation of the eco-efficiency improvement potential," Building and Environment, vol. 46, pp. 1133-1140, 2011.
[25] M. Optis and P. Wild, "Inadequate documentation in published life cycle energy reports on buildings," Int J Life Cycle Assess, vol. 15, pp. 644-651, 2010.
[26] C. B. Aktas and M. M. Bilec, "Impact of lifetime on US residential building LCA results," Int J Life Cycle Assess, vol. 17, pp. 337-349, 2012.
[27] R. M. Cuéllar-Franca and A. Azapagic, "Environmental impacts of the UK residential sector: Life cycle assessment of houses," Building and Environment, vol. 54, pp. 86-99, 2012.
[28] A. 2030. (2012, February 25, 20133). The 2030 Challenge for Products. [29] United States Energy Information Agency. (2012, February 25, 2013). Residential Energy
Consumption Survey. [30] M. L. Marceau and M. VanGeem, "Comparison of the life cycle assessments of an insulating
concrete form house and a wood frame house," Journal of ASTM International, vol. 3, pp. 1-11, 2006.
[31] G. Verbeeck and H. Hens, "Life cycle inventory of buildings: A calculation method," Building and Environment, vol. 45, pp. 1037-1041, 2010.

Life Cycle Assessment for Residential Buildings March 2013
Concrete Sustainability Hub Page 15 Massachusetts Institute of Technology
APPENDIX A: EXCERPT OF QUANTITATIVE DATA FROM LITERATURE
The following table contains data on 66 cases taken from 16 studies. Some of the studies contained multiple cases. In some cases, we manipulated the published results in order to put them on a consistent basis. For example, the units needed to be adjusted for consistency in many cases.
Case # Area Lifetime Total
Embodied Energy
Annual Use Phase
Energy
Lifetime Use Phase Energy
Total Life Cycle Energy
Embodied vs. Use Phase Energy: Total Life Cycle
Embodied vs. Use Phase Energy: Average Per Year
(m2) (years) (MJ/m2) (MJ/m2 per
year) (MJ/m2 per
lifetime) (MJ/m2 per
lifetime) % Embodied
Phase % Use Phase % Embodied Phase % Use Phase
1 1190 50 115.20 1188.00 59400.00 59515.20 0.19% 99.81% 0.19% 99.81%
2 1190 50 118.80 1162.80 58140.00 58258.80 0.20% 99.80% 0.20% 99.80%
3 1190 50 118.80 1130.40 56520.00 56638.80 0.21% 99.79% 0.21% 99.79%
4 1190 50 118.80 1162.80 58140.00 58258.80 0.20% 99.80% 0.20% 99.80%
5 1190 50 122.40 1076.40 53820.00 53942.40 0.23% 99.77% 0.23% 99.77%
6 1190 50 118.80 1065.60 53280.00 53398.80 0.22% 99.78% 0.22% 99.78%
7 1190 50 118.80 1162.80 58140.00 58258.80 0.20% 99.80% 0.20% 99.80%
8 1190 50 118.80 986.40 49320.00 49438.80 0.24% 99.76% 0.24% 99.76%
9 700 50 90.00 842.40 42120.00 42210.00 0.21% 99.79% 0.21% 99.79%
10 1160 50 93.60 903.60 45180.00 45273.60 0.21% 99.79% 0.21% 99.79%
11 1190 50 118.80 1159.20 57960.00 58078.80 0.20% 99.80% 0.20% 99.80%
12 1520 50 86.40 954.00 47700.00 47786.40 0.18% 99.82% 0.18% 99.82%

Life Cycle Assessment for Residential Buildings March 2013
Concrete Sustainability Hub Page 16 Massachusetts Institute of Technology
Case # Area Lifetime Total
Embodied Energy
Annual Use Phase
Energy
Lifetime Use Phase Energy
Total Life Cycle Energy
Embodied vs. Use Phase Energy: Total Life Cycle
Embodied vs. Use Phase Energy: Average Per Year
13 1190 50 108.00 1152.00 57600.00 57708.00 0.19% 99.81% 0.19% 99.81%
14 130 50 100.80 936.00 46800.00 46900.80 0.21% 99.79% 0.21% 99.79%
15 129 50 97.20 982.80 49140.00 49237.20 0.20% 99.80% 0.20% 99.80%
16 138 50 82.80 874.80 43740.00 43822.80 0.19% 99.81% 0.19% 99.81%
17 700 50 97.20 842.40 42120.00 42217.20 0.23% 99.77% 0.23% 99.77%
18 1160 50 86.40 903.60 45180.00 45266.40 0.19% 99.81% 0.19% 99.81%
19 1190 50 126.00 1159.20 57960.00 58086.00 0.22% 99.78% 0.22% 99.78%
20 1520 50 79.20 954.00 47700.00 47779.20 0.17% 99.83% 0.17% 99.83%
21 110 50 50.40 543.60 27180.00 27230.40 0.19% 99.81% 0.19% 99.81%
22 110 50 46.80 428.40 21420.00 21466.80 0.22% 99.78% 0.22% 99.78%
23 110 50 43.20 478.80 23940.00 23983.20 0.18% 99.82% 0.18% 99.82%
24 110 50 32.40 608.40 30420.00 30452.40 0.11% 99.89% 0.11% 99.89%
25 110 50 90.00 234.00 11700.00 11790.00 0.76% 99.24% 0.76% 99.24%
26 266 50 97.20 676.80 33840.00 33937.20 0.29% 99.71% 0.29% 99.71%
27 266 50 111.60 543.60 27180.00 27291.60 0.41% 99.59% 0.41% 99.59%
28 266 50 90.00 309.60 15480.00 15570.00 0.58% 99.42% 0.58% 99.42%
31 100 40 133.20 86.40 3456.00 3589.20 3.71% 96.29% 3.71% 96.29%
32 94 100 43.20 82.80 8280.00 8323.20 0.52% 99.48% 0.52% 99.48%
33 94 100 46.80 75.60 7560.00 7606.80 0.62% 99.38% 0.62% 99.38%
34 94 100 50.40 43.20 4320.00 4370.40 1.15% 98.85% 1.15% 98.85%

Life Cycle Assessment for Residential Buildings March 2013
Concrete Sustainability Hub Page 17 Massachusetts Institute of Technology
Case # Area Lifetime Total
Embodied Energy
Annual Use Phase
Energy
Lifetime Use Phase Energy
Total Life Cycle Energy
Embodied vs. Use Phase Energy: Total Life Cycle
Embodied vs. Use Phase Energy: Average Per Year
35 123 30 514.80 838.80 25164.00 25678.80 2.00% 98.00% 2.00% 98.00%
36 128 100 363.60 961.20 96120.00 96483.60 0.38% 99.62% 0.38% 99.62%
37 128 100 352.80 1051.20 105120.00 105472.80 0.33% 99.67% 0.33% 99.67%
38 120 50 140.40 432.00 21600.00 21740.40 0.65% 99.35% 0.65% 99.35%
39 50 40 46.80 302.40 12096.00 12142.80 0.39% 99.61% 0.39% 99.61%
40 50 40 25.20 342.00 13680.00 13705.20 0.18% 99.82% 0.18% 99.82%
41 156 80 68.40 932.40 74592.00 74660.40 0.09% 99.91% 0.09% 99.91%
42 156 80 72.00 727.20 58176.00 58248.00 0.12% 99.88% 0.12% 99.88%
43 156 80 72.00 532.80 42624.00 42696.00 0.17% 99.83% 0.17% 99.83%
44 156 80 104.40 230.40 18432.00 18536.40 0.56% 99.44% 0.56% 99.44%
45 156 80 385.20 176.40 14112.00 14497.20 2.66% 97.34% 2.66% 97.34%
46 143 30 79.20 863.64 25909.09 25988.29 0.30% 99.70% 0.30% 99.70%
47 147 30 710.00 1323.17 39695.24 40405.24 1.76% 98.24% 1.76% 98.24%
48 153 30 847.50 1192.84 35785.29 36632.79 2.31% 97.69% 2.31% 97.69%
49 149 30 1025.00 2417.40 72522.15 73547.15 1.39% 98.61% 1.39% 98.61%
50 143 30 695.00 489.97 14699.09 15394.09 4.51% 95.49% 4.51% 95.49%
51 147 30 785.00 673.40 20202.04 20987.04 3.74% 96.26% 3.74% 96.26%
52 153 30 850.00 463.88 13916.50 14766.50 5.76% 94.24% 5.76% 94.24%
53 149 30 1115.00 616.81 18504.36 19619.36 5.68% 94.32% 5.68% 94.32%
54 143 30 925.00 103.06 3091.82 4016.82 23.03% 76.97% 23.03% 76.97%

Life Cycle Assessment for Residential Buildings March 2013
Concrete Sustainability Hub Page 18 Massachusetts Institute of Technology
Case # Area Lifetime Total
Embodied Energy
Annual Use Phase
Energy
Lifetime Use Phase Energy
Total Life Cycle Energy
Embodied vs. Use Phase Energy: Total Life Cycle
Embodied vs. Use Phase Energy: Average Per Year
55 147 30 1115.00 118.73 3561.94 4676.94 23.84% 76.16% 23.84% 76.16%
56 153 30 1145.00 107.76 3232.78 4377.78 26.15% 73.85% 26.15% 73.85%
57 149 30 1295.00 130.22 3906.48 5201.48 24.90% 75.10% 24.90% 75.10%
58 143 30 618.00 921.60 27648.00 28266.00 2.19% 97.81% 2.19% 97.81%
59 143 30 892.50 300.60 9018.00 9910.50 9.01% 90.99% 9.01% 90.99%
60 143 30 602.00 1072.80 32184.00 32786.00 1.84% 98.16% 1.84% 98.16%
61 143 30 871.00 221.40 6642.00 7513.00 11.59% 88.41% 11.59% 88.41%
62 143 30 638.00 687.60 20628.00 21266.00 3.00% 97.00% 3.00% 97.00%
63 143 30 841.00 313.20 9396.00 10237.00 8.22% 91.78% 8.22% 91.78%
64 222 50 170.00 255.96 12798.00 12968.00 1.31% 98.69% 41.00% 59.00%
65 250 70 720.00 468.00 32760.00 33480.00 2.15% 97.85% 2.15% 97.85%
66 250 70 450.00 1764.00 123480.00 123930.00 0.36% 99.64% 0.36% 99.64%

Life Cycle Assessment for Residential Buildings March 2013
Concrete Sustainability Hub Page 19 Massachusetts Institute of Technology
APPENDIX B: GLOSSARY OF TERMS
Boundary conditions The boundary conditions refer to the elements that are considered within the scope of a life cycle assessment. In order for two analyses to be comparable, the boundary conditions should be similar.
Cradle-to-site A method of life cycle assessment that considers the environmental impact of a product from materials extraction through its construction, excluding its impact after production (i.e., after leaving the factory floor).
Cradle-to-grave A method of life cycle assessment that considers the environmental impact of a product during its entire life cycle, from materials extraction to use to waste disposal and recycling.
Cumulative energy demand Cumulative energy demand refers to the total energy required throughout a product’s lifetime, from cradle to grave.
Embodied energy Embodied energy is the total energy required to produce a product or material.
Energy Efficiency Measures (EEM)
Techniques used to improve the energy efficiency of a process or structure, i.e. increasing insulation in walls or roofs, reducing air leakage, or using low energy appliances.
Environmental impact The consequence of pollution, such as eutrophication of waterways or ocean acidification.
Functional unit A functional unit defines the product or process under examination, to which impacts are assigned in a life cycle assessment.
Global warming potential Global warming potential (GWP) is a measurement of the how much a certain mass of a chemical contributes to global warming over a certain time period, as compared to carbon dioxide. The GWP of carbon dioxide is 1.0.
Impact factor The quantification of environmental impact for a particular material or process.

Life Cycle Assessment for Residential Buildings March 2013
Concrete Sustainability Hub Page 20 Massachusetts Institute of Technology
Life cycle database Many life cycle databases exist, providing quantitative information on impact factors.
Life cycle assessment (LCA) A method for determining the environmental impact of a product or process by examining a product’s life cycle.
Life cycle cost assessment (LCCA)
A life cycle cost assessment provides a cost for the production and use of a product.
Lifetime Lifetime refers to the number of years a typical product is in service, typically used to understand the use phase of a product in cradle-to-grave assessments.
Use phase The period in which a building is occupied and maintained.