life-cycle assessment for mitigating the greenhouse gas ... · pdf fileconsortium on green...
TRANSCRIPT

Life-Cycle Assessment for Mitigating theGreenhouse Gas Emissions of Retail Products
Arpad HorvathAssociate Professor
Department of Civil and Environmental Engineering University of California, Berkeley
Eric Masanet
Environmental Energy Technologies DivisionLawrence Berkeley National Laboratory
August 9, 2007
Entire presentation is copyright of UC Berkeley

Consortium on Green Design and Manufacturing
l Multidisciplinary campus group integrating engineering, policy, public health, and business in green engineering, management, and pollution prevention
l Strategic areas: » Civil infrastructure systems» Electronics industry» Servicizing products
l 9 faculty from Civil and Environmental Engineering, Mechanical Engineering, Haas School of Business, Energy and Resources Group, School of Public Health
l 10 current Ph.D. studentsl 28 alumnihttp://cgdm.berkeley.edu
Since 1993

Outline of Presentation
l Our proposed ARB project
l “Carbon footprint” research
l The role of the consumers
l Approach and methods
l Example
l Research challenges

Our Research Proposal to ARB
l “Retail Climate Change Mitigation: Life-cycle Emission and Energy Efficiency Labels and Standards”
» Partners: A. Horvath (UCB), E. Masanet (LBNL), S. Matthews and C. Hendrickson (Carnegie Mellon University)
l Assess opportunities for reducing California’s greenhouse gas (GHG) emissions through the life-cycle of retail products and services that Californians consume that occur both inside and outside of California.» ~ 2/3 is due to product manufacture, but use and end of life stages are also
significant.l Create a life-cycle assessment (LCA) model for California. l Estimate the life-cycle GHG emissions of 20-30 key retail products consumed by
Californians. l Analyze the potential GHG emissions reductions achievable through the adoption of life-
cycle GHG emissions policies for labels and standards for retail products in California over the next five years.

Exciting Times in California
The Economist, 4/29/04
l AB 32 Global Warming Solutions Act» by 2020, return GHG emissions to 1990
levels (and boost annual GSP by $60B and create 17,000 jobs)
» By 2050, drop 80% below 1990 levels
l Increasing consumption
l Increasing population
l Major market of U.S. carbon offset demand

GHG Reduction Potential
The Economist, 6/21/07The Economist, 5/31/07

View of the Economy: Input-Output Model
Input to sectors Intermediateoutput O
Finaldemand F
Totaloutput X
Output from sectors 1 2 3 n1 X 11 X 12 X 13 X 1n O 1 F 1 X 1
2 X 21 X 22 X 23 X 2n O 2 F 2 X 2
3 X 31 X 32 X 33 X 3n O 3 F 3 X 3
n X n1 X n2 X n3 X nn O n F n X n
Intermediate input I I1 I2 I3 In
Value added V V 1 V 2 V3 V n G D PTotal input X X 1 X 2 X3 X n
Xij + Fi = Xi; Xi = Xj; using Dij = Xij / Xj
(Dij*Xj) + Fi = Xi
in vector/matrix notation:D*X + F = X => F = [I - D]*X
or X = [I - D]-1*F
∑∑
For more: www.eiolca.net

Role of the Consumer
l Up to 80% of the annual greenhouse gas (GHG) "footprint" of the average U.S. consumer is attributable to the purchase, use, and disposal of retail products (Matthews, 1999, Carnegie Mellon U.)
l Consumer is guessing, at best» SUV v. compact car
» Incandescent v. compact fluorescent
» but paper v. plastic cups? bags?
l Someone is picking “the right answer” for the consumer» e.g., “green” electricity
The Economist, 5/31/07

Need Life-cycle Thinking!
l We don’t always account for all environmental impacts
The Economist, 5/31/07 The Economist, 5/24/07

Life-cycle Environmental Assessment ofProducts and Services (LEAPS)
l www.consumerfootprint.orgl Chris Jones,
Applications
l Retailers: Carbon Neutral Shopping – point of sale, online, cards
l Consumers: Voluntary Carbon Offsets
l Manufacturers: Baseline Product-level Emissions Data

Opportunities to Influence Private Consumers
The Economist, 5/08/03
The Economist, 9/11/03
The Economist, 10/07/04
• Tesco (UK)
• Wal-Mart
• Home Depot

Courtesy of Chris Jones, BIE, UC Berkeley

Changing Consumption Patterns
The Economist, 10/09/03
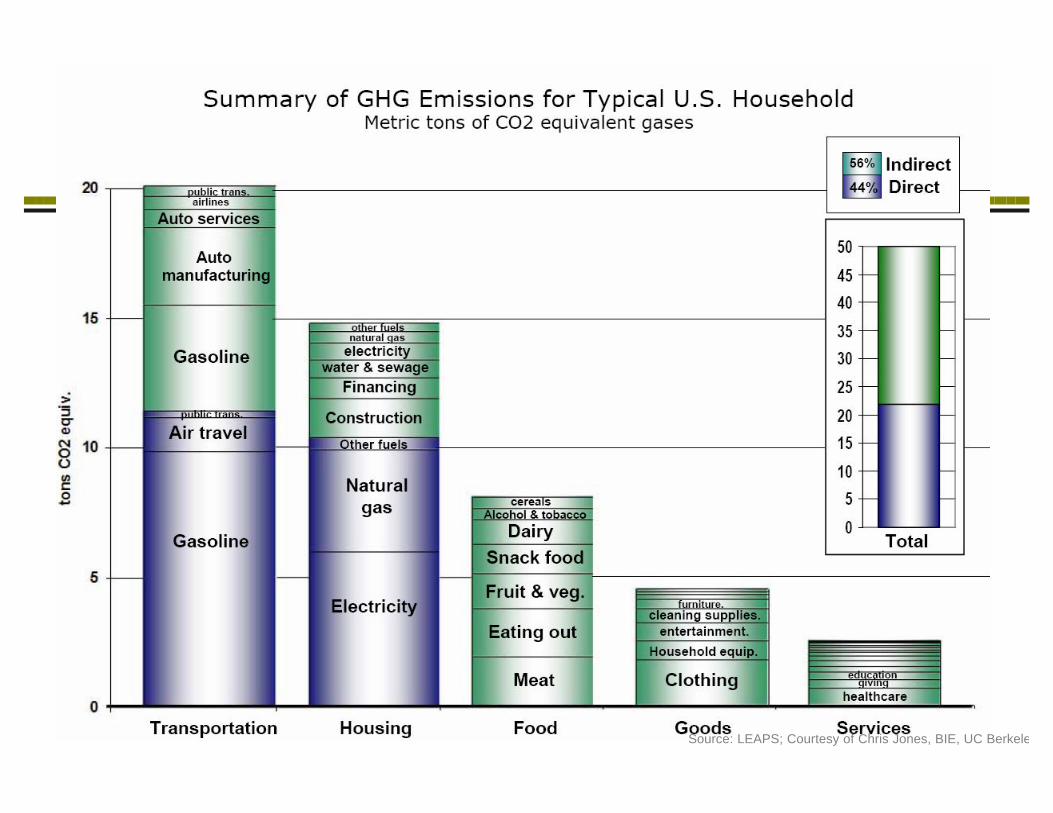
Source: LEAPS; Courtesy of Chris Jones, BIE, UC Berkeley

LCA Framework
Raw Materials Acquisition
Manufacturing
Use/Reuse/Maintenance
Recycle/Waste Management
Inputs Outputs
Raw Materials
Energy
System Boundary
Atmospheric Emissions
Waterborne Wastes
Solid Wastes
Coproducts
Other Releases
A concept and methodology to evaluate the environmental effects of a product or activity holistically, by analyzing the whole life cycle of a particular product, process, or activity (U.S. EPA, 1993).

LCA Methodology – ISO 14040
LCA – Life-Cycle Assessment (ISO 14040)
Inventory analysis
Direct applications:
* Product development * Product/process improvement * Strategic planning * Policy making * Marketing * Other
Goal and scope
definition
Impact assessment
Interpretation
Source: U.S. EPA, 1993

Structure of a Process-based LCA Model
process
processprocess
process
process
process
process
process process
process
processprocess
process
process
sub-system1
process
process process process
processprocess process
sub-system2

Process Flow of Cement Concrete
AIA, “Environmental Resource Guide,” John Wiley & Sons, 1997

Economic Input-Output Analysis
• Developed by Wassily Leontief • Nobel Prize in 1973
• “General interdependency” model: quantifies the interrelationships among sectors of an economic system
• Identifies the direct and indirect economic inputs
• Can be extended to environmental and energy analysis

Economic I-O Analysis Visualization
$20,000 Car:
Engine
$2500 $2000 $1200 $800 $10. . .
Conferences
Other Parts
Steel
Plastics
$2500Engine:
$300 $200 $150 $10. . .
Electricity
Steel Aluminum

EIO-LCA Implementation
• Use the appr. 491 x 491 input-output matrix of the U.S. economy• 1992, 1997, soon 2002
• Augment with sector-level environmental impact coefficient matrices (R) [effect/$ output from sector]
• Environmental impact calculation:
E = RX = R[I - D]-1F
• Available free at www.eiolca.net

Economic Input-Output Analysis-based LCA Model
Demand for Good or Service (F)
Economic Input-Output Matrix(491 x 491 Sector)
Environmental Matrix
(discharge or resource/
$ sector output)
Economic Energy Iron Ore NOxTotal (1992$) TJ kg kgMotor Vehicles x eSteel
Example of Model Output
Model Input
X = F + DX
Dij = Xij/ Xj
X = [I - D]-1 F
X = [I+D+D2+D3+…]F
E=R X=R[I - D]-1 F

Comparison of Electricity Generation Technologies
Pacca, S., Horvath, A., “Greenhouse Gas Emissions from Building and Operating Electric Power Plants in the Upper Colorado River Basin.” Env.Sci.Techn., 36(14), 2002, pp. 3194-3200

Approach and Methods (I)
1) Development of a California-specific LCA model for evaluation of goods and services
2) Assessment of average life-cycle energy use and GHG emissions for 20-30 key retail products
3) Estimation of lowest achievable life-cycle GHG emissions by product
4) Scenario analysis of technical potential for GHG emissions reductions via product life-cycle GHG emissions standards and/or labels

Approach and Methods (II)
1) Development of a California-specific LCA model for evaluation of goods and services
– Production-phase energy use and GHG emissions:l California EIO-LCA
» In-state versus out-of-state emissions» California economic sector-specific data
l California consumer spending data– Use-phase energy use and GHG emissions:
l California stock modeling l Typical operating energy use datal California-specific grid mix (base and peak loads)
– Disposal-phase GHG emissions:l California waste disposal and recycling data

California EIO-LCA Model
l Based on national EIO-LCA approachl Includes interstate and international
commerce» Weber and Matthews 2007 study: U.S. produced 22% of eCO2 in
2005, but U.S. consumption accounted for 25-26%.
l Energy and environmental data from CAl Preliminary model developed in 2005
» Annual GHG emissions arising from CA consumption of:– Semiconductors in personal computers– Pharmaceuticals

Approach and Methods (III)
2) Assessment of average life-cycle energy use and GHG emissions for 20-30 key retail products
– Annual energy use and GHG emissions occurring both inside and outside of California
– Selection based on major emitters and ARB input
3) Estimation of lowest achievable life-cycle GHG emissions by product
– Based on best available technologies and practices at each life-cycle stagel Production: sector-level improvement potential analyses (worldwide)l Use: best-in-class energy efficiency (e.g., ENERGY STAR products)l Disposal: optimal waste treatment strategies (e.g., recycling, composting)
– “Low carbon” versions represent minimum life-cycle GHG emissions achievable through California product standards and/or labels

California Industrial Energy Efficiency Improvement Potential
Source: KEMA (2006) California Industrial Existing Construction Energy Efficiency Potential Study
Industrial Achievable Savings Potential by Industry, 2005Electricity Natural Gas
Base Use, 2005= 3,600 Mth
Base Use, 2005= 32,850 GWh

Approach and Methods (IV)
4) Scenario analysis of technical potential for GHG emissions reductions via product standards and/or labels
– Five year analysis period– Specific to 20-30 retail product analyzed– Naturally occurring reductions based on product-specific analysis:
l Stock turnoverl Current energy efficiency and GHG reduction trends
– Remaining technical potential estimated for:l “Low carbon” product standards (mandatory)l “Low carbon” product labels (voluntary)
» ENERGY STAR elasticity as proxyl Green purchasing programs

Illustrative Example: California PCs
Source: Masanet, E., and A. Horvath (2006). “An Analysis of Measures for Reducing the Life-Cycle Energy Use and Greenhouse Gas Emissions of California’s Personal Computers.” University of California Energy Institute Technical Report, Berkeley, California.
4,691,5005,367,9008,909,70018,969,100Total
Commercial
Residential
Market Notebook PCs
Desktop PCsTotal PCs
1,667,5001,862,1003,189,0006,718,600
3,024,0003,505,8005,720,70012,250,500
w/ Flat Panel Display
w/ CRT Monitor
Estimated California Installed Base of PCs, 2005

Annual Life-Cycle GHG Emissions of California’s Installed Base of PCs
Source: Derived from (1) Masanet, E., L. Price, S. de la Rue du Can, R. Brown, and E. Worrell (2005). Optimization of Product Life Cycles to Reduce Greenhouse Gas Emi ssions in California. California Energy Commission, PIER Energy-Related Environmental Research. CEC-500-2005-110; and (2) Masanet, E., and A. Horvath (2006). An Analysis of Measures for Reducing the Life-Cycle Energy Use and Greenhouse Gas Emissions of California’s Personal Computers. University of California Energy Institute Technical Report, Berkeley, California.
Estimated Life-Cycle GHG Emissions, 2005
GHG Emissions (106 Mg CO2e)Total
Outside CAInside CA
Life-Cycle Phase
5.23.12.1Total
-0.14-0.13-0.01End of Life
Use
Production
1.91.9
3.43.20.2
• Total is equivalent to the annual GHG emissions of 1.16 million automobiles (4,500 kg CO2e per car per year) or 1.3% of California’s net GHG emissions in 2004

GHG Emission Reduction Potential
** % reduction with respect to 2005 California PC life-cycle GHG emissions of 5.9*106 Mg CO2e
Source: Derived from (1) Masanet, E., L. Price, S. de la Rue du Can, R. Brown, and E. Worrell (2005). Optimization of Product Life Cycles to Reduce Greenhouse Gas Emi ssions in California. California Energy Commission, PIER Energy-Related Environmental Research. CEC-500-2005-110; and (2) Masanet, E., and A. Horvath (2006). An Analysis of Measures for Reducing the Life-Cycle Energy Use and Greenhouse Gas Emissions of California’s Personal Computers. University of California Energy Institute Technical Report, Berkeley, California.
28%Total
2%Turn PC off during periods of non-use
1%Purchase ENERGY STAR v3.0 compliant PCs
8%100% power management
Maximize recycling of PC control units
Upgrade to extend PC life by 50%
Reduce PFC emissions from semiconductor manufacture
Improve manufacturing energy efficiency
Measure*
3%
Approximate Incremental Life-Cycle GHG Emission Reduction (%)**
Life-Cycle Phase
1%
7%End of Life
Use
Production6%
* Measures are applied in a cascading fashion
Analysis of Select Policy Measures, 2005

Translation to “Low Carbon PC” Standard/Label
• Minimization of production-phase energy use and GHG emissions• Energy efficient supply chains (best practice, top quartile, etc.)
Ø Example: clean room HVAC efficiency can often be improved by 30% to 60%• Reduced PFC emissions during semiconductor manufacture• Reporting of embedded energy use and GHG emissions• Minimum recycled content• Designed for ease of upgrading ENERGY STAR©
• Minimization of use-phase energy use and GHG emissions• Best in class energy efficiency (e.g., ENERGY STAR certified)• High efficiency power supplies, minimal standby losses• Flat panel displays versus CRT monitors• Power management enabled• IEEE 1621 compliant (ease of power management standard)
• Minimization of disposal-phase energy use and GHG emissions• Guaranteed take-back and recycling with full end of life fate reporting• In-state recycling of materials• Designed for recycling and ease of dismantling• Reduction/elimination of toxic constituents (RoHS, EPEAT, and beyond)

Technical Potential for GHG Emissions Reduction
Projected Cumulative Life-Cycle GHG Emissions of California PCs (2005-2012)
Source: Masanet, E., and A. Horvath (2006). “An Analysis of Measures for Reducing the Life-Cycle Energy Use and Greenhouse Gas Emissions of California’s Personal Computers.” University of California Energy Institute Technical Report, Berkeley, California.
0
10
20
30
40
50
60
Baseline Scenario Low Carbon/Best Practice Scenario
Cum
ulat
ive
(200
5-20
12)
GH
G E
mis
sion
s (1
0^6
Mg
CO
2e)
In state emissions
Out of state emissions
Total emissions
Technical potential for GHG emissions reductions:
Total = 11.3 106 Mg CO2e
In state = 8.2 106 Mg CO2e
Out of state = 3.1 106 Mg CO2e

Research Challenges
l Uncertaintyl Large number of consumer products
» Need to pick 20-30» Significance and magnitude
l Dynamically changing supply chainsl Functional unitl Design changesl Updates over time

Contact Information:
Arpad HorvathAssociate Professor
Department of Civil and Environmental Engineering University of California, Berkeley
[email protected].: 510-642-7300
Eric Masanet
Environmental Energy Technologies DivisionLawrence Berkeley National Laboratory
[email protected].: 510-486-6794