liens code de la propriété intellectuelle. articles l 122....
TRANSCRIPT
AVERTISSEMENT
Ce document est le fruit d'un long travail approuvé par le jury de soutenance et mis à disposition de l'ensemble de la communauté universitaire élargie. Il est soumis à la propriété intellectuelle de l'auteur. Ceci implique une obligation de citation et de référencement lors de l’utilisation de ce document. D'autre part, toute contrefaçon, plagiat, reproduction illicite encourt une poursuite pénale. Contact : [email protected]
LIENS Code de la Propriété Intellectuelle. articles L 122. 4 Code de la Propriété Intellectuelle. articles L 335.2- L 335.10 http://www.cfcopies.com/V2/leg/leg_droi.php http://www.culture.gouv.fr/culture/infos-pratiques/droits/protection.htm
THÈSE Présentée à l’Université de Lorraine
Ecole Doctorale R.P.2E. : Ressources, Procédés, Produits, Environnement Laboratoire Réactions et Génie des Procédés (UMR 7274 CNRS)
pour l’obtention du grade de
Docteur de l’Université de Lorraine Spécialité : Génie des Procédés et des Produits
Par
Felipe BUENDIA-KANDIA
CELLULOSE VALORIZATION IN BIOREFINERY: SYNERGIES BETWEEN THERMOCHEMICAL AND
BIOLOGICAL PROCESSES
Soutenu le 27 Juin 2018 devant la Commission d’Examen
Rapporteurs : Barbara ERNST – IPHC, Université de Strasbourg, CNRS, France Nadège CHARON – IFP Energies Nouvelles, France
Examinateurs : Frédéric VOGEL – Paul Scherrer Institut, Suisse Emmanuel RONDAGS – LRGP, Université de Lorraine, CNRS, France Emmanuel GUEDON – LRGP – Université de Lorraine, CNRS (Directeur de thèse) Anthony DUFOUR – LRGP – Université de Lorraine, CNRS (co-directeur de thèse)
Invités : Franco BERRUTI – ICFAR, Western University, Canada Guillain MAUVIEL – LRGP - Université de Lorraine, CNRS


“Not everything that counts can be counted,
and not everything that’s counted truly counts”
Albert Einstein


Acknowledgements
Firstly, I would like to express my sincere gratitude to my supervisors Emmanuel Guedon,
Emmanuel Rondags, Guillain Mauviel and Anthony Dufour for the continuous support of my
Ph.D study and related research, for his patience, motivation, and immense knowledge. His
guidance helped me in all the time of research and writing of this thesis. I could not have
imagined having a better advisor and mentor for my Ph.D study.
Besides my advisors, I would like to thank the rest of my thesis committee for accepting
evaluation this work. I’m also very grateful with all the members of the laboratory, specially those
of Greener and BioProMo.
Last but not the least, special thanks to my family that supported me all along this journey and
to my dear friends for all the good moments that we spent together.

OUTLINE
INTRODUCTION .....................................................................................................................19
I. General context .............................................................................................................................19
II. Scope and objective .....................................................................................................................21
III. Thesis outline ..............................................................................................................................22
A. LITERATURE REVIEW ...................................................................................................25
I. Lignocellulosic biomass................................................................................................................25
1. Definition ...................................................................................................................................25
2. Global composition ...................................................................................................................27
3. Multi-scale organization of lignocellulosic biomass ...............................................................30
3.1. Macroscopic structure of biomass ......................................................................................31
3.2. Microscopic scale: Porous structure ...................................................................................33
3.3. Biomacromolecules properties ............................................................................................34
3.3.1. Cellulose .......................................................................................................................35
3.3.2. Hemicellulose ..............................................................................................................36
3.3.3. Lignin ...........................................................................................................................37
3.4. Extractives ............................................................................................................................39
II. The biorefinery: a deconstruction game ....................................................................................41
1. Biorefinery classification ...........................................................................................................41
2. Biomass pretreatment and fractionation .................................................................................45
2.1. Mechanical pretreatment .....................................................................................................45
2.2. Pulping pretreatments .........................................................................................................46
2.3. Conclusion ............................................................................................................................48
3. Thermochemical depolymerization of cellulose .....................................................................49
3.1. Hydrothermal liquefaction of cellulosic materials ............................................................51
3.1.1. Concept ........................................................................................................................51
3.1.2. Effect of hydrolysis conditions on product distribution ..........................................54
3.1.3. Reactors and processes ...............................................................................................55
3.2. Pyrolysis of cellulose ...........................................................................................................56
3.3. Conclusion ............................................................................................................................58
4. Biological conversion of cellulosic materials ...........................................................................58
4.1. Brief history of fermentation ...............................................................................................59
4.2. Current definition of fermentation .....................................................................................60
4.3. ABE Fermentation process ..................................................................................................61
4.4. Clostridial species ................................................................................................................62
4.5. Clostridium acetobutylicum ....................................................................................................63
4.5.1. Metabolism ..................................................................................................................64
4.5.2. Growth requirements ..................................................................................................66
4.5.3. Inhibition ......................................................................................................................68
4.6. Conclusion ............................................................................................................................68
III. Combining thermochemical and biological conversion of biomass .......................................70
1. Existing concepts .......................................................................................................................70
2. Proposed concept in this PhD ..................................................................................................70
IV. References ...................................................................................................................................74
B. RESULTS ..................................................................................................................................85
I. Hydrothermal conversion of cellulosic materials ......................................................................85
1. Article 1: Decomposition of cellulose in hot-compressed water: detailed analysis of the
products and effect of operating conditions ...............................................................................86
1.1. Introduction..........................................................................................................................87
1.2. Materials and Methods ........................................................................................................91
1.2.1. Reactants ......................................................................................................................91
1.2.2. Liquefaction in hot-compressed water ......................................................................92
1.2.3. Analysis of the crystalline structure of solid residues by XRD ................................93
1.2.4. Soluble products analysis ...........................................................................................94
1.2.5. Permanent gas analysis ...............................................................................................96
1.3. Results and Discussion ........................................................................................................96
1.3.1. Mass balance ................................................................................................................96
1.3.2. XRD of the solid residues ...........................................................................................97
1.3.3. Characterization of liquids ....................................................................................... 100
1.3.4. Permanent gas composition ..................................................................................... 110
1.3.5. Mechanism of cellulose conversion in HCW .......................................................... 111
1.4. Conclusion .......................................................................................................................... 114
1.5. References ........................................................................................................................... 115
2. Article 2: Production of soluble sugars: Coupling of fractionation and hydrothermal
depolymerization of woody biomass ........................................................................................ 121
2.1. Introduction........................................................................................................................ 122
2.2. Materials and Methods ...................................................................................................... 125
2.2.1. Biomass and reactants ............................................................................................... 125
2.2.2. Biomass delignification ............................................................................................. 125
2.2.3. Liquefaction in HCW ................................................................................................ 126
2.2.4. Chemical analysis ...................................................................................................... 127
2.3. Results and discussion....................................................................................................... 128
2.3.1. Biomass fractionation ................................................................................................ 129
2.3.2. Liquefaction of the beech-extracted pulp in HCW ................................................. 134
2.4. Conclusion .......................................................................................................................... 143
2.5. References ........................................................................................................................... 144
II. Biological conversion of cellulose-derived products .............................................................. 151
1. Article 3: Diauxic growth of Clostridium acetobutylicum ATCC 824 when grown on mixtures
of glucose and cellobiose ............................................................................................................ 152
1.1. Introduction........................................................................................................................ 153
1.2. Materials and Methods ...................................................................................................... 156
1.2.1. Microorganism and media ....................................................................................... 156
1.2.2. Fermentation .............................................................................................................. 157
1.2.3. Analyses ..................................................................................................................... 157
1.2.4. Calculations ............................................................................................................... 158
1.3. Results ................................................................................................................................. 158
1.3.1. General growth and metabolic features of Clostridium acetobutylicum ATCC 824
cultivated with glucose or cellobiose ................................................................................ 159
1.3.2. Fermentation of glucose and cellobiose mixtures by C. acetobutylicum: ............. 162
1.4. Discussion........................................................................................................................... 164
1.5. References ........................................................................................................................... 166
2. Article 4: From wood to building blocks: ABE fermentation of carbohydrates produced by
hydrothermal depolymerization of wood pulps ...................................................................... 171
2.1. Introduction........................................................................................................................ 172
2.2. Materials and Methods ...................................................................................................... 174
2.2.1. Substrate preparation ................................................................................................ 175
2.2.2. Fermentation .............................................................................................................. 175
2.2.3. Analysis ...................................................................................................................... 176
2.3. Results and discussion....................................................................................................... 176
2.3.1. Fractionation and hydrolysis of beech wood .......................................................... 177
2.3.2. Fermentation of a cellulose-derived mixture of sugars .......................................... 179
2.3.3. Fermentation of cellulose hydrolysates ................................................................... 181
2.3.4. Fermentation of hydrolysates from delignified beech ........................................... 185
2.4. Conclusion .......................................................................................................................... 188
2.5. References ........................................................................................................................... 189
III. Integration of thermochemical and biochemical processes .................................................. 193
1. Article 5: Process integration modeling for a wood biorefinery: Pulping, Liquefaction and
Fermentation to produce Building Blocks................................................................................. 193
1.1. Introduction........................................................................................................................ 193
1.2. Presentation of the Aspen Plus® model .......................................................................... 196
1.2.1. Overview of the process ........................................................................................... 196
1.2.2. Definition of compounds .......................................................................................... 197
1.2.3. Process modeling....................................................................................................... 198
1.3. Results and discussion....................................................................................................... 201
1.3.1. Mass balances ............................................................................................................ 201
1.3.2. Energy balances ......................................................................................................... 204
1.4. Conclusion .......................................................................................................................... 207
C. CONCLUSIONS AND PERSPECTIVES ............................................................. 213
D. APPENDICES...................................................................................................................... 219
I. Appendice 1: Article 6 (in development): Hydrothermal conversion of cellulose-rich pulps in
a fixed-bed reactor. Performed at Curtin University in Perth, Australia................................... 221
II. Appendice 2: Article 7 (in development): Fast pyrolysis of cellulose with a stage
condensation system for the recovery of bio-oil fractions. ......................................................... 225
III. Appendice 3: Fast pyrolysis of cellulosic materias performed in a micro-fluidized bed
reactor coupled to SPI-TOF MS..................................................................................................... 234
IV. Appendice 4: Main metabolic pathways of cellobiose utilization by C. acetobutylicum ..... 235
V. Appendices 5: Effect of the pH on the acidogenic phase of C. acetobutylicum when grown on
glucose or cellobiose in a batch bioreactor. .................................................................................. 236
E. RESUMÉ DE LA THESE EN FRANÇAIS ................................................................................ 239
I. Objectif ......................................................................................................................................... 239
II. Bibliographie .............................................................................................................................. 240
1. De la biomasse aux sucres ...................................................................................................... 240
2. La fermentation de dérivés de la cellulose ............................................................................ 242
III. Méthodologie développée durant cette thèse ........................................................................ 243
1. Préparation de la matière première ....................................................................................... 244
2. Conversion thermochimique de la (ligno)cellulose .............................................................. 244
3. La fermentation des sucres dérivés de la (ligno)cellulose .................................................... 245
IV. Résultats .................................................................................................................................... 246
1. Conversion thermochimique de la (ligno)cellulose .............................................................. 246
2. La fermentation des sucres dérivés de la (ligno)cellulose .................................................... 249


Figure list
Figure 1.Representation of the multi-scale structure of lignocellulosic biomass.17........................31
Figure 2. Schematic of wood anatomy.18 ...........................................................................................32
Figure 3. Composition of wood according to the plant species ......................................................33
Figure 4. Schematic of wood hierarchical structure: from the pore to the molecule.23 ..................34
Figure 5. Chemical structure of cellulose. .........................................................................................35
Figure 6. Monomeric units found in hemicelluloses. .......................................................................37
Figure 7. Principal monomeric units found in lignin.38....................................................................37
Figure 8. Representation of the lignin structure.40 ............................................................................38
Figure 9. Examples of extractives found in lignocellulosic biomass.44 ...........................................39
Figure 10. Schematic of biomass valorization pathways.48 ..............................................................42
Figure 11. Scheme of the proposed biorefinery. ...............................................................................44
Figure 12. Density, static dielectric constant and ion dissociation constant of water at 30 MPa as a
function of temperature.88 ..................................................................................................................52
Figure 13. Proposed reaction mechanism of microcrystalline cellulose in supercritical water. 1)
Swelled (or Dissolved) cellulose; 2) cellooligosaccharides; 3) glucose; 4) erythrose; 5)
glycolaldehyde; 6) fructose; 7) glyceraldehyde; 8) dihydroxyacetone; 9) pyruvaldehyde; 10) 5-
HMF; 11) 2-furfural; 12) glucopyranosyl-erythrose; 13) glucopyranosyl-glycol-aldehyde; 14)
anhydro-cellooligosaccharides; 15) levoglucosan ............................................................................53
Figure 14. Simplified cellulose pyrolysis mechanism.108 ..................................................................57
Figure 15. Fermentation through history.116–118.................................................................................59
Figure 16. Sporulation cycle by endospore-forming bacteria.153 .....................................................63
Figure 17. Main metabolic pathways of C. acetobutylicum. Intercellular enzymes: E1, pyruvate-
ferredoxin oxidoreductase; E2, ferredoxin-NAD reductase; E3, hydrogenase; E4,
phosphotransacetylase; E5, acetate kinase (encoded by ask); E6, acetaldehyde dehydrogenase; E7,
ethanol dehydrogenase; E8. thiolase; E9, CoA-transferase (encoded by ctfAB); E10, acetoacetate
decarboxylase; E11, β-hydroxybutyryl-CoA dehydrogenase; E12, crotonase; E13, butyryl-CoA
dehydrogenase; E14, phosphotrans butyrylase; E15, butyrate kinase (encoded by buk); E16,
butyraldehyde dehydrogenase (encoded by adhE); E17, butanol dehydrogenase (encoded by
bdhB).159 ...............................................................................................................................................65
Figure 18. Schematic of a bioreactor with the variables influencing a fermentation process.162 ...67
Figure 19. Scheme of the proposed biorefinery strategy. .................................................................71
Figure 20. Schematic view of cellulose thermochemical depolymerization in hot-compressed
water (adapted from Matsumura et al.) ............................................................................................90
Figure 21. Experimental procedure and conducted analysis ..........................................................92
Figure 22. Mass balance for cellulose liquefaction in HCW as a function of the reaction
temperature (after 120min at isothermal condition) ........................................................................96
Figure 23. XRD patterns of cellulose Avicel PH-101 and solid residues after cellulose liquefaction
in HCW during 2h at different temperatures. a) reference Avicel PH-101, b) 180ᵒC, c) 220ᵒC and
d) 260ᵒC. Crystallinity index (CI) for each sample are also indicated. ............................................98
Figure 24. Total sugars and non-sugars fractions in the liquid phase as a function of the reaction
temperature (after 120 min of isothermal reaction in HCW) ......................................................... 100
Figure 25. TIC obtained by SEC-ESI-MS of the liquid phase during cellulose liquefaction in HCW
as a function of the retention time for the 3 temperatures of cellulose conversion studied (180, 220
and 260°C) and as a function of liquefaction reaction time (7 samplings from initial isothermal
time to 120min) ................................................................................................................................. 102
Figure 26. SIM mode chromatogram following the chlorine adducts [M+35]- and [M+37]- of
cellobiose (M=342.3) at reaction temperatures a) 180ᵒC, b) 220ᵒC and c) 260ᵒC. The cellobiose
isomer is most probably cellobiulose or epicellulose (see supporting information). .................. 104
Figure 27. HPAEC-PAD chromatograms of a recovered liquid from cellulose liquefaction in HCW
for 2 h at 180ᵒC using different mobile phase concentrations (mM of NaOH, indicated on the
upper left side of each panel). The peaks were assigned according to the retention time of pure
chemicals for each mobile phase concentration.............................................................................. 105
Figure 28. Schematic of the HPAEC performance for monomer and oligomers analysis indicating
the effect of the eluent on the resolution, intensity and analysis time for a given CarboPac column.
Three different columns are presented according to its most appropriate use: CarboPac PA10:
monomers, CarboPac PA100: mono- and oligomers and CarboPac PA200: high-DP oligomers.
............................................................................................................................................................ 105
Figure 29. Mass yields evolution for the major compounds quantified by HPAEC-PAD at
different reaction temperatures: panels a-c at 180°C, d-f at 220°C and g-i at 260°C. ................... 107
Figure 30. Schematic of the main reaction pathways of cellulose liquefaction in HCW adapted
from (Matsumura et al. 2006) and based on this work, highlighting the temperature that promotes
each reaction (R) under our investigated conditions. R1, R3=(Sasaki et al. 1998), R2=(Matsumura
et al. 2006), R4, R6=(Kabyemela et al. 1999; Yu and Wu 2011), R5=(Sasaki, Furukawa, et al. 2002;
Yu, Shafie, and Wu 2013), R7, R8, R9=(Sasaki, Furukawa, et al. 2002; Yu, Shafie, and Wu 2013),
R10=(Watanabe et al. 2005; Yu and Wu 2011), R11=(Bilik 1972; Román-Leshkov et al. 2010),
R12=(Williams and Onwudili 2006) and R13=(Guo et al. 2015; Y. Liu et al. 2017). ..................... 112
Figure 31. Schematic representation of the fractionation process coupled to a depolymerization
stage in hot-compressed water. The typical yields obtained in this work are indicated for the most
representative compounds. The yields of liquefaction products are calculated in relation to the
initial pulp. ........................................................................................................................................ 129

Figure 32. XRD patterns of a) untreated beech, b) organosolv beech pulp, c) sodium
chlorite/acetic acid beech pulp and d) microcrystalline cellulose (Avicel PH-101). Crystallinity
index (CI) and cellulose content are indicated for each panel. * Non-identified peaks............... 133
Figure 33. Product distribution after liquefaction in HCW of avicel cellulose, beech, organosolv
and sodium chlorite/acetic acid (SC/AA) beech-extracted pulp as function of the reaction
temperature after 2h reaction time. ................................................................................................. 135
Figure 34. XRD pattern of the solid residues of a) Beech. b) organosolv pulp and c) SC/AA pulp
after liquefaction in HCW under isothermal conditions. .............................................................. 136
Figure 35. Water soluble sugar content for each temperature and extraction method. .............. 137
Figure 36. Mass yield of glucose, mannose, xylose, fructose, erythrose and 5-HMF obtained by
liquefaction of lignocellulosic pulps in HCW at a) 180ᵒC, b) 200ᵒC and c) 220ᵒC for 2h under
isothermal conditions. ...................................................................................................................... 138
Figure 37. Mass yield of levoglucosan, glycolaldehyde, cellobiose, cellotriose, cellotetraose and
cellopentaose obtained by liquefaction of lignocellulosic pulps in HCW at a) 180ᵒC, b) 200ᵒC and
c) 220ᵒC for 2h under isothermal conditions. .................................................................................. 139
Figure 38. Kinetics of growth and metabolism of glucose or cellobiose as the substrate by C.
acetobutylicum. (a) Glucose as the substrate (136 mM) and glucose-pregrown cells as the inoculum.
(b) Cellobiose as the substrate (67 mM) and glucose-pregrown cells as the inoculum. The dashed
line represents le beginning of the lag phase after glucose was exhausted. (c) Cellobiose as the
substrate (67 mM) and cellobiose-pregrown cells as the inoculum. (d), (e) and (f) are the respective
product kinetics of (a), (b) and (c). Each graph is representative of at least three independent
experiments (n = 3). .......................................................................................................................... 160
Figure 39a reports sequential consumption of glucose and cellobiose as well as growth kinetics
observed when pre-cultures were performed with glucose. In this experiment, the culture
medium contained a glucose and cellobiose mixture with respective initial concentrations of 47
and 43.3 mM. ..................................................................................................................................... 162
Figure 40. Kinetics of growth and metabolism of D-glucose/cellobiose mixtures by C.
acetobutylicum. (a) glucose-pregrown cells as the inoculum, initial glucose or cellobiose
concentrations were 46.97 and 43.30 mM respectively. (b) cellobiose-pregrown cells as the
inoculum, initial glucose or cellobiose concentrations were 58.7.97 and 38.8 mM respectively. (c)
and (d) are the respective product kinetics of (a), (b). Each graph is representative of at least
three independent experiments (n = 3). .......................................................................................... 163
Figure 41b reports sequential consumption of glucose and cellobiose as well as growth kinetics
observed when the fermentation process was inoculated with cellobiose pregrown cells. The
respective initial concentrations of glucose and cellobiose in the bioreactor were 58.7 and 38.8
mM. Interestingly, a lag phase of 4 hours without any glucose or cellobiose consumption was
observed. Then cells started to use glucose until exhaustion. Then cellobiose utilization started
about 2 hours after glucose was entirely depleted. However, the maximal growth rate was barely
slower with cellobiose (µmax of 0.22 h-1), compared to glucose (0,27 h-1). Product patterns (Figures
42c,d) obtained with mixtures of glucose and cellobiose were similar to those previously observed
in Figure 38e,f,g whatever the culture conditions. ......................................................................... 163
Figure 43. Schematic of the full process: biomass fractioning. liquefaction in HCW and
fermentation. ..................................................................................................................................... 175
Figure 44. Mass yields of the different chemical families according to its fermentability. All the
values are calculated relative to the initial mass of biomass used for the liquefaction in HCW
under isothermal conditions. ........................................................................................................... 178
Figure 45. Utilization of a cellulose-derived carbohydrates by C. acetobutylicum. Microcrystalline
cellulose (Avicel PH-101) was hydrolysed in HCW at 180ᵒC for 2 hours at isothermal conditions.
............................................................................................................................................................ 180
Figure 46. ABE fermentation from hydrolysates of microcrystalline cellulose (Avicel PH-101)
produced by liquefaction in HCW at different temperatures: a) 180ᵒC, b) 200ᵒC, c) 220ᵒC, d) 240ᵒC
and 260ᵒC, under isothermal conditions. Products: acetic acid (dark blue, ●), lactic acid (green, ),
butyric acid (yellow, ), ethanol (purple, ○), acetone (red, Δ), butanol (light blue, □), ABE (brown,
) and total sugars (grey, x). ............................................................................................................ 182
Figure 47. ABE fermentation from hydrolysates of delignified beech (Fagus sylvatica). Two
different delignification processes were used: Organosolv and SC/AA, then the pulps were
liquefied in HCW at different temperatures: Organsolv pulp a) 180ᵒC, b) 200ᵒC, c) 220ᵒC and
SC/AA pulp d) 180ᵒC, e) 200ᵒC, f) 220ᵒC, under isothermal conditions. Products: acetic acid (dark
blue, ●), lactic acid (green, ), butyric acid (yellow, ), ethanol (purple, ○), acetone (red, Δ),
butanol (light blue, □), ABE (brown, ) and total sugars (grey, x). .............................................. 186
Figure 48. Scheme of the biorefinery process ................................................................................. 196
Figure 49. Aspen plus flowsheet for the organosolv pulping process zone. ................................ 199
Figure 50. Aspen plus flowsheet for the liquefaction process zone. ............................................. 199
Figure 51. Aspen plus flowsheet for the ABE fermentation process zone. ................................... 200
Figure 52. Sankey diagram of the mass balance through the global process. .............................. 202
Figure 53. Sankey diagram of the energy flow through the integrated wood biorefinery process.
............................................................................................................................................................ 204
Table list
Table 1. Principal categories of biomass feedstocks. Adapted from “Biorefineries”3 ....................26
Table 2. Summary of the proximate and ultimate analysis of different biomasses.4 .....................27
Table 3. Inorganic concentration (mg/kg) in wood ashes from different tree species.10–14 ...........29
Table 4. Macromolecules composition of some lignocellulosic feedstocks. ...................................35
Table 5. Major biorefinery platforms.51,52,47,48,53,46 ..............................................................................43
Table 6. Advantages and drawbacks of different pretreatment methods for lignocellulosic
biomass39,63–65,79,81,82 ..............................................................................................................................46
Table 7. Operating conditions according to the type of pyrolysis.105,107..........................................56
Table 8. Crystallinity index (%) for all the reflection peaks of crystalline cellulose. Calculated
relative to IAM and for λ (Kα1)=1.5406 ...............................................................................................99
Table 9. Permanent gases yields in mg/g of cellulose ................................................................... 110
Table 10. Solid and macromolecules fractionation yields of beech pulps obtained by organosolv
and SC/AA processes. Yields are calculated relative to the initial content of the respective initial
lignin, cellulose and hemicellulose content of the raw beech. ....................................................... 130
Table 11. Composition of the raw and fractionated beech. Mass yields (dry basis) were calculated
relative to the respective pulp. Cellulose was taken as glucose. *Oxygen was calculated by
difference. .......................................................................................................................................... 131
Table 12. Composition of the permanent gas obtained by liquefaction in HCW......................... 142
Table 13. Productivities of total fermentation products after 48 and 72 (indicated in the brackets).
............................................................................................................................................................ 187
Table 14. Mass yields of fractionation, liquefaction and fermentation products from wood-pulps
(Fagus sylvatica). Yields are based on the last conversion stage. .................................................... 188
Table 15. List of compounds used in the model with the corresponding formula and molecular
weight. ............................................................................................................................................... 197
Table 16. Elemental composition of the non-conventional compounds. ...................................... 198
Table 17. Conditions used in the different blocks integration the proposed biorefinery process.
............................................................................................................................................................ 201
Table 18. Net heat duty of the different blocks of the biorefinery process. .................................. 206

18
19
INTRODUCTION
I. General context
Global population is increasing continuously and requires more and more energy and chemicals
which production relies on fossil resources: oil, coal and gas.
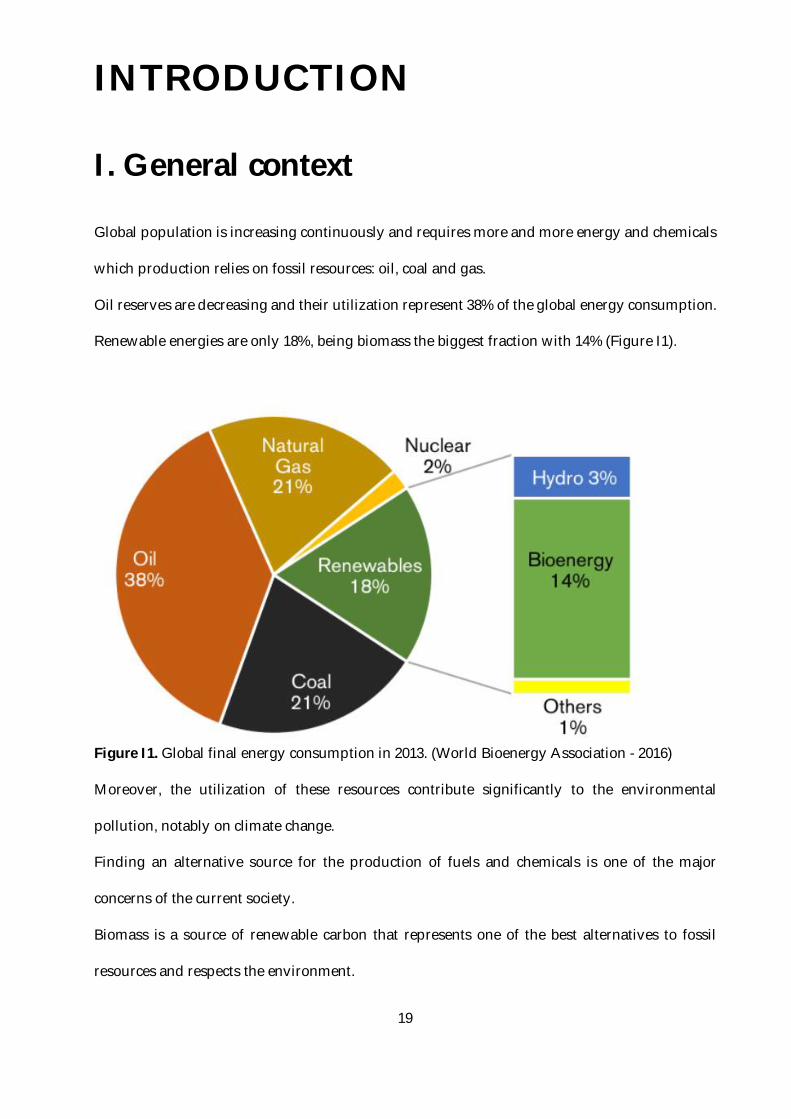
Oil reserves are decreasing and their utilization represent 38% of the global energy consumption.
Renewable energies are only 18%, being biomass the biggest fraction with 14% (Figure I1).
Figure I1. Global final energy consumption in 2013. (World Bioenergy Association - 2016)
Moreover, the utilization of these resources contribute significantly to the environmental
pollution, notably on climate change.
Finding an alternative source for the production of fuels and chemicals is one of the major
concerns of the current society.
Biomass is a source of renewable carbon that represents one of the best alternatives to fossil
resources and respects the environment.
20
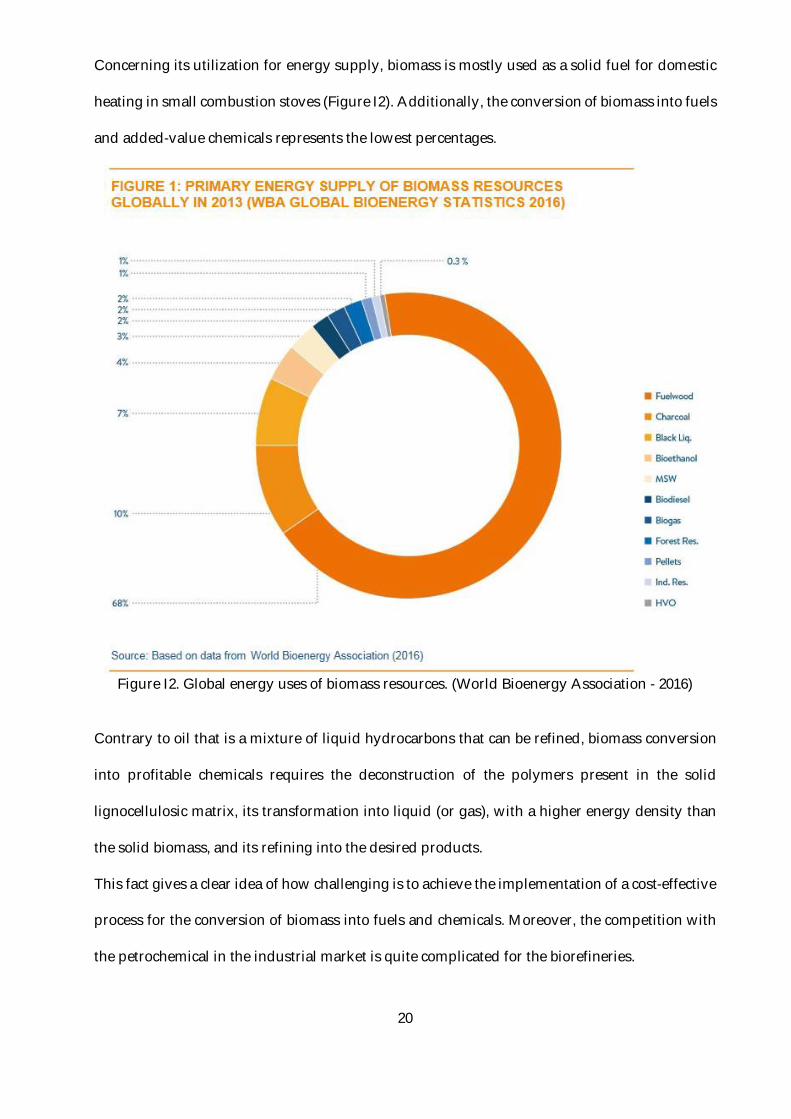
Concerning its utilization for energy supply, biomass is mostly used as a solid fuel for domestic
heating in small combustion stoves (Figure I2). Additionally, the conversion of biomass into fuels
and added-value chemicals represents the lowest percentages.
Figure I2. Global energy uses of biomass resources. (World Bioenergy Association - 2016)
Contrary to oil that is a mixture of liquid hydrocarbons that can be refined, biomass conversion
into profitable chemicals requires the deconstruction of the polymers present in the solid
lignocellulosic matrix, its transformation into liquid (or gas), with a higher energy density than
the solid biomass, and its refining into the desired products.
This fact gives a clear idea of how challenging is to achieve the implementation of a cost-effective
process for the conversion of biomass into fuels and chemicals. Moreover, the competition with
the petrochemical in the industrial market is quite complicated for the biorefineries.
21
The most common industrial scale biorefineries for fuel production used some thermomechanical
pretreatment followed by biological conversion processes (enzymatic hydrolysis and
fermentation with yeast). Other type of biorefinery uses only thermochemical conversion such as
gasification or pyrolysis.
Novel biorefinery strategies are required in order to overcome the technological and economic
challenges of the industry. Implementation of biorefineries needs the support of policies and
environmental law enforcement to guarantee the energetic transition without compromise the
current economic development.
There is no industrial scale process combining both of these methods and technologies (i.e.
thermochemical and biological). Besides, only few works combining thermochemical and
biological processes have been reported and this might represent a promising methodology for a
versatile biorefinery.
II. Scope and objective
In this work, a new strategy of biorefinery, using thermochemical and biological processes, is
proposed. The main idea is to take advantage of the synergies between the strong points of each
process and define a novel alternative for an efficient conversion of lignocellulosic biomass into
profitable fuels and chemicals.
This biorefinery strategy employs three major stages. Firstly, a fractionation of the lignocellulosic
matrix, recovering a cellulose-rich pulp. The lignin-rich stream could be further valorized but this
was not studied during this Ph.D. Secondly, the cellulose-rich pulp is depolymerized by a
thermochemical process (liquefaction or pyrolysis) in order to produce a mixture of soluble
sugars. Finally, a bacterial fermentation using C. acetobutylicum, converts the sugars into fuels or
building blocks.
22
The thermochemical process is faster than enzymatic depolymerization of cellulose. Bacterial
metabolism allows producing interesting chemicals by fermentation processes.
Furthermore, in the background of this PhD, several analytical methods were implemented in
order to properly characterize the product of each stage of the biorefinery and a model using
Aspen Plus® was used for establishing the mass and energy balance to analyze the energetic
performance of the different technologies involved in the global process.
This work presents a first methodological approach on how thermochemical and biochemical
process could be combined. This methodology could be then applied to the production of other
building blocks by targeting 1) the pulping method, 2) the thermochemical process and 3) the
biochemical process. We believe that this approach is of interest and may be versatile. This work
presents first results at laboratory scale and much development is still needed to push this
concept up to pilot and then commercial scales.
III. Thesis outline
The section A summarizes all the general concepts about lignocellulosic biomass and its
conversion through thermochemical and biological processes, highlighting hydrothermal
liquefaction and bacterial fermentation, that are the processes of interest for this work. A global
vision of the current biorefinery studies combining thermochemical and biological processes is
briefly addressed.
The section B contains the results of this study presented in five articles that are divided in three
chapters or sub-sections.
The first section (I) includes two articles presenting the results about the hydrothermal
conversion of cellulosic materials. The first one is a study about the deconstruction of model
cellulose (microcrystalline, Avicel) in hydrothermal media using several analytical methods and
rationalizing the main reaction mechanisms. The second one concerns the hydrothermal
23
depolymerization of fractionated woody biomass. Two fractionation methods were used
(organosolv and SC/AA) to obtain cellulose-pulps. The effect of the fractionation method on the
composition and yields of hydrothermal liquefaction products was assessed.
The second section (II) contains two articles about the fermentation of cellulose-derived
substrates by C. acetobutylicum. The first one presents a study about the pre-culture and culture
of C. acetobutylicum grown on glucose/cellobiose mixtures, unraveling discontinuities in its
growth and substrate utilization kinetics. The second one comprises the fermentation of cellulose-
derived mixtures produced by liquefaction of microcrystalline cellulose, woody biomass and the
two cellulose-rich pulps. This work allowed establishing for the first time the metabolism and an
order of utilization of a mixture of cello-oligosaccharides. Building blocks yields were also
assessed.
The third and final section (III) of the results contains one article about the process integration
modeling. A simple model was developed in Aspen Plus® to establish the mass and energy
balance of the global biorefinery process proposed in this work: biomass fractionation,
hydrothermal liquefaction and bacterial fermentation. An energy analysis of each one of the
operation units was performed.
Conclusions and perspectives are addressed in section C. Furthermore, other works performed
during this PhD are presented in the appendices, in section D. These results are not included in
the main manuscript to avoid the over extension of the manuscript and because they still need
deeper assessment and discussion.
The first one is the result of an international collaboration with Pr. Hongwei Wu at Curtin
University in Perth, Australia. For this purpose, I personally visit his laboratory in order to
perform experiments with their fixed-bed liquefaction reactor of the cellulose-rich pulps
produced in this work.
Pyrolysis was studied for the production of sugars from cellulose and cellulose-rich pulps. An
international collaboration was established with Pr. Franco Berruti and Pr. Cedric Briens at the
24
Institute of Chemicals and Fuels from Alternative Resources (ICFAR) in London, Canada. I had
the opportunity to visit their facilities to carry out experiments of fast pyrolysis of
microcrystalline cellulose (Avicel) with a staged condensation system to recover fractions with
high content of sugars (levoglucosan, cellobiosan). The hydrolysis and bacterial fermentation of
these oils was studied as well. Besides, fast pyrolysis of cellulose-rich pulps, the same used in all
the experiments, were performed using a micro-fluidized bed reactor coupled to a single
photoionization (SPI) mass spectrometer (done in LRGP, Nancy).
25
A. LITERATURE REVIEW
This section concerns a brief literature review that will facilitate the understanding of the results
reported in this work. It is divided in three sections. In the first sub-section, the general
characteristics of lignocellulosic biomass are introduced. In the second sub-section, the
conversion of biomass is explained highlighting hydrothermal liquefaction and fermentation.
Only general concepts are included in this part of the manuscript, since each result section
features an introduction providing a specific state of the art for each specific topic studied in these
sections.
I. Lignocellulosic biomass
Lignocellulosic biomass is the principal and more interesting raw material used in this work. It is
the main feedstock used in an integrated biorefinery. Its nature and properties play a critical role
in the development of the different processes, which allowing its fractionation and
transformation into profitable products, take part in an integrated biorefinery.
Global composition, macro- and microscopic structure and its relation to its recalcitrant matrix
are discussed in the next section, highlighting their influence on the conversion technologies used
in this work.
1. Definition
Biomass is an organic material derived from living or recently living organism. In this general
context, biomass can be all the organic material coming from a vegetal, animal, fungus or bacterial
source.1 However, the concept of “biomass” may change according to the field of study. In the
26
energy field, the definition of biomass corresponds to organic material that can become a source
of energy by combustion, anaerobic digestion and by other chemical transformations. On the
other hand, the “biomass” term is generally used to define the cell dry weight in the field of
microbiology.2 To avoid confusions, in this document, bacterial biomass will be always
denominated as cell density. In this manner, lignocellulosic biomass or only biomass will
correspond only to the plant based material. This renewable resource may come from different
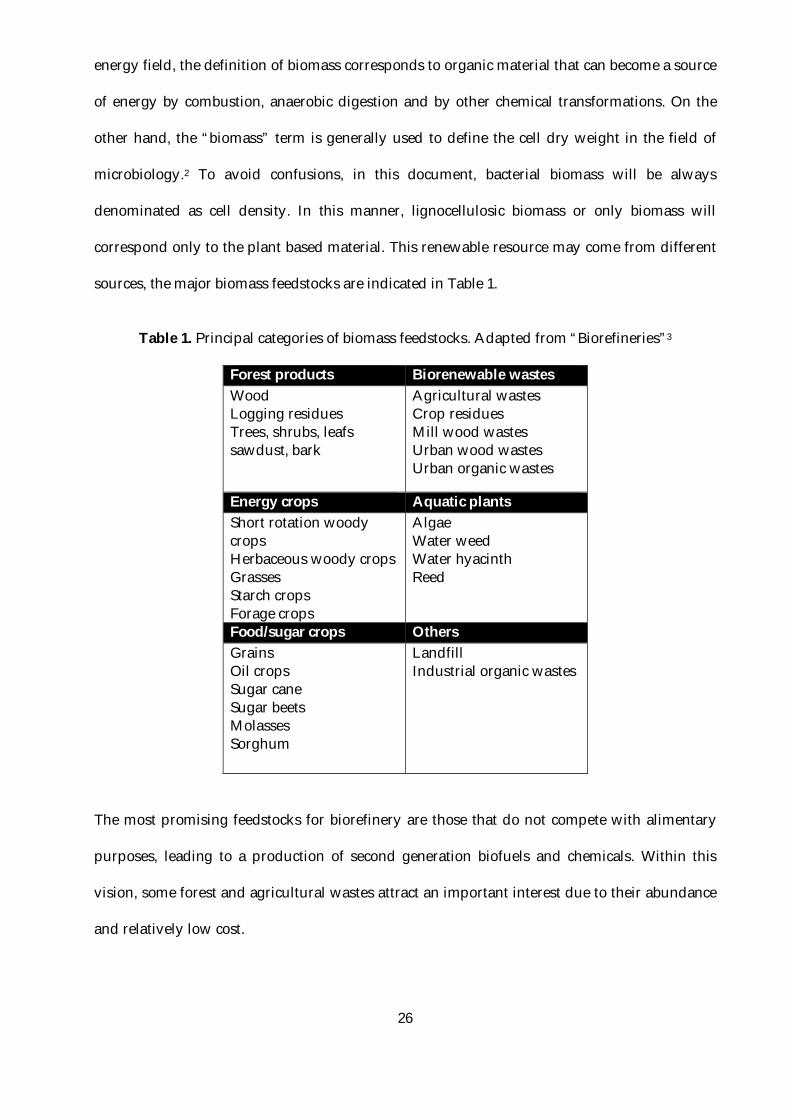
sources, the major biomass feedstocks are indicated in Table 1.
Table 1. Principal categories of biomass feedstocks. Adapted from “Biorefineries”3
Forest products Biorenewable wastes Wood Logging residues Trees, shrubs, leafs sawdust, bark
Agricultural wastes Crop residues Mill wood wastes Urban wood wastes Urban organic wastes
Energy crops Aquatic plants Short rotation woody crops Herbaceous woody crops Grasses Starch crops Forage crops
Algae Water weed Water hyacinth Reed
Food/sugar crops Others Grains Oil crops Sugar cane Sugar beets Molasses Sorghum
Landfill Industrial organic wastes
The most promising feedstocks for biorefinery are those that do not compete with alimentary
purposes, leading to a production of second generation biofuels and chemicals. Within this
vision, some forest and agricultural wastes attract an important interest due to their abundance
and relatively low cost.
27
2. Global composition
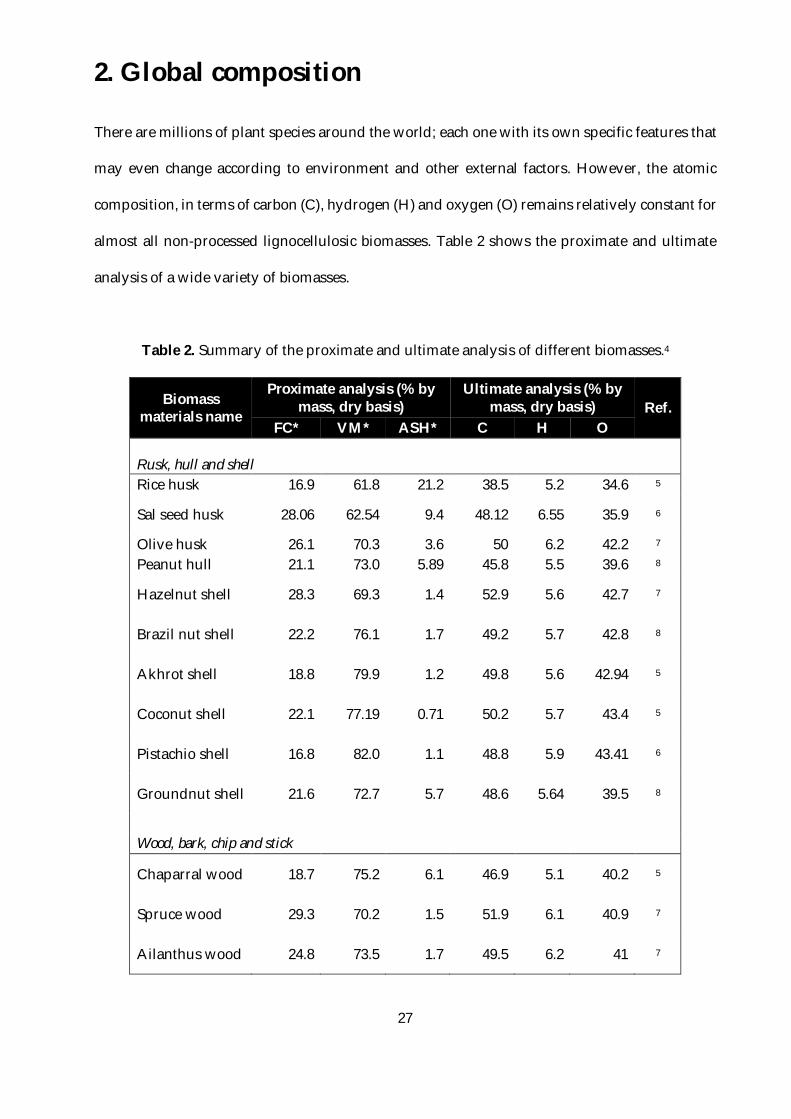
There are millions of plant species around the world; each one with its own specific features that
may even change according to environment and other external factors. However, the atomic
composition, in terms of carbon (C), hydrogen (H) and oxygen (O) remains relatively constant for
almost all non-processed lignocellulosic biomasses. Table 2 shows the proximate and ultimate
analysis of a wide variety of biomasses.
Table 2. Summary of the proximate and ultimate analysis of different biomasses.4
Biomass materials name
Proximate analysis (% by mass, dry basis)
Ultimate analysis (% by mass, dry basis) Ref.
FC* VM* ASH* C H O
Rusk, hull and shell Rice husk 16.9 61.8 21.2 38.5 5.2 34.6 5
Sal seed husk 28.06 62.54 9.4 48.12 6.55 35.9 6
Olive husk 26.1 70.3 3.6 50 6.2 42.2 7 Peanut hull 21.1 73.0 5.89 45.8 5.5 39.6 8
Hazelnut shell 28.3 69.3 1.4 52.9 5.6 42.7 7
Brazil nut shell 22.2 76.1 1.7 49.2 5.7 42.8 8
Akhrot shell 18.8 79.9 1.2 49.8 5.6 42.94 5
Coconut shell 22.1 77.19 0.71 50.2 5.7 43.4 5
Pistachio shell 16.8 82.0 1.1 48.8 5.9 43.41 6
Groundnut shell 21.6 72.7 5.7 48.6 5.64 39.5 8
Wood, bark, chip and stick
Chaparral wood 18.7 75.2 6.1 46.9 5.1 40.2 5
Spruce wood 29.3 70.2 1.5 51.9 6.1 40.9 7
Ailanthus wood 24.8 73.5 1.7 49.5 6.2 41 7
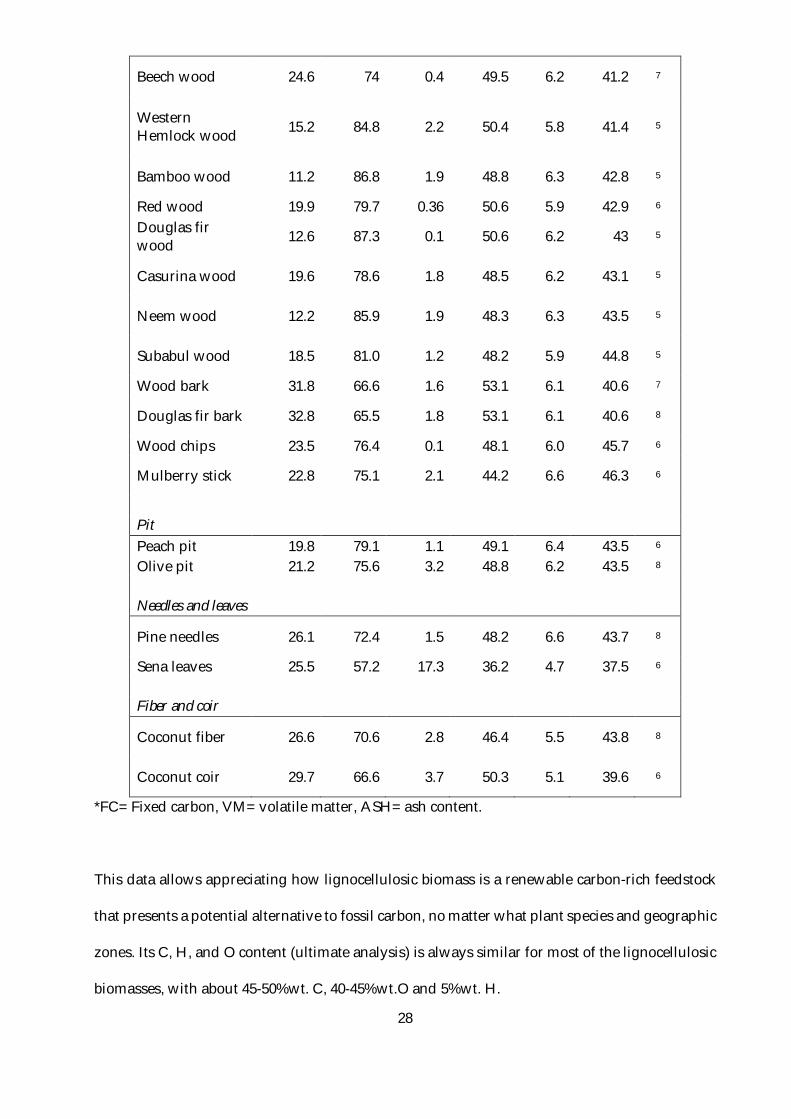
28
Beech wood 24.6 74 0.4 49.5 6.2 41.2 7
Western Hemlock wood 15.2 84.8 2.2 50.4 5.8 41.4 5
Bamboo wood 11.2 86.8 1.9 48.8 6.3 42.8 5
Red wood 19.9 79.7 0.36 50.6 5.9 42.9 6 Douglas fir wood 12.6 87.3 0.1 50.6 6.2 43 5
Casurina wood 19.6 78.6 1.8 48.5 6.2 43.1 5
Neem wood 12.2 85.9 1.9 48.3 6.3 43.5 5
Subabul wood 18.5 81.0 1.2 48.2 5.9 44.8 5
Wood bark 31.8 66.6 1.6 53.1 6.1 40.6 7
Douglas fir bark 32.8 65.5 1.8 53.1 6.1 40.6 8
Wood chips 23.5 76.4 0.1 48.1 6.0 45.7 6
Mulberry stick 22.8 75.1 2.1 44.2 6.6 46.3 6
Pit Peach pit 19.8 79.1 1.1 49.1 6.4 43.5 6 Olive pit 21.2 75.6 3.2 48.8 6.2 43.5 8 Needles and leaves
Pine needles 26.1 72.4 1.5 48.2 6.6 43.7 8
Sena leaves 25.5 57.2 17.3 36.2 4.7 37.5 6 Fiber and coir
Coconut fiber 26.6 70.6 2.8 46.4 5.5 43.8 8
Coconut coir 29.7 66.6 3.7 50.3 5.1 39.6 6
*FC= Fixed carbon, VM= volatile matter, ASH= ash content.
This data allows appreciating how lignocellulosic biomass is a renewable carbon-rich feedstock
that presents a potential alternative to fossil carbon, no matter what plant species and geographic
zones. Its C, H, and O content (ultimate analysis) is always similar for most of the lignocellulosic
biomasses, with about 45-50%wt. C, 40-45%wt.O and 5%wt. H.
29
The main difference between this renewable resource and oil is the oxygen content, that is
significantly important in lignocellulosic biomass and insignificant for petroleum.9
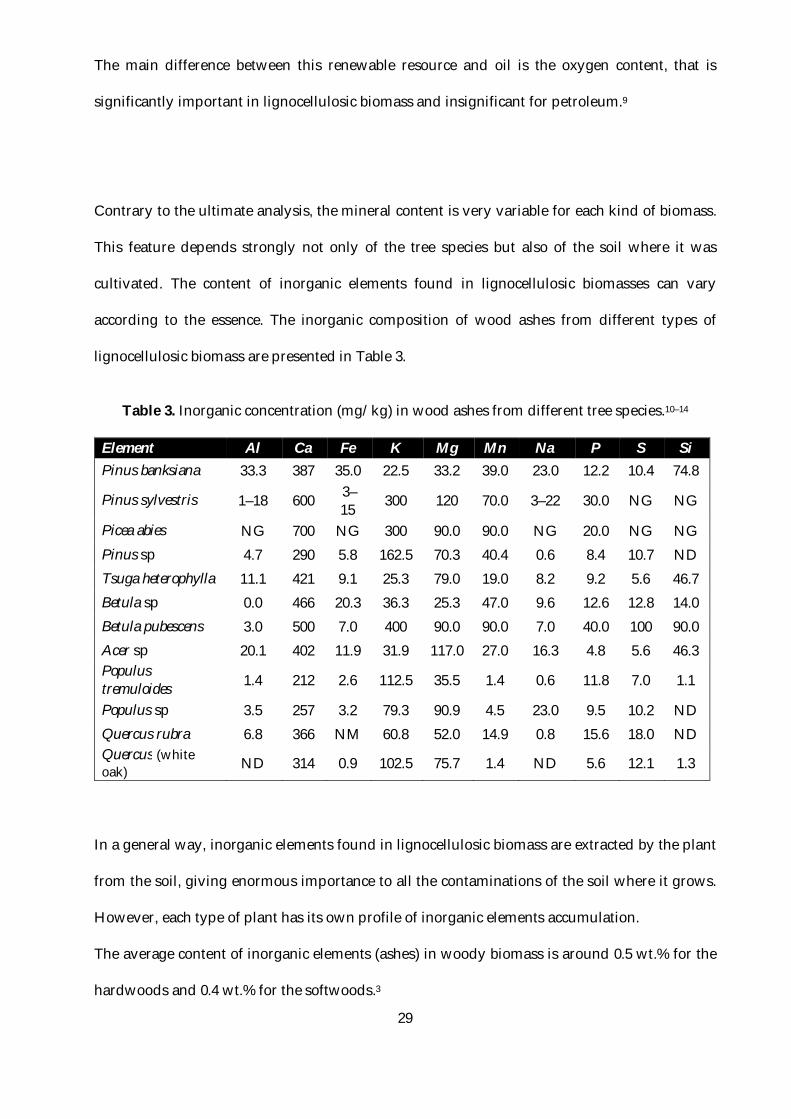
Contrary to the ultimate analysis, the mineral content is very variable for each kind of biomass.
This feature depends strongly not only of the tree species but also of the soil where it was
cultivated. The content of inorganic elements found in lignocellulosic biomasses can vary
according to the essence. The inorganic composition of wood ashes from different types of
lignocellulosic biomass are presented in Table 3.
Table 3. Inorganic concentration (mg/kg) in wood ashes from different tree species.10–14
Element Al Ca Fe K Mg Mn Na P S Si Pinus banksiana 33.3 387 35.0 22.5 33.2 39.0 23.0 12.2 10.4 74.8
Pinus sylvestris 1–18 600 3–15 300 120 70.0 3–22 30.0 NG NG
Picea abies NG 700 NG 300 90.0 90.0 NG 20.0 NG NG Pinus sp 4.7 290 5.8 162.5 70.3 40.4 0.6 8.4 10.7 ND Tsuga heterophylla 11.1 421 9.1 25.3 79.0 19.0 8.2 9.2 5.6 46.7 Betula sp 0.0 466 20.3 36.3 25.3 47.0 9.6 12.6 12.8 14.0 Betula pubescens 3.0 500 7.0 400 90.0 90.0 7.0 40.0 100 90.0 Acer sp 20.1 402 11.9 31.9 117.0 27.0 16.3 4.8 5.6 46.3 Populus tremuloides 1.4 212 2.6 112.5 35.5 1.4 0.6 11.8 7.0 1.1
Populus sp 3.5 257 3.2 79.3 90.9 4.5 23.0 9.5 10.2 ND Quercus rubra 6.8 366 NM 60.8 52.0 14.9 0.8 15.6 18.0 ND Quercus (white oak) ND 314 0.9 102.5 75.7 1.4 ND 5.6 12.1 1.3
In a general way, inorganic elements found in lignocellulosic biomass are extracted by the plant
from the soil, giving enormous importance to all the contaminations of the soil where it grows.
However, each type of plant has its own profile of inorganic elements accumulation.
The average content of inorganic elements (ashes) in woody biomass is around 0.5 wt.% for the
hardwoods and 0.4 wt.% for the softwoods.3
30
This presence of inorganics has an important catalytic effect during the thermochemical
conversion of biomass. The presence of these minerals has shown significant effects on the
pyrolysis mechanisms. For instance, potassium (K) and sodium (Na) presence was found to
hinder anhydro-saccharides formation and to increase the phenols yields during pyrolysis.15,16
Evidently, the opposite effect has also been observed, when inorganics are removed from
biomass, anhydro-saccharides yield increases significantly.16 Moreover, insoluble inorganic
elements act as a heat sink, lowering the heating value of the biomass as a fuel.
3. Multi-scale organization of lignocellulosic
biomass
According to their origin and species, each plant has unique components, set in a specific
arrangement, that perform precise functions that allow them to develop in a particular
environment. Lignocellulosic biomass refers more specifically to the material found in the plant
cell wall. The cell wall is constituted by a complex matrix of fibers. Even if each species has unique
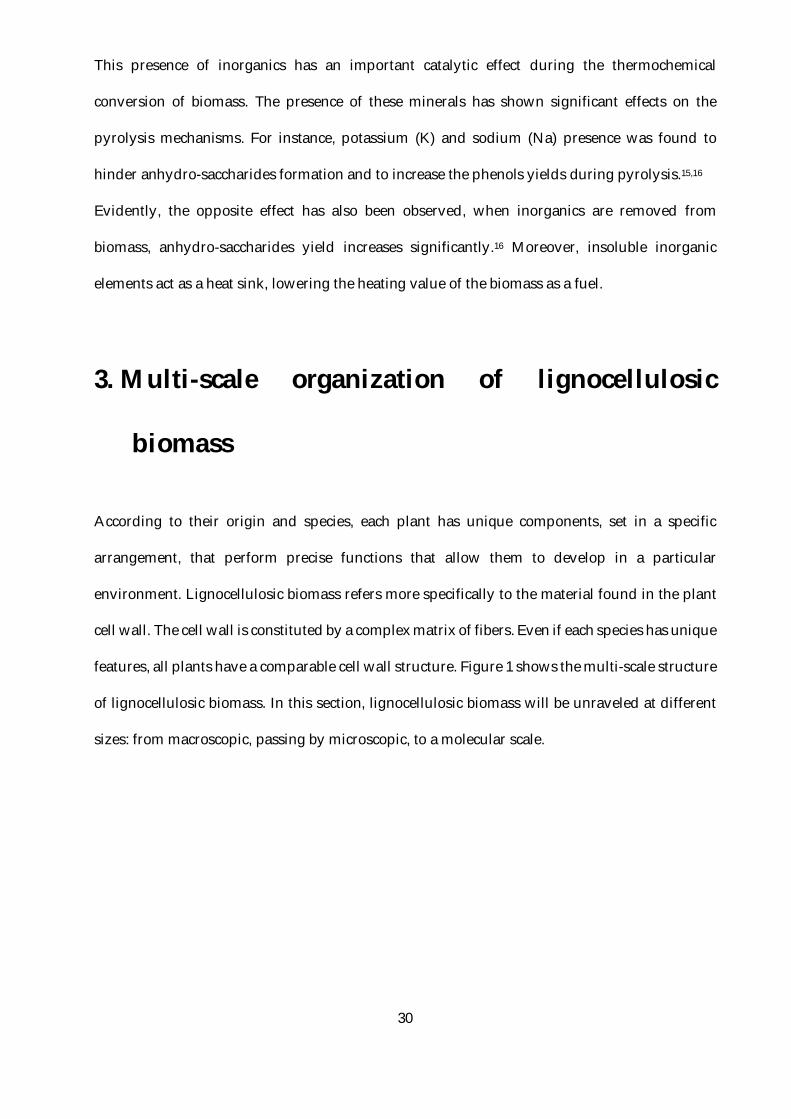
features, all plants have a comparable cell wall structure. Figure 1 shows the multi-scale structure
of lignocellulosic biomass. In this section, lignocellulosic biomass will be unraveled at different
sizes: from macroscopic, passing by microscopic, to a molecular scale.
31
Figure 1.Representation of the multi-scale structure of lignocellulosic biomass.17
3.1. Macroscopic structure of biomass
There are two principal types of lignocellulosic plants, non-woody plants that are often called
“grasses” and woody plants (without taking into account some algae that belong to this are also
classified as plants). The main characteristics of the plant cell structure will give each biomass
different mechanical properties that will play an important role in their applications and
transformation.
32
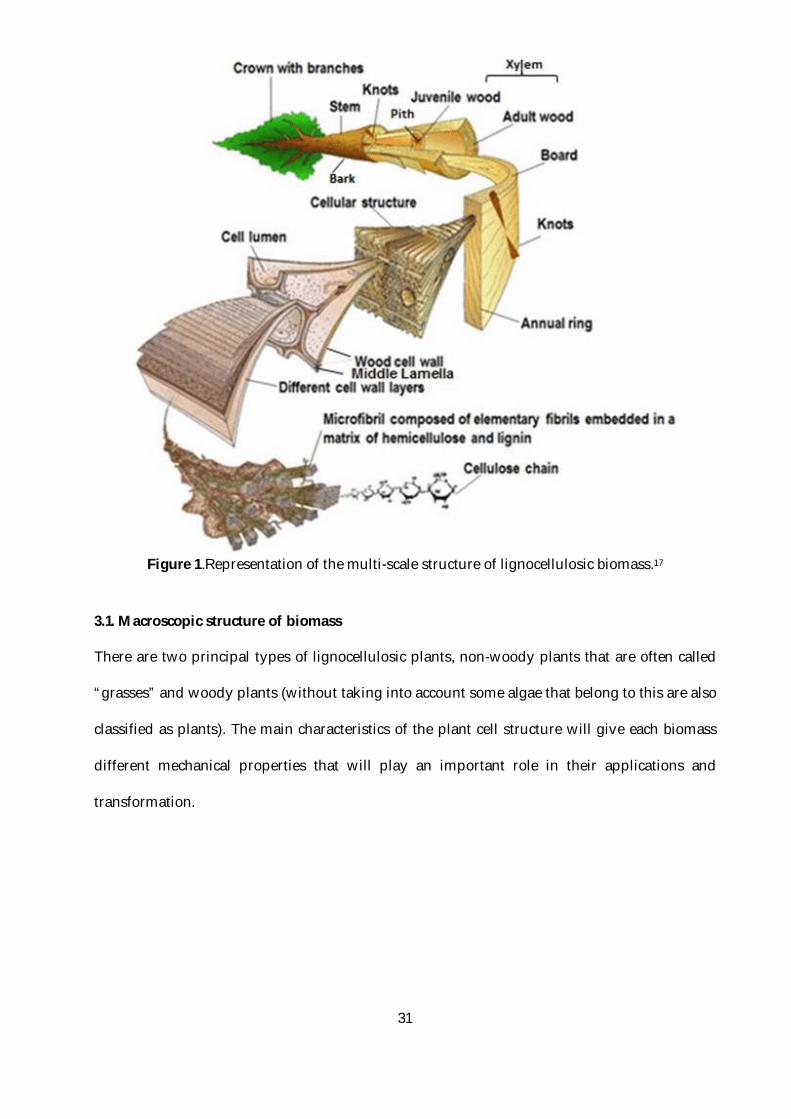
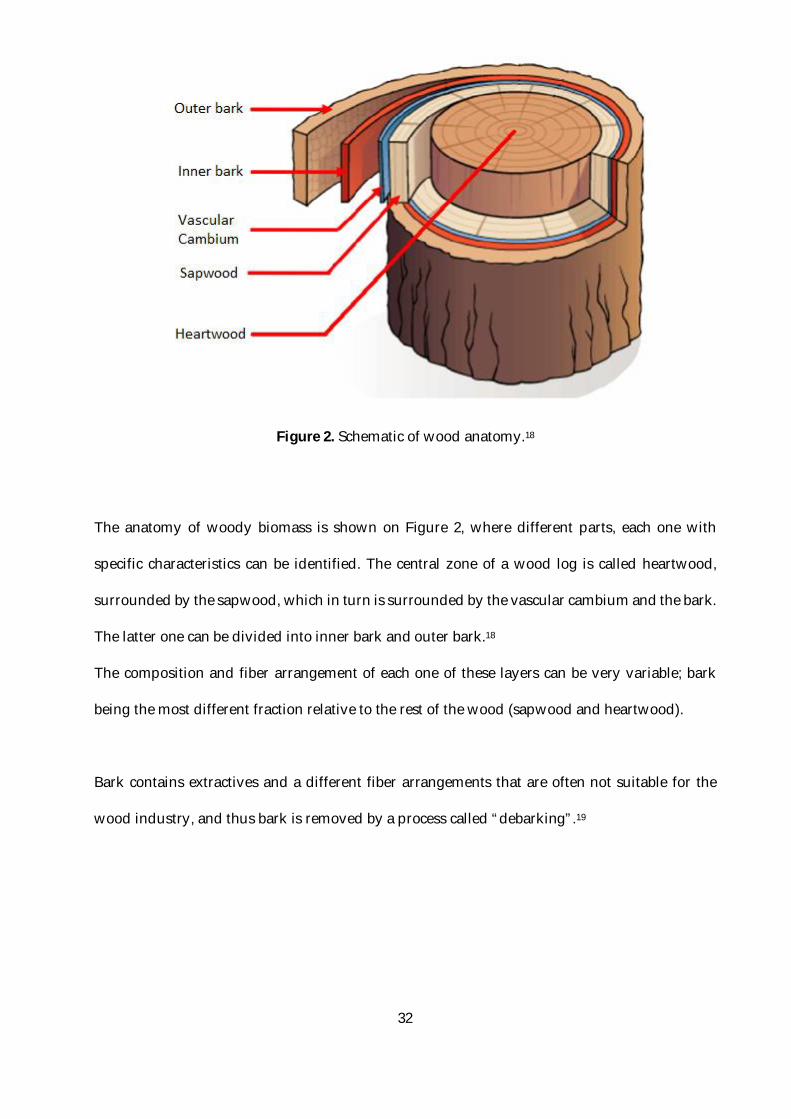
Figure 2. Schematic of wood anatomy.18
The anatomy of woody biomass is shown on Figure 2, where different parts, each one with
specific characteristics can be identified. The central zone of a wood log is called heartwood,
surrounded by the sapwood, which in turn is surrounded by the vascular cambium and the bark.
The latter one can be divided into inner bark and outer bark.18
The composition and fiber arrangement of each one of these layers can be very variable; bark
being the most different fraction relative to the rest of the wood (sapwood and heartwood).
Bark contains extractives and a different fiber arrangements that are often not suitable for the
wood industry, and thus bark is removed by a process called “debarking”.19
33
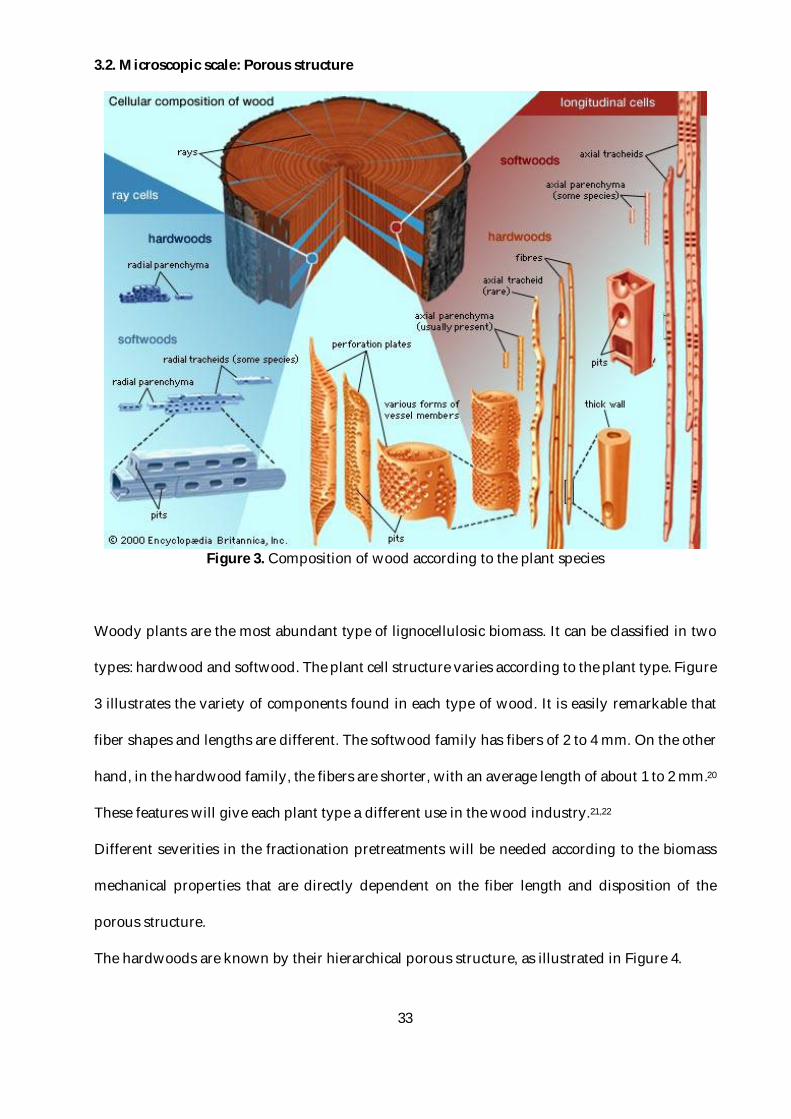
3.2. Microscopic scale: Porous structure
Figure 3. Composition of wood according to the plant species
Woody plants are the most abundant type of lignocellulosic biomass. It can be classified in two
types: hardwood and softwood. The plant cell structure varies according to the plant type. Figure
3 illustrates the variety of components found in each type of wood. It is easily remarkable that
fiber shapes and lengths are different. The softwood family has fibers of 2 to 4 mm. On the other
hand, in the hardwood family, the fibers are shorter, with an average length of about 1 to 2 mm.20
These features will give each plant type a different use in the wood industry.21,22
Different severities in the fractionation pretreatments will be needed according to the biomass
mechanical properties that are directly dependent on the fiber length and disposition of the
porous structure.
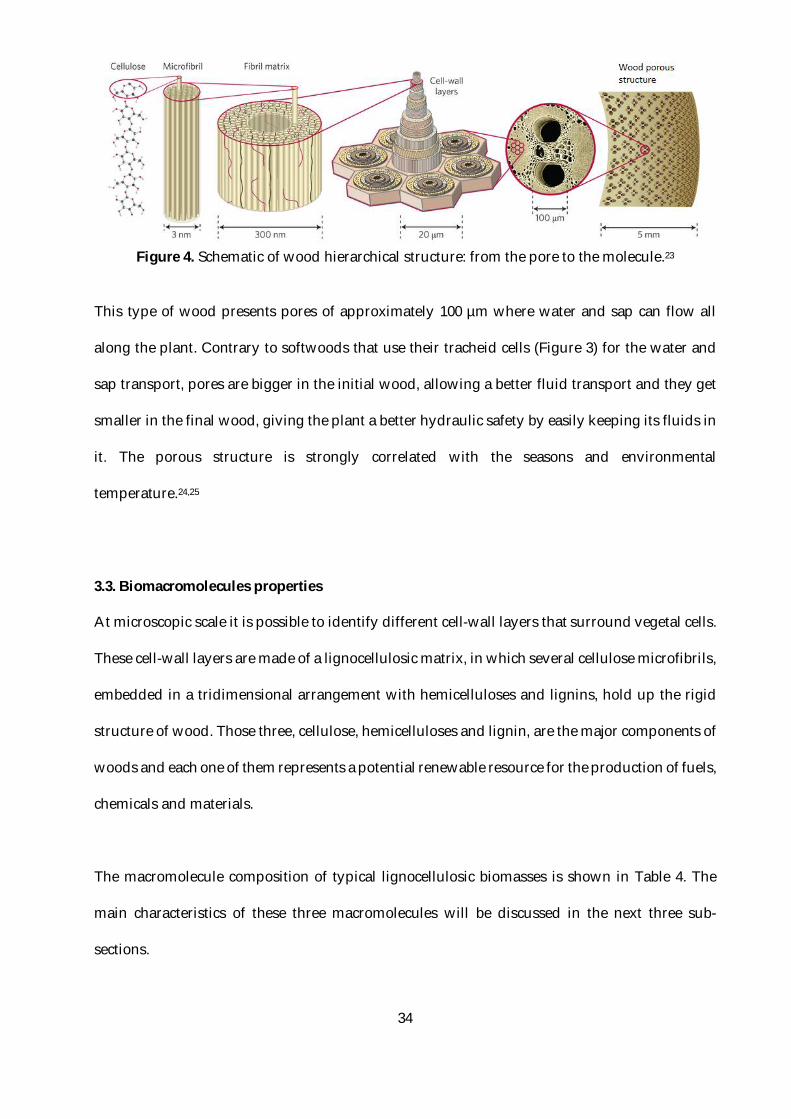
The hardwoods are known by their hierarchical porous structure, as illustrated in Figure 4.
34
Figure 4. Schematic of wood hierarchical structure: from the pore to the molecule.23
This type of wood presents pores of approximately 100 µm where water and sap can flow all
along the plant. Contrary to softwoods that use their tracheid cells (Figure 3) for the water and
sap transport, pores are bigger in the initial wood, allowing a better fluid transport and they get
smaller in the final wood, giving the plant a better hydraulic safety by easily keeping its fluids in
it. The porous structure is strongly correlated with the seasons and environmental
temperature.24,25
3.3. Biomacromolecules properties
At microscopic scale it is possible to identify different cell-wall layers that surround vegetal cells.
These cell-wall layers are made of a lignocellulosic matrix, in which several cellulose microfibrils,
embedded in a tridimensional arrangement with hemicelluloses and lignins, hold up the rigid
structure of wood. Those three, cellulose, hemicelluloses and lignin, are the major components of
woods and each one of them represents a potential renewable resource for the production of fuels,
chemicals and materials.
The macromolecule composition of typical lignocellulosic biomasses is shown in Table 4. The
main characteristics of these three macromolecules will be discussed in the next three sub-
sections.
35
Table 4. Macromolecules composition of some lignocellulosic feedstocks.
Feedstock Cellulose Hemicelluloses Lignin Beech wood26 49.0 22.0 24.0 Corn stover27 37.5 22.4 17.6 Pine wood27 46.4 8.8 29.4 Poplar27 49.9 17.4 18.1 Wheat straw27 38.2 21.2 23.4 Switch grass27 31.0 20.4 17.6 Office paper27 68.6 12.4 11.3
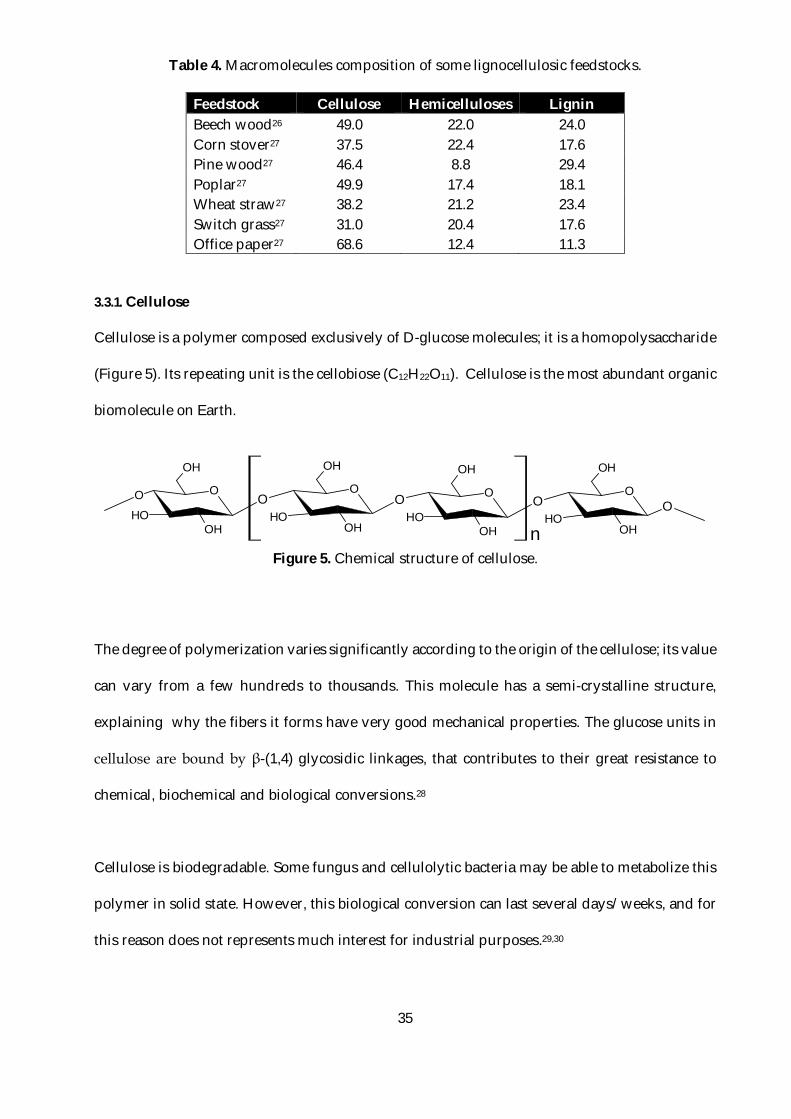
3.3.1. Cellulose
Cellulose is a polymer composed exclusively of D-glucose molecules; it is a homopolysaccharide
(Figure 5). Its repeating unit is the cellobiose (C12H22O11). Cellulose is the most abundant organic
biomolecule on Earth.
n
OOO
OHOH
O
OH
O
OHOH
OH
OO
OHOH
OH
OO
OHOH
OH
Figure 5. Chemical structure of cellulose.
The degree of polymerization varies significantly according to the origin of the cellulose; its value
can vary from a few hundreds to thousands. This molecule has a semi-crystalline structure,
explaining why the fibers it forms have very good mechanical properties. The glucose units in
cellulose are bound by β-(1,4) glycosidic linkages, that contributes to their great resistance to
chemical, biochemical and biological conversions.28
Cellulose is biodegradable. Some fungus and cellulolytic bacteria may be able to metabolize this
polymer in solid state. However, this biological conversion can last several days/weeks, and for
this reason does not represents much interest for industrial purposes.29,30
36
Moreover, cellulose is insoluble in water and most organic solvents, only ionic liquids (e.g.
Schweizer reagent, cadmiumethylenediamine (Cadoxen), cupriethylenediamine (CED), etc.) are
known to solubilize this polymer and even extract it from the lignocellulosic matrix.31
Cellulose is mainly used to produce cardboard and paper. In addition, small amounts are
transformed into a wide variety of by-products such as rayon and cellophane. The
thermochemical conversion of cellulose from energy crops to biofuels such as bioethanol or
biodiesel is considered as a potential alternative to fossil fuel/energy.32 One of the most
industrialized processes for cellulose biorefinery is the production of bioethanol through
enzymatic hydrolysis and subsequent fermentation using yeast.33,34
3.3.2. Hemicellulose
Hemicelluloses are the second sugar-based biomacromolecules by importance that can also be
found in biomass. It is the second most abundant biopolymer on earth. Hemicelluloses are
amorphous heteropolymers composed of pentoses (xylose and arabinose), hexoses (glucose,
galactose, mannose and rhamnose) and carboxylic acids (aceric acid, glucuronic acid and
galacturonic acid). There are different types of hemicelluloses, such as xylans, that are
characteristic of hardwoods, galactoglucomannans, that are predominantly found in softwoods,
among others (e.g. galactans, arabinogalactans, arabinoglycuronoxylans and glucomannans).35
In comparison with cellulose long and linear polymer chains, hemicelluloses exhibit shorter and
branched chains. The repeating units of these polymers are shown in Figure 6. While the cellulose
is crystalline, solid, and resistant to hydrolysis, hemicellulose has a random amorphous structure
with low strength. It is easily hydrolyzed by a dilute acid or base, as well as multiple
hemicellulase enzymes.36
37
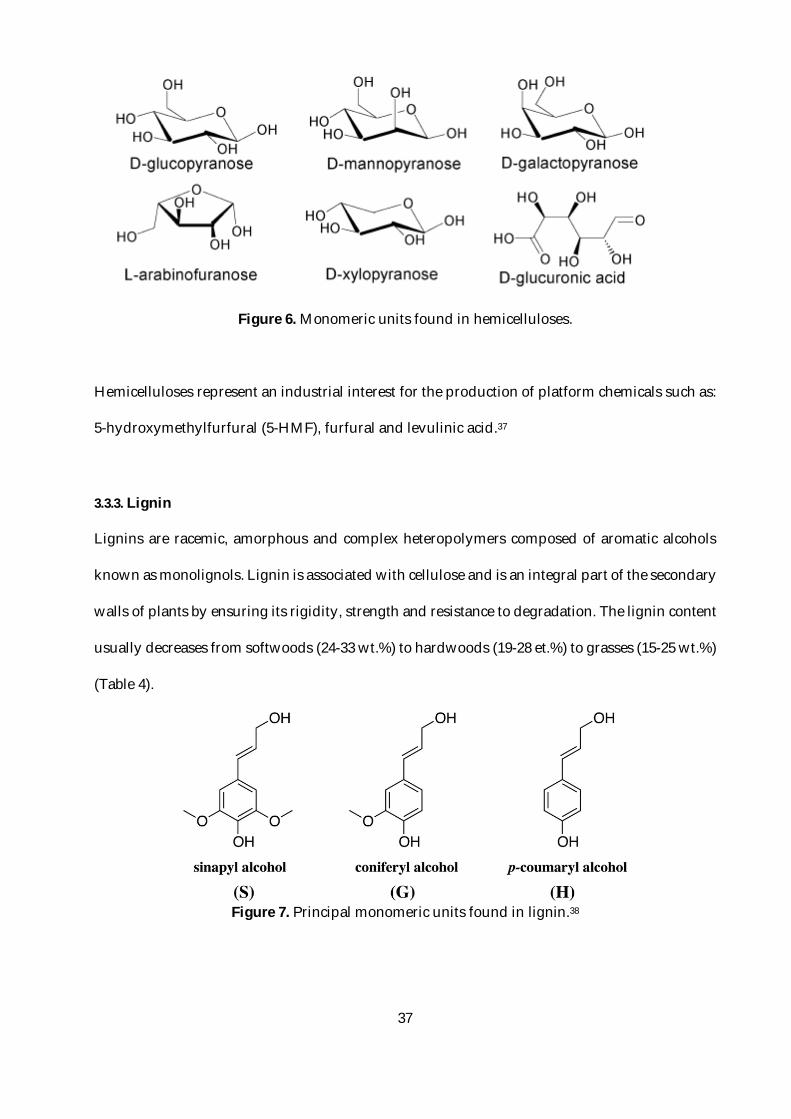
Figure 6. Monomeric units found in hemicelluloses.
Hemicelluloses represent an industrial interest for the production of platform chemicals such as:
5-hydroxymethylfurfural (5-HMF), furfural and levulinic acid.37
3.3.3. Lignin
Lignins are racemic, amorphous and complex heteropolymers composed of aromatic alcohols
known as monolignols. Lignin is associated with cellulose and is an integral part of the secondary
walls of plants by ensuring its rigidity, strength and resistance to degradation. The lignin content
usually decreases from softwoods (24-33 wt.%) to hardwoods (19-28 et.%) to grasses (15-25 wt.%)
(Table 4).
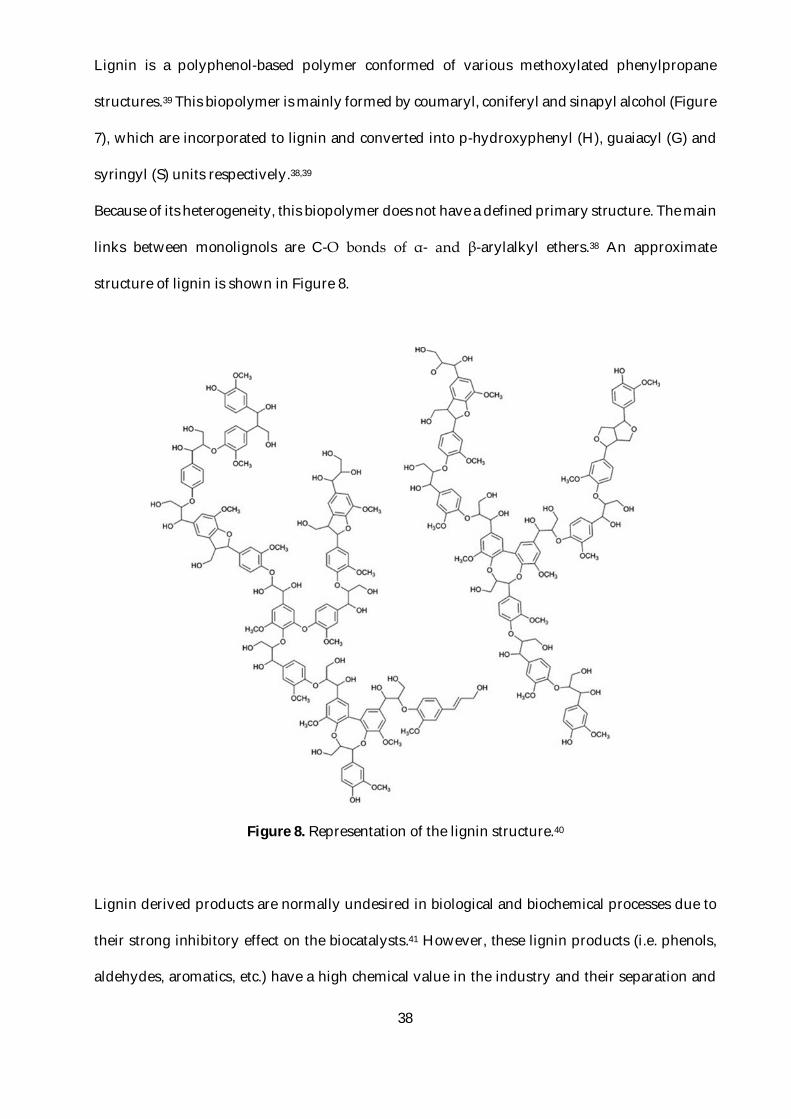
Figure 7. Principal monomeric units found in lignin.38
38
Lignin is a polyphenol-based polymer conformed of various methoxylated phenylpropane
structures.39 This biopolymer is mainly formed by coumaryl, coniferyl and sinapyl alcohol (Figure
7), which are incorporated to lignin and converted into p-hydroxyphenyl (H), guaiacyl (G) and
syringyl (S) units respectively.38,39
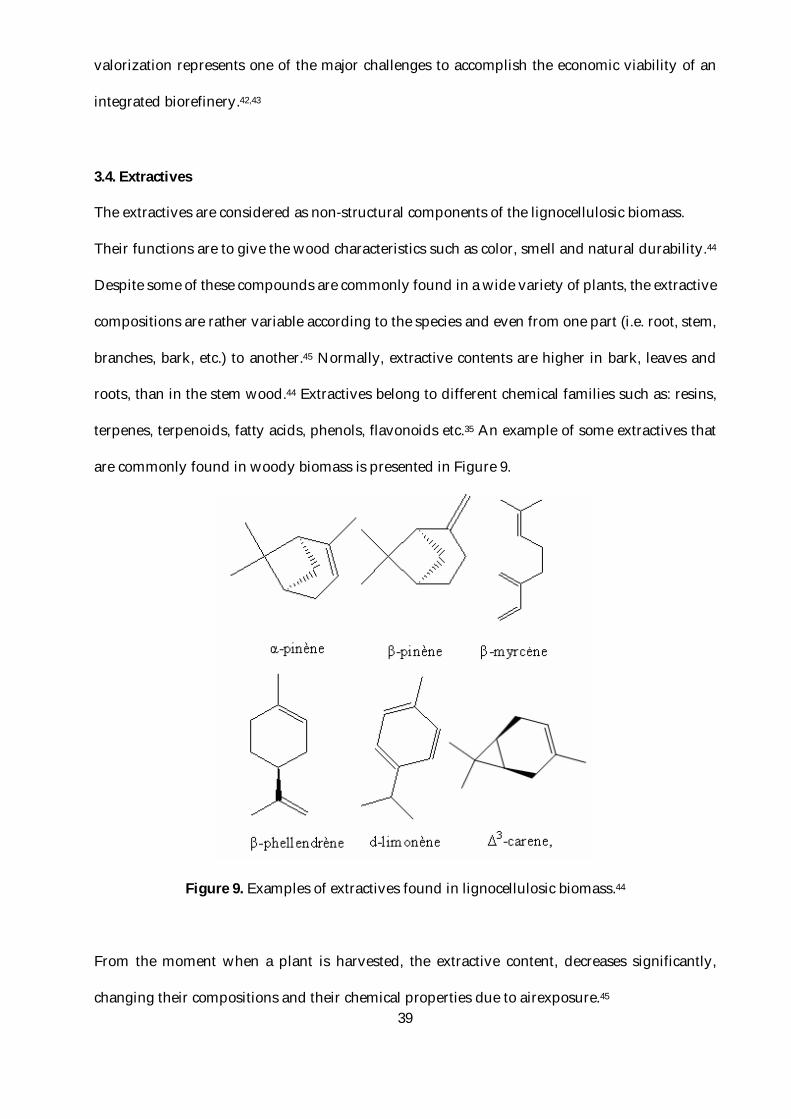
Because of its heterogeneity, this biopolymer does not have a defined primary structure. The main
links between monolignols are C-O bonds of α- and β-arylalkyl ethers.38 An approximate
structure of lignin is shown in Figure 8.
Figure 8. Representation of the lignin structure.40
Lignin derived products are normally undesired in biological and biochemical processes due to
their strong inhibitory effect on the biocatalysts.41 However, these lignin products (i.e. phenols,
aldehydes, aromatics, etc.) have a high chemical value in the industry and their separation and
39
valorization represents one of the major challenges to accomplish the economic viability of an
integrated biorefinery.42,43
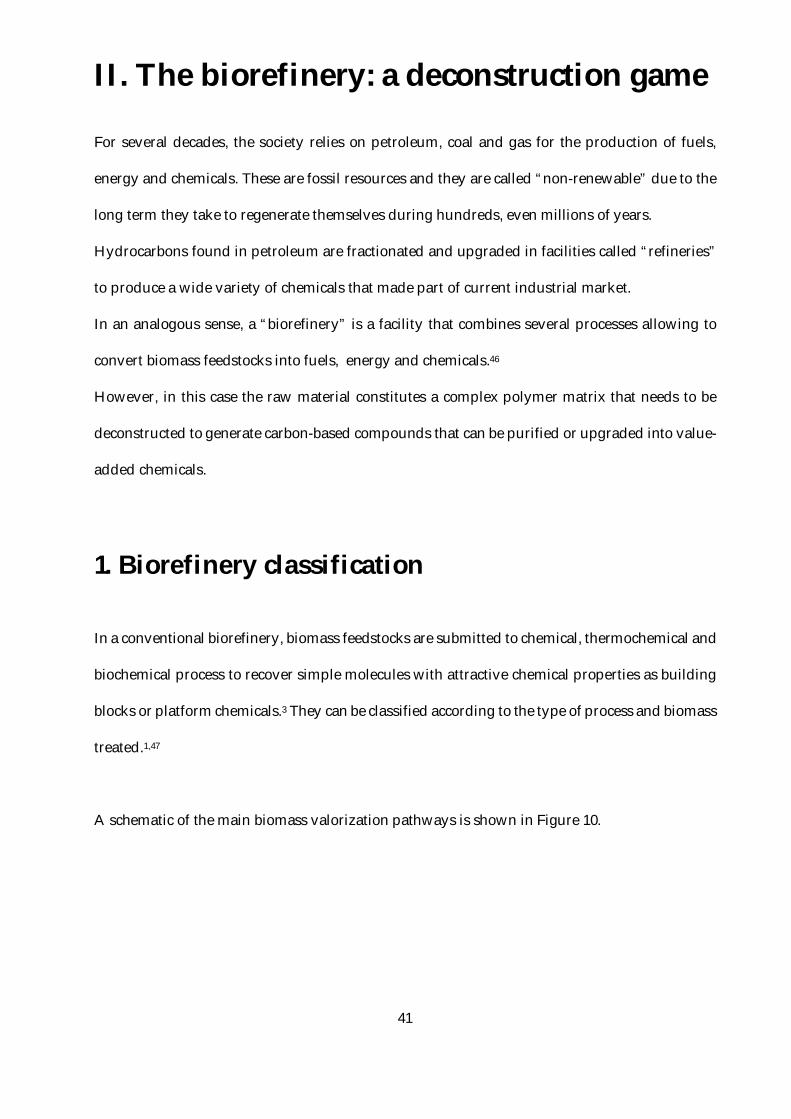
3.4. Extractives
The extractives are considered as non-structural components of the lignocellulosic biomass.
Their functions are to give the wood characteristics such as color, smell and natural durability.44
Despite some of these compounds are commonly found in a wide variety of plants, the extractive
compositions are rather variable according to the species and even from one part (i.e. root, stem,
branches, bark, etc.) to another.45 Normally, extractive contents are higher in bark, leaves and
roots, than in the stem wood.44 Extractives belong to different chemical families such as: resins,
terpenes, terpenoids, fatty acids, phenols, flavonoids etc.35 An example of some extractives that
are commonly found in woody biomass is presented in Figure 9.
Figure 9. Examples of extractives found in lignocellulosic biomass.44
From the moment when a plant is harvested, the extractive content, decreases significantly,
changing their compositions and their chemical properties due to airexposure.45

40
The extractive content is in general very low in comparison with the structural content of
macromolecules. Nevertheless, the chemical value of these molecules is very high in the market
of chemical specialties.44
41
II. The biorefinery: a deconstruction game
For several decades, the society relies on petroleum, coal and gas for the production of fuels,
energy and chemicals. These are fossil resources and they are called “non-renewable” due to the
long term they take to regenerate themselves during hundreds, even millions of years.
Hydrocarbons found in petroleum are fractionated and upgraded in facilities called “refineries”
to produce a wide variety of chemicals that made part of current industrial market.
In an analogous sense, a “biorefinery” is a facility that combines several processes allowing to
convert biomass feedstocks into fuels, energy and chemicals.46
However, in this case the raw material constitutes a complex polymer matrix that needs to be
deconstructed to generate carbon-based compounds that can be purified or upgraded into value-
added chemicals.
1. Biorefinery classification
In a conventional biorefinery, biomass feedstocks are submitted to chemical, thermochemical and
biochemical process to recover simple molecules with attractive chemical properties as building
blocks or platform chemicals.3 They can be classified according to the type of process and biomass
treated.1,47
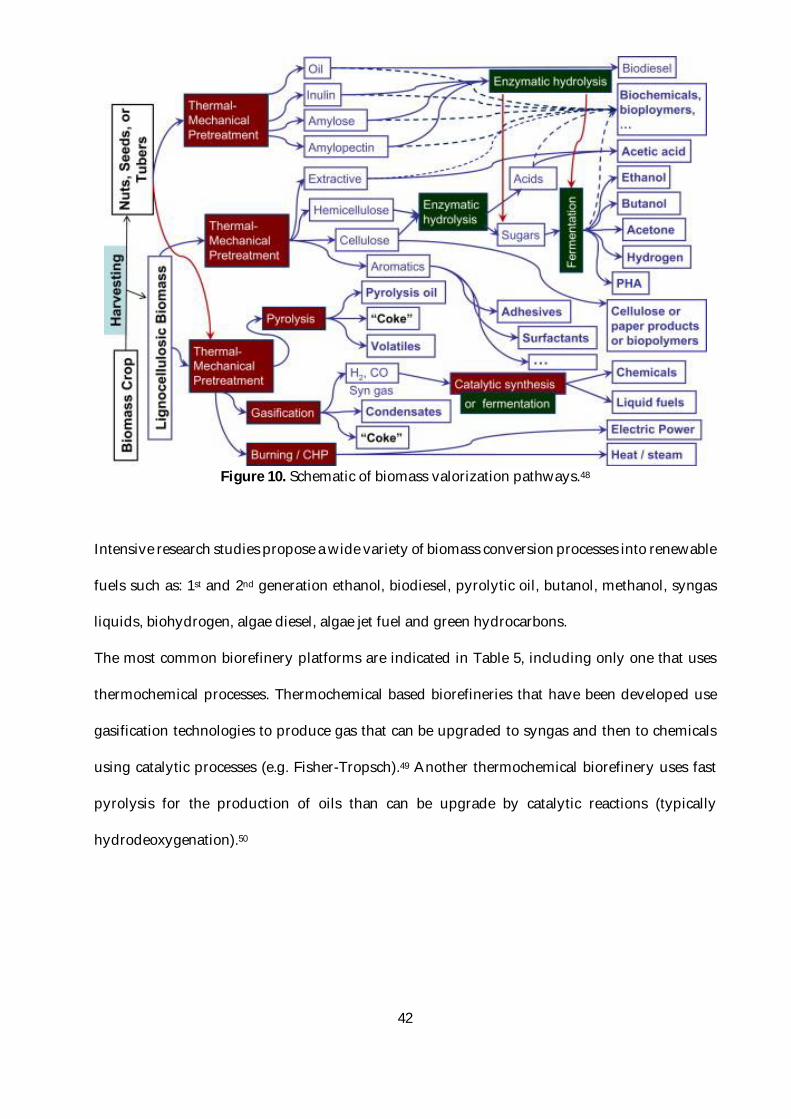
A schematic of the main biomass valorization pathways is shown in Figure 10.
42
Figure 10. Schematic of biomass valorization pathways.48
Intensive research studies propose a wide variety of biomass conversion processes into renewable
fuels such as: 1st and 2nd generation ethanol, biodiesel, pyrolytic oil, butanol, methanol, syngas
liquids, biohydrogen, algae diesel, algae jet fuel and green hydrocarbons.
The most common biorefinery platforms are indicated in Table 5, including only one that uses
thermochemical processes. Thermochemical based biorefineries that have been developed use
gasification technologies to produce gas that can be upgraded to syngas and then to chemicals
using catalytic processes (e.g. Fisher-Tropsch).49 Another thermochemical biorefinery uses fast
pyrolysis for the production of oils than can be upgrade by catalytic reactions (typically
hydrodeoxygenation).50
43
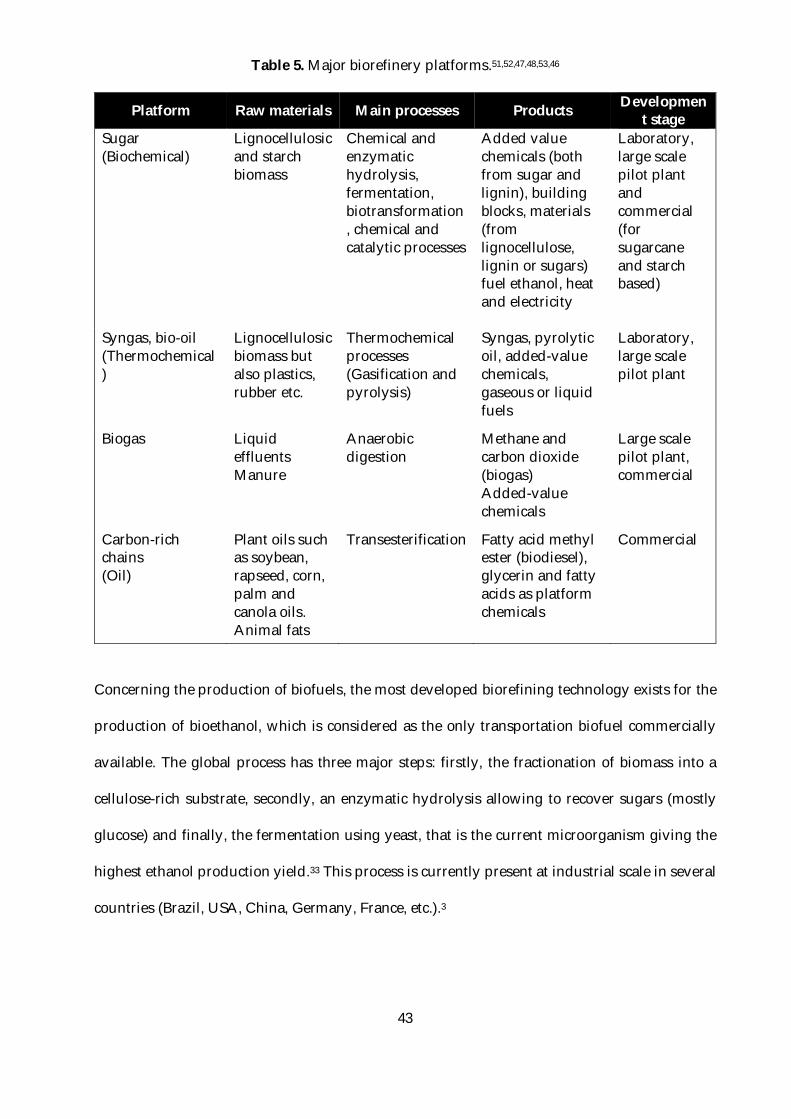
Table 5. Major biorefinery platforms.51,52,47,48,53,46
Platform Raw materials Main processes Products Development stage
Sugar (Biochemical)
Lignocellulosic and starch biomass
Chemical and enzymatic hydrolysis, fermentation, biotransformation, chemical and catalytic processes
Added value chemicals (both from sugar and lignin), building blocks, materials (from lignocellulose, lignin or sugars) fuel ethanol, heat and electricity
Laboratory, large scale pilot plant and commercial (for sugarcane and starch based)
Syngas, bio-oil (Thermochemical)
Lignocellulosic biomass but also plastics, rubber etc.
Thermochemical processes (Gasification and pyrolysis)
Syngas, pyrolytic oil, added-value chemicals, gaseous or liquid fuels
Laboratory, large scale pilot plant
Biogas Liquid effluents Manure
Anaerobic digestion
Methane and carbon dioxide (biogas) Added-value chemicals
Large scale pilot plant, commercial
Carbon-rich chains (Oil)
Plant oils such as soybean, rapseed, corn, palm and canola oils. Animal fats
Transesterification Fatty acid methyl ester (biodiesel), glycerin and fatty acids as platform chemicals
Commercial
Concerning the production of biofuels, the most developed biorefining technology exists for the
production of bioethanol, which is considered as the only transportation biofuel commercially
available. The global process has three major steps: firstly, the fractionation of biomass into a
cellulose-rich substrate, secondly, an enzymatic hydrolysis allowing to recover sugars (mostly
glucose) and finally, the fermentation using yeast, that is the current microorganism giving the
highest ethanol production yield.33 This process is currently present at industrial scale in several
countries (Brazil, USA, China, Germany, France, etc.).3
44
Some technologies have been developed to convert the biomass into products containing
significantly less oxygen (increasing the energy content) than the initial biomass, through a
process called hydrodeoxygenation.54,50,55
Pulp and paper industries are another traditional facilities for the valorization lignocellulosic
biomass. Some of them have already integrated processes to valorize the residual lignin into
chemicals and materials.48
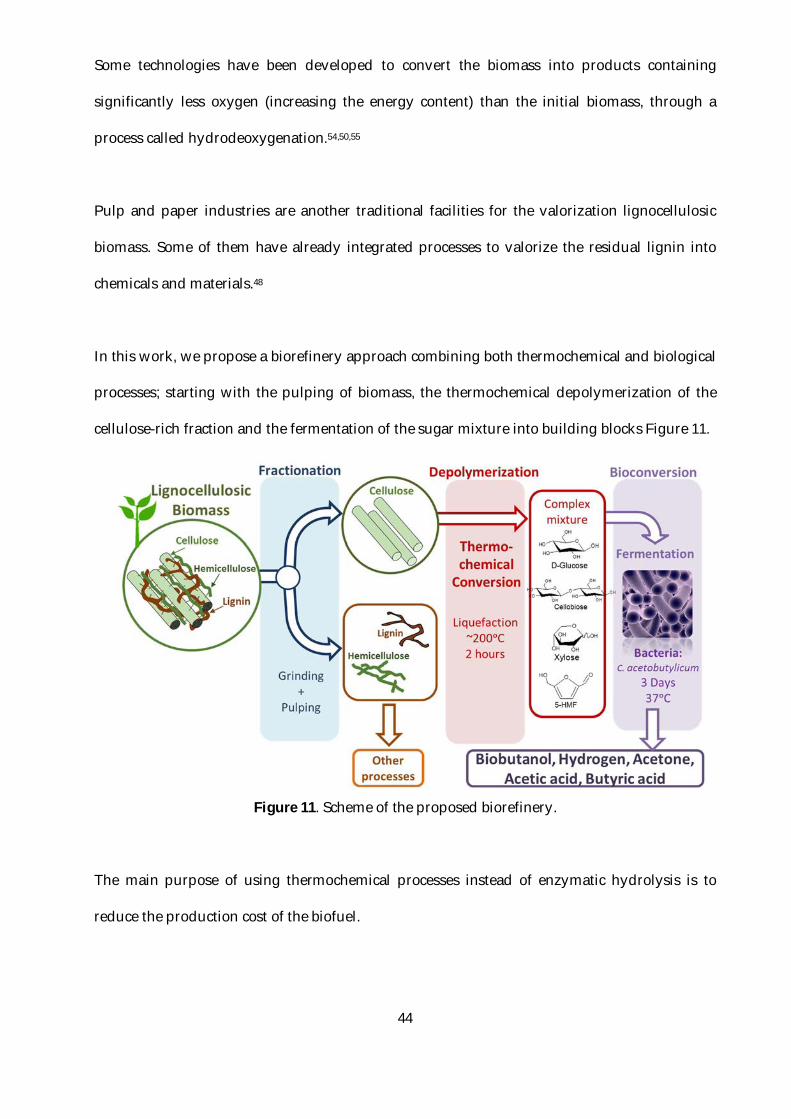
In this work, we propose a biorefinery approach combining both thermochemical and biological
processes; starting with the pulping of biomass, the thermochemical depolymerization of the
cellulose-rich fraction and the fermentation of the sugar mixture into building blocks Figure 11.
Figure 11. Scheme of the proposed biorefinery.
The main purpose of using thermochemical processes instead of enzymatic hydrolysis is to
reduce the production cost of the biofuel.
45
Indeed, enzymes represent an important operational cost56 and their hydrolysis kinetics are
relatively slow (2-3 days). Thermochemical depolymerization instead of enzyme would
considerably fastened the process (from days to hours/minutes).57
One of the major problems of this type of biorefinery is the slow kinetic involved in the
biochemical processes and the high price and non-recyclability of enzymes.56
Only few works with this type of biorefinery can be found in the literature, but in a general way,
this type of biorefinery has not been well studied.58,59 These concepts of combining
thermochemical and biological conversion of lignocellulosic biomass are described in the section
III (Combining thermochemical and biological conversion of biomass).
2. Biomass pretreatment and fractionation
As presented in section I, lignocellulosic biomass constitutes a three-dimensional matrix making
it very resistant to chemical and biological conversions. In order to produce biofuels and
chemicals from biomass through biological processes, cellulose and hemicelluloses need to be
converted into monomeric sugars.60
Lignin is not only embedded around the holocellulose (cellulose plus hemicelluloses) protecting
it, but also is a source of strong inhibitors for enzymes and microorganism used in the subsequent
stages of the biorefinery.61 In order to reduce the recalcitrance of lignocellulosic biomass some
pretreatments and fractionation processes have to be used.
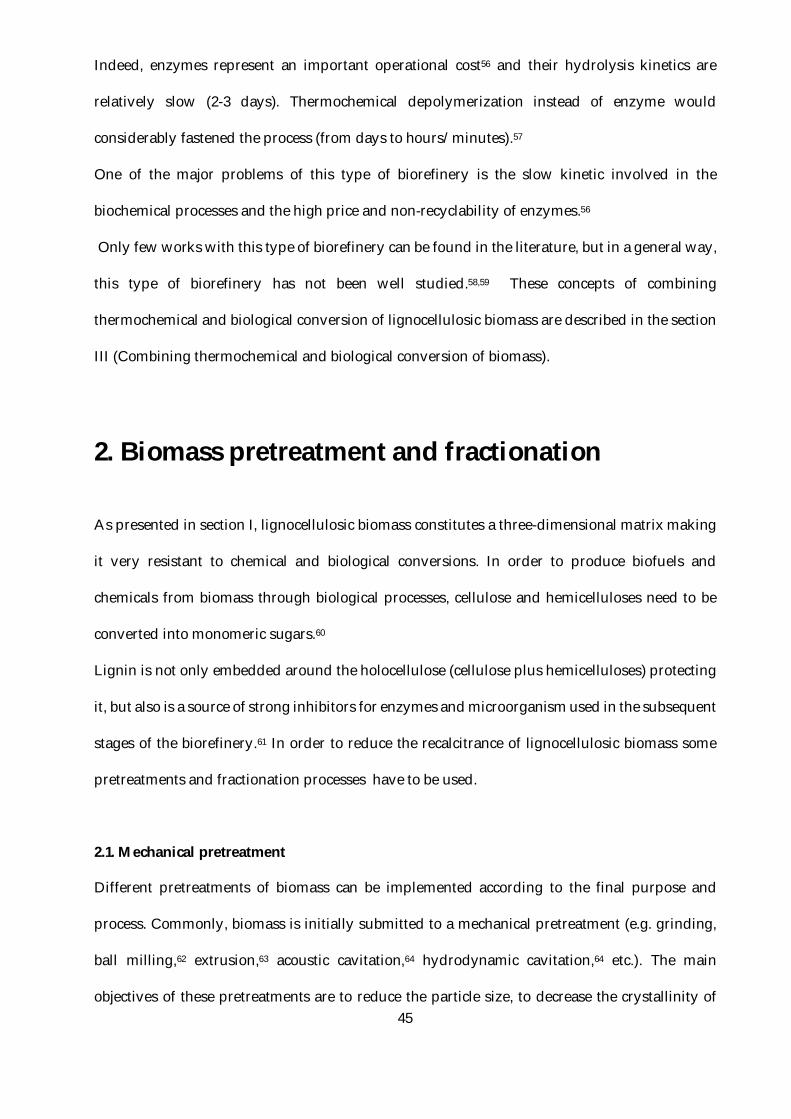
2.1. Mechanical pretreatment
Different pretreatments of biomass can be implemented according to the final purpose and
process. Commonly, biomass is initially submitted to a mechanical pretreatment (e.g. grinding,
ball milling,62 extrusion,63 acoustic cavitation,64 hydrodynamic cavitation,64 etc.). The main
objectives of these pretreatments are to reduce the particle size, to decrease the crystallinity of
46
cellulose and to “unravel” the fibers, increasing their accessibility, and thus, the reactivity during
the subsequent processes.27,63
2.2. Pulping pretreatments
Some pretreatments are called pulping or fractionation methods. These technologies ensure an
efficient valorization of each one of the constituents of the lignocellulosic matrix, which is a
critical point for an economically viable biorefinery.65–67
Different pulping processes such as: kraft,39,68 organosolv,69,70 ammonia fiber expansion (AFEX),71
alkaline,27 chlorite/acid,72,73 ozonolysis,74 ammonia, 75 ionic liquids,76 acid-steam explosion,77
among others.77–80
The key factors to take into account when choosing an efficient pretreatment method for cellulose
valorization are a high cellulose recovery yield regardless of the feedstock, high digestibility of
the recovered cellulose (if subsequent enzymatic hydrolysis), no significant sugar degradation,
no toxic compounds generated, low energy demand for downstream operations and no need of
drying and efficient lignin recovery.63
The main advantages and drawbacks of different pretreatment and fractionation methods of
biomass are indicated in Table 6.
Table 6. Advantages and drawbacks of different pretreatment methods for lignocellulosic biomass39,63–65,79,81,82
Pretreatment method Advantages Disadvantages
Milling -Decrease of cellulose crystallinity and degree of polymerization -Reduction of particle Size to Increase specific surface area and pore Size
-High power and energy consumption

47
Steam explosion -Causes lignin transformation and hemicellulose solubilization -Lower cost -Higher yield of glucose and hemicellulose in the two-step method
-Generation of toxic compounds -Partial hemicellulose degradation
Liquid hot water -No chemicals required -No requirement of corrosion-resistant materials
-High energy and high water requirement -Formation of toxic compounds
Ammonia fiber expansion (AFEX)
-Increases accessible surface area -Less inhibitors formation -Do not require small particle size of biomass
-Not very effective for the biomass with high lignin content -High cost of large amounts of ammonia
CO2 explosion -Increases accessible surface area -Availability at relatively low cost -Do not form inhibitory compounds -Non-flammability -Easy recovery after extraction
-Very high pressure requirements
Wet oxidation -High degree of solubilization of hemicellulose and lignin -Avoid formation of degradation compounds
-High cost of oxygen and alkaline catalyst
Concentrated acid
-Relatively high glucose yield -Ambient temperature
-High cost of acid and need to be recovered -Corrosion-resistant equipment are required -Concentrated acids are toxic and hazardous
Diluted acid -High recovery of sugars -Low formation of toxic products
-Concentration of reducing sugars is low -Generation of degradation products
Sodium Chlorite/ Acetic acid (SC/AA)
-High recovery of cellulose and hemicelluloses -Mild conditions (~70ºC)
-Toxic chlorine-derived gases formed during the fractionation –Requires several hours for good recovery yields
Kraft -High cellulose yields -Good fiber properties
-Manipulation of hazardous compounds -Production of malodorous compounds
Alkali -Decrease of cellulose crystallinity and degree of polymerization -Disruption of lignin structure
-High cost -Not used for large-scale plant

48
Ozonolysis -Effectively removes lignin -No toxic residues -Reaction at room temperature and atmospheric pressure
-High cost of large amounts of ozone
Organosolv -Causes lignin and hemicellulose hydrolysis -Easy solvent recovery
-Solvents need to be drained (energy requirements)
Biological -Low energy requirements -Delignification -Reduction in degree of polymerization of cellulose -Mild environmental conditions
-Slow process rate -High cost of enzymes -Very low treatment rate -Not very effective for commercial/industrial applications
In terms fractionation of biomass, the Kraft fractionation process is the global industrial
dominant. This process uses sodium hydroxide and sodium sulfide in order to separate lignin
from biomass.39 During this method, several malodorous and toxic compounds are formed. For
this reason, research in new fractionation methods draws a lot of interest in the
industry.39,63,64,66,78,79,81
Organosolv process attracted a lot of attention due to its efficiency for biomass pretreatment at
industrial scale.63
Different organic solvents can be used for this method: methanol, ethanol, acetone, etc. The
separation and recycling of the solvent is the most important factor to reduce the operational
cost.63
2.3. Conclusion
According to the literature, the best fractionation processes, that adapt well to the process
proposed in this work, are organosolv, ammonia fiber expansion, chlorite/acid (SC/AA) and
ionic liquids. This is because these methods allow a good recovery of cellulose (or holocellulose
in the case of SC/AA) with a high yield of lignin removal, reducing the inhibitors quantity.
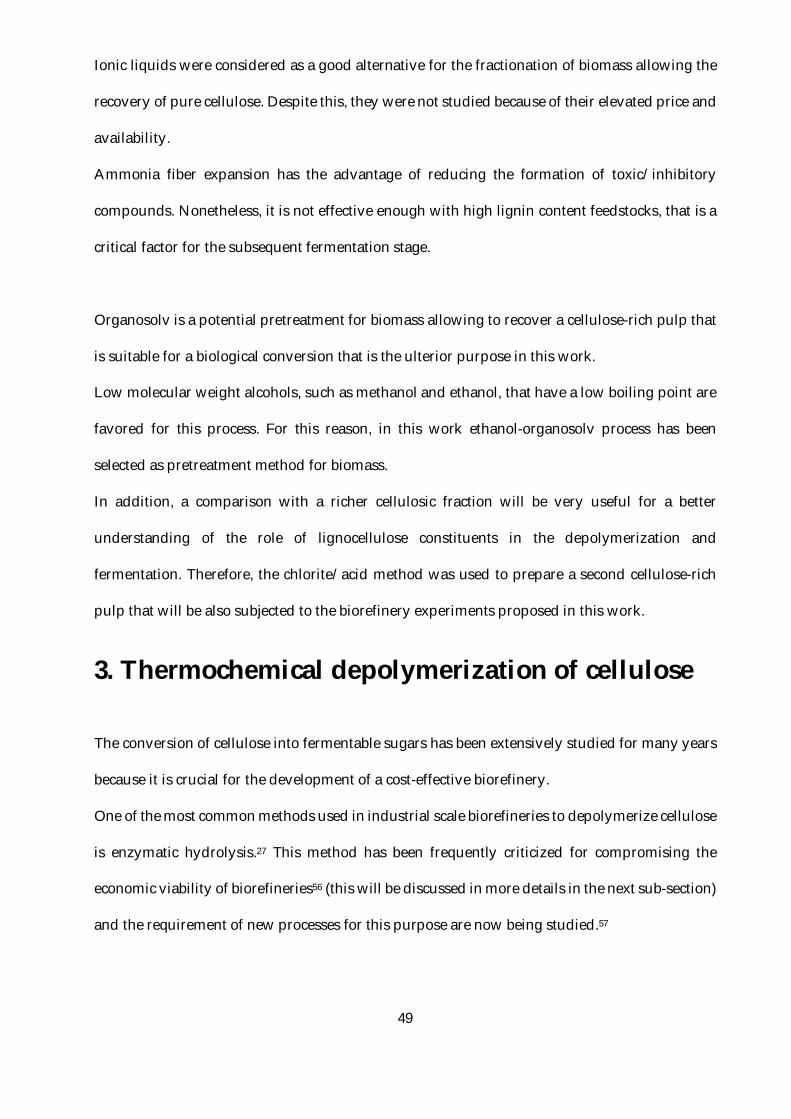
49
Ionic liquids were considered as a good alternative for the fractionation of biomass allowing the
recovery of pure cellulose. Despite this, they were not studied because of their elevated price and
availability.
Ammonia fiber expansion has the advantage of reducing the formation of toxic/inhibitory
compounds. Nonetheless, it is not effective enough with high lignin content feedstocks, that is a
critical factor for the subsequent fermentation stage.
Organosolv is a potential pretreatment for biomass allowing to recover a cellulose-rich pulp that
is suitable for a biological conversion that is the ulterior purpose in this work.
Low molecular weight alcohols, such as methanol and ethanol, that have a low boiling point are
favored for this process. For this reason, in this work ethanol-organosolv process has been
selected as pretreatment method for biomass.
In addition, a comparison with a richer cellulosic fraction will be very useful for a better
understanding of the role of lignocellulose constituents in the depolymerization and
fermentation. Therefore, the chlorite/acid method was used to prepare a second cellulose-rich
pulp that will be also subjected to the biorefinery experiments proposed in this work.
3. Thermochemical depolymerization of cellulose
The conversion of cellulose into fermentable sugars has been extensively studied for many years
because it is crucial for the development of a cost-effective biorefinery.
One of the most common methods used in industrial scale biorefineries to depolymerize cellulose
is enzymatic hydrolysis.27 This method has been frequently criticized for compromising the
economic viability of biorefineries56 (this will be discussed in more details in the next sub-section)
and the requirement of new processes for this purpose are now being studied.57
50
Concerning this objective, thermochemical processes are being studied as an alternative to
enzymatic hydrolysis for the production of sugars from lignocellulosic feedstocks,58,83 but also to
convert biomass in other streams than sugars.
There are four types of thermochemical processes each one with different reaction mechanisms:
1. Combustion: excess of oxygen
2. Gasification: partial use of oxygen
3. Pyrolysis: absence of oxygen
4. Liquefaction: use of a solvent, commonly water, ethanol, etc.
Among these four thermochemical processes, combustion and gasification are not designed to
produce liquid products. Combustion is used mostly for the recovery of energy and gasification,
evidently, for the production of a syngas. Only pyrolysis and liquefaction allow recovering
soluble sugars which are the targeted product for the present work.84
The next sub-sections will be focused on the liquefaction of (ligno)cellulose that is the most
interesting method in this work. Pyrolysis will be shortly recapitulated, since it is considered as
another potential alternative for sugar production.
Pyrolysis was also studied for this work, but the results are not presented in the main text for the
sake of clarity and brevity. These results are briefly reported in the appendices section 2.
51
3.1. Hydrothermal liquefaction of cellulosic materials
Hydrothermal liquefaction is by principle the best thermochemical process to convert cellulose
into fermentable sugars. The main characteristic of this process is the presence of water that
guarantees a common hydrolytic mechanism and has been widely studied for the
depolymerization of cellulose into sugars.85–91 For this reason, this process has attracted
significant interest for the purpose of this work.
In this section, the concept and reaction mechanisms of biomass liquefaction are explained. Then,
the effect of operational conditions on the liquefaction products is explained. Finally, the reactors
used for this process are briefly summarized.
3.1.1. Concept
Hydrothermal liquefaction is a thermochemical process were a substrate can be transformed
using a hot, pressurized water environment sufficient time to break down its structure and
recover mainly liquid components.92,93 The main principal of this biomass conversion technology
is the utilization of water, as a solvent and reactive, to cleave the β-1,4 glycosidic bonds of
cellulose.87,88 The properties of water change drastically when the temperature increases.
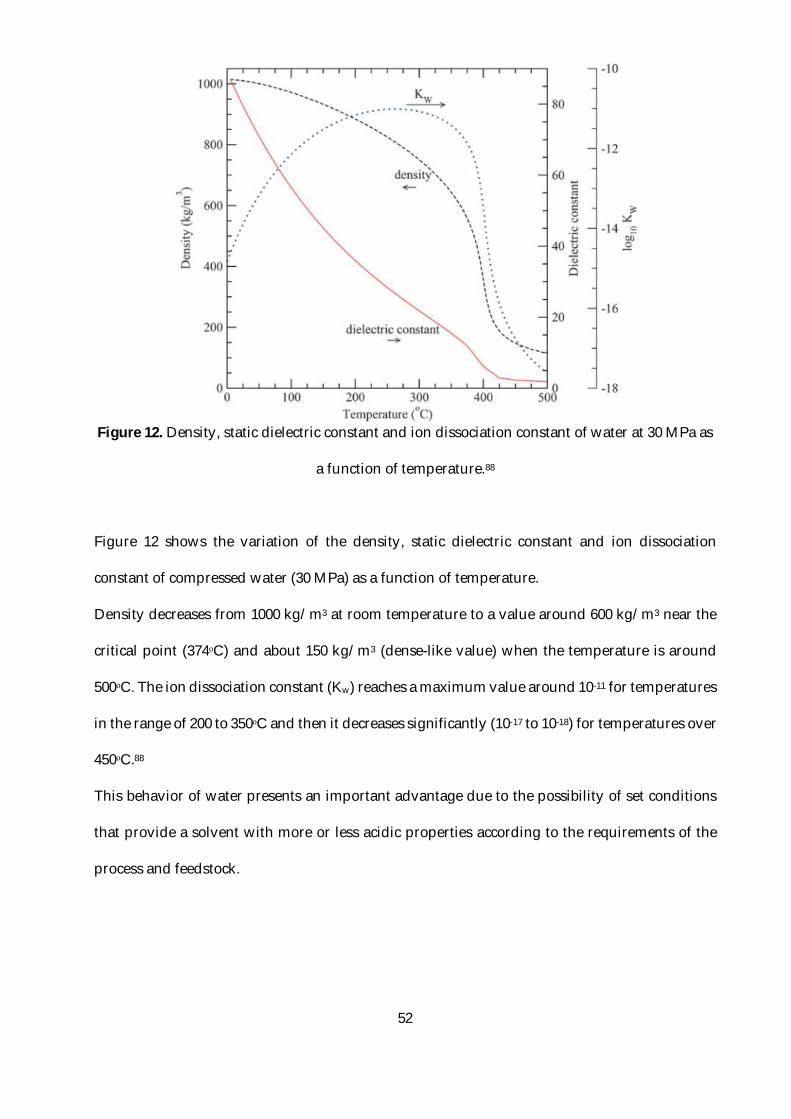
52
Figure 12. Density, static dielectric constant and ion dissociation constant of water at 30 MPa as
a function of temperature.88
Figure 12 shows the variation of the density, static dielectric constant and ion dissociation
constant of compressed water (30 MPa) as a function of temperature.
Density decreases from 1000 kg/m3 at room temperature to a value around 600 kg/m3 near the
critical point (374ᵒC) and about 150 kg/m3 (dense-like value) when the temperature is around
500ᵒC. The ion dissociation constant (Kw) reaches a maximum value around 10-11 for temperatures
in the range of 200 to 350ᵒC and then it decreases significantly (10-17 to 10-18) for temperatures over
450ᵒC.88
This behavior of water presents an important advantage due to the possibility of set conditions
that provide a solvent with more or less acidic properties according to the requirements of the
process and feedstock.
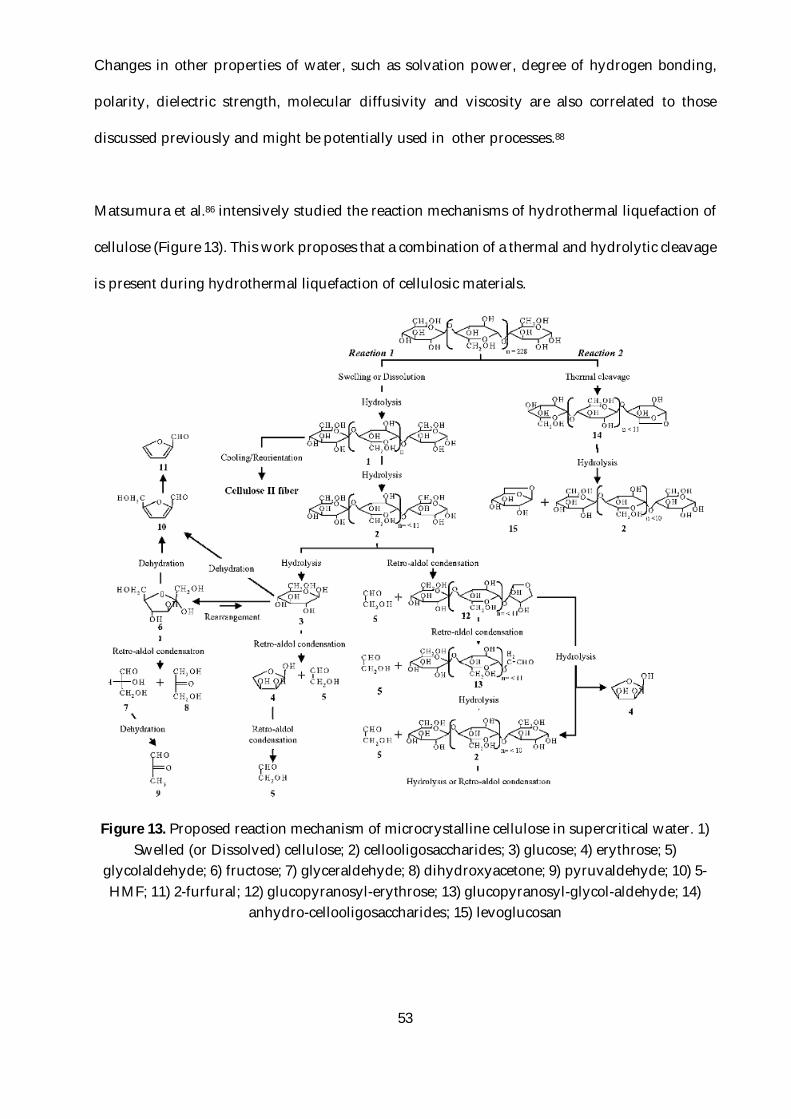
53
Changes in other properties of water, such as solvation power, degree of hydrogen bonding,
polarity, dielectric strength, molecular diffusivity and viscosity are also correlated to those
discussed previously and might be potentially used in other processes.88
Matsumura et al.86 intensively studied the reaction mechanisms of hydrothermal liquefaction of
cellulose (Figure 13). This work proposes that a combination of a thermal and hydrolytic cleavage
is present during hydrothermal liquefaction of cellulosic materials.
Figure 13. Proposed reaction mechanism of microcrystalline cellulose in supercritical water. 1) Swelled (or Dissolved) cellulose; 2) cellooligosaccharides; 3) glucose; 4) erythrose; 5)
glycolaldehyde; 6) fructose; 7) glyceraldehyde; 8) dihydroxyacetone; 9) pyruvaldehyde; 10) 5-HMF; 11) 2-furfural; 12) glucopyranosyl-erythrose; 13) glucopyranosyl-glycol-aldehyde; 14)
anhydro-cellooligosaccharides; 15) levoglucosan
54
The reaction mechanism that predominates in the hydrothermal liquefaction of cellulose is the
beta-1,4 cleavage with a molecule of water, producing oligosaccharides and eventually
glucose.85,89
Glucose can then undergo several other reactions, mainly dehydration, retro-aldol condensation,
isomerization, decarboxylation and decarbonylation, that will produce aldehydes, carboxylic
acids and eventually permanent gas.94,95
3.1.2. Effect of hydrolysis conditions on product distribution
The most important operating condition in hydrothermal processes is the temperature. As
mentioned before, this will strongly affect the properties of water and will provide the energy
required to break the linkages in lignocellulosic biomass.
Yun et al.96 found that 150ᵒC are required in order to break a glycosidic bond in the amorphous
zone of cellulose and 180ᵒC in the crystalline one. Higher temperature will provoke the
degradation of sugars. Since the conversion kinetics of the soluble compounds are much faster
than that of the solid cellulose (with sub-critical water), increasing the temperature will
drastically increase the secondary reactions of the soluble sugars, transforming them into lighter
compounds (e.g. aldehydes, carboxylic acids, carbon dioxide).85,97,98,87
There is no direct effect of the pressure on the reaction mechanisms. However, if water is partially
evaporated, the depolymerization will follow similar reaction mechanisms but with different
composition and the energetic requirements of the process will increase significantly.88 It has been
reported that a pyrolytic mechanism may be promoted if there is not enough water accessibility.86
The residence time plays a fundamental role for the selective conversion of cellulosic materials
into sugars or chemicals. Long residence times will provoke secondary reactions and therefore
55
the degradation of the sugars.89,96,99 A good combination of temperature and residence time are
needed in order to optimize the sugar yield.
3.1.3. Reactors and processes
The reactor technology will define the range of residence times for this process. Principally, two
technologies have been studied for the depolymerization of cellulose: batch,85,86 semi-
continuous89 and continuous reactors.
Continuous reactors have been developed where a slurry of the cellulosic feedstock is pumped
in a tubular reactor. A tubular reactor allows a good control of the conversion degree of cellulose
and therefore of the selectivity to target products. The solid particles can exhibit a short residence
time, producing a high yield of oligosaccharides with less monosaccharides. The main problem
of this technology is the pumping of slurries that contain high solid contents and the continuous
separation of solids (hydrochar) with soluble sugars.85,97,100
In semi-continuous reactors hot water flows through a fixed bed of the cellulosic feedstock. The
solid remains in the reactor while the water with the soluble products is rapidly removed, giving
a long residence time for the solid, and a very short one for the liquid. This technology allows
recovering a high yield of mono- and oligosaccharides but it is not a continuous
process.101,102,89,89,96
In batch reactors, the solid feedstock is mixed with the liquid, remaining in the reactor during the
whole process. Both, liquid and solid residence times are relatively long.98 Because the liquid
residence time is long, a fraction of the sugars produced can be degraded into lighter compounds
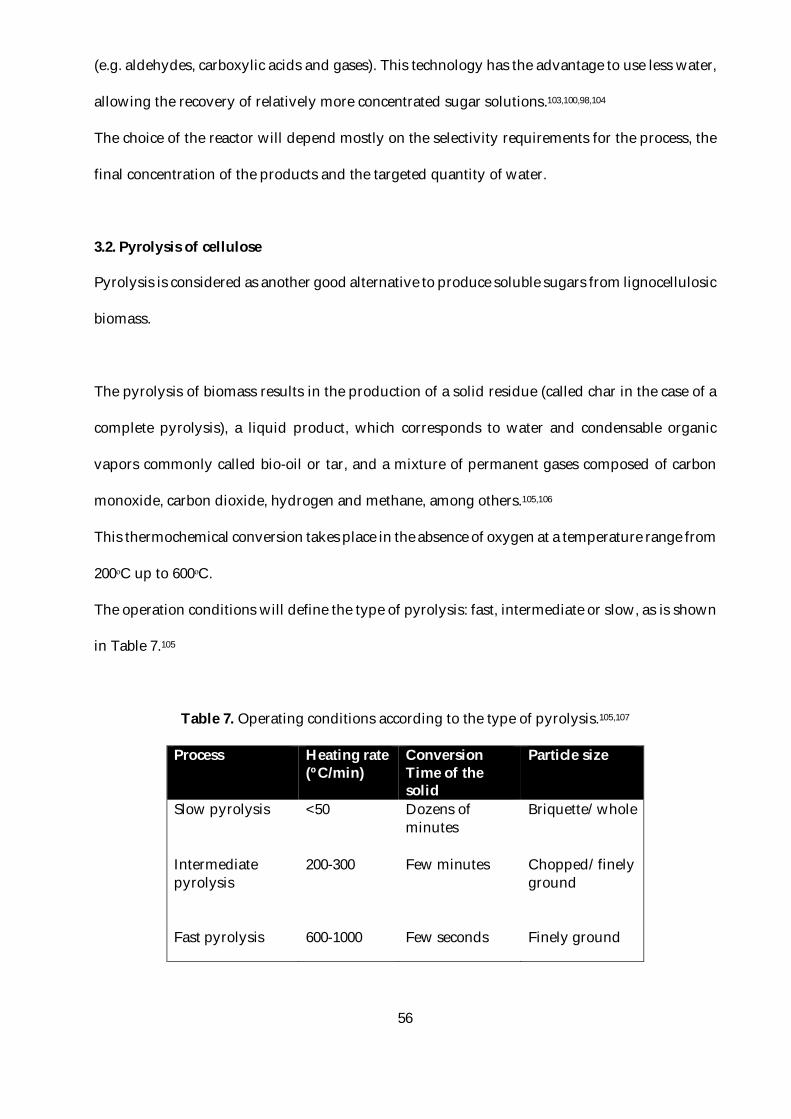
56
(e.g. aldehydes, carboxylic acids and gases). This technology has the advantage to use less water,
allowing the recovery of relatively more concentrated sugar solutions.103,100,98,104
The choice of the reactor will depend mostly on the selectivity requirements for the process, the
final concentration of the products and the targeted quantity of water.
3.2. Pyrolysis of cellulose
Pyrolysis is considered as another good alternative to produce soluble sugars from lignocellulosic
biomass.
The pyrolysis of biomass results in the production of a solid residue (called char in the case of a
complete pyrolysis), a liquid product, which corresponds to water and condensable organic
vapors commonly called bio-oil or tar, and a mixture of permanent gases composed of carbon
monoxide, carbon dioxide, hydrogen and methane, among others.105,106
This thermochemical conversion takes place in the absence of oxygen at a temperature range from
200ᵒC up to 600ᵒC.
The operation conditions will define the type of pyrolysis: fast, intermediate or slow, as is shown
in Table 7.105
Table 7. Operating conditions according to the type of pyrolysis.105,107
Process Heating rate (ºC/min)
Conversion Time of the solid
Particle size
Slow pyrolysis <50 Dozens of minutes
Briquette/whole
Intermediate pyrolysis
200-300 Few minutes Chopped/finely ground
Fast pyrolysis 600-1000 Few seconds Finely ground
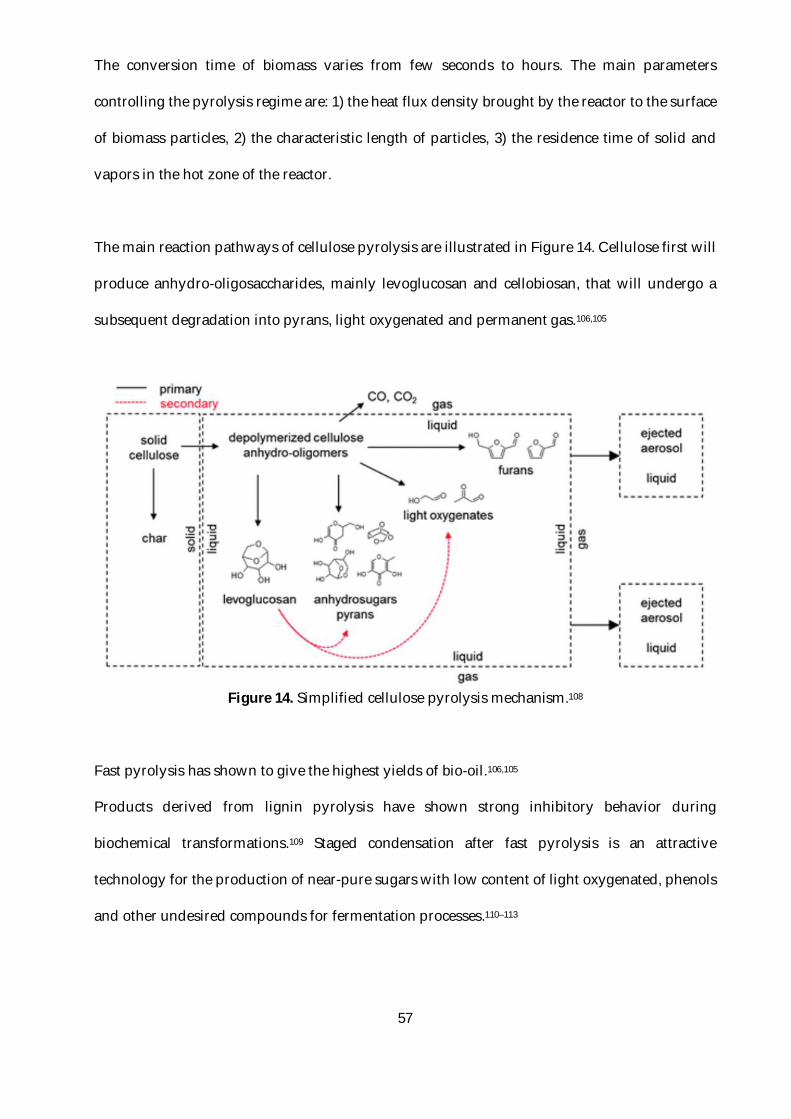
57
The conversion time of biomass varies from few seconds to hours. The main parameters
controlling the pyrolysis regime are: 1) the heat flux density brought by the reactor to the surface
of biomass particles, 2) the characteristic length of particles, 3) the residence time of solid and
vapors in the hot zone of the reactor.
The main reaction pathways of cellulose pyrolysis are illustrated in Figure 14. Cellulose first will
produce anhydro-oligosaccharides, mainly levoglucosan and cellobiosan, that will undergo a
subsequent degradation into pyrans, light oxygenated and permanent gas.106,105
Figure 14. Simplified cellulose pyrolysis mechanism.108
Fast pyrolysis has shown to give the highest yields of bio-oil.106,105
Products derived from lignin pyrolysis have shown strong inhibitory behavior during
biochemical transformations.109 Staged condensation after fast pyrolysis is an attractive
technology for the production of near-pure sugars with low content of light oxygenated, phenols
and other undesired compounds for fermentation processes.110–113
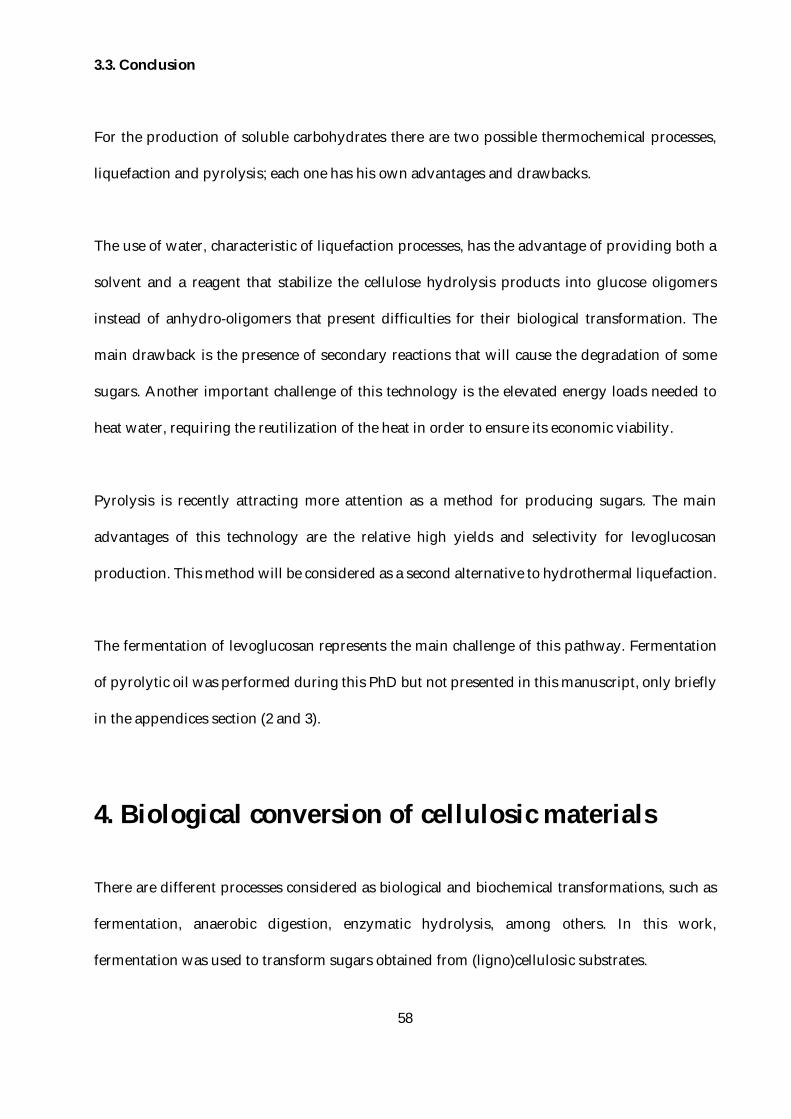
58
3.3. Conclusion
For the production of soluble carbohydrates there are two possible thermochemical processes,
liquefaction and pyrolysis; each one has his own advantages and drawbacks.
The use of water, characteristic of liquefaction processes, has the advantage of providing both a
solvent and a reagent that stabilize the cellulose hydrolysis products into glucose oligomers
instead of anhydro-oligomers that present difficulties for their biological transformation. The
main drawback is the presence of secondary reactions that will cause the degradation of some
sugars. Another important challenge of this technology is the elevated energy loads needed to
heat water, requiring the reutilization of the heat in order to ensure its economic viability.
Pyrolysis is recently attracting more attention as a method for producing sugars. The main
advantages of this technology are the relative high yields and selectivity for levoglucosan
production. This method will be considered as a second alternative to hydrothermal liquefaction.
The fermentation of levoglucosan represents the main challenge of this pathway. Fermentation
of pyrolytic oil was performed during this PhD but not presented in this manuscript, only briefly
in the appendices section (2 and 3).
4. Biological conversion of cellulosic materials
There are different processes considered as biological and biochemical transformations, such as
fermentation, anaerobic digestion, enzymatic hydrolysis, among others. In this work,
fermentation was used to transform sugars obtained from (ligno)cellulosic substrates.
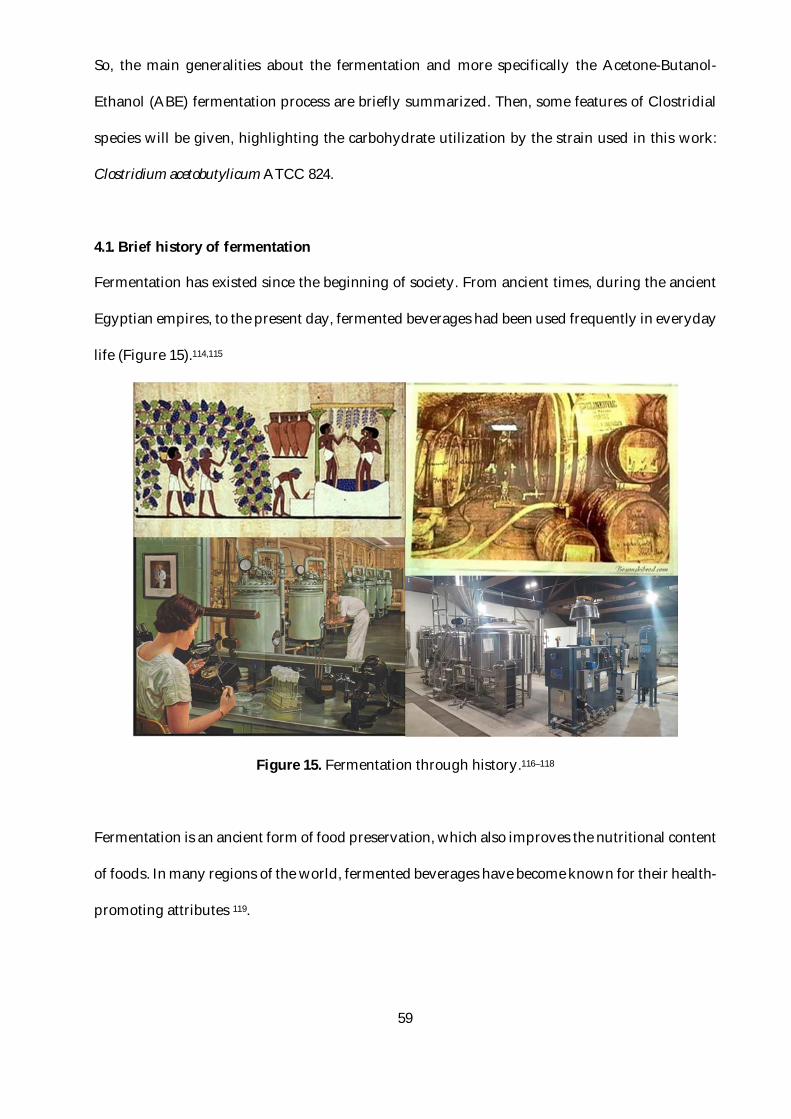
59
So, the main generalities about the fermentation and more specifically the Acetone-Butanol-
Ethanol (ABE) fermentation process are briefly summarized. Then, some features of Clostridial
species will be given, highlighting the carbohydrate utilization by the strain used in this work:
Clostridium acetobutylicum ATCC 824.
4.1. Brief history of fermentation
Fermentation has existed since the beginning of society. From ancient times, during the ancient
Egyptian empires, to the present day, fermented beverages had been used frequently in everyday
life (Figure 15).114,115
Figure 15. Fermentation through history.116–118
Fermentation is an ancient form of food preservation, which also improves the nutritional content
of foods. In many regions of the world, fermented beverages have become known for their health-
promoting attributes 119.
60
Fermentation started to be scientifically studied since the XIX century. French microbiologist
Louis Pasteur is known for his important contributions in this field proving for the first time that
fermentation was initiated by microorganisms120–122.
Regarding the carbohydrate utilization by bacteria, Jacques Monod made big contributions
discovering the phenomenon of Diauxie that consist in a catabolite repression resulting in a
biphasic growth when two carbon sources are present in the growth media 123,124.
Since then, fermentation technologies have experienced a steadily development with the
assistance of advance sciences like molecular biology and genetic modification. This promotes
the uses of these technologies to the production of pharmaceuticals, building blocks, chemicals
and fuels.
4.2. Current definition of fermentation
Fermentation is a process in which living cells (bacteria, yeast or other microorganisms) are used
for the chemical breakdown of a carbon source under anaerobic conditions 125.
Industrially, it consists in a bulk growth of microorganisms on a growth medium that are
cultivated to produce a specific chemical product.
In most of the cases, the substrates are carbohydrates and the products are, for most of them
alcohols and organic acids. However, microorganisms possess a unique set of enzymatic
reactions that allow them to transform a wide variety of substrates that can lead to compounds
which their chemical synthesis is too complicated or does not exist 125.
This process was first called fermentation by the French microbiologist Louis Pasteur, pioneer of
this field, describing this phenomena as life in the absence of oxygen.
Pasteur first called this process “the life without air” 126, but nowadays, fermentation processes
can be defined as those biological transformations that occur without any respiratory chain
involving oxygen or other alternative final electron acceptor 127. During this process, bacteria can
61
carry out a wide variety of oxidation-reduction reactions that can lead to products with industrial
interest such as biofuels.
4.3. ABE Fermentation process
Solventogenic clostridia are able to produce butanol in high yields and acetone-ethanol in lesser
quantities, accompanied by the production of hydrogen (H2) and carbon dioxide (CO2) in a
process called ABE fermentation 128,129.
This fermentation process was discovered by the chemist Chaim Weizmann during world war I,
using C. acetobutylicum 130. The main purpose was to produce large quantities of acetone needed
in the production of cordite used in the war industry and when the world war II started, ABE
fermentation was given top priority 131.
The industrial interest in ABE fermentation declined rapidly during the 1960’s due to the fast
development of the petrochemical industry and increasing cost of the substrates 128,131.
In the recent years, solventogenic clostridia are receiving much attention due to their ability to
produce profitable chemicals such as butanol, 1,3-propanediol and hydrogen.
Butanol presents an interesting alternative to fossil fuels 132. For this reason, its production from
alternative resources is taken a lot of attention and new efforts are being made for its proper
development 129,133.
Butanol can also be produced by hydroformylation starting from propylene with H2 and CO over
rhodium catalyst (oxo-process) 134 or the aldol process starting from acetaldehyde 135. However,
these are not sustainable processes and for this reason production of these chemicals from
renewable resources attracts a lot of interest in the present days 132,135.
Several studies have been made in order to better understand the mechanisms of sugar transport
136, regulation of butanol production 137, butanol tolerance 138, utilization of lignocellulosic biomass
139–141, bacterial inhibition 142,143 and genetic tools 138,144,145 in order to improve butanol final yield,
overcome its toxicity, inhibition and other limiting factors.
62
A wide variety of microorganisms belonging to the genus Clostridia are available to study this
process 146. In the next section the generalities of these microorganisms will be briefly
summarized, followed by an explanation of the minimum requirements needed to achieve a
performant growth and solvent production by these microorganisms.
4.4. Clostridial species
The genus Clostridium was established for the first time by Prazmowki147 in 1880. Later, more
precise studies about these microorganisms were described by Morris148 and Dürre.149 It is the
second largest bacterial genera, only after Streptomyces.146
They exhibit a rod-shaped morphology, gram-positive staining cell membrane, able to form heat-
stable endospores and fermentative metabolism without the capacity for dissimilatory sulphate
reduction.146 Most of Clostridial species are strict anaerobes with few exceptions, like Clostridium
oroticum, that is an aero-tolerant strain.150
Clostridium form an exceptionally resistant structure capable of surviving for long periods in an
unfavorable environment. This dormant structure is called endospore since it develops within
the cell. Under favorable conditions the spore germinates and gives rise to a vegetative cell, as is
shown on Figure 16.146,151–153
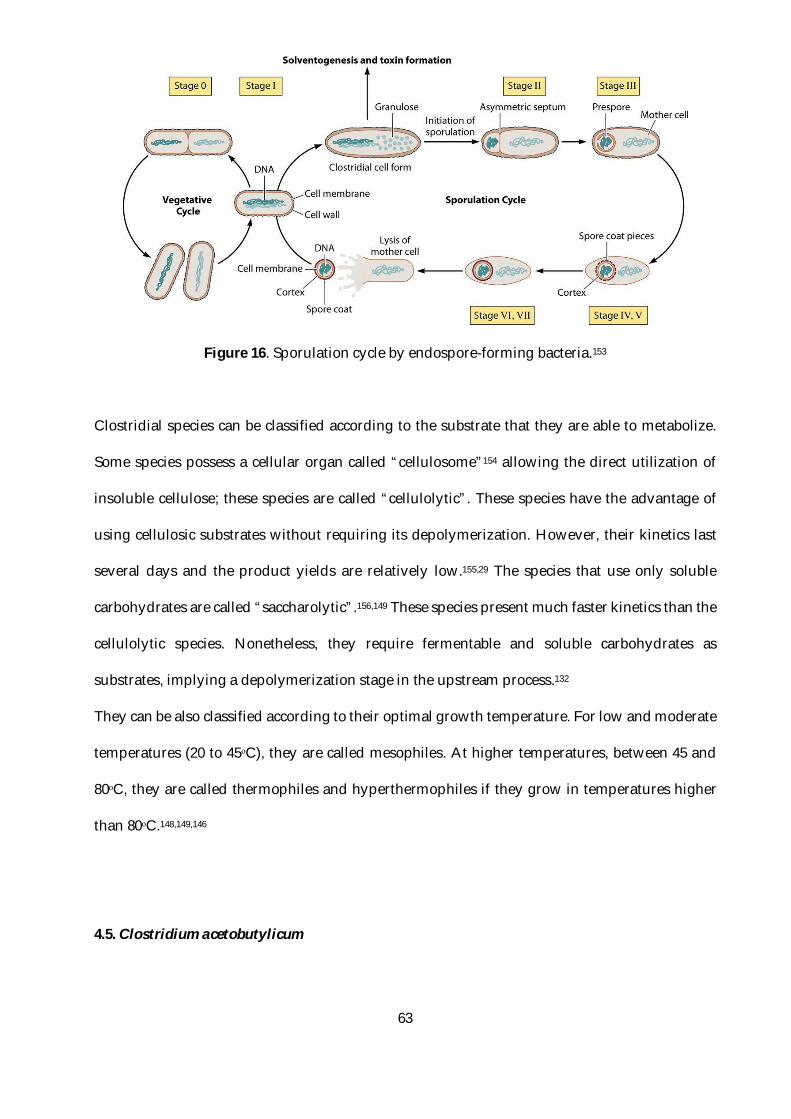
63
Figure 16. Sporulation cycle by endospore-forming bacteria.153
Clostridial species can be classified according to the substrate that they are able to metabolize.
Some species possess a cellular organ called “cellulosome”154 allowing the direct utilization of
insoluble cellulose; these species are called “cellulolytic”. These species have the advantage of
using cellulosic substrates without requiring its depolymerization. However, their kinetics last
several days and the product yields are relatively low.155,29 The species that use only soluble
carbohydrates are called “saccharolytic”.156,149 These species present much faster kinetics than the
cellulolytic species. Nonetheless, they require fermentable and soluble carbohydrates as
substrates, implying a depolymerization stage in the upstream process.132
They can be also classified according to their optimal growth temperature. For low and moderate
temperatures (20 to 45ᵒC), they are called mesophiles. At higher temperatures, between 45 and
80ᵒC, they are called thermophiles and hyperthermophiles if they grow in temperatures higher
than 80ᵒC.148,149,146
4.5. Clostridium acetobutylicum
64
In this work, C. acetobutylicum ATCC 824 is used for the fermentation of cellulose-derived
carbohydrates. The fact that this species shows fast kinetics and the ability to use a wide variety
of substrates make it the best choice for this process.
C. acetobutylicum is an anaerobic, saccharolytic and mesophilic strain with an optimal growth
temperature of 37ᵒC. It is able to produce some commercially useful products (e.g. butanol,
acetone, ethanol, hydrogen, acetic acid, butyric acid). It is one of the first bacteria to be used at
industrial scale.131
4.5.1. Metabolism
Metabolism in C. acetobutylicum, like in all cells, starts with the transmembrane transport. The
nucleotide adenosine triphosphate (ATP) is the main carrier of biologically available energy in
living cells. This is because all living processes requiring energy are coupled to the conversion of
ATP to adenosine diphosphate (ADP) 157, as is shown in the equation ( 1 ).
퐴푇푃 +퐻 푂
⎯⎯⎯⎯⎯⎯⎯⎯⎯⎯⎯ 퐴퐷푃 + 푃 ( 1 )
ATP can be formed either by substrate-level or electron transport phosphorylation.158 This
molecule will play an important role in cellular transport. Once the molecules is inside the cell, it
will be metabolize according to its nature by different enzyme systems.158
A scheme showing the main metabolic pathway of hexoses by C. acetobutylicum is illustrated in
Figure 17. Normally, only obligate anaerobes have this type of metabolism.
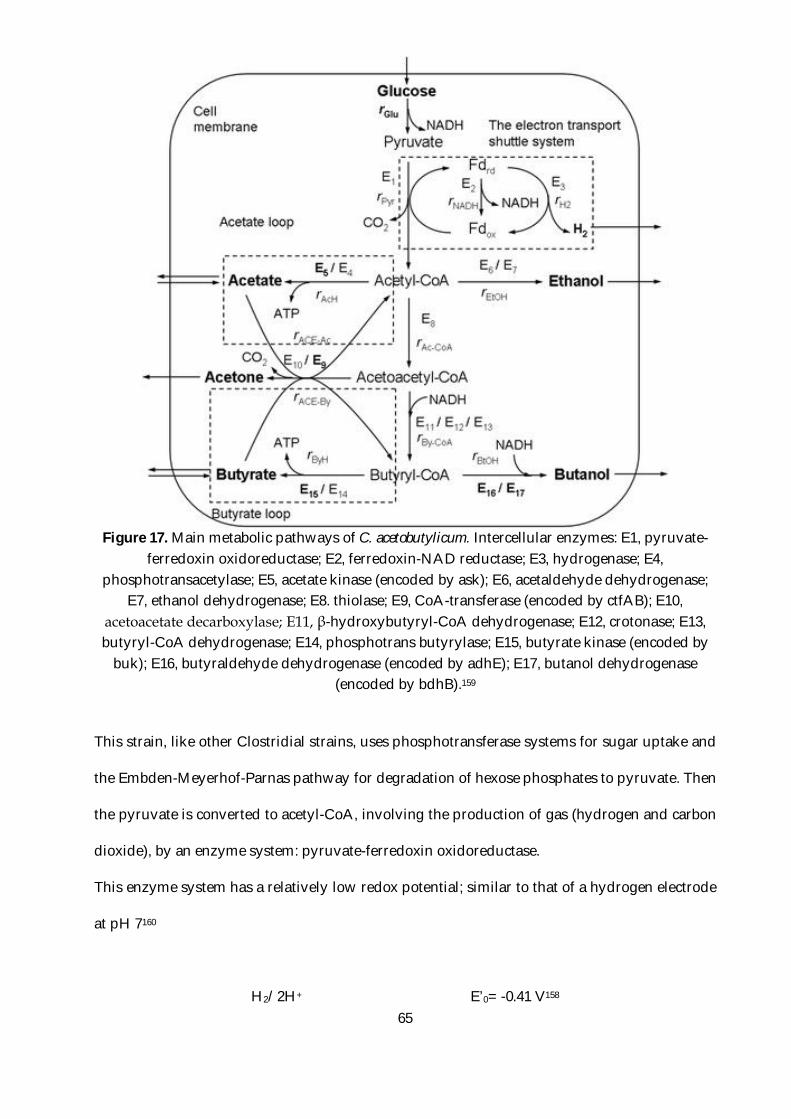
65
Figure 17. Main metabolic pathways of C. acetobutylicum. Intercellular enzymes: E1, pyruvate-
ferredoxin oxidoreductase; E2, ferredoxin-NAD reductase; E3, hydrogenase; E4, phosphotransacetylase; E5, acetate kinase (encoded by ask); E6, acetaldehyde dehydrogenase;
E7, ethanol dehydrogenase; E8. thiolase; E9, CoA-transferase (encoded by ctfAB); E10, acetoacetate decarboxylase; E11, β-hydroxybutyryl-CoA dehydrogenase; E12, crotonase; E13, butyryl-CoA dehydrogenase; E14, phosphotrans butyrylase; E15, butyrate kinase (encoded by
buk); E16, butyraldehyde dehydrogenase (encoded by adhE); E17, butanol dehydrogenase (encoded by bdhB).159
This strain, like other Clostridial strains, uses phosphotransferase systems for sugar uptake and
the Embden-Meyerhof-Parnas pathway for degradation of hexose phosphates to pyruvate. Then
the pyruvate is converted to acetyl-CoA, involving the production of gas (hydrogen and carbon
dioxide), by an enzyme system: pyruvate-ferredoxin oxidoreductase.
This enzyme system has a relatively low redox potential; similar to that of a hydrogen electrode
at pH 7160
H2/2H+ E’0= -0.41 V158
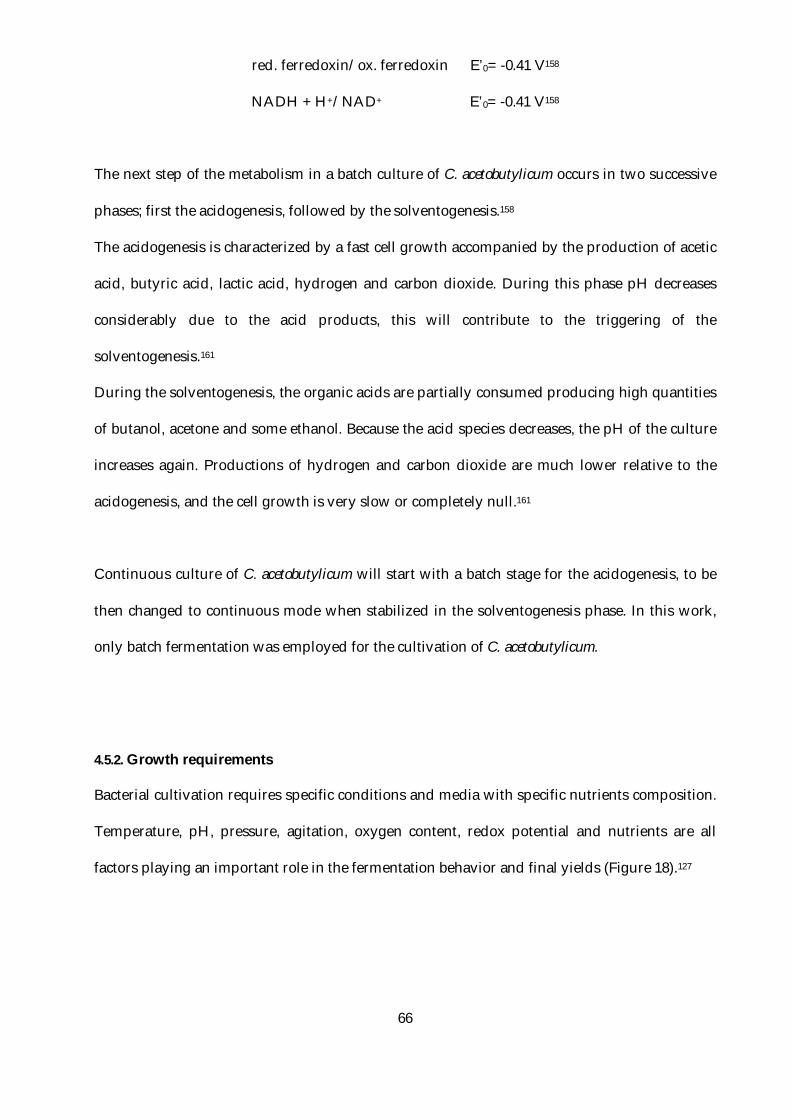
66
red. ferredoxin/ox. ferredoxin E’0= -0.41 V158
NADH + H+/NAD+ E’0= -0.41 V158
The next step of the metabolism in a batch culture of C. acetobutylicum occurs in two successive
phases; first the acidogenesis, followed by the solventogenesis.158
The acidogenesis is characterized by a fast cell growth accompanied by the production of acetic
acid, butyric acid, lactic acid, hydrogen and carbon dioxide. During this phase pH decreases
considerably due to the acid products, this will contribute to the triggering of the
solventogenesis.161
During the solventogenesis, the organic acids are partially consumed producing high quantities
of butanol, acetone and some ethanol. Because the acid species decreases, the pH of the culture
increases again. Productions of hydrogen and carbon dioxide are much lower relative to the
acidogenesis, and the cell growth is very slow or completely null.161
Continuous culture of C. acetobutylicum will start with a batch stage for the acidogenesis, to be
then changed to continuous mode when stabilized in the solventogenesis phase. In this work,
only batch fermentation was employed for the cultivation of C. acetobutylicum.
4.5.2. Growth requirements
Bacterial cultivation requires specific conditions and media with specific nutrients composition.
Temperature, pH, pressure, agitation, oxygen content, redox potential and nutrients are all
factors playing an important role in the fermentation behavior and final yields (Figure 18).127
67
Figure 18. Schematic of a bioreactor with the variables influencing a fermentation process.162
The pH is one of the most important variables in the cultivation of C. acetobutylicum. Some studies
have shown that the pH value and control can be a critical factor for the optimization of
fermentative butanol production.163–167
pH will strongly affect the metabolic phases, more specifically, the transition from the
acidogenesis to the solventogenesis. The presence of non-dissociated forms of the acidic species
depends on the pH of the culture media. Non-dissociated acids will enter the cell and altered the
intracellular pH, provoking the cell to recycle these acids into solvents as a detoxification strategy,
that lead to the solventogenesis.168,169,161
As mentioned before, optimal temperature (37ᵒC) has been deeply studied and defined for C.
acetobutylicum. Agitation of 200 rpm and no oxygen in the culture media has been clearly establish
in the literature.170,171
Among the chemicals of the culture media, the source of carbon represents the highest fraction.
For this reason, it is the most important component for an efficient incorporation of fermentation
processes in an integrated biorefinery. The most common carbon source used in fermentation
processes is glucose.
68
Fermentation of several hexoses and pentoses by C. acetobutylicum has been reported in the
literature, making it a potential microorganism for the fermentation of carbohydrates
mixtures.172,136,173,174
4.5.3. Inhibition
During (ligno)cellulose conversion, is very often to found side reaction that produce undesired
compounds for microorganisms. In biological conversion processes, these compounds are called
inhibitors, they do not react directly with the raw material but they will interfere with the normal
development of the biocatalyst (enzymes and microorganisms).41,61
Inhibition of Clostridial species by non-dissociated acids has an early impact on the fermentation
process (see previous sub-section), affecting cell growth at concentrations starting at 0.25
g/L.175,168
Solvents have a different inhibition mechanism. Their hydrophobic nature allows them to
disarrange the phospholipidic bilayer of the cellular membrane.176–178 Short-chain alcohols, like
ethanol, will decrease the fluidity of the cell membrane. In contrary, butanol and long-chain
alcohols will increase it.179
Because the sources of these carbohydrates are so diverse, microbes with a high level of substrate
adaptability that can tolerate toxic inhibitors in industrial media, are sought after for industrial-
level fermentation.180 C. acetobutylicum exhibit resistance to aldehydes such as 5-
hydroxymethyfurfural and furfural,143 that are the main inhibitors produced during liquefaction
of (ligno)cellulose.86,181,182
4.6. Conclusion
69
Direct fermentation of cellulose using cellulolytic Clostridia have kinetics that are too slow to be
economically viable. For this reason, a saccharolytic Clostridium, C. acetobutylicum, is used to
convert cellulose-derived carbohydrates into profitable chemicals. Moreover, this strain has
already been used at the industrial scale processes. Its use leaves the door open to high-profile
projects.
Concerning the utilization of carbohydrates, C. acetobutylicum is able to use a wide variety of
sugars (hexoses and pentoses) which gives a potential advantage to ferment the carbohydrate
mixtures obtained by thermochemical conversion of (ligno)cellulose. It has been proven its
resistance to some of the most common inhibitors derived from thermochemical
depolymerization (e.g. 5-HMF, furfural), providing the sturdiness to endure the fermentation of
complex mixtures.
Concerning the fermentation of pyrolytic oil, only few works are reported in the literature using
yeast or a modified E. coli (explained better in the next section), but there is no report in the
literature of pyrolytic oil fermentation by Clostridial strains. This approach was studied in this
PhD but only presented in the appendices section 2.
70
III. Combining thermochemical and
biological conversion of biomass
The main objective of this work is to propose a biorefinery strategy combining thermochemical
and biological conversion processes. In this section some of the current studies at the interface of
these two fields will be summarized. Then our proposed biorefinery concept will be explained.
1. Existing concepts
Only few works have been reported considering a thermochemical process as an entry process
for biological conversion in an integrated biorefinery.58,59,183
Jarboe et al.58 published a mini-review proposing fast pyrolysis as a viable non-enzymatic
method for the depolymerization of cellulose. Shen et al.59 reported a review summarizing the
features, challenges and mitigation strategies for pyrolysis-fermentation and gasification-
fermentation hybrid biorefinery processes. Fast pyrolysis allows producing high yields of
levoglucosan. Gasification to produce syngas, followed by ethanol fermentation is commercially
more advanced but has the main viability obstacle due to the low energy density of final product:
ethanol.59
Zheng et al.183 proposed a biorefinery strategy using organosolv fractionation, coupled to fast
pyrolysis to produce levoglucosan, showing an efficient method to produce sugars. However, the
main drawback of this strategy is that levoglucosan is not easily fermentable by bacteria.184
Only some yeast are able to ferment this anhydro-saccharide185,186 and more recent developments
using engineered bacteria have shown the utilization of small quantities of this substrate.187–190
2. Proposed concept in this PhD
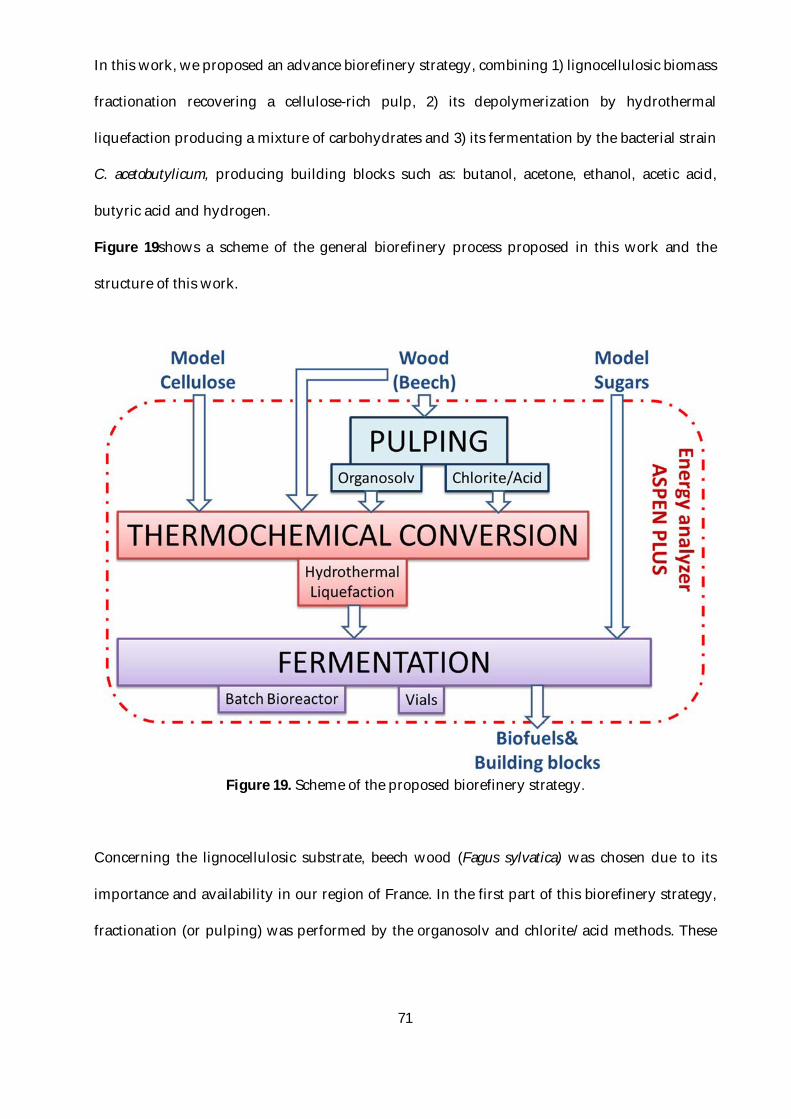
71
In this work, we proposed an advance biorefinery strategy, combining 1) lignocellulosic biomass
fractionation recovering a cellulose-rich pulp, 2) its depolymerization by hydrothermal
liquefaction producing a mixture of carbohydrates and 3) its fermentation by the bacterial strain
C. acetobutylicum, producing building blocks such as: butanol, acetone, ethanol, acetic acid,
butyric acid and hydrogen.
Figure 19shows a scheme of the general biorefinery process proposed in this work and the
structure of this work.
Figure 19. Scheme of the proposed biorefinery strategy.
Concerning the lignocellulosic substrate, beech wood (Fagus sylvatica) was chosen due to its
importance and availability in our region of France. In the first part of this biorefinery strategy,
fractionation (or pulping) was performed by the organosolv and chlorite/acid methods. These
72
methods allow recovering a cellulose-rich pulp that was characterized in macromolecules
content, inorganics, cellulose crystallinity and degree of polymerization.
In the second part, cellulose-rich pulps were depolymerized by hydrothermal liquefaction. Before
starting with the lignocellulosic biomass treatment and liquefaction, model cellulose
(microcrystalline cellulose, Avicel) was studied in order to understand its depolymerization and
to separate the effect of the side products coming from cellulose from those coming of other
constituents present in pulps.
The identification and quantification of the cellulose-derived carbohydrates has required the
implementation of improved analytical methods using ionic chromatography (HPAEC-PAD)
and advance mass spectrometry (LTQ-Orbitrap).
Fast pyrolysis of cellulose and pulps (followed by hydrolysis of bio-oils) has been also conducted
but it is not presented in this manuscript for sake of conciseness and clarity.
Then, the fermentation of the carbohydrate mixture produced by the various thermochemical
processes was performed in batch mode. The development of the substrate preparation protocol
(e.g. pH, concentration) was critical in order to ensure its utilization with normal fermentation
patterns and yields. Results about the effect of the pH on the growth of C. acetobutylicum when
cultivated on glucose or cellobiose are presented in the appendices section.
In the same way as for thermochemical conversion, cultures of C. acetobutylicum using mixtures
of model substrates (i.e. glucose and cellobiose) was studied to reveal phenomena related to the
utilization of carbohydrate mixtures. This experiments report for the first time the order of
utilization of a complex mixture carbohydrates and its transformation to profitable chemicals.

73
Besides this experimental work, a simplified process model has been developed using the
commercial software Aspen plus®, in order to establish mass and energy balance allowing to
analyze the energetic performance and its key factors and challenges.
74
IV. References
(1) IEA. Bioenergy https://www.iea.org/topics/renewables/bioenergy/ (accessed May 10, 2018).
(2) Bracmort, K. Biomass: Comparison of Definitions in Legislation. 2015, 15. (3) Demirbas, A.; Demirbas, M. F. Biorefineries. In Algae Energy; Green Energy and
Technology; Springer, London, 2010; pp 159–181. (4) Shen, J.; Zhu, S.; Liu, X.; Zhang, H.; Tan, J. The Prediction of Elemental Composition of
Biomass Based on Proximate Analysis. Energy Convers. Manag. 2010, 51 (5), 983–987. (5) Channiwala, S. A.; Parikh, P. P. A Unified Correlation for Estimating HHV of Solid, Liquid
and Gaseous Fuels. Fuel 2002, 81 (8), 1051–1063. (6) Parikh, J.; Channiwala, S. A.; Ghosal, G. K. A Correlation for Calculating HHV from
Proximate Analysis of Solid Fuels. Fuel 2005, 84 (5), 487–494. (7) Demirbaş, A. Calculation of Higher Heating Values of Biomass Fuels. Fuel 1997, 76 (5), 431–
434. (8) Parikh, J.; Channiwala, S. A.; Ghosal, G. K. A Correlation for Calculating Elemental
Composition from Proximate Analysis of Biomass Materials. Fuel 2007, 86 (12–13), 1710–1719.
(9) Neumann, H. J.; Paczynska-Lahme, B.; Severin, D. Composition and Properties of Petroleum. 1981.
(10) Mingle, J. G.; Boubel, R. W. Proximate Fuel Analysis of Some Western Wood and Bark; Forest Products Research Society, 1968.
(11) Misra, M. K.; Ragland, K. W.; Baker, A. J. Wood Ash Composition as a Function of Furnace Temperature. Biomass Bioenergy 1993, 4 (2), 103–116.
(12) Someshwar, A. V. Wood and Combination Wood-Fired Boiler Ash Characterization. J. Environ. Qual. 1996, 25 (5), 962–972.
(13) Werkelin, J.; Skrifvars, B.-J.; Hupa, M. Ash-Forming Elements in Four Scandinavian Wood Species. Part 1: Summer Harvest. Biomass Bioenergy 2005, 29 (6), 451–466.
(14) Pitman, R. M. Wood Ash Use in Forestry–a Review of the Environmental Impacts. For. Int. J. For. Res. 2006, 79 (5), 563–588.
(15) Di Blasi, C.; Galgano, A.; Branca, C. Influences of the Chemical State of Alkaline Compounds and the Nature of Alkali Metal on Wood Pyrolysis. Ind. Eng. Chem. Res. 2009, 48 (7), 3359–3369.
(16) Le Brech, Y.; Ghislain, T.; Leclerc, S.; Bouroukba, M.; Delmotte, L.; Brosse, N.; Snape, C.; Chaimbault, P.; Dufour, A. Effect of Potassium on the Mechanisms of Biomass Pyrolysis Studied Using Complementary Analytical Techniques. ChemSusChem 2016, 9 (8), 863–872.
(17) Teischinger, A. Opportunities and Limites of Timber in Construction. In World Conference on Timber Engineering (WCTE 2016); 2016.
(18) Carlquist, S. Comparative Wood Anatomy: Systematic, Ecological, and Evolutionary Aspects of Dicotyledon Wood; Springer Science & Business Media, 2013.
(19) Henricson, K. Wood Handling; Lappeenranta University of Technology, 2004. (20) Henricson, K. Wood Structure and Fibers.Pdf; Lappeenranta University of Technology,
2000. (21) McKendry, P. Energy Production from Biomass (Part 1): Overview of Biomass. Bioresour.
Technol. 2002, 83 (1), 37–46. (22) Harmsen, P.; Huijgen, W.; Bermudez, L.; Bakker, R. Literature Review of Physical and
Chemical Pretreatment Processes for Lignocellulosic Biomass. Energy Res. Cent. Neth. 2010, 10–13.
(23) Wegst, U. G. K.; Bai, H.; Saiz, E.; Tomsia, A. P.; Ritchie, R. O. Bioinspired Structural Materials. Nat. Mater. 2015, 14 (1), 23–36.
75
(24) Bucur, V. Techniques for High Resolution Imaging of Wood Structure: A Review. Meas. Sci. Technol. 2003, 14 (12), R91.
(25) Boura, A.; De Franceschi, D. Is Porous Wood Structure Exclusive of Deciduous Trees? Comptes Rendus Palevol 2007, 6 (6), 385–391.
(26) Miller, R. S.; Bellan, J. A Generalized Biomass Pyrolysis Model Based on Superimposed Cellulose, Hemicelluloseand Liqnin Kinetics. Combust. Sci. Technol. 1997, 126 (1–6), 97–137.
(27) Mosier, N.; Wyman, C.; Dale, B.; Elander, R.; Lee, Y. Y.; Holtzapple, M.; Ladisch, M. Features of Promising Technologies for Pretreatment of Lignocellulosic Biomass. Bioresour. Technol. 2005, 96 (6), 673–686.
(28) Dutta, S.; Pal, S. Promises in Direct Conversion of Cellulose and Lignocellulosic Biomass to Chemicals and Fuels: Combined Solvent–nanocatalysis Approach for Biorefinary. Biomass Bioenergy 2014, 62, 182–197.
(29) Desvaux, M.; Guedon, E.; Petitdemange, H. Kinetics and Metabolism of Cellulose Degradation at High Substrate Concentrations in Steady-State Continuous Cultures of Clostridium Cellulolyticum on a Chemically Defined Medium. Appl. Environ. Microbiol. 2001, 67 (9), 3837–3845.
(30) Guedon, E.; Desvaux, M.; Petitdemange, H. Improvement of Cellulolytic Properties of Clostridium Cellulolyticum by Metabolic Engineering. Appl. Environ. Microbiol. 2002, 68 (1), 53–58.
(31) Zhu, S.; Wu, Y.; Chen, Q.; Yu, Z.; Wang, C.; Jin, S.; Ding, Y.; Wu, G. Dissolution of Cellulose with Ionic Liquids and Its Application: A Mini-Review. Green Chem. 2006, 8 (4), 325–327.
(32) Ragauskas, A. J.; Williams, C. K.; Davison, B. H.; Britovsek, G.; Cairney, J.; Eckert, C. A.; Frederick, W. J.; Hallett, J. P.; Leak, D. J.; Liotta, C. L.; et al. The Path Forward for Biofuels and Biomaterials. Science 2006, 311 (5760), 484–489.
(33) Zhao, L.; Zhang, X.; Xu, J.; Ou, X.; Chang, S.; Wu, M. Techno-Economic Analysis of Bioethanol Production from Lignocellulosic Biomass in China: Dilute-Acid Pretreatment and Enzymatic Hydrolysis of Corn Stover. Energies 2015, 8 (5), 4096–4117.
(34) Mohd Azhar, S. H.; Abdulla, R.; Jambo, S. A.; Marbawi, H.; Gansau, J. A.; Mohd Faik, A. A.; Rodrigues, K. F. Yeasts in Sustainable Bioethanol Production: A Review. Biochem. Biophys. Rep. 2017, 10 (Supplement C), 52–61.
(35) Theander, O. Cellulose, Hemicellulose and Extractives. In Fundamentals of thermochemical biomass conversion; Springer, 1985; pp 35–60.
(36) Wyman, C. E.; Decker, S. R.; Himmel, M. E.; Brady, J. W.; Skopec, C. E.; Viikari, L. Hydrolysis of Cellulose and Hemicellulose. Polysacch. Struct. Divers. Funct. Versatility 2005, 1, 1023–1062.
(37) Delidovich, I.; Leonhard, K.; Palkovits, R. Cellulose and Hemicellulose Valorisation: An Integrated Challenge of Catalysis and Reaction Engineering. Energy Environ. Sci. 2014, 7 (9), 2803–2830.
(38) Strassberger, Z.; Tanase, S.; Rothenberg, G. The Pros and Cons of Lignin Valorisation in an Integrated Biorefinery. RSC Adv. 2014, 4 (48), 25310–25318.
(39) Chakar, F. S.; Ragauskas, A. J. Review of Current and Future Softwood Kraft Lignin Process Chemistry. Ind. Crops Prod. 2004, 20 (2), 131–141.
(40) Crestini, C.; Crucianelli, M.; Orlandi, M.; Saladino, R. Oxidative Strategies in Lignin Chemistry: A New Environmental Friendly Approach for the Functionalisation of Lignin and Lignocellulosic Fibers. Catal. Today 2010, 156 (1), 8–22.
(41) Palmqvist, E.; Hahn-Hägerdal, B. Fermentation of Lignocellulosic Hydrolysates. I: Inhibition and Detoxification. Bioresour. Technol. 2000, 74 (1), 17–24.
(42) Pandey M. P.; Kim C. S. Lignin Depolymerization and Conversion: A Review of Thermochemical Methods. Chem. Eng. Technol. 2010, 34 (1), 29–41.
(43) Ragauskas, A. J.; Beckham, G. T.; Biddy, M. J.; Chandra, R.; Chen, F.; Davis, M. F.; Davison, B. H.; Dixon, R. A.; Gilna, P.; Keller, M.; et al. Lignin Valorization: Improving Lignin Processing in the Biorefinery. Science 2014, 344 (6185), 1246843.
76
(44) Marcotte-Latulippe, A. Caractérisation Des Composés Organiques Volatils Émis Lors Du Séchage de Bois [Ressource Électronique]. PhD Thesis, Université Laval, 2006.
(45) Yang, G.; Jaakkola, P. Wood Chemistry and Isolation of Extractives from Wood. 47. (46) Bauer, F.; Coenen, L.; Hansen, T.; McCormick, K.; Palgan, Y. V. Technological Innovation
Systems for Biorefineries: A Review of the Literature. Biofuels Bioprod. Biorefining 2017, 11 (3), 534–548.
(47) Cherubini, F. The Biorefinery Concept: Using Biomass Instead of Oil for Producing Energy and Chemicals. Energy Convers. Manag. 2010, 51 (7), 1412–1421.
(48) Liu, S.; Abrahamson, L. P.; Scott, G. M. Biorefinery: Ensuring Biomass as a Sustainable Renewable Source of Chemicals, Materials, and Energy. Biomass Bioenergy 2012, 39, 1–4.
(49) Sutton, D.; Kelleher, B.; Ross, J. R. H. Review of Literature on Catalysts for Biomass Gasification. Fuel Process. Technol. 2001, 73 (3), 155–173.
(50) Bu, Q.; Lei, H.; Zacher, A. H.; Wang, L.; Ren, S.; Liang, J.; Wei, Y.; Liu, Y.; Tang, J.; Zhang, Q.; et al. A Review of Catalytic Hydrodeoxygenation of Lignin-Derived Phenols from Biomass Pyrolysis. Bioresour. Technol. 2012, 124, 470–477.
(51) Fernando, S.; Adhikari, S.; Chandrapal, C.; Murali, N. Biorefineries: Current Status, Challenges, and Future Direction. Energy Fuels 2006, 20 (4), 1727–1737.
(52) Carvalheiro, F.; Duarte, L. C.; Gírio, F. M. Hemicellulose Biorefineries: A Review on Biomass Pretreatments. 2008, 67, 16.
(53) Parajuli, R.; Dalgaard, T.; Jørgensen, U.; Adamsen, A. P. S.; Knudsen, M. T.; Birkved, M.; Gylling, M.; Schjørring, J. K. Biorefining in the Prevailing Energy and Materials Crisis: A Review of Sustainable Pathways for Biorefinery Value Chains and Sustainability Assessment Methodologies. Renew. Sustain. Energy Rev. 2015, 43, 244–263.
(54) Furimsky, E. Catalytic Hydrodeoxygenation. 2000, 44. (55) Olcese, R. N.; Bettahar, M.; Petitjean, D.; Malaman, B.; Giovanella, F.; Dufour, A. Gas-Phase
Hydrodeoxygenation of Guaiacol over Fe/SiO2 Catalyst. Appl. Catal. B Environ. 2012, 115–116, 63–73.
(56) Budzinski, M.; Nitzsche, R. Comparative Economic and Environmental Assessment of Four Beech Wood Based Biorefinery Concepts. Bioresour. Technol. 2016, 216 (Supplement C), 613–621.
(57) Jiang, L.; Zheng, A.; Zhao, Z.; He, F.; Li, H.; Wu, N. The Comparison of Obtaining Fermentable Sugars from Cellulose by Enzymatic Hydrolysis and Fast Pyrolysis. Bioresour. Technol. 2016, 200, 8–13.
(58) Jarboe, L. R.; Wen, Z.; Choi, D.; Brown, R. C. Hybrid Thermochemical Processing: Fermentation of Pyrolysis-Derived Bio-Oil. Appl. Microbiol. Biotechnol. 2011, 91 (6), 1519–1523.
(59) Shen, Y.; Jarboe, L.; Brown, R.; Wen, Z. A Thermochemical–biochemical Hybrid Processing of Lignocellulosic Biomass for Producing Fuels and Chemicals. Biotechnol. Adv. 2015, 33 (8), 1799–1813.
(60) Chen, H.; Zhao, J.; Hu, T.; Zhao, X.; Liu, D. A Comparison of Several Organosolv Pretreatments for Improving the Enzymatic Hydrolysis of Wheat Straw: Substrate Digestibility, Fermentability and Structural Features. Appl. Energy 2015, 150 (Supplement C), 224–232.
(61) Palmqvist, E.; Hahn-Hägerdal, B. Fermentation of Lignocellulosic Hydrolysates. II: Inhibitors and Mechanisms of Inhibition. Bioresour. Technol. 2000, 74 (1), 25–33.
(62) Yu, Y.; Wu, H. Effect of Ball Milling on the Hydrolysis of Microcrystalline Cellulose in Hot-Compressed Water. AIChE J. 2011, 57 (3), 793–800.
(63) Alvira, P.; Tomás-Pejó, E.; Ballesteros, M.; Negro, M. J. Pretreatment Technologies for an Efficient Bioethanol Production Process Based on Enzymatic Hydrolysis: A Review. Bioresour. Technol. 2010, 101 (13), 4851–4861.

77
(64) Madison, M. J.; Coward-Kelly, G.; Liang, C.; Karim, M. N.; Falls, M.; Holtzapple, M. T. Mechanical Pretreatment of Biomass – Part I: Acoustic and Hydrodynamic Cavitation. Biomass Bioenergy 2017, 98, 135–141.
(65) Campbell, W. G.; McDonald, I. R. C. The Chemistry of the Wood Cell Wall. Part I. The Delignification of Beech and Spruce Woods by Sodium Chlorite in Buffered Aqueous Solution. J. Chem. Soc. Resumed 1952, No. 0, 2644–2650.
(66) Katahira, R.; Mittal, A.; McKinney, K.; Ciesielski, P. N.; Donohoe, B. S.; Black, S. K.; Johnson, D. K.; Biddy, M. J.; Beckham, G. T. Evaluation of Clean Fractionation Pretreatment for the Production of Renewable Fuels and Chemicals from Corn Stover. ACS Sustain. Chem. Eng. 2014, 2 (6), 1364–1376.
(67) Moreno, A. D.; Ibarra, D.; Alvira, P.; Tomás-Pejó, E.; Ballesteros, M. A Review of Biological Delignification and Detoxification Methods for Lignocellulosic Bioethanol Production. Crit. Rev. Biotechnol. 2015, 35 (3), 342–354.
(68) Pinto, P. C.; Evtuguin, D. V.; Neto, C. P. Structure of Hardwood Glucuronoxylans: Modifications and Impact on Pulp Retention during Wood Kraft Pulping. Carbohydr. Polym. 2005, 60 (4), 489–497.
(69) Brosse, N.; Sannigrahi, P.; Ragauskas, A. Pretreatment of Miscanthus x Giganteus Using the Ethanol Organosolv Process for Ethanol Production. Ind. Eng. Chem. Res. 2009, 48 (18), 8328–8334.
(70) Sannigrahi, P.; Miller, S. J.; Ragauskas, A. J. Effects of Organosolv Pretreatment and Enzymatic Hydrolysis on Cellulose Structure and Crystallinity in Loblolly Pine. Carbohydr. Res. 2010, 345 (7), 965–970.
(71) Shao, X.; Jin, M.; Guseva, A.; Liu, C.; Balan, V.; Hogsett, D.; Dale, B. E.; Lynd, L. Conversion for Avicel and AFEX Pretreated Corn Stover by Clostridium Thermocellum and Simultaneous Saccharification and Fermentation: Insights into Microbial Conversion of Pretreated Cellulosic Biomass. Bioresour. Technol. 2011, 102 (17), 8040–8045.
(72) Hubbell, C. A.; Ragauskas, A. J. Effect of Acid-Chlorite Delignification on Cellulose Degree of Polymerization. Bioresour. Technol. 2010, 101 (19), 7410–7415.
(73) Siqueira, G.; Várnai, A.; Ferraz, A.; Milagres, A. M. F. Enhancement of Cellulose Hydrolysis in Sugarcane Bagasse by the Selective Removal of Lignin with Sodium Chlorite. Appl. Energy 2013, 102, 399–402.
(74) Yu, Z.; Jameel, H.; Chang, H.; Park, S. The Effect of Delignification of Forest Biomass on Enzymatic Hydrolysis. Bioresour. Technol. 2011, 102 (19), 9083–9089.
(75) Mittal, A.; Katahira, R.; Himmel, M. E.; Johnson, D. K. Effects of Alkaline or Liquid-Ammonia Treatment on Crystalline Cellulose: Changes in Crystalline Structure and Effects on Enzymatic Digestibility. Biotechnol. Biofuels 2011, 4, 41.
(76) Lee, S. H.; Doherty, T. V.; Linhardt, R. J.; Dordick, J. S. Ionic Liquid-Mediated Selective Extraction of Lignin from Wood Leading to Enhanced Enzymatic Cellulose Hydrolysis. Biotechnol. Bioeng. 2009, 102 (5), 1368–1376.
(77) Emmel, A.; Mathias, A. L.; Wypych, F.; Ramos, L. P. Fractionation of Eucalyptus Grandis Chips by Dilute Acid-Catalysed Steam Explosion. Bioresour. Technol. 2003, 86 (2), 105–115.
(78) Montane, D.; Farriol, X.; Salvadó, J.; Jollez, P.; Chornet, E. Application of Steam Explosion to the Fractionation and Rapid Vapor-Phase Alkaline Pulping of Wheat Straw. Biomass Bioenergy 1998, 14 (3), 261–276.
(79) Analytical Methods in Wood Chemistry, Pulping, and Papermaking; Sjöström, E., Alén, R., Eds.; Timell, T. E., Series Ed.; Springer Series in Wood Science; Springer Berlin Heidelberg: Berlin, Heidelberg, 1999.
(80) Ibrahim, M.; Glasser, W. G. Steam-Assisted Biomass Fractionation. Part III: A Quantitative Evaluation of the “Clean Fractionation” Concept. Bioresour. Technol. 1999, 70 (2), 181–192.
(81) Maurya, D. P.; Singla, A.; Negi, S. An Overview of Key Pretreatment Processes for Biological Conversion of Lignocellulosic Biomass to Bioethanol. 3 Biotech 2015, 5 (5), 597–609.
78
(82) Huijgen, W. J. J.; Reith, J. H.; den Uil, H. Pretreatment and Fractionation of Wheat Straw by an Acetone-Based Organosolv Process. Ind. Eng. Chem. Res. 2010, 49 (20), 10132–10140.
(83) Dalluge, D. L.; Daugaard, T.; Johnston, P.; Kuzhiyil, N.; Wright, M. M.; Brown, R. C. Continuous Production of Sugars from Pyrolysis of Acid-Infused Lignocellulosic Biomass. Green Chem. 2014, 16 (9), 4144.
(84) Goyal, H. B.; Seal, D.; Saxena, R. C. Bio-Fuels from Thermochemical Conversion of Renewable Resources: A Review. Renew. Sustain. Energy Rev. 2008, 12 (2), 504–517.
(85) Sasaki, M.; Kabyemela, B.; Malaluan, R.; Hirose, S.; Takeda, N.; Adschiri, T.; Arai, K. Cellulose Hydrolysis in Subcritical and Supercritical Water. J. Supercrit. Fluids 1998, 13 (1–3), 261–268.
(86) Matsumura, Y.; Sasaki, M.; Okuda, K.; Takami, S.; Ohara, S.; Umetsu, M.; Adschiri, T. Supercritical Water Treatment of Biomass for Energy and Material Recovery. Combust. Sci. Technol. 2006, 178 (1–3), 509–536.
(87) Deguchi, S.; Tsujii, K.; Horikoshi, K. Crystalline-to-Amorphous Transformation of Cellulose in Hot and Compressed Water and Its Implications for Hydrothermal Conversion. Green Chem. 2008, 10 (2), 191–196.
(88) Peterson, A. A.; Vogel, F.; Lachance, R. P.; Fröling, M.; Michael J. Antal, J.; Tester, J. W. Thermochemical Biofuel Production in Hydrothermal Media: A Review of Sub- and Supercritical Water Technologies. Energy Environ. Sci. 2008, 1 (1), 32–65.
(89) Yu, Y.; Wu, H. Characteristics and Precipitation of Glucose Oligomers in the Fresh Liquid Products Obtained from the Hydrolysis of Cellulose in Hot-Compressed Water. Ind. Eng. Chem. Res. 2009, 48 (23), 10682–10690.
(90) Akhtar, J.; Amin, N. A. S. A Review on Process Conditions for Optimum Bio-Oil Yield in Hydrothermal Liquefaction of Biomass. Renew. Sustain. Energy Rev. 2011, 15 (3), 1615–1624.
(91) Abdullah, R.; Ueda, K.; Saka, S. Hydrothermal Decomposition of Various Crystalline Celluloses as Treated by Semi-Flow Hot-Compressed Water. J. Wood Sci. 2014, 60 (4), 278–286.
(92) Elliott, D. C.; Biller, P.; Ross, A. B.; Schmidt, A. J.; Jones, S. B. Hydrothermal Liquefaction of Biomass: Developments from Batch to Continuous Process. Bioresour. Technol. 2015, 178, 147–156.
(93) Gollakota, A. R. K.; Kishore, N.; Gu, S. A Review on Hydrothermal Liquefaction of Biomass. Renew. Sustain. Energy Rev. 2018, 81, 1378–1392.
(94) Kabyemela, B. M.; Adschiri, T.; Malaluan, R. M.; Arai, K. Kinetics of Glucose Epimerization and Decomposition in Subcritical and Supercritical Water. Ind. Eng. Chem. Res. 1997, 36 (5), 1552–1558.
(95) Kabyemela, B. M.; Adschiri, T.; Malaluan, R. M.; Arai, K. Glucose and Fructose Decomposition in Subcritical and Supercritical Water: Detailed Reaction Pathway, Mechanisms, and Kinetics. Ind. Eng. Chem. Res. 1999, 38 (8), 2888–2895.
(96) Yu, Y.; Wu, H. Understanding the Primary Liquid Products of Cellulose Hydrolysis in Hot-Compressed Water at Various Reaction Temperatures. Energy Fuels 2010, 24 (3), 1963–1971.
(97) Sasaki, M.; Fang, Z.; Fukushima, Y.; Adschiri, T.; Arai, K. Dissolution and Hydrolysis of Cellulose in Subcritical and Supercritical Water. Ind. Eng. Chem. Res. 2000, 39 (8), 2883–2890.
(98) Kamio, E.; Takahashi, S.; Noda, H.; Fukuhara, C.; Okamura, T. Liquefaction of Cellulose in Hot Compressed Water under Variable Temperatures. Ind. Eng. Chem. Res. 2006, 45 (14), 4944–4953.
(99) Tolonen, L. K.; Juvonen, M.; Niemelä, K.; Mikkelson, A.; Tenkanen, M.; Sixta, H. Supercritical Water Treatment for Cello-Oligosaccharide Production from Microcrystalline Cellulose. Carbohydr. Res. 2015, 401, 16–23.
(100) Ehara, K.; Saka, S. A Comparative Study on Chemical Conversion of Cellulose between the Batch-Type and Flow-Type Systems in Supercritical Water. Cellulose 2002, 9 (3–4), 301–311.
79
(101) Sasaki, M.; Furukawa, M.; Minami, K.; Adschiri, T.; Arai, K. Kinetics and Mechanism of Cellobiose Hydrolysis and Retro-Aldol Condensation in Subcritical and Supercritical Water. Ind. Eng. Chem. Res. 2002, 41 (26), 6642–6649.
(102) Sasaki, M.; Adschiri, T.; Arai, K. Kinetics of Cellulose Conversion at 25 MPa in Sub- and Supercritical Water. AIChE J. 2004, 50 (1), 192–202.
(103) Minowa, T.; Zhen, F.; Ogi, T. Cellulose Decomposition in Hot-Compressed Water with Alkali or Nickel Catalyst. J. Supercrit. Fluids 1998, 13 (1–3), 253–259.
(104) Kumar, S.; Gupta, R. B. Biocrude Production from Switchgrass Using Subcritical Water. Energy Fuels 2009, 23 (10), 5151–5159.
(105) Bridgwater, A. V. Review of Fast Pyrolysis of Biomass and Product Upgrading. Biomass Bioenergy 2012, 38, 68–94.
(106) Mohan, D.; Pittman, Charles U.; Steele, P. H. Pyrolysis of Wood/Biomass for Bio-Oil: A Critical Review. Energy Fuels 2006, 20 (3), 848–889.
(107) Roy, P.; Dias, G. Prospects for Pyrolysis Technologies in the Bioenergy Sector: A Review. Renew. Sustain. Energy Rev. 2017, 77, 59–69.
(108) Mettler, M. S.; Vlachos, D. G.; Dauenhauer, P. J. Top Ten Fundamental Challenges of Biomass Pyrolysis for Biofuels. Energy Environ. Sci. 2012, 5 (7), 7797–7809.
(109) Yoo, C. G.; Li, M.; Meng, X.; Pu, Y.; Ragauskas, A. J. Effects of Organosolv and Ammonia Pretreatments on Lignin Properties and Its Inhibition for Enzymatic Hydrolysis. Green Chem. 2017, 19 (8), 2006–2016.
(110) Pollard, A. S.; Rover, M. R.; Brown, R. C. Characterization of Bio-Oil Recovered as Stage Fractions with Unique Chemical and Physical Properties. J. Anal. Appl. Pyrolysis 2012, 93, 129–138.
(111) Rover, M. R.; Johnston, P. A.; Jin, T.; Smith, R. G.; Brown, R. C.; Jarboe, L. Production of Clean Pyrolytic Sugars for Fermentation. ChemSusChem 2014, 7 (6), 1662–1668.
(112) Conrad, S.; Schulzke, T.; Westermeyer, J. Improvement of Pyrolysis Liquid Usability by Staged Condensation of Pyrolysis Vapours from Ablative Flash Pyrolysis of Barley Straw. In Proceedings of 23 rd European Biomass Conference and Exhibition, June; 2015; Vol. 1, pp 917–922.
(113) Schulzke, T.; Conrad, S.; Westermeyer, J. Fractionation of Flash Pyrolysis Condensates by Staged Condensation. Biomass Bioenergy 2016, 95, 287–295.
(114) Ghalioungui, P.; others. Fermented Beverages in Antiquity; Academic Press, New York, 1979. (115) Gastineau, C. Fermented Food Beverages in Nutrition; Elsevier, 2013. (116) Ancient Egypt https://www.hort.purdue.edu/newcrop/history/egypt/21.html
(accessed May 13, 2018). (117) A Brief History of Alcohol & Alcoholic Beverages - Drug-Free World
https://www.drugfreeworld.org/drugfacts/alcohol/a-short-history.html (accessed May 13, 2018).
(118) Congressman Loebsack Tours Up and Coming Beer Brewery http://www.kbur.com/2016/08/30/congressman-visits-burlington-to-tour-up-and-coming-beer-brewery/ (accessed May 13, 2018).
(119) Marsh, A. J.; Hill, C.; Ross, R. P.; Cotter, P. D. Fermented Beverages with Health-Promoting Potential: Past and Future Perspectives. Trends Food Sci. Technol. 2014, 38 (2), 113–124.
(120) Pasteur, L. Sur La Fermentation Visquese et La Fermentation Butyrique. Bull Soc Chim Paris 1861, 11, 30–31.
(121) Pasteur, L.; Faulkner, F.; Robb, D. C. Studies on Fermentation: The Diseases of Beer, Their Causes, and the Means of Preventing Them. A Translation, Made with the Author’s Sanction, of Études Sur La Bière; with Notes, Index, and Original Illustrations; Macmillan, 1879.
(122) Pasteur, L. Mémoire Sur La Fermentation Appelée Lactique (Extrait Par l’auteur). Mol. Med. 1995, 1 (6), 599.
(123) Monod, J. Recherches sur la croissance des cultures bactériennes. 1942.
80
(124) Roseman, S.; Meadow, N. D. Signal Transduction by the Bacterial Phosphotransferase System. Diauxie and the Crr Gene (J. Monod Revisited). J. Biol. Chem. 1990, 265 (6), 2993–2996.
(125) Prescott, L.; Harley, J.; Klein, D. A. Microbiology. 5aEd. N. Y. McGraw-Hiil Book 2002. (126) Pasteur, L. Physiological Theory of Fermentation; BiblioBytes, 1995. (127) El-Mansi, E. M. T.; Bryce, C. F.; Demain, A. L.; Allman, A. R. Fermentation Microbiology and
Biotechnology; CRC press, 2011. (128) Lee, S. Y.; Park, J. H.; Jang, S. H.; Nielsen, L. K.; Kim, J.; Jung, K. S. Fermentative Butanol
Production by Clostridia. Biotechnol. Bioeng. 2008, 101 (2), 209–228. (129) Dürre, P. Fermentative Production of Butanol—the Academic Perspective. Curr. Opin.
Biotechnol. 2011, 22 (3), 331–336. (130) Weizmann, C. Charles Weizmann; Google Patents, 1919. (131) Jones, D. T.; Woods, D. R. Acetone-Butanol Fermentation Revisited. Microbiol. Rev. 1986, 50
(4), 484–524. (132) Dürre, P. Fermentative Butanol Production. Ann. N. Y. Acad. Sci. 2008, 1125 (1), 353–362. (133) Ranjan, A.; Moholkar, V. S. Biobutanol: Science, Engineering, and Economics. Int. J. Energy
Res. 2012, 36 (3), 277–323. (134) Billig, E.; Bryant, D. R. Oxo Process. Kirk-Othmer Encycl. Chem. Technol. 2000. (135) Ndaba, B.; Chiyanzu, I.; Marx, S. N-Butanol Derived from Biochemical and Chemical
Routes: A Review. Biotechnol. Rep. 2015, 8, 1–9. (136) Mitchell, W. J.; Albasheri, K. A.; Yazdanian, M. Factors Affecting Utilization of
Carbohydrates by Clostridia. FEMS Microbiol. Rev. 1995, 17 (3), 317–329. (137) Jiang, M.; Chen, J.; He, A.; Wu, H.; Kong, X.; Liu, J.; Yin, C.; Chen, W.; Chen, P. Enhanced
Acetone/Butanol/Ethanol Production by Clostridium Beijerinckii IB4 Using PH Control Strategy. Process Biochem. 2014, 49 (8), 1238–1244.
(138) Al-Shorgani, N. K. N.; Kalil, M. S.; Yusoff, W. M. W.; Hamid, A. A. Biobutanol Production by a New Aerotolerant Strain of Clostridium Acetobutylicum YM1 under Aerobic Conditions. Fuel 2015, 158, 855–863.
(139) Hörmeyer, H. F.; Tailliez, P.; Millet, J.; Girard, H.; Bonn, G.; Bobleter, O.; Aubert, J.-P. Ethanol Production by Clostridium Thermocellum Grown on Hydrothermally and Organosolv-Pretreated Lignocellulosic Materials. Appl. Microbiol. Biotechnol. 1988, 29 (6), 528–535.
(140) Tamaru, Y.; M., A. Lignocellulosic Biomass Utilization Toward Biorefinery Using Meshophilic Clostridial Species. In Cellulose - Biomass Conversion; Kadla, J., Ed.; InTech, 2013.
(141) Zhang, X.; Ye, X.; Guo, B.; Finneran, K. T.; Zilles, J. L.; Morgenroth, E. Lignocellulosic Hydrolysates and Extracellular Electron Shuttles for H2 Production Using Co-Culture Fermentation with Clostridium Beijerinckii and Geobacter Metallireducens. Bioresour. Technol. 2013, 147, 89–95.
(142) Qureshi, N.; Bowman, M. J.; Saha, B. C.; Hector, R.; Berhow, M. A.; Cotta, M. A. Effect of Cellulosic Sugar Degradation Products (Furfural and Hydroxymethyl Furfural) on Acetone–butanol–ethanol (ABE) Fermentation Using Clostridium Beijerinckii P260. Food Bioprod. Process. 2012, 90 (3), 533–540.
(143) Zhang, Y.; Han, B.; Ezeji, T. C. Biotransformation of Furfural and 5-Hydroxymethyl Furfural (HMF) by Clostridium Acetobutylicum ATCC 824 during Butanol Fermentation. New Biotechnol. 2012, 29 (3), 345–351.
(144) Oh, S.-E.; Zuo, Y.; Zhang, H.; Guiltinan, M. J.; Logan, B. E.; Regan, J. M. Hydrogen Production by Clostridium Acetobutylicum ATCC 824 and Megaplasmid-Deficient Mutant M5 Evaluated Using a Large Headspace Volume Technique. Int. J. Hydrog. Energy 2009, 34 (23), 9347–9353.
81
(145) Lee, S.-H.; Yun, E. J.; Kim, J.; Lee, S. J.; Um, Y.; Kim, K. H. Biomass, Strain Engineering, and Fermentation Processes for Butanol Production by Solventogenic Clostridia. Appl. Microbiol. Biotechnol. 2016.
(146) Dürre, P. Handbook on Clostridia; CRC press, 2005. (147) Prazmowski, A. Untersuchungen Über Die Entwickelungsgeschichte Und Fermentwirkung
Einiger Bacterien-Arten; H. Voigt, 1880. (148) Morris, J. G. History and Future Potential of the Clostridia in Biotechnology. Biotechnol. Ser.
1993, 1–1. (149) Dürre, P. From Pandora’s Box to Cornucopia: Clostridia—a Historical Perspective.
Clostridia—biotechnology Med. Appl. Wiley-VCH N. Y. NY 2001, 1–17. (150) McCord, J. M.; Keele, B. B.; Fridovich, I. An Enzyme-Based Theory of Obligate
Anaerobiosis: The Physiological Function of Superoxide Dismutase. Proc. Natl. Acad. Sci. 1971, 68 (5), 1024–1027.
(151) Assobhei, O.; Kanouni, A. E.; Ismaili, M.; Loutfi, M.; Petitdemange, H. Effect of Acetic and Butyric Acids on the Stability of Solvent and Spore Formation by Clostridium Acetobutylicum ATCC 824 during Repeated Subculturing. J. Ferment. Bioeng. 1998, 85 (2), 209–212.
(152) Yang, W.-W.; Crow-Willard, E. n.; Ponce, A. Production and Characterization of Pure Clostridium Spore Suspensions. J. Appl. Microbiol. 2009, 106 (1), 27–33.
(153) Al-Hinai, M. A.; Jones, S. W.; Papoutsakis, E. T. The Clostridium Sporulation Programs: Diversity and Preservation of Endospore Differentiation. Microbiol. Mol. Biol. Rev. 2015, 79 (1), 19–37.
(154) Doi, R. H.; Kosugi, A. Cellulosomes: Plant-Cell-Wall-Degrading Enzyme Complexes. Nat. Rev. Microbiol. 2004, 2 (7), 541–551.
(155) Guedon, E.; Desvaux, M.; Petitdemange, H. Kinetic Analysis of Clostridium CellulolyticumCarbohydrate Metabolism: Importance of Glucose 1-Phosphate and Glucose 6-Phosphate Branch Points for Distribution of Carbon Fluxes Inside and Outside Cells as Revealed by Steady-State Continuous Culture. J. Bacteriol. 2000, 182 (7), 2010–2017.
(156) Jones, D. T.; Keis, S. Origins and Relationships of Industrial Solvent-Producing Clostridial Strains. FEMS Microbiol. Rev. 1995, 17 (3), 223–232.
(157) Knowles, J. R. Enzyme-Catalyzed Phosphoryl Transfer Reactions. Annu. Rev. Biochem. 1980, 49 (1), 877–919.
(158) Gottschalk, G. Bacterial Metabolism; Springer Science & Business Media, 2012. (159) Li, X.; Li, Z.-G.; Shi, Z.-P. Metabolic Flux and Transcriptional Analysis Elucidate Higher
Butanol/Acetone Ratio Feature in ABE Extractive Fermentation by Clostridium Acetobutylicum Using Cassava Substrate. Bioresour. Bioprocess. 2014, 1, 13.
(160) Bahl, H.; Andersch, W.; Gottschalk, G. Continuous Production of Acetone and Butanol by <Emphasis Type="Italic">Clostridium Acetobutylicum</Emphasis> in a Two-Stage Phosphate Limited Chemostat. Eur. J. Appl. Microbiol. Biotechnol. 1982, 15 (4), 201–205.
(161) Girbal, L.; Croux, C.; Vasconcelos, I.; Soucaille, P. Regulation of Metabolic Shifts in Clostridium Acetobutylicum ATCC 824. FEMS Microbiol. Rev. 1995, 17, 287–297.
(162) Eurotherm; Schneider-electric. Fermentação http://www.eurothermltda.com.br/lifesciences/aplicacoes_ferment.htm (accessed Apr 24, 2018).
(163) Khanal, S. Biological Hydrogen Production: Effects of PH and Intermediate Products. Int. J. Hydrog. Energy 2003.
(164) Li, S.-Y.; Srivastava, R.; Suib, S. L.; Li, Y.; Parnas, R. S. Performance of Batch, Fed-Batch, and Continuous A–B–E Fermentation with PH-Control. Bioresour. Technol. 2011, 102 (5), 4241–4250.
(165) Jiang, W.; Wen, Z.; Wu, M.; Li, H.; Yang, J.; Lin, J.; Lin, Y.; Yang, L.; Cen, P. The Effect of PH Control on Acetone–Butanol–Ethanol Fermentation by Clostridium Acetobutylicum
82
ATCC 824 with Xylose and D-Glucose and d-Xylose Mixture. Chin. J. Chem. Eng. 2014, 22 (8), 937–942.
(166) Tsai, T.-Y.; Lo, Y.-C.; Chang, J.-S. Effect of Medium Composition and PH Control Strategies on Butanol Fermentation with Clostridium Acetobutylicum. Energy Procedia 2014, 61, 1691–1694.
(167) Zagrodnik, R.; Laniecki, M. The Role of PH Control on Biohydrogen Production by Single Stage Hybrid Dark- and Photo-Fermentation. Bioresour. Technol. 2015, 194, 187–195.
(168) Monot, F.; Engasser, J.-M.; Petitdemange, H. Influence of PH and Undissociated Butyric Acid on the Production of Acetone and Butanol in Batch Cultures of Clostridium Acetobutylicum. Appl. Microbiol. Biotechnol. 1984, 19 (6), 422–426.
(169) Grupe, H.; Gottschalk, G. Physiological Events in Clostridium Acetobutylicum during the Shift from Acidogenesis to Solventogenesis in Continuous Culture and Presentation of a Model for Shift Induction. Appl. Environ. Microbiol. 1992, 58 (12), 3896–3902.
(170) Monot, F.; Martin, J.-R.; Petitdemange, H.; Gay, R. Acetone and Butanol Production by Clostridium Acetobutylicum in a Synthetic Medium. Appl. Environ. Microbiol. 1982, 44 (6), 1318–1324.
(171) Ounine, K.; Petitdemange, H.; Raval, G.; Gay, R. Acetone-Butanol Production from Pentoses by Clostridium Acetobutylicum. Biotechnol. Lett. 1983, 5 (9), 605–610.
(172) Cook, G. M.; Janssen, P. H.; Morgan, H. W. Simultaneous Uptake and Utilisation of Glucose and Xylose by Clostridium Thermohydrosulfuricum. FEMS Microbiol. Lett. 1993, 109 (1), 55–61.
(173) Aristilde, L.; Lewis, I. A.; Park, J. O.; Rabinowitz, J. D. Hierarchy in Pentose Sugar Metabolism in Clostridium Acetobutylicum. Appl. Environ. Microbiol. 2015, 81 (4), 1452–1462.
(174) Raganati, F.; Olivieri, G.; Götz, P.; Marzocchella, A.; Salatino, P. Butanol Production from Hexoses and Pentoses by Fermentation of Clostridium Acetobutylicum. Anaerobe 2015, 34, 146–155.
(175) Monot, F. Etude de La Fermentation Acétonobutylique Sur Milieu Synthétique: 1) Influence Du Milieu Sur Le Métabolisme de Clostridium Acetobutylicum; 2) Cinétiques En Cultures Discontinues et Continues. PhD Thesis, 1983.
(176) Vollherbst-Schneck, K.; Sands, J. A.; Montenecourt, B. S. Effect of Butanol on Lipid Composition and Fluidity of Clostridium Acetobutylicum ATCC 824. Appl. Environ. Microbiol. 1984, 47 (1), 193–194.
(177) Bowles, L. K.; Ellefson, W. L. Effects of Butanol on Clostridium Acetobutylicum. Appl. Environ. Microbiol. 1985, 50 (5), 1165–1170.
(178) Izard, A.; Goma, G.; Soucaille, P. Effects of Various Alcoholic Supplements on the Growth Rate of Clostridium Acetobutylicum ATCC 824. Appl. Microbiol. Biotechnol. 1989, 31 (2), 179–183.
(179) Jain, M. K.; Gleeson, J.; Upreti, A.; Upreti, G. C. Intrinsic Perturbing Ability of Alkanols in Lipid Bilayers. Biochim. Biophys. Acta BBA-Biomembr. 1978, 509 (1), 1–8.
(180) Gu, Y.; Jiang, Y.; Yang, S.; Jiang, W. Utilization of Economical Substrate-Derived Carbohydrates by Solventogenic Clostridia: Pathway Dissection, Regulation and Engineering. Curr. Opin. Biotechnol. 2014, 29, 124–131.
(181) Yu, Y.; Lou, X.; Wu, H. Some Recent Advances in Hydrolysis of Biomass in Hot-Compressed Water and Its Comparisons with Other Hydrolysis Methods. Energy Fuels 2008, 22 (1), 46–60.
(182) Shi, N.; Liu, Q.; Wang, T.; Ma, L.; Zhang, Q.; Zhang, Q. One-Pot Degradation of Cellulose into Furfural Compounds in Hot Compressed Steam with Dihydric Phosphates. ACS Sustain. Chem. Eng. 2014, 2 (4), 637–642.
(183) Zheng, A.; Chen, T.; Sun, J.; Jiang, L.; Wu, J.; Zhao, Z.; Huang, Z.; Zhao, K.; Wei, G.; He, F.; et al. Toward Fast Pyrolysis-Based Biorefinery: Selective Production of Platform Chemicals
83
from Biomass by Organosolv Fractionation Coupled with Fast Pyrolysis. ACS Sustain. Chem. Eng. 2017, 5 (8), 6507–6516.
(184) Zhuang, X.; Zhang, H. Identification, Characterization of Levoglucosan Kinase, and Cloning and Expression of Levoglucosan Kinase CDNA from Aspergillus Niger CBX-209 in Escherichia Coli. Protein Expr. Purif. 2002, 26 (1), 71–81.
(185) Kitamura, Y.; Abe, Y.; Yasui, T. Metabolism of Levoglucosan (1, 6-Anhydro-α-d-Glucopyranose) in Microorganisms. Agric. Biol. Chem. 1991, 55 (2), 515–521.
(186) Lian, J.; Garcia-Perez, M.; Chen, S. Fermentation of Levoglucosan with Oleaginous Yeasts for Lipid Production. Bioresour. Technol. 2013, 133, 183–189.
(187) Layton, D. S.; Ajjarapu, A.; Choi, D. W.; Jarboe, L. R. Engineering Ethanologenic Escherichia Coli for Levoglucosan Utilization. Bioresour. Technol. 2011, 102 (17), 8318–8322.
(188) Bacik, J.-P.; Klesmith, J. R.; Whitehead, T. A.; Jarboe, L. R.; Unkefer, C. J.; Mark, B. L.; Michalczyk, R. Producing Glucose 6-Phosphate from Cellulosic Biomass STRUCTURAL INSIGHTS INTO LEVOGLUCOSAN BIOCONVERSION. J. Biol. Chem. 2015, 290 (44), 26638–26648.
(189) Bacik, J.-P.; Jarboe, L. R. Bioconversion of Anhydrosugars: Emerging Concepts and Strategies. IUBMB Life 2016, 68 (9), 700–708.
(190) Linger, J. G.; Hobdey, S. E.; Franden, M. A.; Fulk, E. M.; Beckham, G. T. Conversion of Levoglucosan and Cellobiosan by Pseudomonas Putida KT2440. Metab. Eng. Commun. 2016, 3, 24–29.

84
85
B. RESULTS
The main results found during this PhD are presented as five articles in this section. They are
divided in three sub-sections: I) hydrothermal conversion of cellulosic materials, II) Biological
conversion of cellulose-derived products and III) Integration of thermochemical and biological
processes.
I. Hydrothermal conversion of cellulosic
materials
The results about hydrothermal conversion of cellulose are presented in the following two
articles. In the first one, hydrothermal liquefaction of microcrystalline cellulose was studied in a
relatively wide range of temperatures to characterize its effect on the reaction mechanisms and
to identify the best conditions for its depolymerization.
In the second article, lignocellulosic biomass was fractionated, by two methods: organosolv and
sodium chlorite/acetic acid (SC/AA), in order to recover cellulose-rich pulps. These pulps were
liquefied according to the conclusions of the precedent study on pure cellulose. The product
distribution and sugars produced were characterized.

86
The following article presents results to get a better understanding of the effect of temperature
and reaction time on the reaction mechanisms of cellulose liquefaction in hydrothermal media,
under our conditions (in a batch reactor). Moreover, most of the analytical methods required for
the characterization of products during this PhD were developed during this study case.
1. Article 1:
Decomposition of cellulose in hot-compressed
water: detailed analysis of the products and effect
of operating conditions
Article published in Energy & Fuels. DOI: 10.1021/acs.energyfuels.7b02994
ABSTRACT
Understanding the reaction pathways of cellulose hydrolysis in hot-compressed water (HCW) is
crucial for the optimization of fermentable sugars and chemicals production. Advanced
analytical strategies are required in order to better assess the wide range of products from
cellulose conversion in HCW. In this work, cellulose conversion in HCW was conducted in an
autoclave with sampling upon the reaction time under isothermal conditions (180°C, 220°C,
260°C, 0 to 120 min). Total water-soluble carbohydrates were quantified (phenol/sulfuric acid
method). These products were first characterized by size exclusion chromatography coupled to
mass spectrometry and evaporative light scattering detector (SEC-ELSD-MS). SEC is useful for
screening the molecular weight distribution of soluble products. Then the chemical structure of
water solubles has been attributed by hydrophilic interaction liquid chromatography coupled to
a linear trap quadrupole Orbitrap mass spectrometer (HILIC-LTQ-Orbitrap-MS). This method
notably evidences the formation of a cellobiose conformer under some HCW conditions. A
87
specific high performance anion exchange chromatography with pulsed amperometric detection
(HPAEC-PAD) method has been developed. This method allows for a selective separation of 5-
hydroxy-methyl-furfural (5-HMF), glucose, fructose, mannose and oligomers up to
cellopentaose. Carboxylic acids were quantified by high performance liquid chromatography
with ultraviolet detection (HPLC-UV). Solid residues obtained after HCW conversion were
characterized by X-ray diffraction (XRD) and permanent gas by micro-gas chromatography. The
global reaction mechanism of cellulose liquefaction in HCW is rationalized based on these
complementary methods. Cellulose conversion first proceeds with heterogeneous hydrolysis
(fiber surface) to produce soluble oligomers in competition with pyrolysis (inner fibers with
limited mass transfer of water) producing levoglucosan (promoted at higher temperature).
Soluble oligomers produce glucose and isomers by homogeneous hydrolysis (liquid phase). C6
sugars can then undergo further conversion to produce notably 5HMF and erythrose.
1.1. Introduction
The depletion of fossil fuels represents one of the major concerns of our society. Moreover, their
use produces high quantities of carbon dioxide emissions that are the main factor in the global
warming. As a consequence, bio-fuels are developed in order to replace fossil fuels. Bioethanol is
mainly produced from carbohydrates rich materials (sugarcane, sugar beet, maize) that are
normally used for food production. This represents a controversy problem to society.(Berndes,
Hoogwijk, and van den Broek 2003) Lignocellulosic biomass (wood, straw…) is a promising
source of renewable carbon that does not compete with food production. It could be processed
into second generation biofuels.(McKendry 2002; Briens, Piskorz, and Berruti 2008) This resource
is composed mainly of cellulose (40-60 wt. %), hemicelluloses (20-40 wt. %) and lignin (15-25 wt.
%) tightly bonded in a complex matrix.(Henricson 2000; Schweingruber 2007; Salmén 2015)
Cellulose is the most abundant polymer on earth and its valorization to produce biofuels or
chemical is widely studied.
88
Cellulose can be depolymerized into glucose and soluble oligosaccharides by a wide variety of
technologies. Acid hydrolysis was developed to obtain glucose from cellulose. Several methods
and technologies have been studied, reporting that high sugar yields and low reaction times can
be achieved with strong acid media and high temperatures.(Torget, Kim, and Lee 2000; Neureiter
et al. 2002; Rinaldi and Schüth 2009; Jiang et al. 2015) Cellulose can also be depolymerized into
levoglucosan and other anhydro-oligosaccharides with high yields by fast pyrolysis.(Piskorz et
al. 2000; Lédé, Blanchard, and Boutin 2002; Lédé 2012; Jia et al. 2016; Garcia-Nunez et al. 2017)
The main drawback is that these anhydro-saccharides need to be hydrolyzed into saccharides in
order to be suitable for fermentation, that allows to transform them into biofuels and other
chemical products of interest.(Bennett, Helle, and Duff 2009) Different hydrothermal treatment
technologies for cellulose/biomass have been developed. The operating conditions have a strong
effect on water properties.(Toor, Rosendahl, and Rudolf 2011) The ionization of water (H2O) into
OH- and H3O+ increases with temperature allowing the water to become the acid catalyst for
cellulose hydrolysis. That is why the solvation power is different, and water at high temperatures
near the critical point can dissolve organic compounds, unlike the ambient temperature water
that will only dissolve the polar compounds.(Peterson et al. 2008; Kumar and Gupta 2009)
Supercritical water treatment ensures a fast solubilisation of cellulose and a subsequent
hydrolysis of the primary products into simple molecules.(Sasaki et al. 1998, 2000; Tolonen et al.
2015) Nevertheless, working with supercritical water will increase considerably both the
operational and reactor cost.(Sasaki et al. 1998; Yu and Wu 2010b; Abdullah, Ueda, and Saka 2014)
Supercritical water is highly corrosive and expensive materials will be needed for the reaction
system. This is because of the high concentration of acidic hydroniums H3O+ generate by the
autoionization of water at this temperature.(Peterson et al. 2008) Another alternative technology
is liquefaction in hot-compressed water (subcritical conditions), that normally operates at
conditions between 150-300ᵒC at around 10 MPa. Even if water at these conditions has a reactivity
that is considerably lower than at supercritical conditions, this technology presents an interesting
89
alternative to perform cellulose depolymerization into profitable carbohydrates for subsequent
fermentation into biofuels and/or chemicals.(Matsumura et al. 2006; Yu, Lou, and Wu 2008)
Significant progress has been made in cellulose/lignocellulose pretreatment by hot-compressed
water (HCW). Several reaction systems in continuous,(Sasaki et al. 1998, 2000; Ehara and Saka
2002) semi-continuous(Yu and Wu 2009; Sasaki, Furukawa, et al. 2002; Matsunaga et al. 2008) and
batch(Ehara and Saka 2002; Kumar and Gupta 2009) mode have been developed.
Cellulose hydrolysis products are often characterized by HPLC methods using conventional ion-
exchange or aqueous size exclusion columns that allow the separation of monomers but not
oligomers.(Sasaki et al. 1998; Kabyemela et al. 1999; Sasaki et al. 2000) High-performance anion-
exchange chromatography with pulsed amperometric detection (HPAEC-PAD) have been
studied and used as a powerful tool for the analysis of carbohydrates.(Townsend et al. 1988; Lee
1990; Paskach et al. 1991; Rohrer and Townsend 1995) Several methods have been developed
according to the targeted compounds and now is currently the most common and efficient
analytical method for the quantification of cellulose derived compounds.(Yu and Wu 2009, 2010b;
Corradini, Cavazza, and Bignardi 2012; Tolonen et al. 2013; Yu, Shafie, and Wu 2013; Cao et al.
2016) Yu et al.(Yu et al. 2016) and Tolonen et. al(Tolonen et al. 2015) have developed interesting
methods coupling HPAEC-PAD with mass spectrometry (MS), allowing the identification of
isomers and cellulose derived compounds with a high degree of polymerization, for which there
is no standard available in the current market. MALDI-TOF is commonly used for the analysis of
molecules with a high molecular weight.(Mechref, Novotny, and Krishnan 2003; Ren et al. 2005)
An accurate and comprehensive analysis of liquid products is fundamental for the understanding
of the reaction mechanisms of cellulose decomposition in HCW. In the same way, the latter is
fundamental for improving efficiency of this technology. Sasaki et al.(Sasaki et al. 1998, 2000;
Sasaki, Furukawa, et al. 2002; Sasaki, Goto, et al. 2002; Sasaki, Adschiri, and Arai 2004) have
intensively studied the hydrolysis of cellulose in HCW. These studies concluded that cellulose
depolymerization follows two major reaction pathways: 1) dehydration of reducing-end glucose
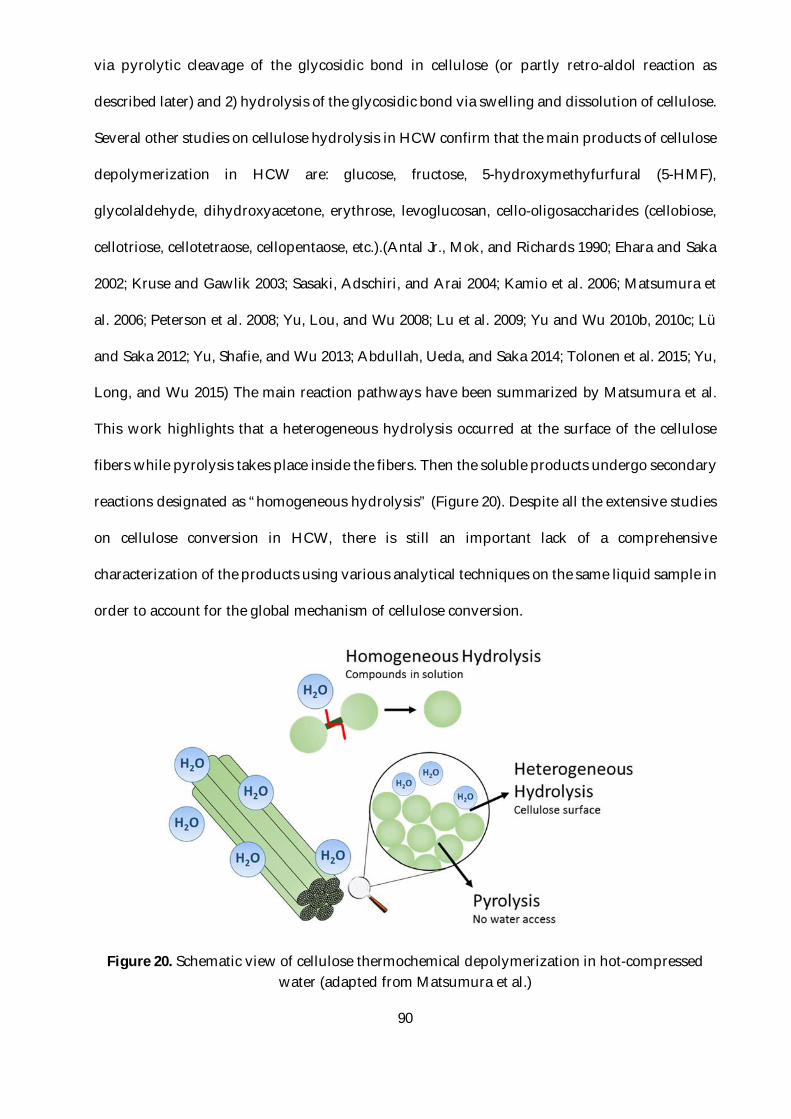
90
via pyrolytic cleavage of the glycosidic bond in cellulose (or partly retro-aldol reaction as
described later) and 2) hydrolysis of the glycosidic bond via swelling and dissolution of cellulose.
Several other studies on cellulose hydrolysis in HCW confirm that the main products of cellulose
depolymerization in HCW are: glucose, fructose, 5-hydroxymethyfurfural (5-HMF),
glycolaldehyde, dihydroxyacetone, erythrose, levoglucosan, cello-oligosaccharides (cellobiose,
cellotriose, cellotetraose, cellopentaose, etc.).(Antal Jr., Mok, and Richards 1990; Ehara and Saka
2002; Kruse and Gawlik 2003; Sasaki, Adschiri, and Arai 2004; Kamio et al. 2006; Matsumura et
al. 2006; Peterson et al. 2008; Yu, Lou, and Wu 2008; Lu et al. 2009; Yu and Wu 2010b, 2010c; Lü
and Saka 2012; Yu, Shafie, and Wu 2013; Abdullah, Ueda, and Saka 2014; Tolonen et al. 2015; Yu,
Long, and Wu 2015) The main reaction pathways have been summarized by Matsumura et al.
This work highlights that a heterogeneous hydrolysis occurred at the surface of the cellulose
fibers while pyrolysis takes place inside the fibers. Then the soluble products undergo secondary
reactions designated as “homogeneous hydrolysis” (Figure 20). Despite all the extensive studies
on cellulose conversion in HCW, there is still an important lack of a comprehensive
characterization of the products using various analytical techniques on the same liquid sample in
order to account for the global mechanism of cellulose conversion.
Figure 20. Schematic view of cellulose thermochemical depolymerization in hot-compressed water (adapted from Matsumura et al.)
91
The last two decades have witness important advances in analytical chemistry that can be used
as a powerful tool in the characterization of cellulose hydrolysis products. In this work, an
advanced methodology is proposed in order to characterize the products from cellulose
conversion in HCW. Solid, liquid (water-soluble compounds) and gaseous products were
recovered to determine the mass balance. Liquids were characterized for the first time by a
combination of:
1) Size exclusion chromatography with evaporative light scattering detection and mass
spectrometry (SEC-ELSD-MS) for assessing the distribution of molecular weight of
species soluble in water;
2) Hydrophilic interaction liquid chromatography with linear trap quadrupole Orbitrap
mass spectrometry (HILIC-LTQ-Orbitrap MS) for identifying the chemical structure of
some important products (a cellobiose isomer has been identified);
3) A specific high-performance anion exchange chromatography with pulsed amperometric
detection (HPAEC-PAD) method. This HPAEC-PAD method allows the characterization
of both monomeric and oligomeric saccharides and is able to discriminate glucose isomers
(mannose and fructose) and 5-hydroxymethyfurfural that often escape detection or are
poorly quantified with regular chromatographic methods.
The predominant products and reactions as evidenced by all these complementary methods are
discussed. This work provides a better understanding of the evolution of the products of cellulose
liquefaction in HCW as a function of temperature and reaction time.
1.2. Materials and Methods
1.2.1. Reactants
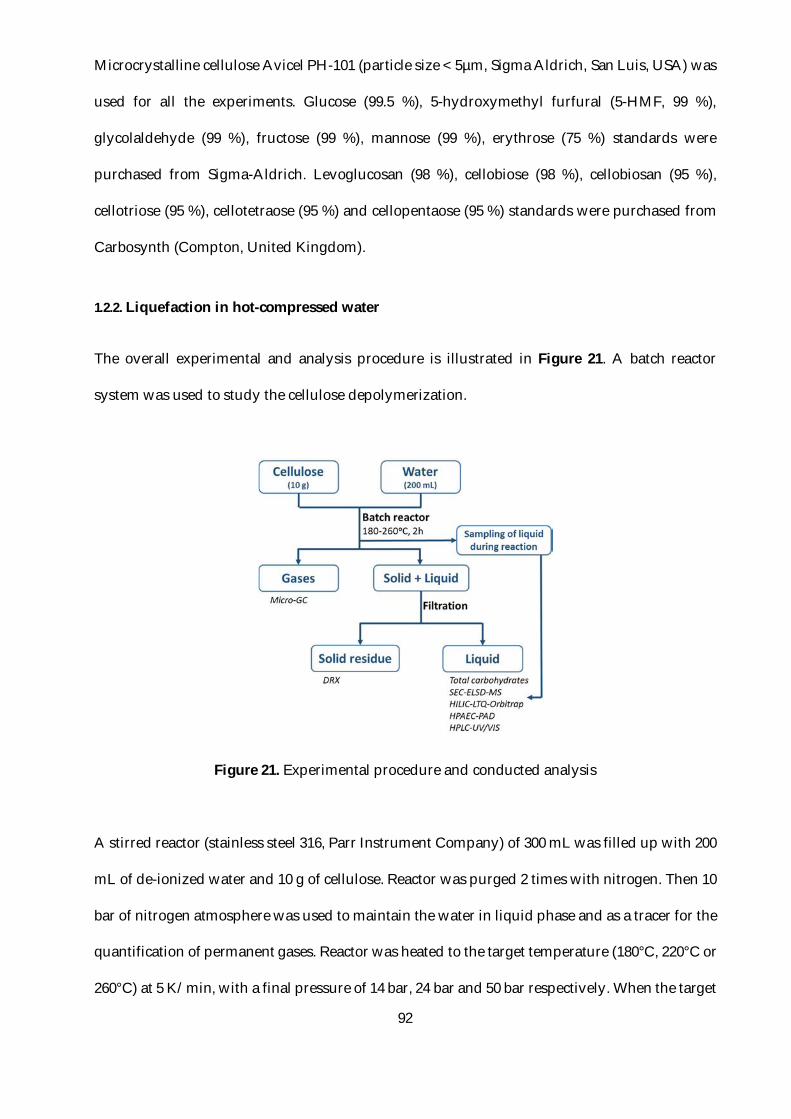
92
Microcrystalline cellulose Avicel PH-101 (particle size < 5µm, Sigma Aldrich, San Luis, USA) was
used for all the experiments. Glucose (99.5 %), 5-hydroxymethyl furfural (5-HMF, 99 %),
glycolaldehyde (99 %), fructose (99 %), mannose (99 %), erythrose (75 %) standards were
purchased from Sigma-Aldrich. Levoglucosan (98 %), cellobiose (98 %), cellobiosan (95 %),
cellotriose (95 %), cellotetraose (95 %) and cellopentaose (95 %) standards were purchased from
Carbosynth (Compton, United Kingdom).
1.2.2. Liquefaction in hot-compressed water
The overall experimental and analysis procedure is illustrated in Figure 21. A batch reactor
system was used to study the cellulose depolymerization.
Figure 21. Experimental procedure and conducted analysis
A stirred reactor (stainless steel 316, Parr Instrument Company) of 300 mL was filled up with 200
mL of de-ionized water and 10 g of cellulose. Reactor was purged 2 times with nitrogen. Then 10
bar of nitrogen atmosphere was used to maintain the water in liquid phase and as a tracer for the
quantification of permanent gases. Reactor was heated to the target temperature (180°C, 220°C or
260°C) at 5 K/min, with a final pressure of 14 bar, 24 bar and 50 bar respectively. When the target
93
temperature was reached, reaction time started and 7 samples were taken every 20 min for the
liquid phase analysis (from initial time to 120min). The sample volume was 3 mL. 2 purges were
first sampled followed by the sample for further analysis (leading to 9 mL of total sampled
volume per sampling). The sampling of this small volume does not impact the pressure and
temperature inside the autoclave (pressure and temperature constant within 1bar and 3ᵒC
respectively thorough the test). At the end of each experiment (2h), the reactor was rapidly
quenched (with cold water) to ambient temperature (3-4min.). Specific experiments were
conducted without sampling in order to quantify mass balances.
The solid/liquid mixture was filtered using a glass microfiber filter (Whatman®, pore size: 0.7
µm) with a Büchner under vacuum suction. The solid residue was washed with de-ionized water
and subsequently dried at 105ᵒC for 24h. Then it was cool down in a desiccator to be weighted
and it was finally stored for further XRD analysis. The recovered liquid was immediately
analyzed by liquid chromatography and total carbohydrates determination. Then it was stored
in a freezer at -80ᵒC. Once the liquid is completely frozen, the water was removed by freeze drying
at -40ᵒC, <0.04 mbar for 24 h. The solid residue was weighted and defined as the “total water-
solubles”. Analysis by liquid chromatography has been conducted before and after freeze drying
to verify that there was no significant change in the composition of soluble products.
1.2.3. Analysis of the crystalline structure of solid residues by XRD
The washed and dried solid residues have been manually crushed (with a mortar) to be analyzed
by XRD analysis. XRD has been performed using an INEL XRG-3000. This X-ray diffractometer
uses a copper radiation (CuKα) having wavelength λ (Kα1) =1.5406 nm generated at 30 kV and
25 mA. The diffraction intensities were measured in a range of 0 to 82ᵒ (2θ) using a step size of
0.029ᵒ. This analysis allows determining if the solid is amorphous or crystalline (crystallinity
index) and also allows characterizing changes in the crystalline structure of solid residues.
Crystallinity index (CI) values were calculated for each solid as the ratio between the height of
94
the (002) reflection peak and the minimum between the (021) and (10Ῑ) reflection peaks,
corresponding to 2θ=18.9° (Park et al. 2010).
1.2.4. Soluble products analysis
a) Total carbohydrates determination
The total carbohydrates (sugars) determination was performed as in Rover et al.(Rover et al. 2013)
using the phenol/sulfuric acid assay (DuBois et al. 1956). The absorbance was measured in a
spectrophotometer MultikanTM GO (Thermo Scientific™) at 490 nm. Glucose was used to
determine the calibration curves and the total carbohydrates were calculated as glucose-
equivalent. Total non-sugar compounds were calculated as the difference between total water-
solubles (weighted after lyophilisation) and total carbohydrates.
b) Analysis of the molecular weight distribution of soluble products by SEC-
ELSD-MS
The separation of soluble products was performed with two SEC PL aquagel-OH 20 columns
(Agilent) using 0.4 mL/min of a methanol/water (50:50 v/v) mixture as mobile phase.
Ammonium acetate (100 µM) and formic acid (0.1%) were also added to the mobile phase in order
to improve ionization (Le Brech et al. 2016). The oven containing the columns was kept at 40ᵒC.
The system was equipped with an evaporative light scattering detector (ELSD, Shimadzu) and
mass spectrometry (MS, Shimadzu), using an electrospray ionization (ESI) system.
c) Analysis of the chemical structure of main carbohydrates by HILIC-LTQ-
Orbitrap-MS
The separation was made using a hydrophilic interaction liquid chromatography (HILIC) column
(YMC-Pack Polyamine II (250mm×4.6mm) composed of a polymeric support (silica base) with
mixed secondary and tertiary amino derivative (particles size are 5µm and pores size are 12 nm).
95
The pre-column is a 7.5mm×4.6mm cartridge. Both were obtained from YMC Europe GmbH
(Dinslaken, DE). This analytical method was previous develop by Ricochon et al.(Ricochon et al.
2011) for the analysis of mono- and disaccharides. In this work, its selective ionization for
carbohydrates, without the interference of aldehydes, was confirmed.
The HILIC is coupled to a hybrid system of mass spectrometry consisting in a linear ion trap mass
spectrometer with an Orbitrap analyzer (LTQ-Orbitrap, Thermo Electron Corporation, Waltham,
MA, USA). LTQ is equipped with an atmospheric pressure chemical ionization (APCI) interface
operating in negative ion mode. Xcalibur 2.0 SR2 software is used for computer control and data
process. For this study, the detection was performed in SIM mode.
d) Quantification of main soluble products by HPAEC-PAD
Soluble products were quantified by high performance anion exchange chromatography with
pulsed amperometric detection (HPAEC-PAD). All the major compounds were identified and
quantified using the respective calibration curve for each compound. The column used was a
CarboPacPA100. A CarboPacPA10 was also tested but no satisfactory results were found. The
HPLC system is equipped with a quaternary solvent delivery pump. Two solvents were used in
this analysis: de-ionized water (A) and a 100 mM sodium hydroxide solution (B). The method
uses a gradient program as follow: 5 min of stabilization at 25% B, then from 0 to 5 min 25% B,
from 5 to10 min a gradient from 25 to 100% of B and from 10 to 25 min 100% B.
e) Analysis of carboxylic acids by HPLC-UV
Carboxylic acids were analyzed by HPLC-UV using an Aminex HPX-87H column (Biorad®). The
detection was made using an ultraviolet (UV) detector at 254 nm. This wavelength has been
proven to be specifically sensitive for carboxylic acids. The injection volume was 10 µL. The oven
kept the column at 45ᵒC, the mobile phase was a 25mM sulfuric acid (H2SO4) solution. The
analysis time was 30 min in isocratic mode. Chromatograms are shown in Figure S6 (supporting
information).
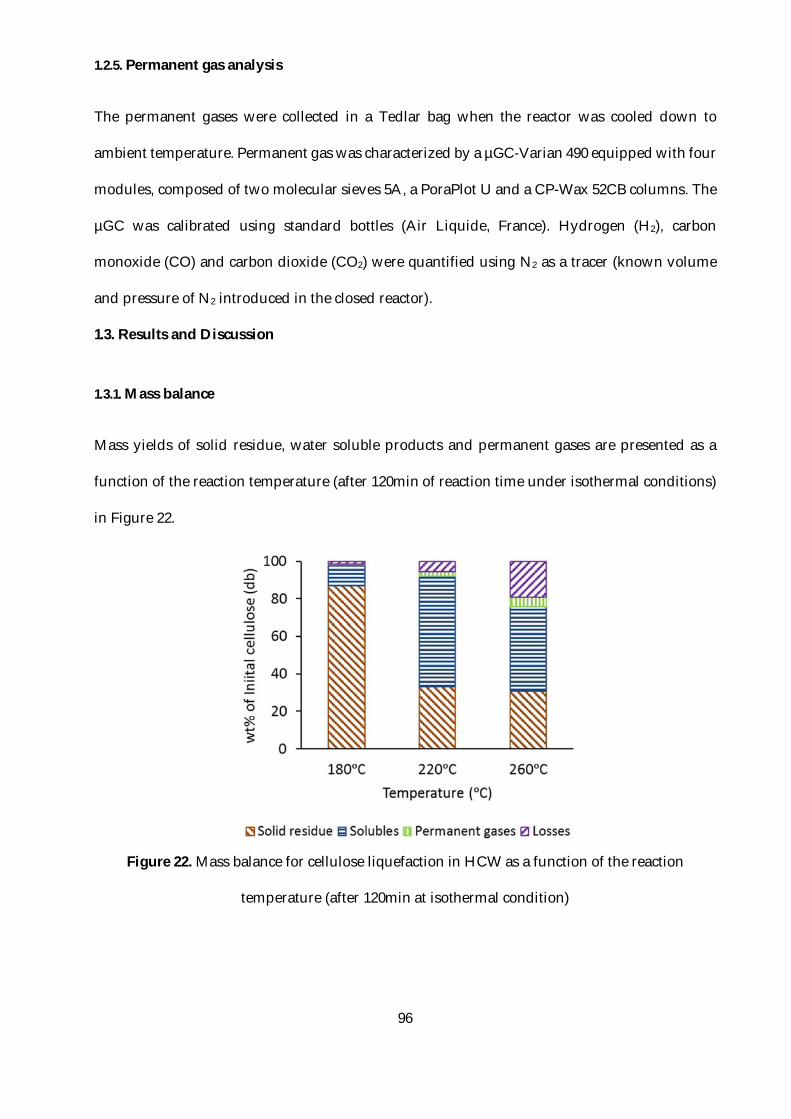
96
1.2.5. Permanent gas analysis
The permanent gases were collected in a Tedlar bag when the reactor was cooled down to
ambient temperature. Permanent gas was characterized by a µGC-Varian 490 equipped with four
modules, composed of two molecular sieves 5A, a PoraPlot U and a CP-Wax 52CB columns. The
µGC was calibrated using standard bottles (Air Liquide, France). Hydrogen (H2), carbon
monoxide (CO) and carbon dioxide (CO2) were quantified using N2 as a tracer (known volume
and pressure of N2 introduced in the closed reactor).
1.3. Results and Discussion
1.3.1. Mass balance
Mass yields of solid residue, water soluble products and permanent gases are presented as a
function of the reaction temperature (after 120min of reaction time under isothermal conditions)
in Figure 22.
Figure 22. Mass balance for cellulose liquefaction in HCW as a function of the reaction
temperature (after 120min at isothermal condition)
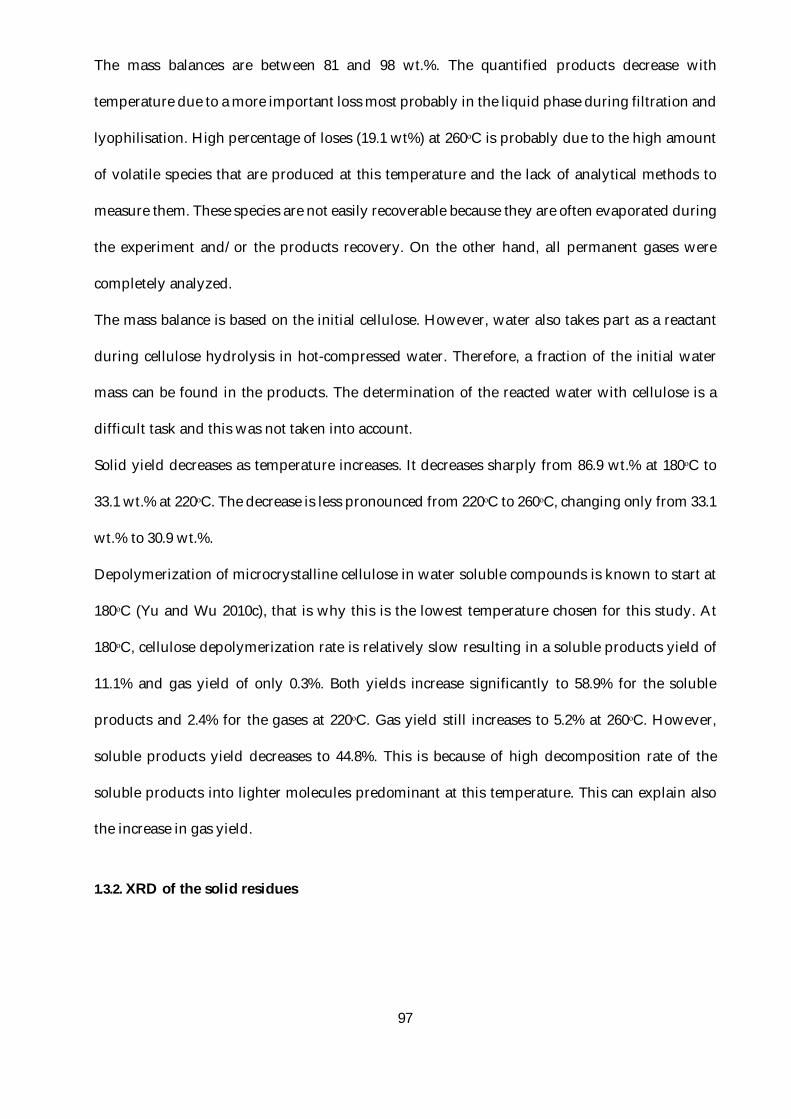
97
The mass balances are between 81 and 98 wt.%. The quantified products decrease with
temperature due to a more important loss most probably in the liquid phase during filtration and
lyophilisation. High percentage of loses (19.1 wt%) at 260ᵒC is probably due to the high amount
of volatile species that are produced at this temperature and the lack of analytical methods to
measure them. These species are not easily recoverable because they are often evaporated during
the experiment and/or the products recovery. On the other hand, all permanent gases were
completely analyzed.
The mass balance is based on the initial cellulose. However, water also takes part as a reactant
during cellulose hydrolysis in hot-compressed water. Therefore, a fraction of the initial water
mass can be found in the products. The determination of the reacted water with cellulose is a
difficult task and this was not taken into account.
Solid yield decreases as temperature increases. It decreases sharply from 86.9 wt.% at 180ᵒC to
33.1 wt.% at 220ᵒC. The decrease is less pronounced from 220ᵒC to 260ᵒC, changing only from 33.1
wt.% to 30.9 wt.%.
Depolymerization of microcrystalline cellulose in water soluble compounds is known to start at
180ᵒC (Yu and Wu 2010c), that is why this is the lowest temperature chosen for this study. At
180ᵒC, cellulose depolymerization rate is relatively slow resulting in a soluble products yield of
11.1% and gas yield of only 0.3%. Both yields increase significantly to 58.9% for the soluble
products and 2.4% for the gases at 220ᵒC. Gas yield still increases to 5.2% at 260ᵒC. However,
soluble products yield decreases to 44.8%. This is because of high decomposition rate of the
soluble products into lighter molecules predominant at this temperature. This can explain also
the increase in gas yield.
1.3.2. XRD of the solid residues
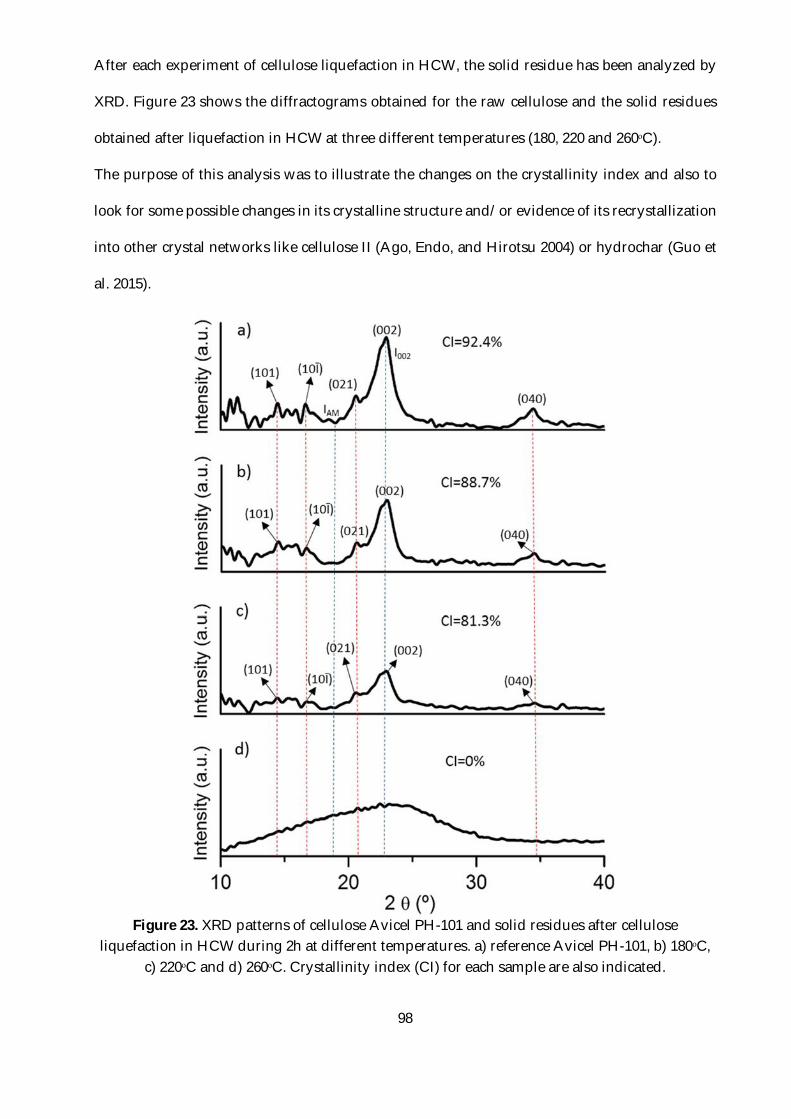
98
After each experiment of cellulose liquefaction in HCW, the solid residue has been analyzed by
XRD. Figure 23 shows the diffractograms obtained for the raw cellulose and the solid residues
obtained after liquefaction in HCW at three different temperatures (180, 220 and 260ᵒC).
The purpose of this analysis was to illustrate the changes on the crystallinity index and also to
look for some possible changes in its crystalline structure and/or evidence of its recrystallization
into other crystal networks like cellulose II (Ago, Endo, and Hirotsu 2004) or hydrochar (Guo et
al. 2015).
Figure 23. XRD patterns of cellulose Avicel PH-101 and solid residues after cellulose
liquefaction in HCW during 2h at different temperatures. a) reference Avicel PH-101, b) 180ᵒC, c) 220ᵒC and d) 260ᵒC. Crystallinity index (CI) for each sample are also indicated.
99
The crystallinity index (CI) for the Avicel cellulose was 92%, that is in agreement with the value
of 91% found in (Park et al. 2010). The CI values determined for the solid residues after cellulose
liquefaction in HCW were 91, 84 and 0 for the temperatures 180, 220 and 260ᵒC respectively. These
results indicate that at temperatures lower than 220ᵒC it is still possible to recover a cellulosic
material from the liquefaction process. Nonetheless, at 260ᵒC its structure presents no crystalline
phases. CI values calculated for the other reflection peaks (always relative to IAM) are shown in
Table 1.
Table 8. Crystallinity index (%) for all the reflection peaks of crystalline cellulose. Calculated
relative to IAM and for λ (Kα1)=1.5406 Reflection Angle Spacing Temperature
peak 2θ (ᵒ) d (Å) Untreated 180ᵒC 220ᵒC 260ᵒC (002) 22.7 3.9 92 89 81 0 (101) 14.4 6.1 76 68 66 0 (10Ῑ) 16.6 5.3 75 61 60 0 (040) 34.5 2.6 79 72 59 0 (021) 20 4.4 66 56 1 0
The Figure 23a shows the typical XRD pattern of raw cellulose (Avicel PH-101) indicating the
characteristics reflections that serve as guide to identify changes in the crystalline structure.
Cellulose residue after treatment in HCW at 180ᵒC presented a crystalline structure that remained
relatively unchanged in comparison to the raw Avicel cellulose. However, the reduction in the
intensity of the reflection (002) makes more evident another nearby peak at 2θ=22.4°. This peak
becomes more detectable as the reaction temperature increases from 180 to 220ᵒC (Figure 23b-
c).This is a slight change in the regular pattern of Avicel cellulose but it is an interesting proof of
some change in the crystalline structure of the initial cellulose. Moreover, the reflection (040) is
barely recognizable, showing that during hydrolysis in HCW at this temperature the whole
crystalline structure has been affected without being completely converted to an amorphous
material.
The X-ray diffraction pattern at 260ᵒC does not depict a pronounced crystalline phase (Figure
23d). The presence of a big broad peak is characteristic of the amorphous carbonaceous structure
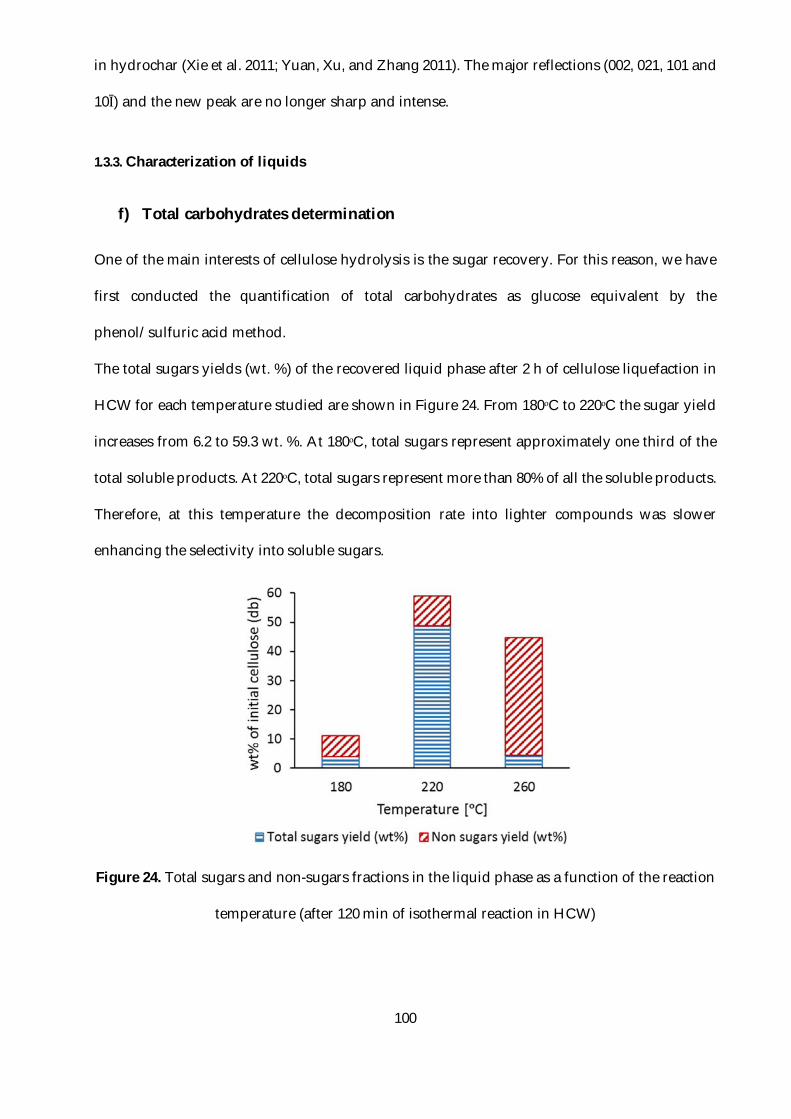
100
in hydrochar (Xie et al. 2011; Yuan, Xu, and Zhang 2011). The major reflections (002, 021, 101 and
10Ῑ) and the new peak are no longer sharp and intense.
1.3.3. Characterization of liquids
f) Total carbohydrates determination
One of the main interests of cellulose hydrolysis is the sugar recovery. For this reason, we have
first conducted the quantification of total carbohydrates as glucose equivalent by the
phenol/sulfuric acid method.
The total sugars yields (wt. %) of the recovered liquid phase after 2 h of cellulose liquefaction in
HCW for each temperature studied are shown in Figure 24. From 180ᵒC to 220ᵒC the sugar yield
increases from 6.2 to 59.3 wt. %. At 180ᵒC, total sugars represent approximately one third of the
total soluble products. At 220ᵒC, total sugars represent more than 80% of all the soluble products.
Therefore, at this temperature the decomposition rate into lighter compounds was slower
enhancing the selectivity into soluble sugars.
Figure 24. Total sugars and non-sugars fractions in the liquid phase as a function of the reaction
temperature (after 120 min of isothermal reaction in HCW)
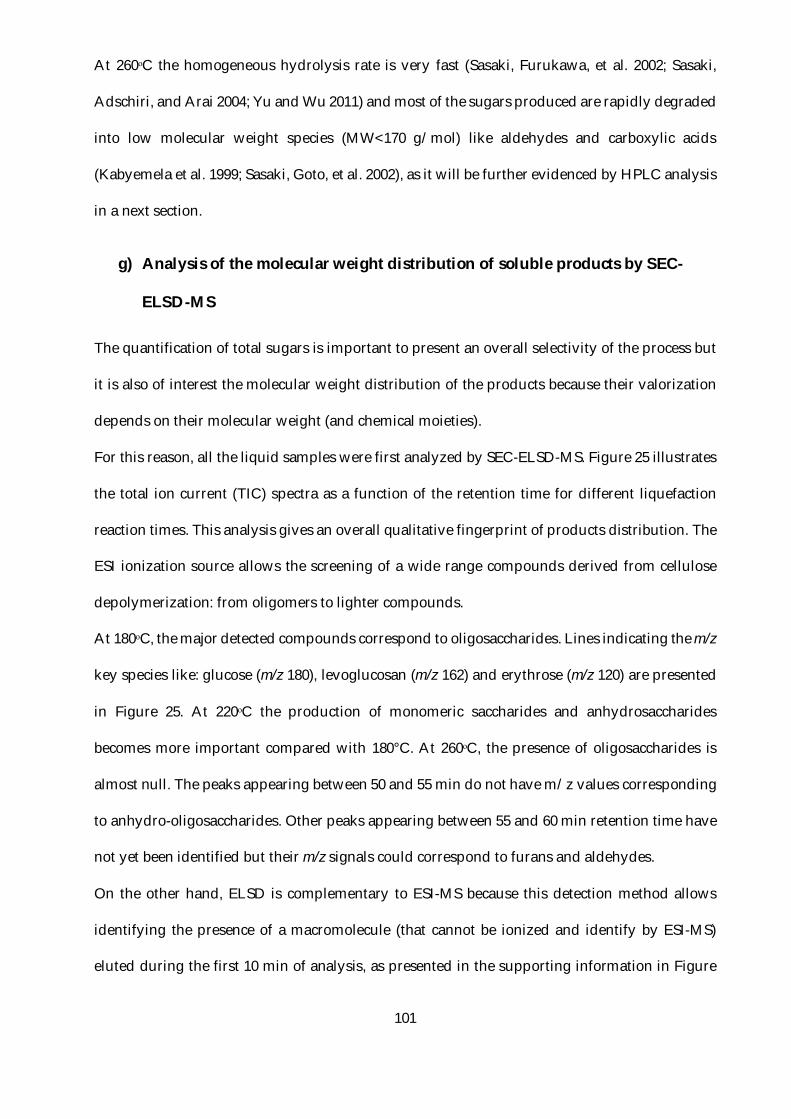
101
At 260ᵒC the homogeneous hydrolysis rate is very fast (Sasaki, Furukawa, et al. 2002; Sasaki,
Adschiri, and Arai 2004; Yu and Wu 2011) and most of the sugars produced are rapidly degraded
into low molecular weight species (MW<170 g/mol) like aldehydes and carboxylic acids
(Kabyemela et al. 1999; Sasaki, Goto, et al. 2002), as it will be further evidenced by HPLC analysis
in a next section.
g) Analysis of the molecular weight distribution of soluble products by SEC-
ELSD-MS
The quantification of total sugars is important to present an overall selectivity of the process but
it is also of interest the molecular weight distribution of the products because their valorization
depends on their molecular weight (and chemical moieties).
For this reason, all the liquid samples were first analyzed by SEC-ELSD-MS. Figure 25 illustrates
the total ion current (TIC) spectra as a function of the retention time for different liquefaction
reaction times. This analysis gives an overall qualitative fingerprint of products distribution. The
ESI ionization source allows the screening of a wide range compounds derived from cellulose
depolymerization: from oligomers to lighter compounds.
At 180ᵒC, the major detected compounds correspond to oligosaccharides. Lines indicating the m/z
key species like: glucose (m/z 180), levoglucosan (m/z 162) and erythrose (m/z 120) are presented
in Figure 25. At 220ᵒC the production of monomeric saccharides and anhydrosaccharides
becomes more important compared with 180°C. At 260ᵒC, the presence of oligosaccharides is
almost null. The peaks appearing between 50 and 55 min do not have m/z values corresponding
to anhydro-oligosaccharides. Other peaks appearing between 55 and 60 min retention time have
not yet been identified but their m/z signals could correspond to furans and aldehydes.
On the other hand, ELSD is complementary to ESI-MS because this detection method allows
identifying the presence of a macromolecule (that cannot be ionized and identify by ESI-MS)
eluted during the first 10 min of analysis, as presented in the supporting information in Figure
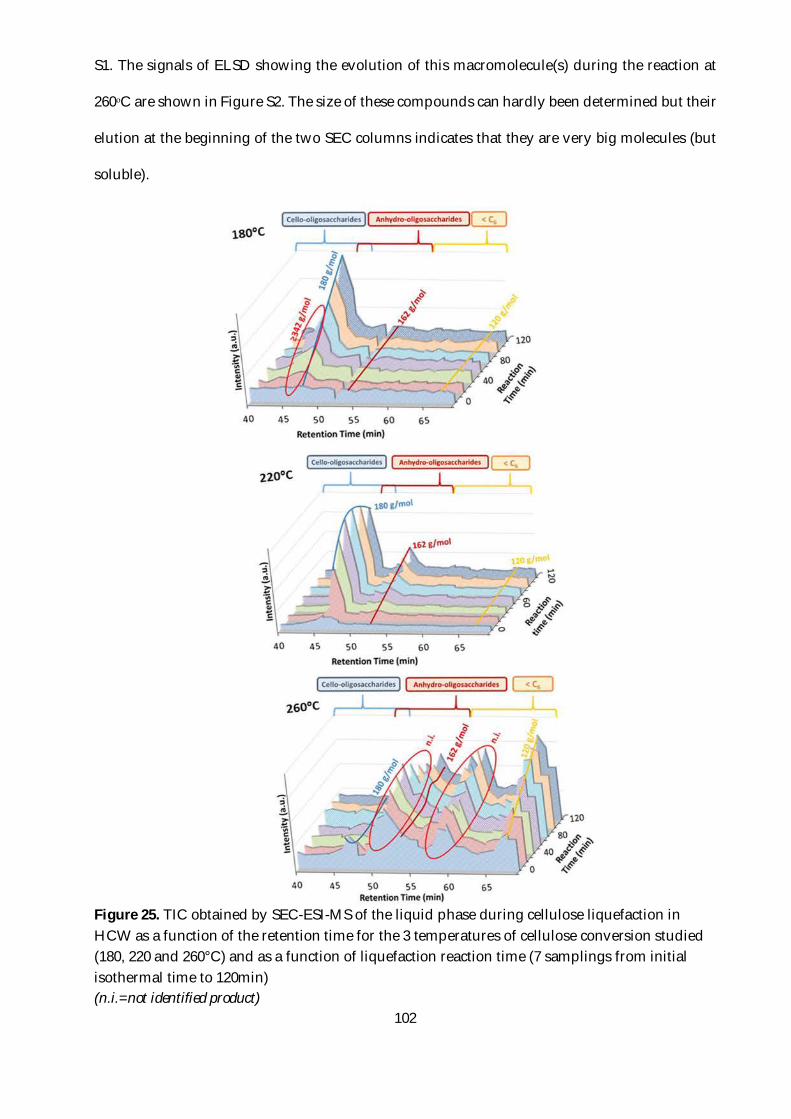
102
S1. The signals of ELSD showing the evolution of this macromolecule(s) during the reaction at
260ᵒC are shown in Figure S2. The size of these compounds can hardly been determined but their
elution at the beginning of the two SEC columns indicates that they are very big molecules (but
soluble).
Figure 25. TIC obtained by SEC-ESI-MS of the liquid phase during cellulose liquefaction in HCW as a function of the retention time for the 3 temperatures of cellulose conversion studied (180, 220 and 260°C) and as a function of liquefaction reaction time (7 samplings from initial isothermal time to 120min) (n.i.=not identified product)
40 45 50 55 GO G5 Retention Ti me (min)
40 45 50 55 GO G5 Retention Ti me (min)
l [î)
L., l
120
40 45 50 55 GO G5 Retention nme (min)
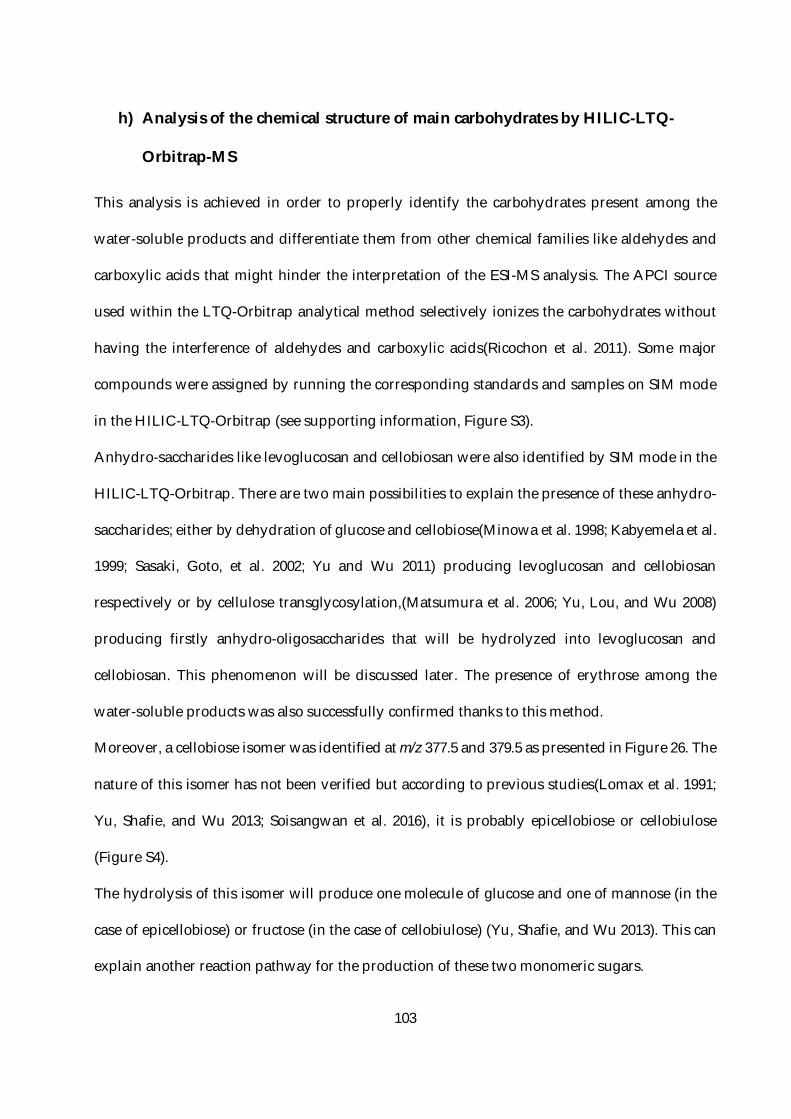
103
h) Analysis of the chemical structure of main carbohydrates by HILIC-LTQ-
Orbitrap-MS
This analysis is achieved in order to properly identify the carbohydrates present among the
water-soluble products and differentiate them from other chemical families like aldehydes and
carboxylic acids that might hinder the interpretation of the ESI-MS analysis. The APCI source
used within the LTQ-Orbitrap analytical method selectively ionizes the carbohydrates without
having the interference of aldehydes and carboxylic acids(Ricochon et al. 2011). Some major
compounds were assigned by running the corresponding standards and samples on SIM mode
in the HILIC-LTQ-Orbitrap (see supporting information, Figure S3).
Anhydro-saccharides like levoglucosan and cellobiosan were also identified by SIM mode in the
HILIC-LTQ-Orbitrap. There are two main possibilities to explain the presence of these anhydro-
saccharides; either by dehydration of glucose and cellobiose(Minowa et al. 1998; Kabyemela et al.
1999; Sasaki, Goto, et al. 2002; Yu and Wu 2011) producing levoglucosan and cellobiosan
respectively or by cellulose transglycosylation,(Matsumura et al. 2006; Yu, Lou, and Wu 2008)
producing firstly anhydro-oligosaccharides that will be hydrolyzed into levoglucosan and
cellobiosan. This phenomenon will be discussed later. The presence of erythrose among the
water-soluble products was also successfully confirmed thanks to this method.
Moreover, a cellobiose isomer was identified at m/z 377.5 and 379.5 as presented in Figure 26. The
nature of this isomer has not been verified but according to previous studies(Lomax et al. 1991;
Yu, Shafie, and Wu 2013; Soisangwan et al. 2016), it is probably epicellobiose or cellobiulose
(Figure S4).
The hydrolysis of this isomer will produce one molecule of glucose and one of mannose (in the
case of epicellobiose) or fructose (in the case of cellobiulose) (Yu, Shafie, and Wu 2013). This can
explain another reaction pathway for the production of these two monomeric sugars.
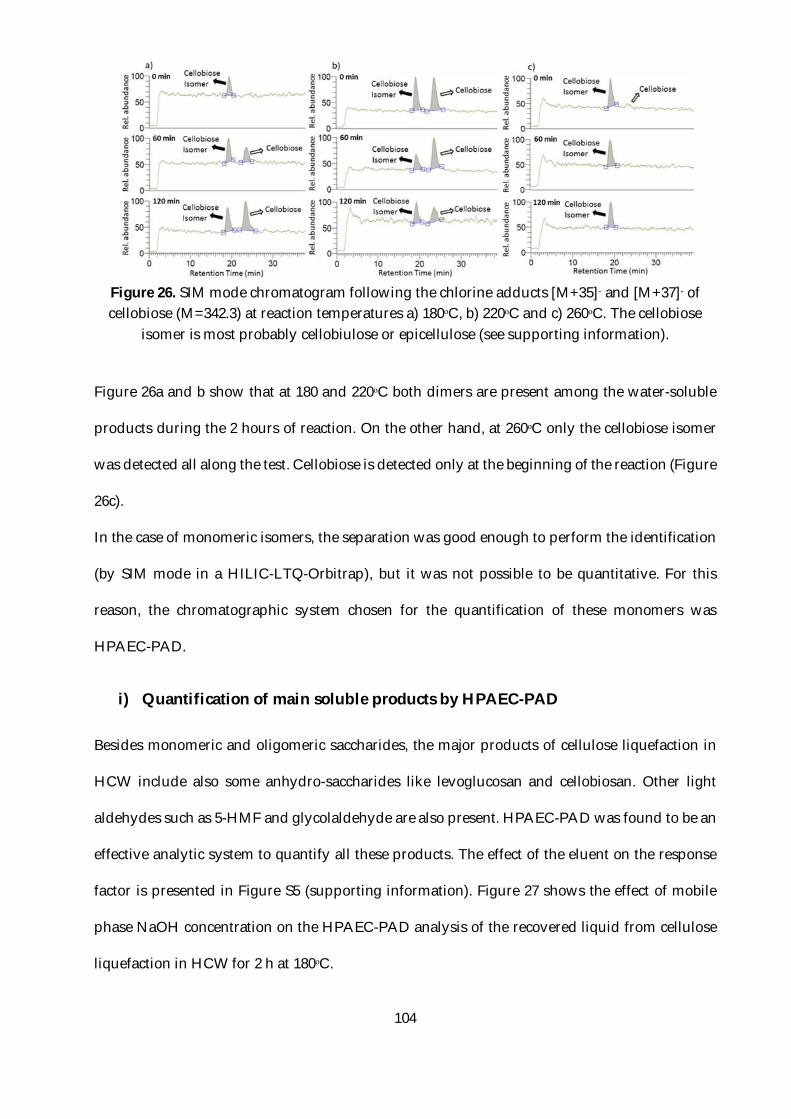
104
Figure 26. SIM mode chromatogram following the chlorine adducts [M+35]- and [M+37]- of cellobiose (M=342.3) at reaction temperatures a) 180ᵒC, b) 220ᵒC and c) 260ᵒC. The cellobiose
isomer is most probably cellobiulose or epicellulose (see supporting information).
Figure 26a and b show that at 180 and 220ᵒC both dimers are present among the water-soluble
products during the 2 hours of reaction. On the other hand, at 260ᵒC only the cellobiose isomer
was detected all along the test. Cellobiose is detected only at the beginning of the reaction (Figure
26c).
In the case of monomeric isomers, the separation was good enough to perform the identification
(by SIM mode in a HILIC-LTQ-Orbitrap), but it was not possible to be quantitative. For this
reason, the chromatographic system chosen for the quantification of these monomers was
HPAEC-PAD.
i) Quantification of main soluble products by HPAEC-PAD
Besides monomeric and oligomeric saccharides, the major products of cellulose liquefaction in
HCW include also some anhydro-saccharides like levoglucosan and cellobiosan. Other light
aldehydes such as 5-HMF and glycolaldehyde are also present. HPAEC-PAD was found to be an
effective analytic system to quantify all these products. The effect of the eluent on the response
factor is presented in Figure S5 (supporting information). Figure 27 shows the effect of mobile
phase NaOH concentration on the HPAEC-PAD analysis of the recovered liquid from cellulose
liquefaction in HCW for 2 h at 180ᵒC.
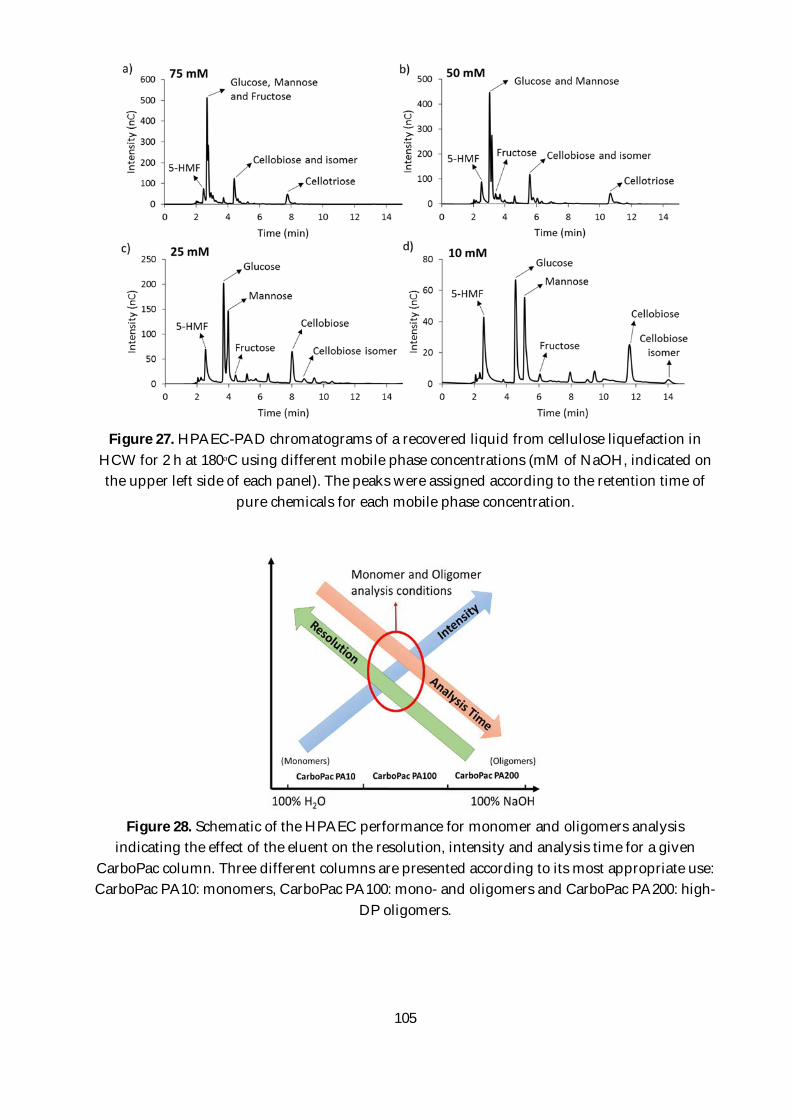
105
Figure 27. HPAEC-PAD chromatograms of a recovered liquid from cellulose liquefaction in
HCW for 2 h at 180ᵒC using different mobile phase concentrations (mM of NaOH, indicated on the upper left side of each panel). The peaks were assigned according to the retention time of
pure chemicals for each mobile phase concentration.
Figure 28. Schematic of the HPAEC performance for monomer and oligomers analysis
indicating the effect of the eluent on the resolution, intensity and analysis time for a given CarboPac column. Three different columns are presented according to its most appropriate use: CarboPac PA10: monomers, CarboPac PA100: mono- and oligomers and CarboPac PA200: high-
DP oligomers.
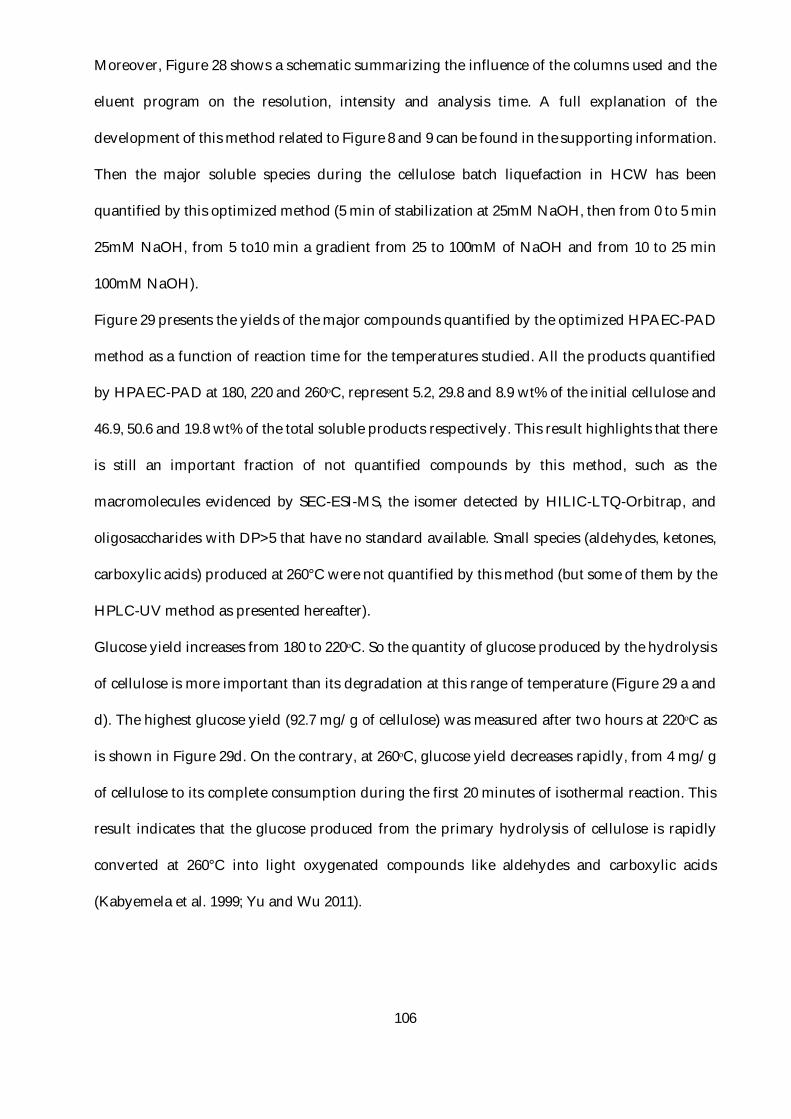
106
Moreover, Figure 28 shows a schematic summarizing the influence of the columns used and the
eluent program on the resolution, intensity and analysis time. A full explanation of the
development of this method related to Figure 8 and 9 can be found in the supporting information.
Then the major soluble species during the cellulose batch liquefaction in HCW has been
quantified by this optimized method (5 min of stabilization at 25mM NaOH, then from 0 to 5 min
25mM NaOH, from 5 to10 min a gradient from 25 to 100mM of NaOH and from 10 to 25 min
100mM NaOH).
Figure 29 presents the yields of the major compounds quantified by the optimized HPAEC-PAD
method as a function of reaction time for the temperatures studied. All the products quantified
by HPAEC-PAD at 180, 220 and 260ᵒC, represent 5.2, 29.8 and 8.9 wt% of the initial cellulose and
46.9, 50.6 and 19.8 wt% of the total soluble products respectively. This result highlights that there
is still an important fraction of not quantified compounds by this method, such as the
macromolecules evidenced by SEC-ESI-MS, the isomer detected by HILIC-LTQ-Orbitrap, and
oligosaccharides with DP>5 that have no standard available. Small species (aldehydes, ketones,
carboxylic acids) produced at 260°C were not quantified by this method (but some of them by the
HPLC-UV method as presented hereafter).
Glucose yield increases from 180 to 220ᵒC. So the quantity of glucose produced by the hydrolysis
of cellulose is more important than its degradation at this range of temperature (Figure 29 a and
d). The highest glucose yield (92.7 mg/g of cellulose) was measured after two hours at 220ᵒC as
is shown in Figure 29d. On the contrary, at 260ᵒC, glucose yield decreases rapidly, from 4 mg/g
of cellulose to its complete consumption during the first 20 minutes of isothermal reaction. This
result indicates that the glucose produced from the primary hydrolysis of cellulose is rapidly
converted at 260°C into light oxygenated compounds like aldehydes and carboxylic acids
(Kabyemela et al. 1999; Yu and Wu 2011).
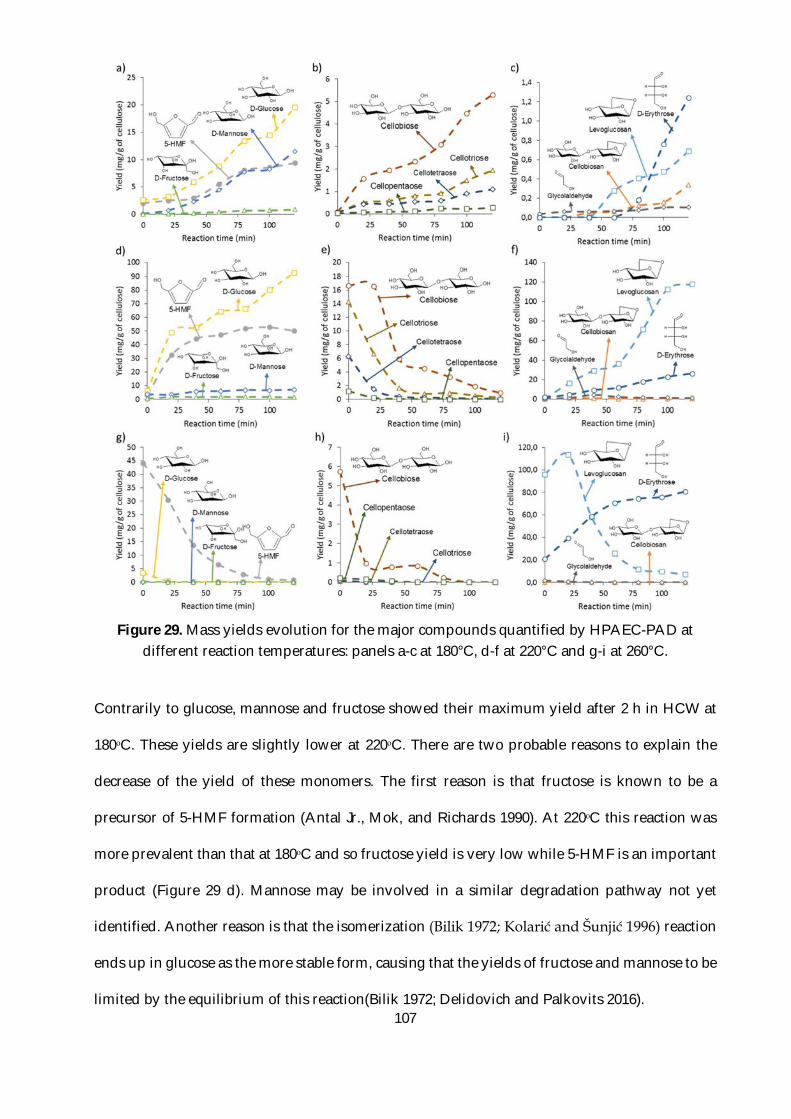
107
Figure 29. Mass yields evolution for the major compounds quantified by HPAEC-PAD at
different reaction temperatures: panels a-c at 180°C, d-f at 220°C and g-i at 260°C.
Contrarily to glucose, mannose and fructose showed their maximum yield after 2 h in HCW at
180ᵒC. These yields are slightly lower at 220ᵒC. There are two probable reasons to explain the
decrease of the yield of these monomers. The first reason is that fructose is known to be a
precursor of 5-HMF formation (Antal Jr., Mok, and Richards 1990). At 220ᵒC this reaction was
more prevalent than that at 180ᵒC and so fructose yield is very low while 5-HMF is an important
product (Figure 29 d). Mannose may be involved in a similar degradation pathway not yet
identified. Another reason is that the isomerization (Bilik 1972; Kolarić and Šunjić 1996) reaction
ends up in glucose as the more stable form, causing that the yields of fructose and mannose to be
limited by the equilibrium of this reaction(Bilik 1972; Delidovich and Palkovits 2016).
108
At 260ᵒC, the yield of mannose and fructose was barely detectable during the first 20-40 minutes
of reaction, and then it was not detectable for the rest of the reaction, similarly to glucose. For the
same reason as glucose, these monomeric sugars should have been rapidly converted to produce
mostly 5-HMF and other aldehydes and carboxylic acids at this temperature(Antal Jr., Mok, and
Richards 1990; Kabyemela et al. 1999).
Oligosaccharides of DP 2 to 5 (cellobiose, cellotriose, cellotetraose and cellopentaose) were also
quantified by HPAEC-PAD. Their yields as a function of the reaction times at 180, 220 and 260ᵒC
are shown in Figure 29b, e and h respectively. The production of these oligomers by cellulose
depolymerization in HCW have been extensively studied(Sasaki et al. 1998, 2000; Yu and Wu
2010b, 2010c, 2010a; D. Liu, Yu, and Wu 2013; Tolonen et al. 2015; Yu, Long, and Wu 2015). As it
is shown in Figure 29b, oligosaccharide yields increase with reaction time at 180°C. Cellobiose
yield is the higher of them, followed by cellotriose, cellotetraose and cellopentaose. This can be
explained because the secondary hydrolysis reactions of primary polysaccharides (high DP) will
produce oligosaccharides (lower DP) that will react at the same time producing saccharides with
DP<6. In consequence, the lower the DP of saccharides is, the higher the number of reactions
producing it, resulting in a higher yield of the DP=2. Conversely, all oligosaccharides of DP 2 to
5 present a decreasing yield over time when the reaction temperature is 220ᵒC. Figure 29e shows
that the disappearance of oligosaccharides is as fast as the DP is high, starting by cellopentaose
at 20 minutes, followed by cellotetraose at 60 minutes, then cellotriose and cellobiose. Cellobiose
yield is stable during the first 20 minutes of reaction, then it exhibits a fast decrease during the
subsequent 20 minutes, followed by a slower decrease for the rest of the reaction. This is because
there are no more high-DP oligomers to produce more cellobiose. Moreover, cellobiose reacts to
produce monomeric sugars(Yu and Wu 2010a; Yu, Shafie, and Wu 2013; Tolonen et al. 2015).
The degradation of oligosaccharides was faster at 260ᵒC than for the previous reaction
temperature (Figure 29h). Cellobiose starts with a sharp decrease in the first 20 minutes, then its
yield becomes constant up to 60min and then decreases further. Oligosaccharides of DP 3-5
109
present a much lower yield than cellobiose during the first 60 minutes, to be then almost
undetectable for the rest of the reaction. At this temperature the conversion rates increase
considerably and the studied species are no longer the major compounds within the soluble
products. Moreover, the competition to form anhydrosaccharides through a pyrolytic mechanism
becomes more important. In both cases, these compounds are most likely degraded into lighter
compounds such as carboxylic acids, aldehydes and permanent gases(Sasaki et al. 1998;
Kabyemela et al. 1999; Watanabe et al. 2005; Yu and Wu 2011).
Levoglucosan and cellobiosan were quantified by HPAEC-PAD. At 180ᵒC, levoglucosan was
detected only after 40 min of reaction (Figure 29c), then its yield increased continuously until the
end of the experiment. On the other hand, at 220ᵒC levoglucosan yield increases up to 120mg/g
of cellulose after 100 min (being the major quantified product).
At 260ᵒC, levoglucosan is the major product at the beginning of the reaction. It increases during
the first 20 minutes of reaction and then decreases continuously until the end of the experiment.
At this temperature levoglucosan is probably degraded into aldehydes and carboxylic acids for
the same reason as monomeric sugars.
Several light oxygenated products from cellulose liquefaction in hot-compressed water,
including: glycolaldehyde, glyceraldehyde, dihydroxyacetone, pyruvaldehyde, 5-
(hydroxymethyl)furfural, furaldehyde, acid formic, acid acetic, acid lactic and levulinic acid, have
been reported in the literature as products of the degradation of the primary monomeric
sugars(Sasaki, Goto, et al. 2002; Matsumura et al. 2006; Yu, Shafie, and Wu 2013). According to
the analysis performed in this work, 5-HMF is the most representative of the species mentioned
before. Many of these compounds have a high volatility and their accurate quantification is
complicated.
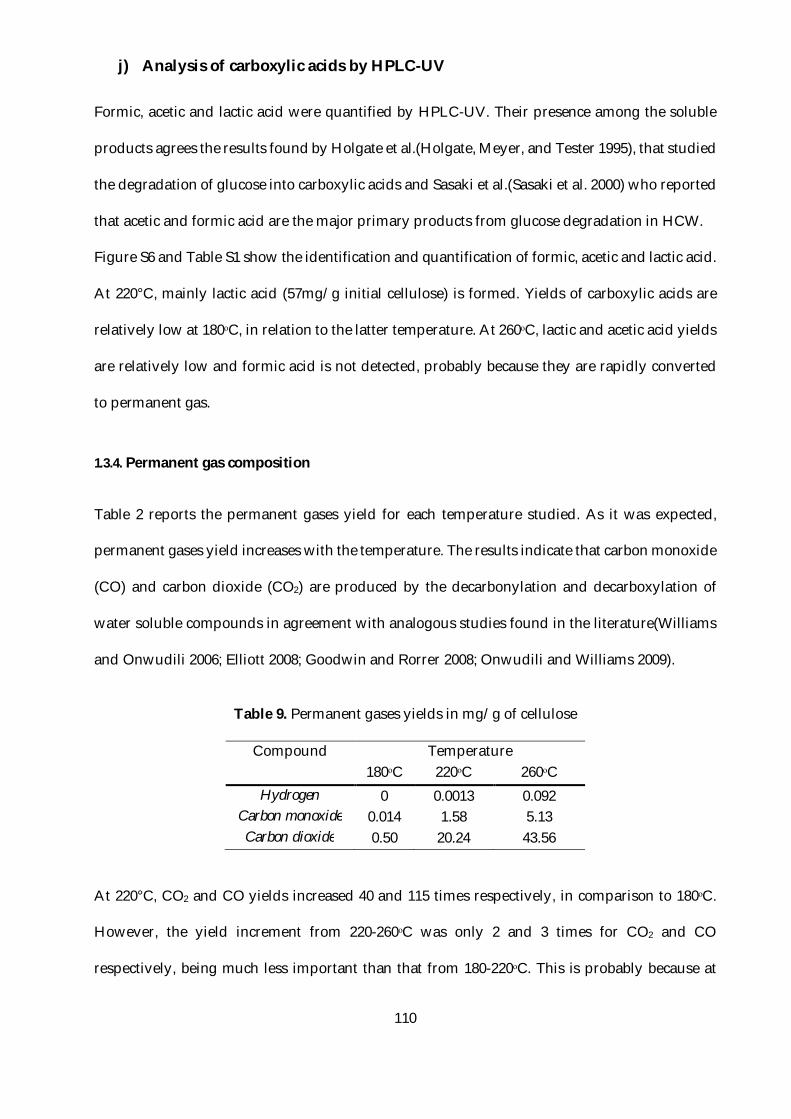
110
j) Analysis of carboxylic acids by HPLC-UV
Formic, acetic and lactic acid were quantified by HPLC-UV. Their presence among the soluble
products agrees the results found by Holgate et al.(Holgate, Meyer, and Tester 1995), that studied
the degradation of glucose into carboxylic acids and Sasaki et al.(Sasaki et al. 2000) who reported
that acetic and formic acid are the major primary products from glucose degradation in HCW.
Figure S6 and Table S1 show the identification and quantification of formic, acetic and lactic acid.
At 220°C, mainly lactic acid (57mg/g initial cellulose) is formed. Yields of carboxylic acids are
relatively low at 180ᵒC, in relation to the latter temperature. At 260ᵒC, lactic and acetic acid yields
are relatively low and formic acid is not detected, probably because they are rapidly converted
to permanent gas.
1.3.4. Permanent gas composition
Table 2 reports the permanent gases yield for each temperature studied. As it was expected,
permanent gases yield increases with the temperature. The results indicate that carbon monoxide
(CO) and carbon dioxide (CO2) are produced by the decarbonylation and decarboxylation of
water soluble compounds in agreement with analogous studies found in the literature(Williams
and Onwudili 2006; Elliott 2008; Goodwin and Rorrer 2008; Onwudili and Williams 2009).
Table 9. Permanent gases yields in mg/g of cellulose
Compound Temperature 180ᵒC 220ᵒC 260ᵒC
Hydrogen 0 0.0013 0.092 Carbon monoxide 0.014 1.58 5.13 Carbon dioxide 0.50 20.24 43.56
At 220°C, CO2 and CO yields increased 40 and 115 times respectively, in comparison to 180ᵒC.
However, the yield increment from 220-260ᵒC was only 2 and 3 times for CO2 and CO
respectively, being much less important than that from 180-220ᵒC. This is probably because at
111
260ᵒC, cellulose depolymerization produces other more stable light species like erythrose that
may not be directly decomposed into carboxylic acids. Gas formation corresponds to the co-
production of water insoluble products related to the decrease of polarity caused by the loss of
the carboxylic functional groups.
1.3.5. Mechanism of cellulose conversion in HCW
The reaction mechanism of cellulose under subcritical (HCW comprised) and supercritical water
have been widely studied(Antal Jr., Mok, and Richards 1990; Kabyemela et al. 1999; Matsumura
et al. 2006; Yu, Lou, and Wu 2008).
Taking into account the previous mechanisms proposed in the literatures(Sasaki et al. 1998;
Matsumura et al. 2006; Yu, Lou, and Wu 2008) and including some results obtained in this present
work based on our various analytical methods, the main reaction pathways undergone by
cellulose in HCW have been rationalized and are presented in Figure 30.
The effect of temperature on the different reaction pathways is highlighted. The reactions are
numbered in order to better describe the reference work and to discuss them based on our
analysis.
Globally, low temperature (180°C) promotes the production of oligosaccharides by [R1]. This is
because at this temperature the kinetic rate of homogeneous hydrolysis [R3] is not that high and
high-DP oligomers can be recovered in the liquid fraction. Intermediate temperature (220°C)
promotes the formation of glucose [R3] and levoglucosan [R4, R11] under our reactions
conditions. High temperature (260°C) promotes erythrose that is the most stable of the studied
species under our conditions.
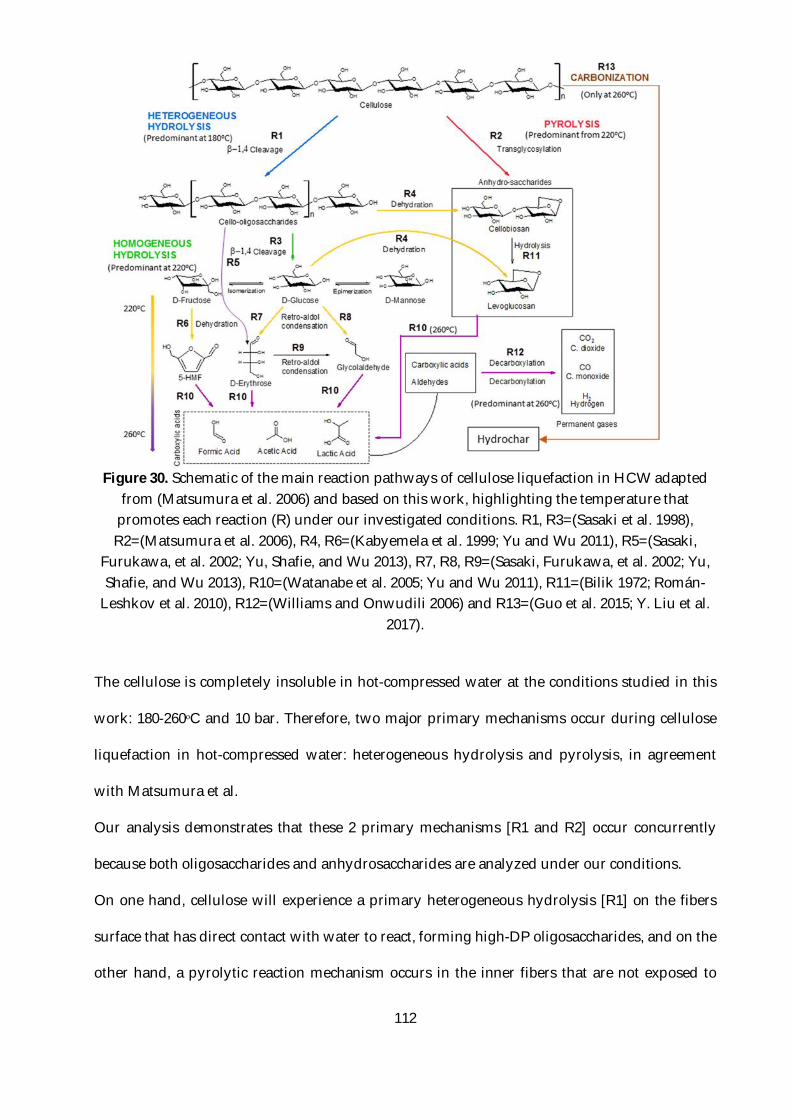
112
Figure 30. Schematic of the main reaction pathways of cellulose liquefaction in HCW adapted
from (Matsumura et al. 2006) and based on this work, highlighting the temperature that promotes each reaction (R) under our investigated conditions. R1, R3=(Sasaki et al. 1998), R2=(Matsumura et al. 2006), R4, R6=(Kabyemela et al. 1999; Yu and Wu 2011), R5=(Sasaki,
Furukawa, et al. 2002; Yu, Shafie, and Wu 2013), R7, R8, R9=(Sasaki, Furukawa, et al. 2002; Yu, Shafie, and Wu 2013), R10=(Watanabe et al. 2005; Yu and Wu 2011), R11=(Bilik 1972; Román-
Leshkov et al. 2010), R12=(Williams and Onwudili 2006) and R13=(Guo et al. 2015; Y. Liu et al. 2017).
The cellulose is completely insoluble in hot-compressed water at the conditions studied in this
work: 180-260ᵒC and 10 bar. Therefore, two major primary mechanisms occur during cellulose
liquefaction in hot-compressed water: heterogeneous hydrolysis and pyrolysis, in agreement
with Matsumura et al.
Our analysis demonstrates that these 2 primary mechanisms [R1 and R2] occur concurrently
because both oligosaccharides and anhydrosaccharides are analyzed under our conditions.
On one hand, cellulose will experience a primary heterogeneous hydrolysis [R1] on the fibers
surface that has direct contact with water to react, forming high-DP oligosaccharides, and on the
other hand, a pyrolytic reaction mechanism occurs in the inner fibers that are not exposed to
113
water; so they can not react by a hydrolytic mechanism but by thermal cleavage [R2] (Figure 20),
in agreement with Matsumura et al.
All of the primary products are further converted until they are completely soluble in water.
These soluble products can also undergo secondary reactions of dehydration, retro-aldol
condensation, decarbonylation, decarboxylation, isomerization. All these “secondary” reactions
are encompassed as “homogeneous hydrolysis” because they occur in the liquid (water) phase.
Moreover, the oligomeric and anhydro-oligomeric compounds (e.g. cellopentaose, cellotetraose,
cellotriose, cellobiose, cellobiosan…) are depolymerized to monomers by hydrolytic cleavage [R3
and R11], producing high quantities of glucose and levoglucosan. For this reason, other type of
reactor with low liquid residence time, as one developed by (Yu and Wu 2010a), would be needed
to better study primary reactions and to minimize secondary reactions.
Glucose undergoes a reversible keto-enol isomerization via LBAE (Lobry de Bruyn, Alberda van
Ekenstein) transformation to produce fructose(de Bruyn and van Ekenstein 1895; Speck 1958). On
the other hand, glucose can also be converted into mannose by an epimerization reaction via
enendiol anion(Bilik 1972; Román-Leshkov et al. 2010; Delidovich and Palkovits 2016).
The monomeric saccharides can undergo a subsequent degradation reaction of dehydration,
decarbonylation and decarboxylation. In that way, glucose can produce one molecule of
erythrose and one of glycolaldehyde by a retro-aldol condensation mechanism [R7], in agreement
with (Kabyemela et al. 1999; Sasaki, Goto, et al. 2002; Watanabe et al. 2005). Another possible
mechanism for the production of erythrose is by the formation of glucosyl-erythrose [R5] from
cellobiose as was previously studied(Sasaki, Furukawa, et al. 2002; Yu, Shafie, and Wu 2013).
However, glucosyl-erythrose has not been studied in this work due to the lack of a commercial
standard to perform quantitative analysis.
Then erythrose can produce two molecules of glycolaldehyde by retro-aldol condensation [R9]
(Sasaki, Goto, et al. 2002) or endure a further degradation to light carboxylic acids
[R10](Kabyemela et al. 1999; Peterson et al. 2008). However, among the chemical species studied,
114
erythrose was found to be the most stable product at 260ᵒC. Levoglucosan and other anhydro-
saccharides could also be converted to carboxylic acids (formic, acetic and lactic acid)(Kabyemela
et al. 1999; Ehara and Saka 2002) and permanent gases[R10 and R12](Goodwin and Rorrer 2008).
The homogeneous hydrolysis reactions are highly sensitive to temperature and it was found that
their rates increase significantly in the range of 180 to 260ᵒC. They are so fast at 260°C that the
majority of the primary products were already degraded at the first sampling time chosen for this
study. Moreover, at this temperature (260ᵒC) the solid residue was carbonized forming
“hydrochar” [R13].
1.4. Conclusion
The main focus of this work is a better understanding of cellulose depolymerization in hot-
compressed water using different analytical techniques. The reactions were studied using a batch
reactor system during 2 h for three different temperatures: 180, 220 and 260ᵒC. The solid, liquid
and gas products were characterized. We have shown in this work how various complementary
LC methods are needed in order to give a detailed characterization of the soluble products.
HPAEC-PAD has been shown as a powerful tool for the characterization of the major liquefaction
water-soluble products.
The reaction temperature presents a strong effect on the distribution of products and different
predominant reaction pathways. The presence of levoglucosan and cellobiosan is a good evidence
of the existing pyrolytic mechanism that inner cellulose fibers may undergo during the
liquefaction in HCW. Under our conditions temperatures around 220ᵒC lead to high yields of
levoglucosan (12 wt.%) and glucose (9 wt.%) after 2 hours. Higher reactions (260°C) promotes the
production of levoglucosan. After less than 20 minutes at 260°C, secondary reactions become
important and lead mainly to erythrose and acids formation. Moreover, the global hydrolysis
mechanism taking into account the permanent gases and major soluble compounds from
different chemical species have been rationalized.
Acknowledgements
115
The authors thank the Carnot Institute and CNRS for the financial support, Steve Pontvianne
(CNRS, Université de Lorraine, Nancy) for his assistance with the HPAEC-PAD analysis, Cedric
Paris (CNRS, Université de Lorraine, Nancy)for his help with the HILIC-LTQ-Orbitrap analysis
and Chiara Barbiero (ICFAR, Western University, Canada) for its collaboration with the total
carbohydrates method.
1.5. References
Abdullah, Rosnah, Kazuyoshi Ueda, and Shiro Saka. 2014. “Hydrothermal Decomposition of Various Crystalline Celluloses as Treated by Semi-Flow Hot-Compressed Water.” Journal of Wood Science 60 (4): 278–86. https://doi.org/10.1007/s10086-014-1401-7.
Ago, Mariko, Takashi Endo, and Takahiro Hirotsu. 2004. “Crystalline Transformation of Native Cellulose from Cellulose I to Cellulose ID Polymorph by a Ball-Milling Method with a Specific Amount of Water.” Cellulose 11 (2): 163–67. https://doi.org/10.1023/B:CELL.0000025423.32330.fa.
Antal Jr., Michael Jerry, William S. L. Mok, and Geoffrey N. Richards. 1990. “Mechanism of Formation of 5-(Hydroxymethyl)-2-Furaldehyde from d-Fructose and Sucrose.” Carbohydrate Research 199 (1): 91–109. https://doi.org/10.1016/0008-6215(90)84096-D.
Bennett, Nicole M., Steve S. Helle, and Sheldon J.B. Duff. 2009. “Extraction and Hydrolysis of Levoglucosan from Pyrolysis Oil.” Bioresource Technology 100 (23): 6059–63. https://doi.org/10.1016/j.biortech.2009.06.067.
Berndes, Göran, Monique Hoogwijk, and Richard van den Broek. 2003. “The Contribution of Biomass in the Future Global Energy Supply: A Review of 17 Studies.” Biomass and Bioenergy 25 (1): 1–28. https://doi.org/10.1016/S0961-9534(02)00185-X.
Bilik, V. 1972. “Reactions of Saccharides Catalyzed by Molybdate Ions. II.* Epimerization of D-Glucose and D-Mannose.” Chemical Papers 26 (2): 183–86.
Briens, Cedric, Jan Piskorz, and Franco Berruti. 2008. “Biomass Valorization for Fuel and Chemicals Production -- A Review.” International Journal of Chemical Reactor Engineering 6 (1). https://doi.org/10.2202/1542-6580.1674.
Bruyn, C. A. Lobry de, and W. Alberda van Ekenstein. 1895. “Action Des Alcalis Sur Les Sucres, II. Transformation Réciproque Des Uns Dans Les Autres Des Sucres Glucose, Fructose et Mannose.” Recueil Des Travaux Chimiques Des Pays-Bas 14 (7): 203–16. https://doi.org/10.1002/recl.18950140703.
Cao, Lidong, Jinlong Wu, Xiuhuan Li, Li Zheng, Miaomiao Wu, Pingping Liu, and Qiliang Huang. 2016. “Validated HPAEC-PAD Method for the Determination of Fully Deacetylated Chitooligosaccharides.” International Journal of Molecular Sciences 17 (10): 1699. https://doi.org/10.3390/ijms17101699.
Corradini, Claudio, Antonella Cavazza, and Chiara Bignardi. 2012. “High-Performance Anion-Exchange Chromatography Coupled with Pulsed Electrochemical Detection as a Powerful Tool to Evaluate Carbohydrates of Food Interest: Principles and Applications.” International Journal of Carbohydrate Chemistry 2012 (May): e487564. https://doi.org/10.1155/2012/487564.
Delidovich, Irina, and Regina Palkovits. 2016. “Catalytic Isomerization of Biomass-Derived Aldoses: A Review.” ChemSusChem 9 (6): 547–61. https://doi.org/10.1002/cssc.201501577.
DuBois, Michel., K. A. Gilles, J. K. Hamilton, P. A. Rebers, and Fred. Smith. 1956. “Colorimetric Method for Determination of Sugars and Related Substances.” Analytical Chemistry 28 (3): 350–56. https://doi.org/10.1021/ac60111a017.
116
Ehara, Katsunobu, and Shiro Saka. 2002. “A Comparative Study on Chemical Conversion of Cellulose between the Batch-Type and Flow-Type Systems in Supercritical Water.” Cellulose 9 (3–4): 301–11. https://doi.org/10.1023/A:1021192711007.
Elliott, Douglas C. 2008. “Catalytic Hydrothermal Gasification of Biomass.” Biofuels, Bioproducts and Biorefining 2 (3): 254–65. https://doi.org/10.1002/bbb.74.
Garcia-Nunez, J. A., M. R. Pelaez-Samaniego, M. E. Garcia-Perez, I. Fonts, J. Abrego, R. J. M. Westerhof, and M. Garcia-Perez. 2017. “Historical Developments of Pyrolysis Reactors: A Review.” Energy & Fuels 31 (6): 5751–75. https://doi.org/10.1021/acs.energyfuels.7b00641.
Goodwin, Aaron K., and Gregory L. Rorrer. 2008. “Conversion of Glucose to Hydrogen-Rich Gas by Supercritical Water in a Microchannel Reactor.” Industrial & Engineering Chemistry Research 47 (12): 4106–14. https://doi.org/10.1021/ie701725p.
Guo, Shuqing, Xiangyuan Dong, Tingting Wu, Fengjuan Shi, and Caixia Zhu. 2015. “Characteristic Evolution of Hydrochar from Hydrothermal Carbonization of Corn Stalk.” Journal of Analytical and Applied Pyrolysis 116 (November): 1–9. https://doi.org/10.1016/j.jaap.2015.10.015.
Henricson, Kaj. 2000. “Wood Structure and Fibers.Pdf.” In . Lappeenranta University of Technology.
Holgate, H. Richard, Jerry C. Meyer, and Jefferson W. Tester. 1995. “Glucose Hydrolysis and Oxidation in Supercritical Water.” AIChE Journal 41 (3): 637–48. https://doi.org/10.1002/aic.690410320.
Jia, Liangyuan, Yann Le Brech, Guillain Mauviel, Fei Qi, Matthias Bente-von Frowein, Sven Ehlert, Ralf Zimmermann, and Anthony Dufour. 2016. “On-Line Analysis of Biomass Pyrolysis Tar by Photoionization Mass Spectrometry.” Energy & Fuels, January. https://doi.org/10.1021/acs.energyfuels.5b02274.
Jiang, Liqun, Anqing Zheng, Zengli Zhao, Fang He, Haibin Li, and Weiguo Liu. 2015. “Obtaining Fermentable Sugars by Dilute Acid Hydrolysis of Hemicellulose and Fast Pyrolysis of Cellulose.” Bioresource Technology 182 (April): 364–67. https://doi.org/10.1016/j.biortech.2015.01.032.
Kabyemela, Bernard M., Tadafumi Adschiri, Roberto M. Malaluan, and Kunio Arai. 1999. “Glucose and Fructose Decomposition in Subcritical and Supercritical Water: Detailed Reaction Pathway, Mechanisms, and Kinetics.” Industrial & Engineering Chemistry Research 38 (8): 2888–95. https://doi.org/10.1021/ie9806390.
Kamio, Eiji, Susumu Takahashi, Hidehiko Noda, Chouji Fukuhara, and Takanari Okamura. 2006. “Liquefaction of Cellulose in Hot Compressed Water under Variable Temperatures.” Industrial & Engineering Chemistry Research 45 (14): 4944–53. https://doi.org/10.1021/ie060136r.
Kolarić, Snježana, and Vitomir Šunjić. 1996. “Comparative Study of C(2) Epimerization of d-Glucose and d-Mannose Catalyzed by Water Soluble Organometallic Complexes with Nitrogen Ligands.” Journal of Molecular Catalysis A: Chemical 110 (3): 181–88. https://doi.org/10.1016/1381-1169(96)00089-1.
Kruse, A., and A. Gawlik. 2003. “Biomass Conversion in Water at 330−410 °C and 30−50 MPa. Identification of Key Compounds for Indicating Different Chemical Reaction Pathways.” Industrial & Engineering Chemistry Research 42 (2): 267–79. https://doi.org/10.1021/ie0202773.
Kumar, Sandeep, and Ram B. Gupta. 2009. “Biocrude Production from Switchgrass Using Subcritical Water.” Energy & Fuels 23 (10): 5151–59. https://doi.org/10.1021/ef900379p.
Le Brech, Yann, Thierry Ghislain, Sébastien Leclerc, Mohammed Bouroukba, Luc Delmotte, Nicolas Brosse, Colin Snape, Patrick Chaimbault, and Anthony Dufour. 2016. “Effect of Potassium on the Mechanisms of Biomass Pyrolysis Studied Using Complementary Analytical Techniques.” ChemSusChem 9 (8): 863–72. https://doi.org/10.1002/cssc.201501560.
117
Lédé, Jacques. 2012. “Cellulose Pyrolysis Kinetics: An Historical Review on the Existence and Role of Intermediate Active Cellulose.” Journal of Analytical and Applied Pyrolysis 94 (March): 17–32. https://doi.org/10.1016/j.jaap.2011.12.019.
Lédé, Jacques, Fabrice Blanchard, and Olivier Boutin. 2002. “Radiant Flash Pyrolysis of Cellulose Pellets: Products and Mechanisms Involved in Transient and Steady State Conditions.” Fuel 81 (10): 1269–79. https://doi.org/10.1016/S0016-2361(02)00039-X.
Lee, Y. C. 1990. “High-Performance Anion-Exchange Chromatography for Carbohydrate Analysis.” Analytical Biochemistry 189 (2): 151–62. https://doi.org/10.1016/0003-2697(90)90099-U.
Liu, Dawei, Yun Yu, and Hongwei Wu. 2013. “Evolution of Water-Soluble and Water-Insoluble Portions in the Solid Products from Fast Pyrolysis of Amorphous Cellulose.” Industrial & Engineering Chemistry Research 52 (36): 12785–93. https://doi.org/10.1021/ie401806y.
Liu, Yuxue, Shuai Yao, Yuying Wang, Haohao Lu, Satinder Kaur Brar, and Shengmao Yang. 2017. “Bio- and Hydrochars from Rice Straw and Pig Manure: Inter-Comparison.” Bioresource Technology 235 (July): 332–37. https://doi.org/10.1016/j.biortech.2017.03.103.
Lomax, J. A., J. M. Commandeur, P. W. Arisz, and J. J. Boon. 1991. “Characterisation of Oligomers and Sugar Ring-Cleavage Products in the Pyrolysate of Cellulose.” Journal of Analytical and Applied Pyrolysis, Proceedings of the 9th International Conference on Fundamentals Aspects, Analytical Techniques, Processes and Applications of Pyrolysis, 19 (July): 65–79. https://doi.org/10.1016/0165-2370(91)80035-7.
Lü, Xin, and Shiro Saka. 2012. “New Insights on Monosaccharides’ Isomerization, Dehydration and Fragmentation in Hot-Compressed Water.” The Journal of Supercritical Fluids 61 (January): 146–56. https://doi.org/10.1016/j.supflu.2011.09.005.
Lu, Xin, Kazuchika Yamauchi, Natthanon Phaiboonsilpa, and Shiro Saka. 2009. “Two-Step Hydrolysis of Japanese Beech as Treated by Semi-Flow Hot-Compressed Water.” Journal of Wood Science 55 (5): 367. https://doi.org/10.1007/s10086-009-1040-6.
Matsumura, Yukihiko, Mitsuru Sasaki, Kazuhide Okuda, Seiichi Takami, Satoshi Ohara, Mitsuo Umetsu, and Tadafumi Adschiri. 2006. “Supercritical Water Treatment of Biomass for Energy and Material Recovery.” Combustion Science and Technology 178 (1–3): 509–36. https://doi.org/10.1080/00102200500290815.
Matsunaga, Masahiro, Hiroaki Matsui, Yoshiki Otsuka, and Seiichi Yamamoto. 2008. “Chemical Conversion of Wood by Treatment in a Semi-Batch Reactor with Subcritical Water.” The Journal of Supercritical Fluids, 8th International Symposium on Supercritical Fluids, 5-8 November, 2006, Kyoto, Japan, 44 (3): 364–69. https://doi.org/10.1016/j.supflu.2007.09.011.
McKendry, Peter. 2002. “Energy Production from Biomass (Part 2): Conversion Technologies.” Bioresource Technology 83 (1): 47–54.
Mechref, Yehia, Milos V. Novotny, and Cheni Krishnan. 2003. “Structural Characterization of Oligosaccharides Using Maldi-TOF/TOF Tandem Mass Spectrometry.” Analytical Chemistry 75 (18): 4895–4903. https://doi.org/10.1021/ac0341968.
Minowa, Tomoaki, Zhen Fang, Tomoko Ogi, and Gábor Várhegyi. 1998. “Decomposition of Cellulose and Glucose in Hot-Compressed Water under Catalyst-Free Conditions.” Journal of Chemical Engineering of Japan 31 (1): 131–34. https://doi.org/10.1252/jcej.31.131.
Neureiter, Markus, Herbert Danner, Christiane Thomasser, Bamusi Saidi, and Rudolf Braun. 2002. “Dilute-Acid Hydrolysis of Sugarcane Bagasse at Varying Conditions.” Applied Biochemistry and Biotechnology 98–100 (1–9): 49–58. https://doi.org/10.1385/ABAB:98-100:1-9:49.
Onwudili, Jude A., and Paul T. Williams. 2009. “Role of Sodium Hydroxide in the Production of Hydrogen Gas from the Hydrothermal Gasification of Biomass.” International Journal of Hydrogen Energy, 2nd International Conference on Hydrogen Safety, 34 (14): 5645–56. https://doi.org/10.1016/j.ijhydene.2009.05.082.
118
Park, Sunkyu, John O. Baker, Michael E. Himmel, Philip A. Parilla, and David K. Johnson. 2010. “Cellulose Crystallinity Index: Measurement Techniques and Their Impact on Interpreting Cellulase Performance.” Biotechnology for Biofuels 3: 10. https://doi.org/10.1186/1754-6834-3-10.
Paskach, Thomas J., Heinz-Peter Lieker, Peter J. Reilly, and Klaus Thielecke. 1991. “High-Performance Anion-Exchange Chromatography of Sugars and Sugar Alcohols on Quaternary Ammonium Resins under Alkaline Conditions.” Carbohydrate Research 215 (1): 1–14. https://doi.org/10.1016/0008-6215(91)84002-V.
Peterson, Andrew A., Frédéric Vogel, Russell P. Lachance, Morgan Fröling, Jr Michael J. Antal, and Jefferson W. Tester. 2008. “Thermochemical Biofuel Production in Hydrothermal Media: A Review of Sub- and Supercritical Water Technologies.” Energy & Environmental Science 1 (1): 32–65. https://doi.org/10.1039/B810100K.
Piskorz, J., P. Majerski, D. Radlein, A. Vladars-Usas, and D. S. Scott. 2000. “Flash Pyrolysis of Cellulose for Production of Anhydro-Oligomers.” Journal of Analytical and Applied Pyrolysis 56 (2): 145–166.
Ren, Shi-fang, Li Zhang, Zhi-hong Cheng, and Yin-long Guo. 2005. “Immobilized Carbon Nanotubes as Matrix for MALDI-TOF-MS Analysis: Applications to Neutral Small Carbohydrates.” Journal of the American Society for Mass Spectrometry 16 (3): 333–39. https://doi.org/10.1016/j.jasms.2004.11.017.
Ricochon, G., C. Paris, M. Girardin, and L. Muniglia. 2011. “Highly Sensitive, Quick and Simple Quantification Method for Mono and Disaccharides in Aqueous Media Using Liquid Chromatography–atmospheric Pressure Chemical Ionization–mass Spectrometry (LC–APCI–MS).” Journal of Chromatography B 879 (19): 1529–36. https://doi.org/10.1016/j.jchromb.2011.03.044.
Rinaldi, Roberto, and Ferdi Schüth. 2009. “Acid Hydrolysis of Cellulose as the Entry Point into Biorefinery Schemes.” ChemSusChem 2 (12): 1096–1107. https://doi.org/10.1002/cssc.200900188.
Rohrer, Jeffrey S., and R. Reid Townsend. 1995. “Separation of Partially Desialylated Branched Oligosaccharide Isomers Containing α(2←3)- and α(2←6)-Linked Neu5Ac.” Glycobiology 5 (4): 391–95. https://doi.org/10.1093/glycob/5.4.391.
Román-Leshkov, Yuriy, Manuel Moliner, Jay A. Labinger, and Mark E. Davis. 2010. “Mechanism of Glucose Isomerization Using a Solid Lewis Acid Catalyst in Water.” Angewandte Chemie International Edition 49 (47): 8954–57. https://doi.org/10.1002/anie.201004689.
Rover, Marjorie R., Patrick A. Johnston, Buddhi P. Lamsal, and Robert C. Brown. 2013. “Total Water-Soluble Sugars Quantification in Bio-Oil Using the Phenol–sulfuric Acid Assay.” Journal of Analytical and Applied Pyrolysis 104 (November): 194–201. https://doi.org/10.1016/j.jaap.2013.08.004.
Salmén, Lennart. 2015. “Wood Morphology and Properties from Molecular Perspectives.” Annals of Forest Science 72 (6): 679–84. https://doi.org/10.1007/s13595-014-0403-3.
Sasaki, Mitsuru, Tadafumi Adschiri, and Kunio Arai. 2004. “Kinetics of Cellulose Conversion at 25 MPa in Sub- and Supercritical Water.” AIChE Journal 50 (1): 192–202. https://doi.org/10.1002/aic.10018.
Sasaki, Mitsuru, Zhen Fang, Yoshiko Fukushima, Tadafumi Adschiri, and Kunio Arai. 2000. “Dissolution and Hydrolysis of Cellulose in Subcritical and Supercritical Water.” Industrial & Engineering Chemistry Research 39 (8): 2883–90. https://doi.org/10.1021/ie990690j.
Sasaki, Mitsuru, Momoko Furukawa, Kimitaka Minami, Tadafumi Adschiri, and Kunio Arai. 2002. “Kinetics and Mechanism of Cellobiose Hydrolysis and Retro-Aldol Condensation in Subcritical and Supercritical Water.” Industrial & Engineering Chemistry Research 41 (26): 6642–49. https://doi.org/10.1021/ie020326b.
Sasaki, Mitsuru, Kohtaro Goto, Kiyohiko Tajima, Tadafumi Adschiri, and Kunio Arai. 2002. “Rapid and Selective Retro-Aldol Condensation of Glucose to Glycolaldehyde in Supercritical Water” 4 (3): 285–87. https://doi.org/10.1039/B203968K.
119
Sasaki, Mitsuru, Bernard Kabyemela, Roberto Malaluan, Satoshi Hirose, Naoko Takeda, Tadafumi Adschiri, and Kunio Arai. 1998. “Cellulose Hydrolysis in Subcritical and Supercritical Water.” The Journal of Supercritical Fluids 13 (1–3): 261–68. https://doi.org/10.1016/S0896-8446(98)00060-6.
Schweingruber, Fritz Hans. 2007. Wood Structure and Environment. Springer Science & Business Media.
Soisangwan, Nontanut, Da-Ming Gao, Takashi Kobayashi, Pramote Khuwijitjaru, and Shuji Adachi. 2016. “Kinetic Analysis for the Isomerization of Cellobiose to Cellobiulose in Subcritical Aqueous Ethanol.” Carbohydrate Research 433 (October): 67–72. https://doi.org/10.1016/j.carres.2016.07.015.
Speck, John C. 1958. “The Lobry De Bruyn-Alberda Van Ekenstein Transformation.” Advances in Carbohydrate Chemistry 13 (January): 63–103. https://doi.org/10.1016/S0096-5332(08)60352-5.
Tolonen, Lasse K., Minna Juvonen, Klaus Niemelä, Atte Mikkelson, Maija Tenkanen, and Herbert Sixta. 2015. “Supercritical Water Treatment for Cello-Oligosaccharide Production from Microcrystalline Cellulose.” Carbohydrate Research 401 (January): 16–23. https://doi.org/10.1016/j.carres.2014.10.012.
Tolonen, Lasse K., Paavo A. Penttilä, Ritva Serimaa, Andrea Kruse, and Herbert Sixta. 2013. “The Swelling and Dissolution of Cellulose Crystallites in Subcritical and Supercritical Water.” Cellulose 20 (6): 2731–44. https://doi.org/10.1007/s10570-013-0072-7.
Toor, Saqib Sohail, Lasse Rosendahl, and Andreas Rudolf. 2011. “Hydrothermal Liquefaction of Biomass: A Review of Subcritical Water Technologies.” Energy 36 (5): 2328–42. https://doi.org/10.1016/j.energy.2011.03.013.
Torget, Robert W., Jun Seok Kim, and Y. Y. Lee. 2000. “Fundamental Aspects of Dilute Acid Hydrolysis/Fractionation Kinetics of Hardwood Carbohydrates. 1. Cellulose Hydrolysis.” Industrial & Engineering Chemistry Research 39 (8): 2817–25. https://doi.org/10.1021/ie990915q.
Townsend, R. Reid, Mark R. Hardy, Ole Hindsgaul, and Yuan Chuan Lee. 1988. “High-Performance Anion-Exchange Chromatography of Oligosaccharides Using Pellicular Resins and Pulsed Amperometric Detection.” Analytical Biochemistry 174 (2): 459–70. https://doi.org/10.1016/0003-2697(88)90044-9.
Watanabe, Masaru, Yuichi Aizawa, Toru Iida, Caroline Levy, Taku M. Aida, and Hiroshi Inomata. 2005. “Glucose Reactions within the Heating Period and the Effect of Heating Rate on the Reactions in Hot Compressed Water.” Carbohydrate Research 340 (12): 1931–39. https://doi.org/10.1016/j.carres.2005.05.019.
Williams, Paul T., and Jude Onwudili. 2006. “Subcritical and Supercritical Water Gasification of Cellulose, Starch, Glucose, and Biomass Waste.” Energy & Fuels 20 (3): 1259–65. https://doi.org/10.1021/ef0503055.
Xie, Zai-Lai, Robin J. White, Jens Weber, Andreas Taubert, and Magdalena M. Titirici. 2011. “Hierarchical Porous Carbonaceous Materials via Ionothermal Carbonization of Carbohydrates.” Journal of Materials Chemistry 21 (20): 7434–42. https://doi.org/10.1039/C1JM00013F.
Yu, Yun, Yu Long, and Hongwei Wu. 2015. “Near-Complete Recovery of Sugar Monomers from Cellulose and Lignocellulosic Biomass via a Two-Step Process Combining Mechanochemical Hydrolysis and Dilute Acid Hydrolysis.” Energy & Fuels, November. https://doi.org/10.1021/acs.energyfuels.5b02196.
Yu, Yun, Xia Lou, and Hongwei Wu. 2008. “Some Recent Advances in Hydrolysis of Biomass in Hot-Compressed Water and Its Comparisons with Other Hydrolysis Methods.” Energy & Fuels 22 (1): 46–60. https://doi.org/10.1021/ef700292p.
Yu, Yun, Zainun Mohd Shafie, and Hongwei Wu. 2013. “Cellobiose Decomposition in Hot-Compressed Water: Importance of Isomerization Reactions.” Industrial & Engineering Chemistry Research 52 (47): 17006–14. https://doi.org/10.1021/ie403140q.
120
Yu, Yun, Bing Song, Yu Long, and Hongwei Wu. 2016. “Mass Spectrometry Analysis of Sugar and Anhydrosugar Oligomers from Biomass Thermochemical Processing.” Energy & Fuels 30 (10): 8787–89. https://doi.org/10.1021/acs.energyfuels.6b01843.
Yu, Yun, and Hongwei Wu. 2009. “Characteristics and Precipitation of Glucose Oligomers in the Fresh Liquid Products Obtained from the Hydrolysis of Cellulose in Hot-Compressed Water.” Industrial & Engineering Chemistry Research 48 (23): 10682–90. https://doi.org/10.1021/ie900768m.
———. 2010a. “Understanding the Primary Liquid Products of Cellulose Hydrolysis in Hot-Compressed Water at Various Reaction Temperatures.” Energy & Fuels 24 (3): 1963–71. https://doi.org/10.1021/ef9013746.
———. 2010b. “Evolution of Primary Liquid Products and Evidence of in Situ Structural Changes in Cellulose with Conversion during Hydrolysis in Hot-Compressed Water.” Industrial & Engineering Chemistry Research 49 (8): 3919–25. https://doi.org/10.1021/ie902020t.
———. 2010c. “Significant Differences in the Hydrolysis Behavior of Amorphous and Crystalline Portions within Microcrystalline Cellulose in Hot-Compressed Water.” Industrial & Engineering Chemistry Research 49 (8): 3902–9. https://doi.org/10.1021/ie901925g.
———. 2011. “Kinetics and Mechanism of Glucose Decomposition in Hot-Compressed Water: Effect of Initial Glucose Concentration.” Industrial & Engineering Chemistry Research 50 (18): 10500–508. https://doi.org/10.1021/ie2011388.
Yuan, Jin-Hua, Ren-Kou Xu, and Hong Zhang. 2011. “The Forms of Alkalis in the Biochar Produced from Crop Residues at Different Temperatures.” Bioresource Technology 102 (3): 3488–97. https://doi.org/10.1016/j.biortech.2010.11.018.
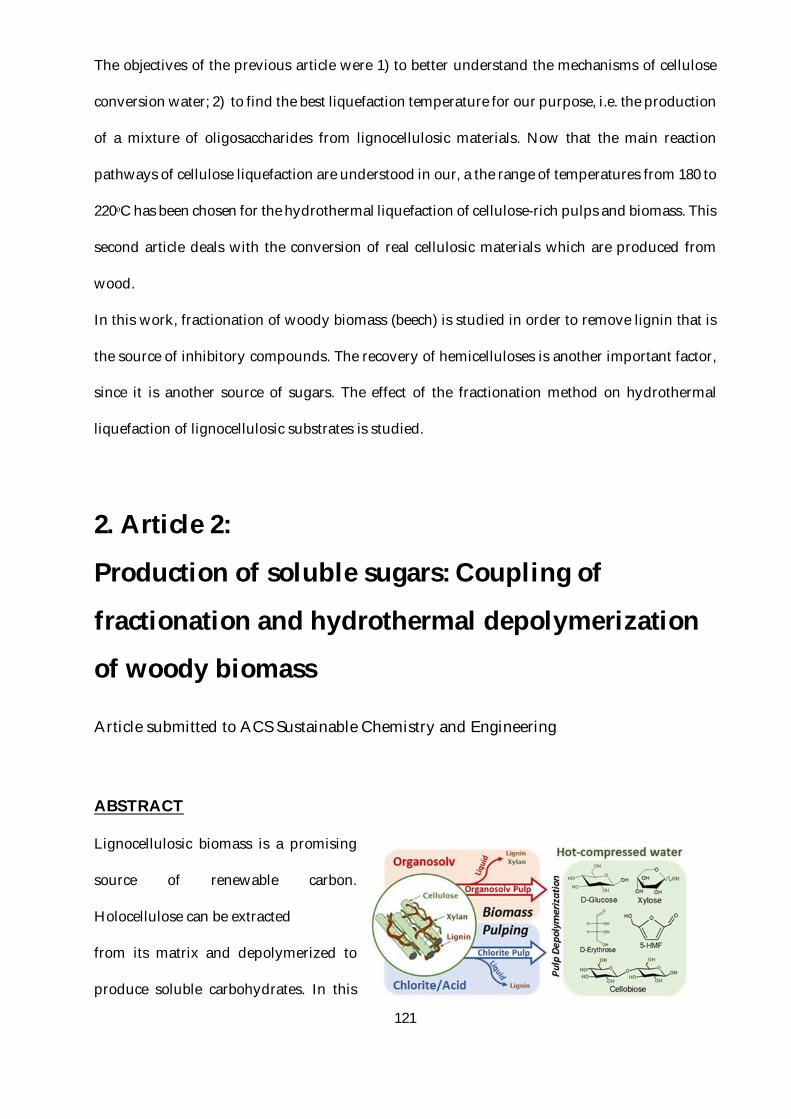
121
The objectives of the previous article were 1) to better understand the mechanisms of cellulose
conversion water; 2) to find the best liquefaction temperature for our purpose, i.e. the production
of a mixture of oligosaccharides from lignocellulosic materials. Now that the main reaction
pathways of cellulose liquefaction are understood in our, a the range of temperatures from 180 to
220ᵒC has been chosen for the hydrothermal liquefaction of cellulose-rich pulps and biomass. This
second article deals with the conversion of real cellulosic materials which are produced from
wood.
In this work, fractionation of woody biomass (beech) is studied in order to remove lignin that is
the source of inhibitory compounds. The recovery of hemicelluloses is another important factor,
since it is another source of sugars. The effect of the fractionation method on hydrothermal
liquefaction of lignocellulosic substrates is studied.
2. Article 2:
Production of soluble sugars: Coupling of
fractionation and hydrothermal depolymerization
of woody biomass
Article submitted to ACS Sustainable Chemistry and Engineering
ABSTRACT
Lignocellulosic biomass is a promising
source of renewable carbon.
Holocellulose can be extracted
from its matrix and depolymerized to
produce soluble carbohydrates. In this
122
work, beech has been delignified either by ethanol organosolv or by sodium chlorite/acetic acid
(SC/AA) treatment, obtaining delignification yields of 50 and 91 wt. % respectively. Cellulose,
hemicelluloses and lignin content of untreated beech, organosolv and SC/AA pulps were
determined. The holocellulosic pulps were then submitted to liquefaction in hot-compressed
water (HCW). Three temperatures were studied: 180, 200 and 220ᵒC during 2 h with sampling
every 30 min. The same experiments were conducted on untreated beech and model cellulose
(Avicel PH-101). Product yields and total carbohydrates were determined. The liquefaction
products, i.e. solid residue, water soluble compounds and permanent gas, were analyzed
respectively by X-ray diffraction (XRD), high performance anion-exchange chromatography with
pulsed amperometric detector (HPAEC-PAD) and gas chromatography (GC). SC/AA treatment
allowed a high recovery of hemicelluloses and for this reason, xylose content was significantly
higher for the SC/AA pulp. The maximum yields of total carbohydrates, i.e. 13.7 and 36.8 wt.%
from the organosolv and SC/AA pulp respectively, were found when the liquefaction
temperature was 220ᵒC. At this temperature, liquefaction of the organosolv pulp produced
glucose with the lowest 5-HMF content among the water-soluble fraction, in comparison to raw
beech and SC/AA pulp.
2.1. Introduction
Fossil fuels are being depleted and finding an alternative source is one of the major current
concerns of society. Lignocellulosic biomass represents a potential renewable alternative source
of carbon(Ragauskas, Williams, et al. 2006; Caes et al. 2015). It is composed principally of
cellulose, hemicelluloses and lignin. Hemicelluloses and cellulose (holocellulose) can be used in
biotechnological routes to produce biofuels, chemicals and building blocks(Desvaux, Guedon,
and Petitdemange 2000; Johnson 2006; Ezeji, Qureshi, and Blaschek 2007; Luque et al. 2014;
123
Morone and Pandey 2014; Maurya, Singla, and Negi 2015). However, lignocellulose constitutes a
complex matrix that is highly recalcitrant to chemical and biological transformation.
Several pretreatments have been studied in order to increase the accessibility of enzymes,
producing glucose in high yields, that can be lately fermented(Mosier et al. 2005; Brosse,
Sannigrahi, and Ragauskas 2009; Hendriks and Zeeman 2009; Alvira et al. 2010; Harmsen et al.
2010; Chen et al. 2011; Mante et al. 2014; Maurya, Singla, and Negi 2015; Jönsson and Martín 2016;
C. K. Nitsos et al. 2016; Wu et al. 2017).
The presence of lignin derived compounds will strongly inhibit the enzymes and microorganisms
used in the later biological processes(Qureshi et al. 2012; Sivagurunathan et al. 2017; Yoo et al.
2017). A cellulose-rich pulp can be extracted from the lignocellulosic matrix by several
technologies like organosolv,(Caes et al. 2015; Erdocia et al. 2016; Hosseinaei et al. 2016; C. Nitsos
et al. 2016; C. K. Nitsos et al. 2016; Sadeghifar et al. 2017) chlorite fractionation,(Siqueira et al.
2013) ionic liquids,(Zhu et al. 2006; Lee et al. 2009; Yang et al. 2013) among others.(Katahira et al.
2014; Liu et al. 2017) Each one of these fractionation (or pulping) methods has its own advantages
and drawbacks. The choice of the fractionation technology needs deep techno-economic and
environmental viability studies.(Viell et al. 2013)
There are two important reasons to perform this delignification process. The first one is that
recovering lignin allowing its valorization by a side process into chemicals and/or
materials.(Yuan, Xu, and Sun 2013; Galkin and Samec 2016; Smichi, Messaoudi, and Gargouri
2017) This will increase the economic viability of the overall biorefinery process. The second
reason is the removal of lignin-derived products (phenols), which exhibit strong inhibitory
properties on micro-organisms used in the subsequent fermentation processes.(Palmqvist and
Hahn-Hägerdal 2000a, 2000b; Jönsson and Martín 2016; Yoo et al. 2017)
The organosolv treatment is a promising technology that allows recovering a cellulose-rich pulp
much less recalcitrant to biological conversion (e.g. enzymatic hydrolysis, fermentation). Studies
for the fractionation of Poplar(Pan et al. 2006) and Miscanthus(Brosse, Sannigrahi, and Ragauskas
124
2009) reported several study cases with delignification yields between 60 and 70 wt.%, obtaining
substrates with good enzymatic digestibility.
Lignin can also be removed by sodium chlorite/acetic acid (SC/AA) treatment. This method can
removed lignin up to 60 wt. % without generating cellulose loses and up to 99 wt. % with
significant cellulose loses.(Siqueira et al. 2013) The main advantage of this method is the high
yield of hemicelluloses recovery that leads to a higher sugar yield after saccharification as well.
In both cases, it is possible to recover a large amount of lignin that can be valorized by another
side process.
Liquefaction can be an interesting process for the production of sugars from lignocellulosic
biomass. Saccharification of cellulose is often made by enzymatic hydrolysis. This process leads
to glucose in high yields, but kinetics are slow and enzymes, that can not be recycled, are very
expensive.
Liquefaction in hot-compressed water (HCW) is an economic, flexible and environmentally
friendly technology that uses only water as solvent and reactive. This process allows converting
(holo)cellulose into soluble carbohydrates that can be transformed into biofuels and
chemicals.(Peterson et al. 2008; Y. Yu, Lou, and Wu 2008; Zhao et al. 2009) Studies using hot-
compressed water in batch and continuous reactors have been promising for this purpose.(Y. Yu,
Lou, and Wu 2008; X. Lu et al. 2009; Y. Yu and Wu 2009, 2010a; Tolonen et al. 2011; Abdullah,
Ueda, and Saka 2014; Shi et al. 2014; Tolonen et al. 2015) But to the best of our knowledge, there
is still a lack of work combining both the fractionation and liquefaction on the same biomass in
order to compare the effect of the fractionation method on the sugar yields produced after the
hydrothermal depolymerization of the pulps.
In this work, beech wood (Fagus sylvatica) is delignified by organosolv and SC/AA processes,
obtaining a cellulose-rich pulp. These pulps are depolymerized by liquefaction in HCW using a
batch system at 180, 200 and 220ᵒC during 2h with sampling every 30 min.
125
Product yields and detailed analysis of the solid residue, water soluble compounds and
permanent gas are performed. Total carbohydrates content is determined by the phenol/sulfuric
acid assay, in order to compare the performance of the two fractionation methods in terms of
sugar production. Moreover, the quantification of all the main sugars is conducted by HPAEC-
PAD. The liquefaction products of organosolv and SC/AA pulps are compared with the products
obtained from untreated beech and a model cellulose (Avicel PH-101). We describe the effect of
delignification treatments on depolymerization reactions in HCW conducted in a batch reactor.
Moreover, the effect of reaction temperature and time on product distribution and composition
have been studied for all the substrates.
2.2. Materials and Methods
2.2.1. Biomass and reactants
The lignocellulosic biomass chosen for this study was beech (Fagus sylvatica), because of its
abundance and special interest for this species in the North East region of France. The wood was
grinded and sieved.The fraction between 250 and 500 µm was recovered for this work. The
reactants: ethanol (95 %, C2H6O), sulfuric acid (98%, H2SO4), sodium chlorite (NaClO2) and acetic
acid (99.5 %, CH3COOH) were purchased from Sigma Aldrich (San Luis, USA).
2.2.2. Biomass delignification
a) Organosolv treatment
Organosolv conditions were taken at the optimal yield reported by (Pan et al. 2006) with some
modifications. For this treatment 200 g of dried beech was loaded in a 2L reactor with 1.4 L of an
ethanol/water mixture 50:50 v/v at 1.25 wt. % H2SO4 (relative to the dried biomass). The final
liquid/solid ratio was 7:1 v/w. The fractionation was conducted at 180ᵒC for 60 min. After
fractionation the solution was vacuum filtered in a Büchner, washing the solid pulp twice with
126
1L of a mixture ethanol/water 50:50 v/v at 60ᵒC. The solid residue (the pulp) was dried at 105ᵒC
for 24 h, then weighted and stored.
b) Sodium chlorite/acetic acid (SC/AA) treatment
The SC/AA treatment has been performed according to that reported by (Siqueira et al. 2013)
with some modifications. 100g of beech were treated with sodium chlorite/acetic acid solution
for 6h. Initially, for each gram of dried beech, 0.33 g of sodium chlorite (NaClO2), 0.33 mL of acetic
acid (CH3COOH) and 40 mL of deionized water were added to a 7L stirred reactor at 70ᵒC. Every
2h the same amount of sodium chlorite and acetic acid was added to the reactor (two times: at 2h
and 4h). After 6h of treatment the sample was vacuum filtered and washed with 2L of water. The
solid was dried at 105ᵒC for 24h, then weighted and stored.
2.2.3. Liquefaction in HCW
Liquefaction in HCW was performed according to our previous study of microcrystalline
cellulose reported in section B, I, 1.(Buendia-Kandia, Mauviel, et al. 2017) A batch reactor system
was used to study the cellulosic pulps depolymerization. An Hastelloy (C-276) stirred reactor
(Parr Instrument Company) of 300 mL was filled up with 200 mL of de-ionized water and 10 g of
substrate (beech, organosolv pulp, SC/AA pulp and Avicel cellulose). Reactor was purged 2
times with nitrogen. Then, 10 bar of nitrogen atmosphere was used as a tracer for the
quantification of permanent gases. Reactor was heated to the target temperature (180°C, 200°C or
220°C) at 5 K/min. At the end of each experiment (2h), the reactor was rapidly quenched (with
cold water) to ambient temperature.
The solid/liquid mixture was filtered using a glass microfiber filter (Whatman®, pore size: 0.7
µm) with a Büchner under vacuum suction. The solid was dried for 24h in an oven at 105ᵒC, then
weighted and stored for further analysis. The recovered liquid was immediately analysed by
liquid chromatography and total carbohydrates; then it was stored in a freezer at -80ᵒC. Once the
127
liquid is completely frozen, the water was removed by freeze drying at -40ᵒC, <0.04 mbar for 24
h. The solid residue was weighted and taken as the total water solubles. The analysis by liquid
chromatography was made before and after freeze drying to verify that there was no significant
change in the composition.
2.2.4. Chemical analysis
a) Cellulose, hemicelluloses and lignin content
Macromolecules composition were determined using the Klason lignin method and high
performance anion-exchange chromatography with pulsed amperometric detection (HPAEC-
PAD) to quantify the cellulose and hemicelluloses according to its monomeric sugars equivalents.
The Klason lignin method was perform according to National Renewable Energy Laboratory
(NREL) method, precipitating lignin using sulfuric acid and recovering the monomeric sugars in
solution.(Sluiter et al. 2012) Thereby, cellulose was quantified as glucose and hemicelluloses as
the sum of arabinose, xylose, mannose and galactose.
b) Total carbohydrates analysis
Total carbohydrates were determined by the phenol/sulfuric acid assay as reported in the
previous work (section B, I, 1). The absorbance was measured in a spectrophotometer
MultikanTM GO (Thermo Scientific™) at 490 nm. The total sugars were quantified as glucose-
equivalent.
c) Analysis by HPAEC-PAD
Soluble products were quantified by high performance anion exchange chromatography with
pulsed amperometric detection (HPAEC-PAD) with the method developed in our previous work
(section B, I, 1). All the major compounds were identified and quantified using the respective
calibration curve for each compound. The column used was a CarboPacPA100 (Dionex, Thermo
128
Fisher Scientific). The HPLC system is equipped with a quaternary solvent delivery pump. Two
solvents were used in this analysis: de-ionized water (A) and a 100 mM sodium hydroxide
solution (B). The method uses a gradient program as follow: 5 min of stabilization at 25% B, then
from 0 to 5 min 25% B, from 5 to 10 min a gradient from 25 to 100% of B and from 10 to 25 min
100% B.
d) Analysis by micro-GC
The permanent gases were collected in a Tedlar bag when the reactor was cooled down to
ambient temperature. Permanent gas was characterized by a µGC-Varian 490 equipped with four
modules, composed of two molecular sieves 5A, a PoraPlot U and a CP-Wax 52CB columns. The
µGC was calibrated using standard bottles (Air Liquide, France). Hydrogen (H2), carbon
monoxide (CO) and carbon dioxide (CO2) were quantified using N2 as a tracer (known volume
and pressure of N2 introduced in the closed reactor).
e) Analysis by XRD
The washed and dried solid residues have been manually crushed (with a mortar) to be analyzed
by XRD analysis. XRD has been performed using an INEL XRG-3000. This X-ray diffractometer
uses a copper radiation (CuKα) having wavelength λ (Kα1) =1.5406 nm generated at 30 kV and
25 mA. The diffraction intensities were measured in a range of 0 to 82ᵒ (2θ) using a step size of
0.029ᵒ. This analysis allows determining if the solid is amorphous or crystalline (crystallinity
index) and also allows characterizing changes in the crystalline structure of solid residues.
Crystallinity index (CI) values were calculated for each solid as the ratio between the height of
the (002) reflection peak and the minimum between the (021) and (10Ῑ) reflection peaks,
corresponding to 2θ=22.7 and 18.9° respectively.(Park et al. 2010)
2.3. Results and discussion
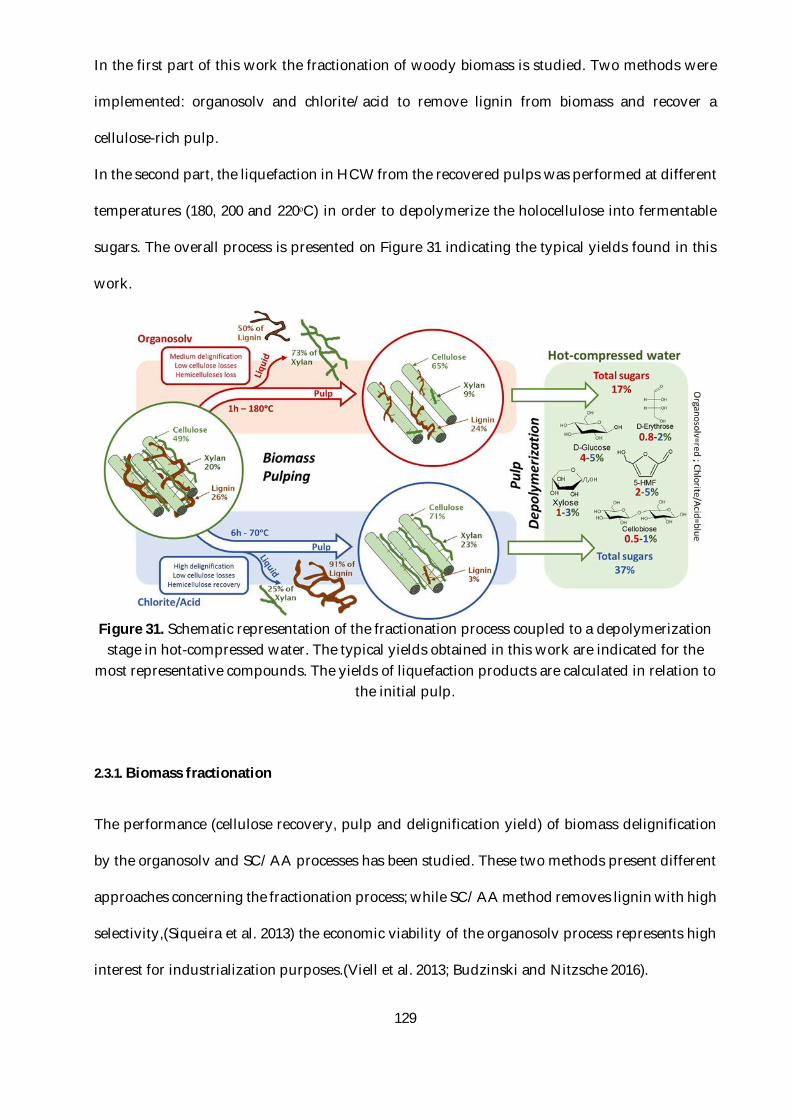
129
In the first part of this work the fractionation of woody biomass is studied. Two methods were
implemented: organosolv and chlorite/acid to remove lignin from biomass and recover a
cellulose-rich pulp.
In the second part, the liquefaction in HCW from the recovered pulps was performed at different
temperatures (180, 200 and 220ᵒC) in order to depolymerize the holocellulose into fermentable
sugars. The overall process is presented on Figure 31 indicating the typical yields found in this
work.
Figure 31. Schematic representation of the fractionation process coupled to a depolymerization
stage in hot-compressed water. The typical yields obtained in this work are indicated for the most representative compounds. The yields of liquefaction products are calculated in relation to
the initial pulp.
2.3.1. Biomass fractionation
The performance (cellulose recovery, pulp and delignification yield) of biomass delignification
by the organosolv and SC/AA processes has been studied. These two methods present different
approaches concerning the fractionation process; while SC/AA method removes lignin with high
selectivity,(Siqueira et al. 2013) the economic viability of the organosolv process represents high
interest for industrialization purposes.(Viell et al. 2013; Budzinski and Nitzsche 2016).
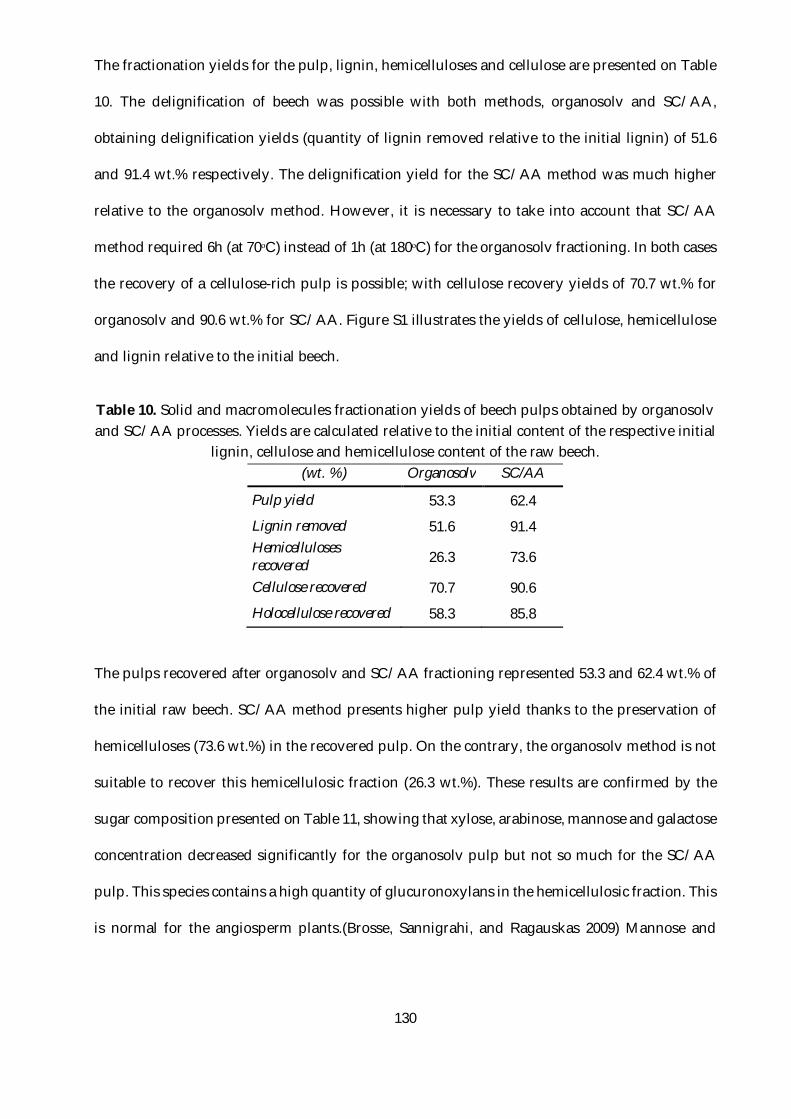
130
The fractionation yields for the pulp, lignin, hemicelluloses and cellulose are presented on Table
10. The delignification of beech was possible with both methods, organosolv and SC/AA,
obtaining delignification yields (quantity of lignin removed relative to the initial lignin) of 51.6
and 91.4 wt.% respectively. The delignification yield for the SC/AA method was much higher
relative to the organosolv method. However, it is necessary to take into account that SC/AA
method required 6h (at 70ᵒC) instead of 1h (at 180ᵒC) for the organosolv fractioning. In both cases
the recovery of a cellulose-rich pulp is possible; with cellulose recovery yields of 70.7 wt.% for
organosolv and 90.6 wt.% for SC/AA. Figure S1 illustrates the yields of cellulose, hemicellulose
and lignin relative to the initial beech.
Table 10. Solid and macromolecules fractionation yields of beech pulps obtained by organosolv and SC/AA processes. Yields are calculated relative to the initial content of the respective initial
lignin, cellulose and hemicellulose content of the raw beech. (wt. %) Organosolv SC/AA
Pulp yield 53.3 62.4
Lignin removed 51.6 91.4 Hemicelluloses recovered 26.3 73.6
Cellulose recovered 70.7 90.6
Holocellulose recovered 58.3 85.8
The pulps recovered after organosolv and SC/AA fractioning represented 53.3 and 62.4 wt.% of
the initial raw beech. SC/AA method presents higher pulp yield thanks to the preservation of
hemicelluloses (73.6 wt.%) in the recovered pulp. On the contrary, the organosolv method is not
suitable to recover this hemicellulosic fraction (26.3 wt.%). These results are confirmed by the
sugar composition presented on Table 11, showing that xylose, arabinose, mannose and galactose
concentration decreased significantly for the organosolv pulp but not so much for the SC/AA
pulp. This species contains a high quantity of glucuronoxylans in the hemicellulosic fraction. This
is normal for the angiosperm plants.(Brosse, Sannigrahi, and Ragauskas 2009) Mannose and
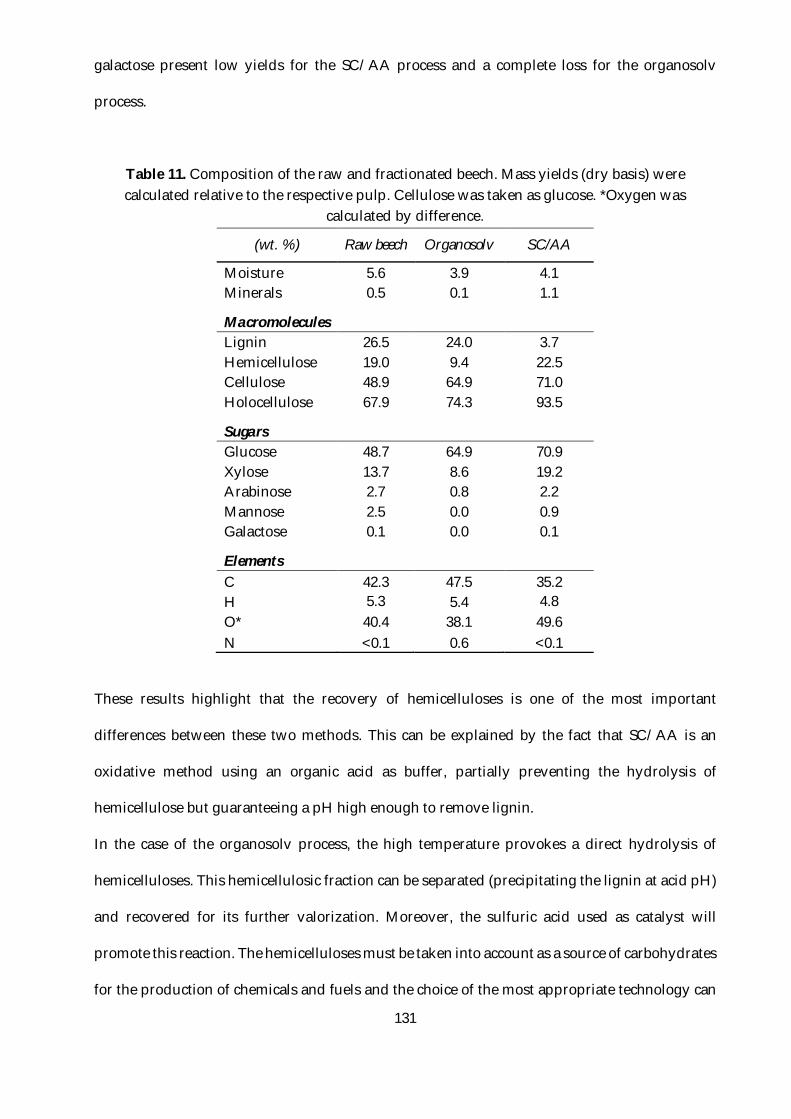
131
galactose present low yields for the SC/AA process and a complete loss for the organosolv
process.
Table 11. Composition of the raw and fractionated beech. Mass yields (dry basis) were calculated relative to the respective pulp. Cellulose was taken as glucose. *Oxygen was
calculated by difference.
(wt. %) Raw beech Organosolv SC/AA
Moisture 5.6 3.9 4.1 Minerals 0.5 0.1 1.1
Macromolecules
Lignin 26.5 24.0 3.7 Hemicellulose 19.0 9.4 22.5 Cellulose 48.9 64.9 71.0 Holocellulose 67.9 74.3 93.5
Sugars Glucose 48.7 64.9 70.9 Xylose 13.7 8.6 19.2 Arabinose 2.7 0.8 2.2 Mannose 2.5 0.0 0.9 Galactose 0.1 0.0 0.1
Elements C 42.3 47.5 35.2 H 5.3 5.4 4.8 O* 40.4 38.1 49.6 N <0.1 0.6 <0.1
These results highlight that the recovery of hemicelluloses is one of the most important
differences between these two methods. This can be explained by the fact that SC/AA is an
oxidative method using an organic acid as buffer, partially preventing the hydrolysis of
hemicellulose but guaranteeing a pH high enough to remove lignin.
In the case of the organosolv process, the high temperature provokes a direct hydrolysis of
hemicelluloses. This hemicellulosic fraction can be separated (precipitating the lignin at acid pH)
and recovered for its further valorization. Moreover, the sulfuric acid used as catalyst will
promote this reaction. The hemicelluloses must be taken into account as a source of carbohydrates
for the production of chemicals and fuels and the choice of the most appropriate technology can
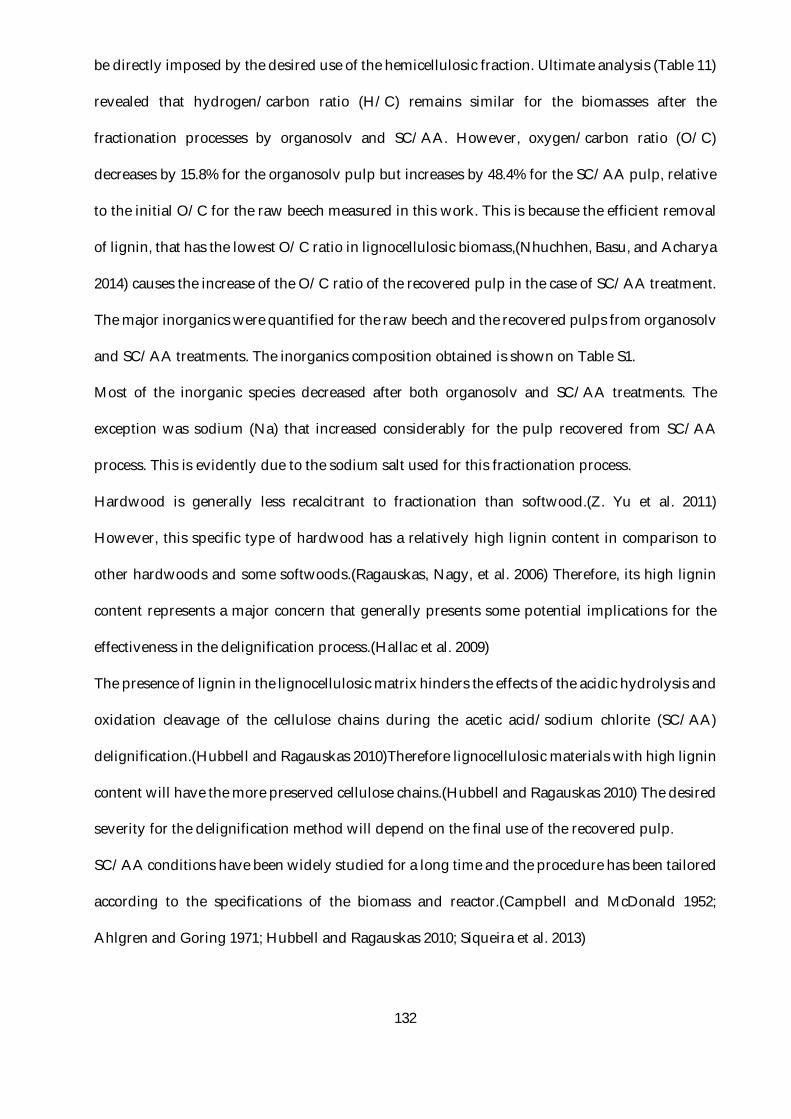
132
be directly imposed by the desired use of the hemicellulosic fraction. Ultimate analysis (Table 11)
revealed that hydrogen/carbon ratio (H/C) remains similar for the biomasses after the
fractionation processes by organosolv and SC/AA. However, oxygen/carbon ratio (O/C)
decreases by 15.8% for the organosolv pulp but increases by 48.4% for the SC/AA pulp, relative
to the initial O/C for the raw beech measured in this work. This is because the efficient removal
of lignin, that has the lowest O/C ratio in lignocellulosic biomass,(Nhuchhen, Basu, and Acharya
2014) causes the increase of the O/C ratio of the recovered pulp in the case of SC/AA treatment.
The major inorganics were quantified for the raw beech and the recovered pulps from organosolv
and SC/AA treatments. The inorganics composition obtained is shown on Table S1.
Most of the inorganic species decreased after both organosolv and SC/AA treatments. The
exception was sodium (Na) that increased considerably for the pulp recovered from SC/AA
process. This is evidently due to the sodium salt used for this fractionation process.
Hardwood is generally less recalcitrant to fractionation than softwood.(Z. Yu et al. 2011)
However, this specific type of hardwood has a relatively high lignin content in comparison to
other hardwoods and some softwoods.(Ragauskas, Nagy, et al. 2006) Therefore, its high lignin
content represents a major concern that generally presents some potential implications for the
effectiveness in the delignification process.(Hallac et al. 2009)
The presence of lignin in the lignocellulosic matrix hinders the effects of the acidic hydrolysis and
oxidation cleavage of the cellulose chains during the acetic acid/sodium chlorite (SC/AA)
delignification.(Hubbell and Ragauskas 2010)Therefore lignocellulosic materials with high lignin
content will have the more preserved cellulose chains.(Hubbell and Ragauskas 2010) The desired
severity for the delignification method will depend on the final use of the recovered pulp.
SC/AA conditions have been widely studied for a long time and the procedure has been tailored
according to the specifications of the biomass and reactor.(Campbell and McDonald 1952;
Ahlgren and Goring 1971; Hubbell and Ragauskas 2010; Siqueira et al. 2013)
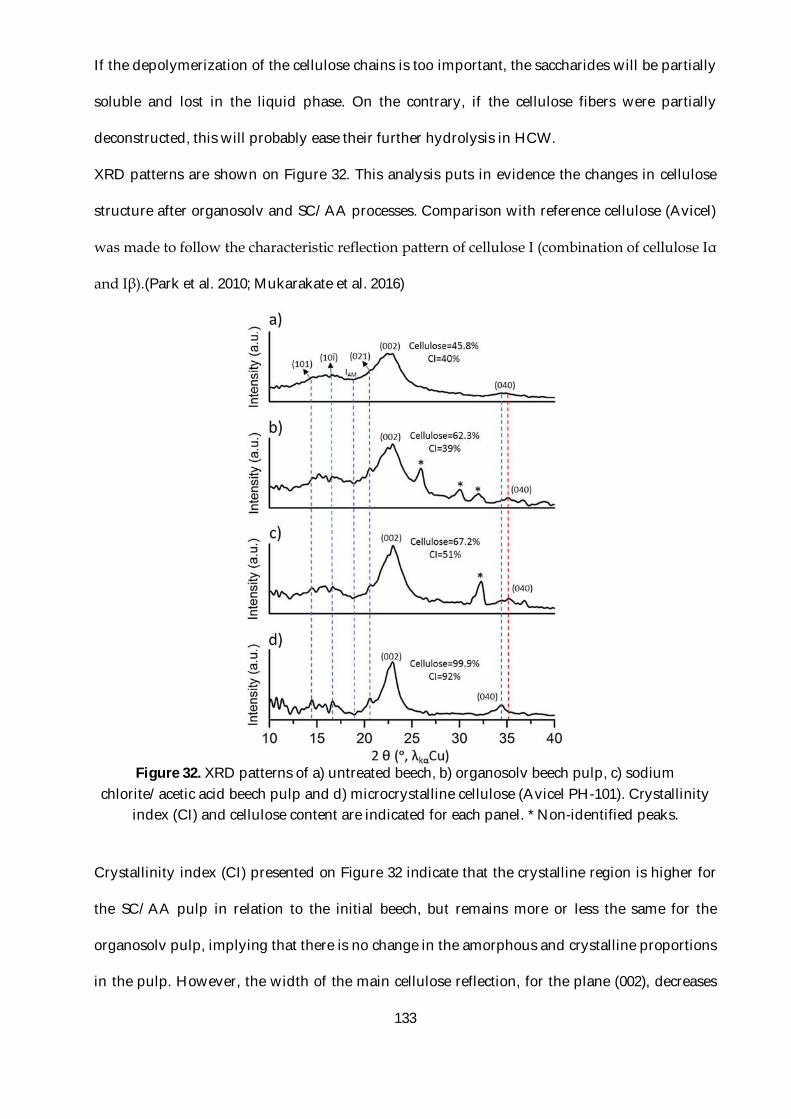
133
If the depolymerization of the cellulose chains is too important, the saccharides will be partially
soluble and lost in the liquid phase. On the contrary, if the cellulose fibers were partially
deconstructed, this will probably ease their further hydrolysis in HCW.
XRD patterns are shown on Figure 32. This analysis puts in evidence the changes in cellulose
structure after organosolv and SC/AA processes. Comparison with reference cellulose (Avicel)
was made to follow the characteristic reflection pattern of cellulose I (combination of cellulose Iα
and Iβ).(Park et al. 2010; Mukarakate et al. 2016)
Figure 32. XRD patterns of a) untreated beech, b) organosolv beech pulp, c) sodium
chlorite/acetic acid beech pulp and d) microcrystalline cellulose (Avicel PH-101). Crystallinity index (CI) and cellulose content are indicated for each panel. * Non-identified peaks.
Crystallinity index (CI) presented on Figure 32 indicate that the crystalline region is higher for
the SC/AA pulp in relation to the initial beech, but remains more or less the same for the
organosolv pulp, implying that there is no change in the amorphous and crystalline proportions
in the pulp. However, the width of the main cellulose reflection, for the plane (002), decreases
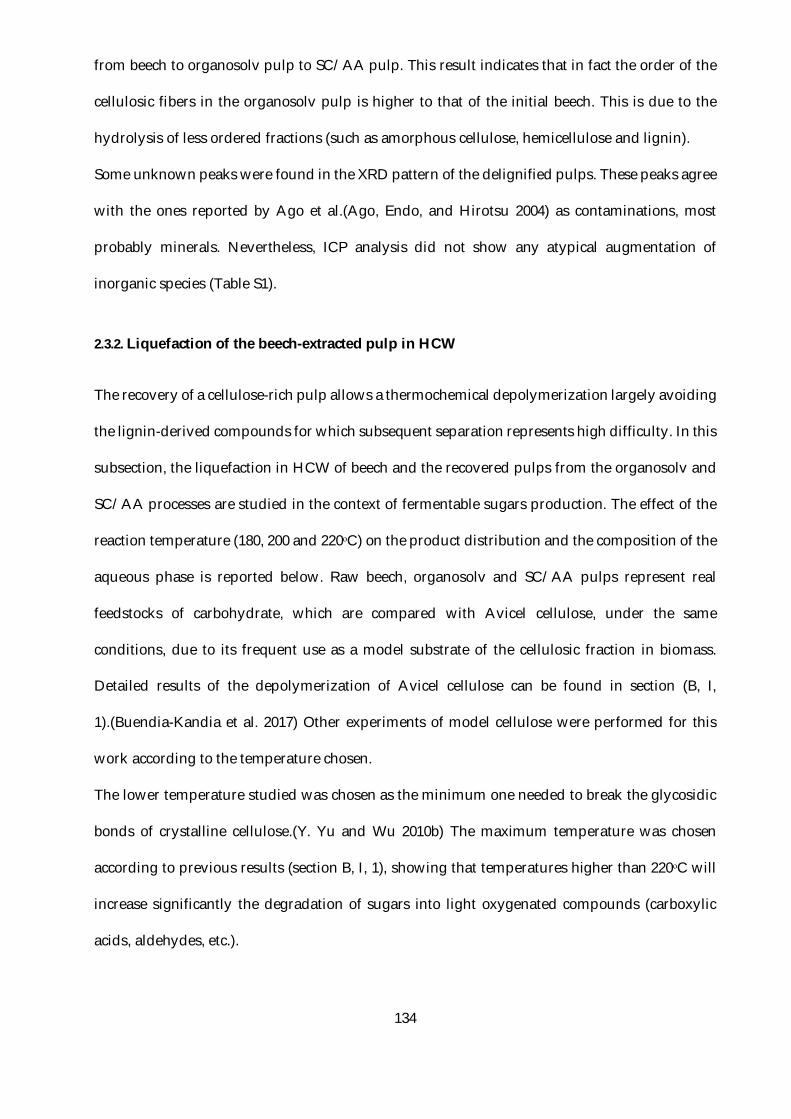
134
from beech to organosolv pulp to SC/AA pulp. This result indicates that in fact the order of the
cellulosic fibers in the organosolv pulp is higher to that of the initial beech. This is due to the
hydrolysis of less ordered fractions (such as amorphous cellulose, hemicellulose and lignin).
Some unknown peaks were found in the XRD pattern of the delignified pulps. These peaks agree
with the ones reported by Ago et al.(Ago, Endo, and Hirotsu 2004) as contaminations, most
probably minerals. Nevertheless, ICP analysis did not show any atypical augmentation of
inorganic species (Table S1).
2.3.2. Liquefaction of the beech-extracted pulp in HCW
The recovery of a cellulose-rich pulp allows a thermochemical depolymerization largely avoiding
the lignin-derived compounds for which subsequent separation represents high difficulty. In this
subsection, the liquefaction in HCW of beech and the recovered pulps from the organosolv and
SC/AA processes are studied in the context of fermentable sugars production. The effect of the
reaction temperature (180, 200 and 220ᵒC) on the product distribution and the composition of the
aqueous phase is reported below. Raw beech, organosolv and SC/AA pulps represent real
feedstocks of carbohydrate, which are compared with Avicel cellulose, under the same
conditions, due to its frequent use as a model substrate of the cellulosic fraction in biomass.
Detailed results of the depolymerization of Avicel cellulose can be found in section (B, I,
1).(Buendia-Kandia et al. 2017) Other experiments of model cellulose were performed for this
work according to the temperature chosen.
The lower temperature studied was chosen as the minimum one needed to break the glycosidic
bonds of crystalline cellulose.(Y. Yu and Wu 2010b) The maximum temperature was chosen
according to previous results (section B, I, 1), showing that temperatures higher than 220ᵒC will
increase significantly the degradation of sugars into light oxygenated compounds (carboxylic
acids, aldehydes, etc.).
135
Mass balances after 2 h of liquefaction in HCW of the four biomasses are reported in Figure 33.
For all the biomasses treated, the solid residue decreases when the temperature increases.
Moreover, the soluble and gas products always increased as the temperature increased from 180
to 220ᵒC.
Figure 33. Product distribution after liquefaction in HCW of avicel cellulose, beech, organosolv
and sodium chlorite/acetic acid (SC/AA) beech-extracted pulp as function of the reaction temperature after 2h reaction time.
The water-solubles fraction was higher for beech and SC/AA pulp than that for Avicel and
organosolv pulp. This can be explained by the high content of hemicelluloses in beech and
SC/AA that are easily hydrolysable at moderate temperatures. At 220ᵒC, water-solubles maxima
of 47 and 65 wt.% were found for organosolv and SC/AA pulps respectively.
The XRD patterns of the solid residues after 2h of liquefaction in HCW are illustrated in Figure
34. This analysis allows identifying if there is some reorganization of the crystalline structure or
carbonization reactions that lead to disordered solids (hydrochar). The XRD patterns for beech,
organosolv and SC/AA pulps exhibit the characteristic reflections of crystalline cellulose. For all
three substrates, the crystallinity increases with the temperature in the range of 180 to 220ᵒC. It
has been shown that higher temperatures lead to hydrochar formation.(Kang et al. 2012; Guo et
al. 2015; Buendia-Kandia et al. 2017)
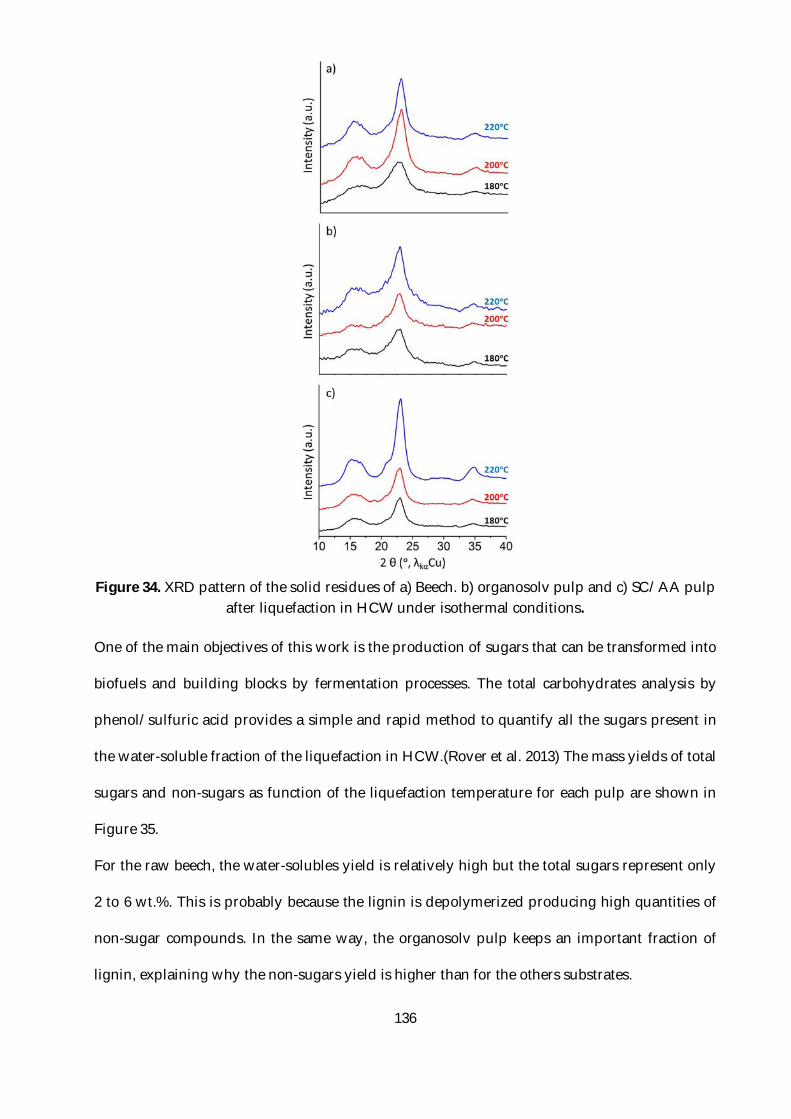
136
Figure 34. XRD pattern of the solid residues of a) Beech. b) organosolv pulp and c) SC/AA pulp
after liquefaction in HCW under isothermal conditions.
One of the main objectives of this work is the production of sugars that can be transformed into
biofuels and building blocks by fermentation processes. The total carbohydrates analysis by
phenol/sulfuric acid provides a simple and rapid method to quantify all the sugars present in
the water-soluble fraction of the liquefaction in HCW.(Rover et al. 2013) The mass yields of total
sugars and non-sugars as function of the liquefaction temperature for each pulp are shown in
Figure 35.
For the raw beech, the water-solubles yield is relatively high but the total sugars represent only
2 to 6 wt.%. This is probably because the lignin is depolymerized producing high quantities of
non-sugar compounds. In the same way, the organosolv pulp keeps an important fraction of
lignin, explaining why the non-sugars yield is higher than for the others substrates.
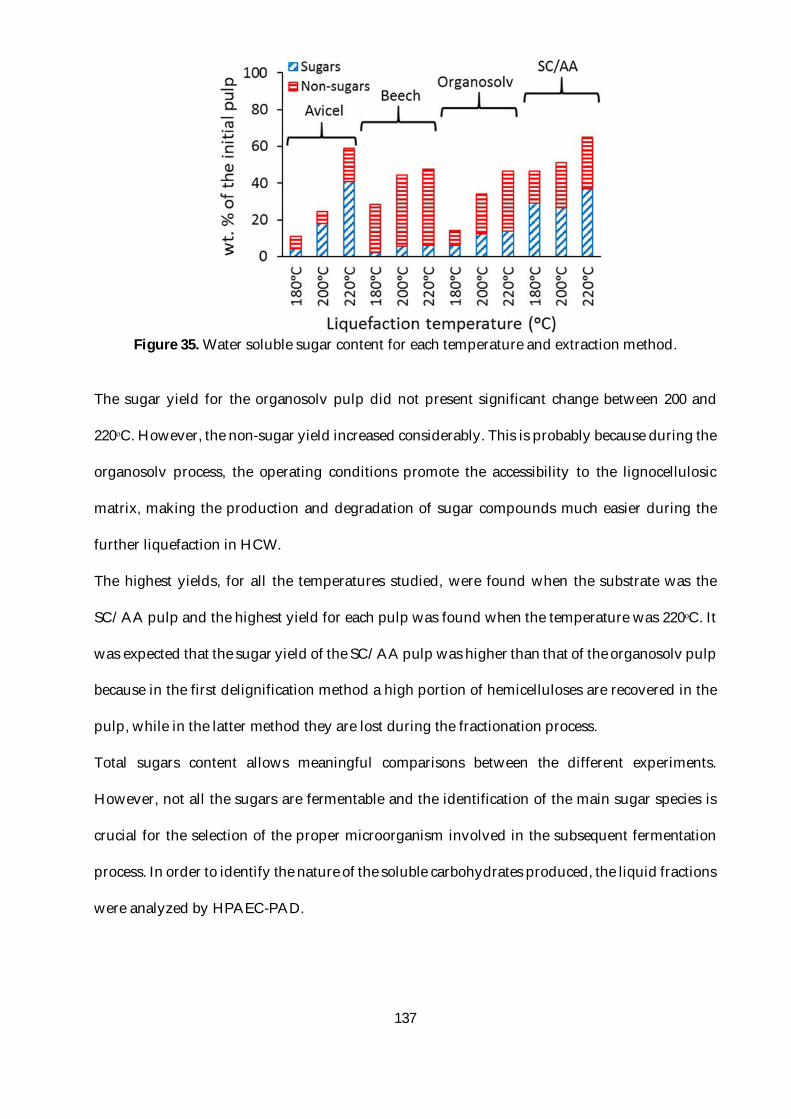
137
Figure 35. Water soluble sugar content for each temperature and extraction method.
The sugar yield for the organosolv pulp did not present significant change between 200 and
220ᵒC. However, the non-sugar yield increased considerably. This is probably because during the
organosolv process, the operating conditions promote the accessibility to the lignocellulosic
matrix, making the production and degradation of sugar compounds much easier during the
further liquefaction in HCW.
The highest yields, for all the temperatures studied, were found when the substrate was the
SC/AA pulp and the highest yield for each pulp was found when the temperature was 220ᵒC. It
was expected that the sugar yield of the SC/AA pulp was higher than that of the organosolv pulp
because in the first delignification method a high portion of hemicelluloses are recovered in the
pulp, while in the latter method they are lost during the fractionation process.
Total sugars content allows meaningful comparisons between the different experiments.
However, not all the sugars are fermentable and the identification of the main sugar species is
crucial for the selection of the proper microorganism involved in the subsequent fermentation
process. In order to identify the nature of the soluble carbohydrates produced, the liquid fractions
were analyzed by HPAEC-PAD.
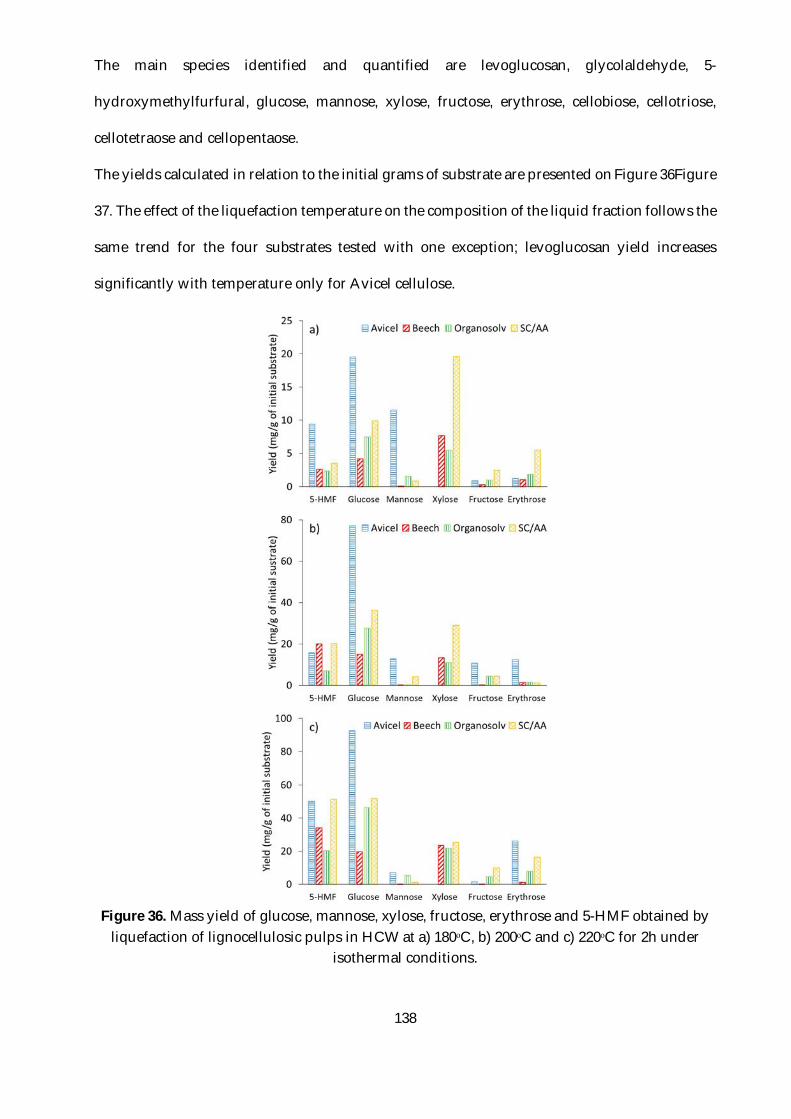
138
The main species identified and quantified are levoglucosan, glycolaldehyde, 5-
hydroxymethylfurfural, glucose, mannose, xylose, fructose, erythrose, cellobiose, cellotriose,
cellotetraose and cellopentaose.
The yields calculated in relation to the initial grams of substrate are presented on Figure 36Figure
37. The effect of the liquefaction temperature on the composition of the liquid fraction follows the
same trend for the four substrates tested with one exception; levoglucosan yield increases
significantly with temperature only for Avicel cellulose.
Figure 36. Mass yield of glucose, mannose, xylose, fructose, erythrose and 5-HMF obtained by
liquefaction of lignocellulosic pulps in HCW at a) 180ᵒC, b) 200ᵒC and c) 220ᵒC for 2h under isothermal conditions.
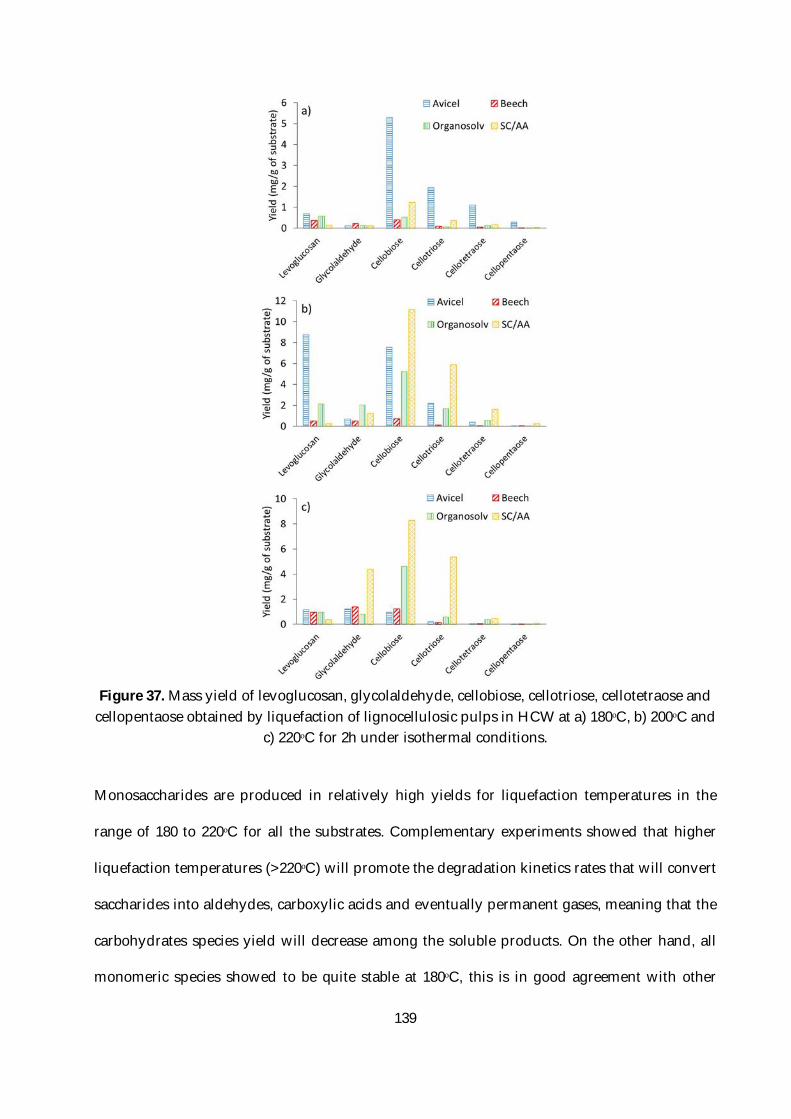
139
Figure 37. Mass yield of levoglucosan, glycolaldehyde, cellobiose, cellotriose, cellotetraose and
cellopentaose obtained by liquefaction of lignocellulosic pulps in HCW at a) 180ᵒC, b) 200ᵒC and c) 220ᵒC for 2h under isothermal conditions.
Monosaccharides are produced in relatively high yields for liquefaction temperatures in the
range of 180 to 220ᵒC for all the substrates. Complementary experiments showed that higher
liquefaction temperatures (>220ᵒC) will promote the degradation kinetics rates that will convert
saccharides into aldehydes, carboxylic acids and eventually permanent gases, meaning that the
carbohydrates species yield will decrease among the soluble products. On the other hand, all
monomeric species showed to be quite stable at 180ᵒC, this is in good agreement with other
140
studies found in the literature. The maximum yield for each monosaccharide occurred generally
at 220ᵒC.
The highest glucose yield for beech, organosolv and SC/AA pulps were 19.7, 46.3 and 52.0 mg/g
respectively. It always occurred at 220ᵒC for the reaction times studied (2h). Xylose was the major
product derived from hemicelluloses. The maximum yield for the organosolv pulp was 21.6
mg/g, found when the liquefaction temperature was 220ᵒC. For this pulp, xylose yield increases
always with the reaction temperature. On the other hand, SC/AA pulp showed a different
behavior. Xylose yield increased significantly when the temperature increases from 180 to 200ᵒC,
leading to a maximum xylose yield of 29.0 mg/g. Then, xylose yield slightly decreased when the
temperature was increased to 220ᵒC. Fructose and mannose yields did not present the same
behavior in relation to the reaction temperature. This can be explained by their instability and
constant conversion due to isomerization and degradation reactions. Previous studies(Antal Jr.,
Mok, and Richards 1990; Kabyemela et al. 1999) showed that fructose is an intermediate
compound in the fast reaction that produces 5-HMF, explaining why this monosaccharide is
never found in high quantities.
In our previous work,(Buendia-Kandia, Mauviel, et al. 2017) levoglucosan yield obtained using
Avicel cellulose (117.9 mg/g) was very high in comparison with the values obtained with the
organosolv and SC/AA cellulose-rich pulps. When the cellulose fibers are highly organized as in
Avicel cellulose, inner cellulose chains do not have contact with water. Consequently, they will
undergo thermal cleavage producing an anhydrous end that gives place to levoglucosan and
other anhydro-saccharides.(Shafizadeh et al. 1979, 19; Antal, Várhegyi, and Jakab 1998; Lédé,
Blanchard, and Boutin 2002; Q. Lu et al. 2011; Bridgwater 2012; Lédé 2012; Mukarakate et al. 2016)
On the contrary, native cellulose fibers are much less organized. In comparison with the raw
beech, Avicel cellulose is already more crystalline that cellulose in biomass. Moreover, the fiber
network was already deconstructed thanks to the delignification process, that gives more access
to water promoting an hydrolytic reaction mechanism instead of a pyrolytic one. This explains
141
why liquefaction of native cellulose does not produce high quantities of levoglucosan as with
Avicel cellulose. In this case, Avicel cellulose is not a good model of cellulose in biomass. Because
even if cellulose in the lignocellulosic matrix is protected by lignin, it has less mass transfer
limitations that the microcrystals of Avicel cellulose.
Besides, most of bacteria are not able to metabolize anhydro-saccharides. Its biological conversion
is more common in fungi and yeast.(Kitamura, Abe, and Yasui 1991; Prosen et al. 1993; Layton et
al. 2011) For this reason, promoting glucose instead of levoglucosan increases the fermentable
fraction among the water-solubles.
Concerning oligosaccharides (Figure 37) yields increase in the temperature interval from 180 to
200ᵒC. When the temperature changes from 200 to 220ᵒC, oligosaccharides’ yields decrease
slightly. This result indicates that at the latter temperature the hydrolysis of oligosaccharides in
solution competes with the hydrolysis of insoluble cellulosic chains. The optimal temperature to
depolymerize cellulosic materials into soluble carbohydrates will depend on the targeted DP of
products. Around 200ᵒC more oligosaccharides will be recovered but at 220ᵒC the major species
will be monosaccharides. The DP distribution of the carbohydrates mixture will have a significant
effect on the downstream processes.
Aldehydes are produced by degradation of monosaccharides. The two major species found in the
liquid phase were glycolaldehyde (Figure 37) and 5-HMF (Figure 36). Their yields increased
when the temperature increased from 180 to 220ᵒC. 5-HMF was one of the major products of
cellulose liquefaction with maximum yields of 34.2, 20.2 and 51.4 mg/g for beech, organosolv
and SC/AA biomasses. This compound represents the major inhibitor derived from cellulose
liquefaction (also pyrolysis) that will affect the subsequent fermentation process.(Qureshi et al.
2012) Its removal, with other lignin derived compounds is now the object of several
studies.(Palmqvist and Hahn-Hägerdal 2000a; Moreno et al. 2015; Gao and Rehmann 2016)
Glycolaldehyde was produced in relatively low quantities in all cases. Its presence is an indicator
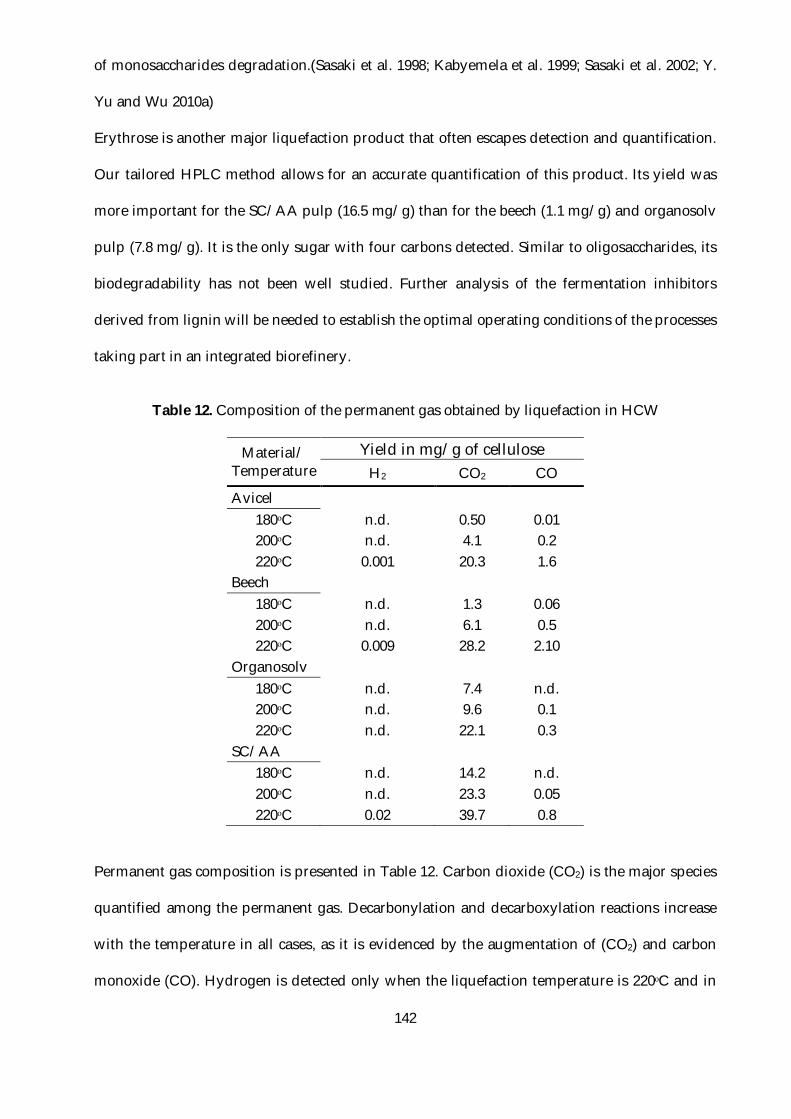
142
of monosaccharides degradation.(Sasaki et al. 1998; Kabyemela et al. 1999; Sasaki et al. 2002; Y.
Yu and Wu 2010a)
Erythrose is another major liquefaction product that often escapes detection and quantification.
Our tailored HPLC method allows for an accurate quantification of this product. Its yield was
more important for the SC/AA pulp (16.5 mg/g) than for the beech (1.1 mg/g) and organosolv
pulp (7.8 mg/g). It is the only sugar with four carbons detected. Similar to oligosaccharides, its
biodegradability has not been well studied. Further analysis of the fermentation inhibitors
derived from lignin will be needed to establish the optimal operating conditions of the processes
taking part in an integrated biorefinery.
Table 12. Composition of the permanent gas obtained by liquefaction in HCW
Material/ Temperature
Yield in mg/g of cellulose H2 CO2 CO
Avicel
180ᵒC n.d. 0.50 0.01 200ᵒC n.d. 4.1 0.2 220ᵒC 0.001 20.3 1.6
Beech
180ᵒC n.d. 1.3 0.06 200ᵒC n.d. 6.1 0.5 220ᵒC 0.009 28.2 2.10
Organosolv
180ᵒC n.d. 7.4 n.d. 200ᵒC n.d. 9.6 0.1 220ᵒC n.d. 22.1 0.3
SC/AA
180ᵒC n.d. 14.2 n.d. 200ᵒC n.d. 23.3 0.05 220ᵒC 0.02 39.7 0.8
Permanent gas composition is presented in Table 12. Carbon dioxide (CO2) is the major species
quantified among the permanent gas. Decarbonylation and decarboxylation reactions increase
with the temperature in all cases, as it is evidenced by the augmentation of (CO2) and carbon
monoxide (CO). Hydrogen is detected only when the liquefaction temperature is 220ᵒC and in

143
very low yields relatively to CO2 and CO. The gas composition between native cellulose (beech
and pulps) and microcrystalline cellulose (Avicel) is comparable, showing that CO and CO2 are
not representative markers for the different depolymerization mechanisms between pure
cellulose and pulps under our conditions.
2.4. Conclusion
Wood (beech)fractionation was possible by the organosolv and SC/AA processes with
delignification yields of 50 wt.% and 91 wt.% respectively. Using the SC/AA method, 75 wt.% of
the hemicelluloses are recovered in the pulp, whereas the organosolv method allows to recover
only 27 wt.%.
Depolymerization of fractionated pulps by liquefaction in HCW showed that the maximum
quantity of water soluble sugars, ~14 wt.% for organosolv and ~37 wt.% for SC/AA, are
produced when the reaction temperature is 220ᵒC. Liquefaction of the organosolv pulp achieved
glucose yields similar to the SC/AA pulp, but with much less 5-HMF formation. This can be
significantly positive for the subsequent fermentation processes. Even if glucose is the most
abundant sugar, there are several others saccharides among the water-soluble fraction (i.e. xylose,
fructose, cellobiose, etc.) that are potentially fermentable. Besides, this study concerns only the
valorization of the cellulosic fraction, the lignin and hemicellulosic fractions can be valorized into
added-value chemicals increasing the economic viability of this biorefinery approach.
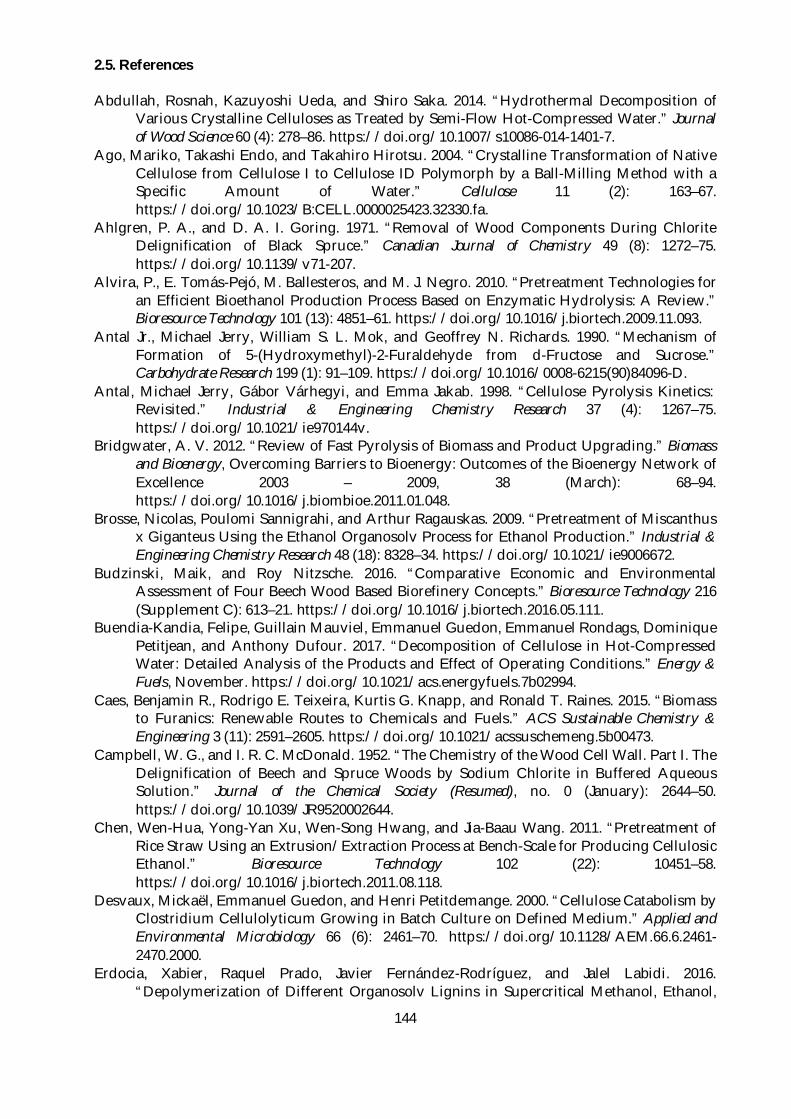
144
2.5. References
Abdullah, Rosnah, Kazuyoshi Ueda, and Shiro Saka. 2014. “Hydrothermal Decomposition of Various Crystalline Celluloses as Treated by Semi-Flow Hot-Compressed Water.” Journal of Wood Science 60 (4): 278–86. https://doi.org/10.1007/s10086-014-1401-7.
Ago, Mariko, Takashi Endo, and Takahiro Hirotsu. 2004. “Crystalline Transformation of Native Cellulose from Cellulose I to Cellulose ID Polymorph by a Ball-Milling Method with a Specific Amount of Water.” Cellulose 11 (2): 163–67. https://doi.org/10.1023/B:CELL.0000025423.32330.fa.
Ahlgren, P. A., and D. A. I. Goring. 1971. “Removal of Wood Components During Chlorite Delignification of Black Spruce.” Canadian Journal of Chemistry 49 (8): 1272–75. https://doi.org/10.1139/v71-207.
Alvira, P., E. Tomás-Pejó, M. Ballesteros, and M. J. Negro. 2010. “Pretreatment Technologies for an Efficient Bioethanol Production Process Based on Enzymatic Hydrolysis: A Review.” Bioresource Technology 101 (13): 4851–61. https://doi.org/10.1016/j.biortech.2009.11.093.
Antal Jr., Michael Jerry, William S. L. Mok, and Geoffrey N. Richards. 1990. “Mechanism of Formation of 5-(Hydroxymethyl)-2-Furaldehyde from d-Fructose and Sucrose.” Carbohydrate Research 199 (1): 91–109. https://doi.org/10.1016/0008-6215(90)84096-D.
Antal, Michael Jerry, Gábor Várhegyi, and Emma Jakab. 1998. “Cellulose Pyrolysis Kinetics: Revisited.” Industrial & Engineering Chemistry Research 37 (4): 1267–75. https://doi.org/10.1021/ie970144v.
Bridgwater, A. V. 2012. “Review of Fast Pyrolysis of Biomass and Product Upgrading.” Biomass and Bioenergy, Overcoming Barriers to Bioenergy: Outcomes of the Bioenergy Network of Excellence 2003 – 2009, 38 (March): 68–94. https://doi.org/10.1016/j.biombioe.2011.01.048.
Brosse, Nicolas, Poulomi Sannigrahi, and Arthur Ragauskas. 2009. “Pretreatment of Miscanthus x Giganteus Using the Ethanol Organosolv Process for Ethanol Production.” Industrial & Engineering Chemistry Research 48 (18): 8328–34. https://doi.org/10.1021/ie9006672.
Budzinski, Maik, and Roy Nitzsche. 2016. “Comparative Economic and Environmental Assessment of Four Beech Wood Based Biorefinery Concepts.” Bioresource Technology 216 (Supplement C): 613–21. https://doi.org/10.1016/j.biortech.2016.05.111.
Buendia-Kandia, Felipe, Guillain Mauviel, Emmanuel Guedon, Emmanuel Rondags, Dominique Petitjean, and Anthony Dufour. 2017. “Decomposition of Cellulose in Hot-Compressed Water: Detailed Analysis of the Products and Effect of Operating Conditions.” Energy & Fuels, November. https://doi.org/10.1021/acs.energyfuels.7b02994.
Caes, Benjamin R., Rodrigo E. Teixeira, Kurtis G. Knapp, and Ronald T. Raines. 2015. “Biomass to Furanics: Renewable Routes to Chemicals and Fuels.” ACS Sustainable Chemistry & Engineering 3 (11): 2591–2605. https://doi.org/10.1021/acssuschemeng.5b00473.
Campbell, W. G., and I. R. C. McDonald. 1952. “The Chemistry of the Wood Cell Wall. Part I. The Delignification of Beech and Spruce Woods by Sodium Chlorite in Buffered Aqueous Solution.” Journal of the Chemical Society (Resumed), no. 0 (January): 2644–50. https://doi.org/10.1039/JR9520002644.
Chen, Wen-Hua, Yong-Yan Xu, Wen-Song Hwang, and Jia-Baau Wang. 2011. “Pretreatment of Rice Straw Using an Extrusion/Extraction Process at Bench-Scale for Producing Cellulosic Ethanol.” Bioresource Technology 102 (22): 10451–58. https://doi.org/10.1016/j.biortech.2011.08.118.
Desvaux, Mickaël, Emmanuel Guedon, and Henri Petitdemange. 2000. “Cellulose Catabolism by Clostridium Cellulolyticum Growing in Batch Culture on Defined Medium.” Applied and Environmental Microbiology 66 (6): 2461–70. https://doi.org/10.1128/AEM.66.6.2461-2470.2000.
Erdocia, Xabier, Raquel Prado, Javier Fernández-Rodríguez, and Jalel Labidi. 2016. “Depolymerization of Different Organosolv Lignins in Supercritical Methanol, Ethanol,
145
and Acetone To Produce Phenolic Monomers.” ACS Sustainable Chemistry & Engineering 4 (3): 1373–80. https://doi.org/10.1021/acssuschemeng.5b01377.
Ezeji, Thaddeus Chukwuemeka, Nasib Qureshi, and Hans Peter Blaschek. 2007. “Bioproduction of Butanol from Biomass: From Genes to Bioreactors.” Current Opinion in Biotechnology 18 (3): 220–27. https://doi.org/10.1016/j.copbio.2007.04.002.
Galkin, Maxim V., and Joseph S. M. Samec. 2016. “Lignin Valorization through Catalytic Lignocellulose Fractionation: A Fundamental Platform for the Future Biorefinery.” Chemsuschem 9 (13): 1544–58. https://doi.org/10.1002/cssc.201600237.
Gao, Kai, and Lars Rehmann. 2016. “Combined Detoxification and In-Situ Product Removal by a Single Resin During Lignocellulosic Butanol Production.” Scientific Reports 6 (July): srep30533. https://doi.org/10.1038/srep30533.
Guo, Shuqing, Xiangyuan Dong, Tingting Wu, Fengjuan Shi, and Caixia Zhu. 2015. “Characteristic Evolution of Hydrochar from Hydrothermal Carbonization of Corn Stalk.” Journal of Analytical and Applied Pyrolysis 116 (November): 1–9. https://doi.org/10.1016/j.jaap.2015.10.015.
Hallac, Bassem B., Poulomi Sannigrahi, Yunqiao Pu, Michael Ray, Richard J. Murphy, and Arthur J. Ragauskas. 2009. “Biomass Characterization of Buddleja Davidii: A Potential Feedstock for Biofuel Production.” Journal of Agricultural and Food Chemistry 57 (4): 1275–81. https://doi.org/10.1021/jf8030277.
Harmsen, Paulien, Wouter Huijgen, Laura Bermudez, and Robert Bakker. 2010. “Literature Review of Physical and Chemical Pretreatment Processes for Lignocellulosic Biomass.” Energy Research Centre of the Netherlands, 10–13.
Hendriks, A. T. W. M., and G. Zeeman. 2009. “Pretreatments to Enhance the Digestibility of Lignocellulosic Biomass.” Bioresource Technology 100 (1): 10–18. https://doi.org/10.1016/j.biortech.2008.05.027.
Hosseinaei, Omid, David P. Harper, Joseph J. Bozell, and Timothy G. Rials. 2016. “Role of Physicochemical Structure of Organosolv Hardwood and Herbaceous Lignins on Carbon Fiber Performance.” ACS Sustainable Chemistry & Engineering 4 (10): 5785–98. https://doi.org/10.1021/acssuschemeng.6b01828.
Hubbell, Christopher A., and Arthur J. Ragauskas. 2010. “Effect of Acid-Chlorite Delignification on Cellulose Degree of Polymerization.” Bioresource Technology 101 (19): 7410–15. https://doi.org/10.1016/j.biortech.2010.04.029.
Johnson, Jeremy C. (Jeremy Clayton). 2006. “Technology Assessment of Biomass Ethanol : A Multi-Objective, Life Cycle Approach under Uncertainty.” Thesis, Massachusetts Institute of Technology. http://dspace.mit.edu/handle/1721.1/35132.
Jönsson, Leif J., and Carlos Martín. 2016. “Pretreatment of Lignocellulose: Formation of Inhibitory by-Products and Strategies for Minimizing Their Effects.” Bioresource Technology, Pretreatment of Biomass, 199 (January): 103–12. https://doi.org/10.1016/j.biortech.2015.10.009.
Kabyemela, Bernard M., Tadafumi Adschiri, Roberto M. Malaluan, and Kunio Arai. 1999. “Glucose and Fructose Decomposition in Subcritical and Supercritical Water: Detailed Reaction Pathway, Mechanisms, and Kinetics.” Industrial & Engineering Chemistry Research 38 (8): 2888–95. https://doi.org/10.1021/ie9806390.
Kang, Shimin, Xianglan Li, Juan Fan, and Jie Chang. 2012. “Characterization of Hydrochars Produced by Hydrothermal Carbonization of Lignin, Cellulose, d-Xylose, and Wood Meal.” Industrial & Engineering Chemistry Research 51 (26): 9023–31. https://doi.org/10.1021/ie300565d.
Katahira, Rui, Ashutosh Mittal, Kellene McKinney, Peter N. Ciesielski, Bryon S. Donohoe, Stuart K. Black, David K. Johnson, Mary J. Biddy, and Gregg T. Beckham. 2014. “Evaluation of Clean Fractionation Pretreatment for the Production of Renewable Fuels and Chemicals from Corn Stover.” ACS Sustainable Chemistry & Engineering 2 (6): 1364–76. https://doi.org/10.1021/sc5001258.
146
Kitamura, Yoshiaki, Yukiko Abe, and Tsuneo Yasui. 1991. “Metabolism of Levoglucosan (1, 6-Anhydro-α-d-Glucopyranose) in Microorganisms.” Agricultural and Biological Chemistry 55 (2): 515–521.
Layton, Donovan S., Avanthi Ajjarapu, Dong Won Choi, and Laura R. Jarboe. 2011. “Engineering Ethanologenic Escherichia Coli for Levoglucosan Utilization.” Bioresource Technology 102 (17): 8318–22. https://doi.org/10.1016/j.biortech.2011.06.011.
Lédé, Jacques. 2012. “Cellulose Pyrolysis Kinetics: An Historical Review on the Existence and Role of Intermediate Active Cellulose.” Journal of Analytical and Applied Pyrolysis 94 (March): 17–32. https://doi.org/10.1016/j.jaap.2011.12.019.
Lédé, Jacques, Fabrice Blanchard, and Olivier Boutin. 2002. “Radiant Flash Pyrolysis of Cellulose Pellets: Products and Mechanisms Involved in Transient and Steady State Conditions.” Fuel 81 (10): 1269–79. https://doi.org/10.1016/S0016-2361(02)00039-X.
Lee, Sang Hyun, Thomas V. Doherty, Robert J. Linhardt, and Jonathan S. Dordick. 2009. “Ionic Liquid-Mediated Selective Extraction of Lignin from Wood Leading to Enhanced Enzymatic Cellulose Hydrolysis.” Biotechnology and Bioengineering 102 (5): 1368–76. https://doi.org/10.1002/bit.22179.
Liu, Qi, Yun Lu, Mario Aguedo, Nicolas Jacquet, Canbin Ouyang, Wenqing He, Changrong Yan, et al. 2017. “Isolation of High-Purity Cellulose Nanofibers from Wheat Straw through the Combined Environmentally Friendly Methods of Steam Explosion, Microwave-Assisted Hydrolysis, and Microfluidization.” ACS Sustainable Chemistry & Engineering 5 (7): 6183–91. https://doi.org/10.1021/acssuschemeng.7b01108.
Lu, Qiang, Xiao-chu Yang, Chang-qing Dong, Zhi-fei Zhang, Xu-ming Zhang, and Xi-feng Zhu. 2011. “Influence of Pyrolysis Temperature and Time on the Cellulose Fast Pyrolysis Products: Analytical Py-GC/MS Study.” Journal of Analytical and Applied Pyrolysis 92 (2): 430–38. https://doi.org/10.1016/j.jaap.2011.08.006.
Lu, Xin, Kazuchika Yamauchi, Natthanon Phaiboonsilpa, and Shiro Saka. 2009. “Two-Step Hydrolysis of Japanese Beech as Treated by Semi-Flow Hot-Compressed Water.” Journal of Wood Science 55 (5): 367. https://doi.org/10.1007/s10086-009-1040-6.
Luque, Luis, Roel Westerhof, Guus Van Rossum, Stijn Oudenhoven, Sascha Kersten, Franco Berruti, and Lars Rehmann. 2014. “Pyrolysis Based Bio-Refinery for the Production of Bioethanol from Demineralized Ligno-Cellulosic Biomass.” Bioresource Technology 161 (June): 20–28. https://doi.org/10.1016/j.biortech.2014.03.009.
Mante, Ofei D., Thomas E. Amidon, Arthur Stipanovic, and Suresh P. Babu. 2014. “Integration of Biomass Pretreatment with Fast Pyrolysis: An Evaluation of Electron Beam (EB) Irradiation and Hot-Water Extraction (HWE).” Journal of Analytical and Applied Pyrolysis 110 (November): 44–54. https://doi.org/10.1016/j.jaap.2014.08.004.
Maurya, Devendra Prasad, Ankit Singla, and Sangeeta Negi. 2015. “An Overview of Key Pretreatment Processes for Biological Conversion of Lignocellulosic Biomass to Bioethanol.” 3 Biotech 5 (5): 597–609. https://doi.org/10.1007/s13205-015-0279-4.
Moreno, Antonio D., David Ibarra, Pablo Alvira, Elia Tomás-Pejó, and Mercedes Ballesteros. 2015. “A Review of Biological Delignification and Detoxification Methods for Lignocellulosic Bioethanol Production.” Critical Reviews in Biotechnology 35 (3): 342–54. https://doi.org/10.3109/07388551.2013.878896.
Morone, Amruta, and R. A. Pandey. 2014. “Lignocellulosic Biobutanol Production: Gridlocks and Potential Remedies.” Renewable and Sustainable Energy Reviews 37 (September): 21–35. https://doi.org/10.1016/j.rser.2014.05.009.
Mosier, Nathan, Charles Wyman, Bruce Dale, Richard Elander, Y. Y. Lee, Mark Holtzapple, and Michael Ladisch. 2005. “Features of Promising Technologies for Pretreatment of Lignocellulosic Biomass.” Bioresource Technology 96 (6): 673–86. https://doi.org/10.1016/j.biortech.2004.06.025.
Mukarakate, Calvin, Ashutosh Mittal, Peter N. Ciesielski, Sridhar Budhi, Logan Thompson, Kristiina Iisa, Mark R. Nimlos, and Bryon S. Donohoe. 2016. “Influence of Crystal
147
Allomorph and Crystallinity on the Products and Behavior of Cellulose during Fast Pyrolysis.” ACS Sustainable Chemistry & Engineering 4 (9): 4662–74. https://doi.org/10.1021/acssuschemeng.6b00812.
Nhuchhen, Daya Ram, Prabir Basu, and Bishnu Acharya. 2014. “A Comprehensive Review on Biomass Torrefaction.” IBIMA Publishing (blog). 2014. http://ibimapublishing.com/articles/IJREB/2014/506376/.
Nitsos, Christos K., Theodora Choli-Papadopoulou, Konstantinos A. Matis, and Kostas S. Triantafyllidis. 2016. “Optimization of Hydrothermal Pretreatment of Hardwood and Softwood Lignocellulosic Residues for Selective Hemicellulose Recovery and Improved Cellulose Enzymatic Hydrolysis.” ACS Sustainable Chemistry & Engineering 4 (9): 4529–44. https://doi.org/10.1021/acssuschemeng.6b00535.
Nitsos, Christos, Ryan Stoklosa, Anthi Karnaouri, Dimitrij Vörös, Heiko Lange, David Hodge, Claudia Crestini, Ulrika Rova, and Paul Christakopoulos. 2016. “Isolation and Characterization of Organosolv and Alkaline Lignins from Hardwood and Softwood Biomass.” ACS Sustainable Chemistry & Engineering 4 (10): 5181–93. https://doi.org/10.1021/acssuschemeng.6b01205.
Palmqvist, Eva, and Bärbel Hahn-Hägerdal. 2000a. “Fermentation of Lignocellulosic Hydrolysates. I: Inhibition and Detoxification.” Bioresource Technology 74 (1): 17–24. https://doi.org/10.1016/S0960-8524(99)00160-1.
———. 2000b. “Fermentation of Lignocellulosic Hydrolysates. II: Inhibitors and Mechanisms of Inhibition.” Bioresource Technology 74 (1): 25–33. https://doi.org/10.1016/S0960-8524(99)00161-3.
Pan, Xuejun, Neil Gilkes, John Kadla, Kendall Pye, Shiro Saka, David Gregg, Katsunobu Ehara, Dan Xie, Dexter Lam, and Jack Saddler. 2006. “Bioconversion of Hybrid Poplar to Ethanol and Co-Products Using an Organosolv Fractionation Process: Optimization of Process Yields.” Biotechnology and Bioengineering 94 (5): 851–61. https://doi.org/10.1002/bit.20905.
Park, Sunkyu, John O. Baker, Michael E. Himmel, Philip A. Parilla, and David K. Johnson. 2010. “Cellulose Crystallinity Index: Measurement Techniques and Their Impact on Interpreting Cellulase Performance.” Biotechnology for Biofuels 3: 10. https://doi.org/10.1186/1754-6834-3-10.
Peterson, Andrew A., Frédéric Vogel, Russell P. Lachance, Morgan Fröling, Jr Michael J. Antal, and Jefferson W. Tester. 2008. “Thermochemical Biofuel Production in Hydrothermal Media: A Review of Sub- and Supercritical Water Technologies.” Energy & Environmental Science 1 (1): 32–65. https://doi.org/10.1039/B810100K.
Prosen, Elizabeth M., Desmond Radlein, Jan Piskorz, Donald S. Scott, and Raymond L. Legge. 1993. “Communication to the Editor Microbial Utilization of Levoglucosan in Wood Pyrolysate as a Carbon and Energy Source.” Biotechnology and Bioengineering (USA). http://www.researchgate.net/profile/Raymond_Legge/publication/229610577_Microbial_utilization_of_levoglucosan_in_wood_pyrolysate_as_a_carbon_and_energy_source/links/54353b3f0cf2bf1f1f2834c3.pdf.
Qureshi, N., M. J. Bowman, B. C. Saha, R. Hector, M. A. Berhow, and M. A. Cotta. 2012. “Effect of Cellulosic Sugar Degradation Products (Furfural and Hydroxymethyl Furfural) on Acetone–butanol–ethanol (ABE) Fermentation Using Clostridium Beijerinckii P260.” Food and Bioproducts Processing 90 (3): 533–40. https://doi.org/10.1016/j.fbp.2011.09.002.
Ragauskas, Arthur J., Máté Nagy, Dong Ho Kim, Charles A. Eckert, Jason P. Hallett, and Charles L. Liotta. 2006. “From Wood to Fuels: Integrating Biofuels and Pulp Production.” Industrial Biotechnology 2 (1): 55–65. https://doi.org/10.1089/ind.2006.2.55.
Ragauskas, Arthur J., Charlotte K. Williams, Brian H. Davison, George Britovsek, John Cairney, Charles A. Eckert, William J. Frederick, et al. 2006. “The Path Forward for Biofuels and Biomaterials.” Science 311 (5760): 484–89. https://doi.org/10.1126/science.1114736.
Rover, Marjorie R., Patrick A. Johnston, Buddhi P. Lamsal, and Robert C. Brown. 2013. “Total Water-Soluble Sugars Quantification in Bio-Oil Using the Phenol–sulfuric Acid Assay.”
148
Journal of Analytical and Applied Pyrolysis 104 (November): 194–201. https://doi.org/10.1016/j.jaap.2013.08.004.
Sadeghifar, Hasan, Tyrone Wells, Rosemary Khuu Le, Fatemeh Sadeghifar, Joshua S. Yuan, and Arthur Jonas Ragauskas. 2017. “Fractionation of Organosolv Lignin Using Acetone:Water and Properties of the Obtained Fractions.” ACS Sustainable Chemistry & Engineering 5 (1): 580–87. https://doi.org/10.1021/acssuschemeng.6b01955.
Sasaki, Mitsuru, Kohtaro Goto, Kiyohiko Tajima, Tadafumi Adschiri, and Kunio Arai. 2002. “Rapid and Selective Retro-Aldol Condensation of Glucose to Glycolaldehyde in Supercritical Water” 4 (3): 285–87. https://doi.org/10.1039/B203968K.
Sasaki, Mitsuru, Bernard Kabyemela, Roberto Malaluan, Satoshi Hirose, Naoko Takeda, Tadafumi Adschiri, and Kunio Arai. 1998. “Cellulose Hydrolysis in Subcritical and Supercritical Water.” The Journal of Supercritical Fluids 13 (1–3): 261–68. https://doi.org/10.1016/S0896-8446(98)00060-6.
Shafizadeh, Fred, Richard H. Furneaux, Todd G. Cochran, Jackson P. Scholl, and Yoshio Sakai. 1979. “Production of Levoglucosan and Glucose from Pyrolysis of Cellulosic Materials.” Journal of Applied Polymer Science 23 (12): 3525–39. https://doi.org/10.1002/app.1979.070231209.
Shi, Ning, Qiying Liu, Tiejun Wang, Longlong Ma, Qi Zhang, and Qing Zhang. 2014. “One-Pot Degradation of Cellulose into Furfural Compounds in Hot Compressed Steam with Dihydric Phosphates.” ACS Sustainable Chemistry & Engineering 2 (4): 637–42. https://doi.org/10.1021/sc400515x.
Siqueira, Germano, Anikó Várnai, André Ferraz, and Adriane M. F. Milagres. 2013. “Enhancement of Cellulose Hydrolysis in Sugarcane Bagasse by the Selective Removal of Lignin with Sodium Chlorite.” Applied Energy, Special Issue on Advances in sustainable biofuel production and use - XIX International Symposium on Alcohol Fuels - ISAF, 102 (February): 399–402. https://doi.org/10.1016/j.apenergy.2012.07.029.
Sivagurunathan, Periyasamy, Gopalakrishnan Kumar, Ackmez Mudhoo, Eldon R. Rene, Ganesh Dattatraya Saratale, Takuro Kobayashi, Kaiqin Xu, Sang-Hyoun Kim, and Dong-Hoon Kim. 2017. “Fermentative Hydrogen Production Using Lignocellulose Biomass: An Overview of Pre-Treatment Methods, Inhibitor Effects and Detoxification Experiences.” Renewable and Sustainable Energy Reviews 77 (September): 28–42. https://doi.org/10.1016/j.rser.2017.03.091.
Sluiter, A., B. Hames, R. Ruiz, C. Scarlata, J. Sluiter, D. Templeton, and D. Crocker. 2012. “NREL-Determination of Structural Carbohydrates and Lignin in Biomass.” http://www.nrel.gov/docs/gen/fy13/42618.pdf.
Smichi, Neila, Yosra Messaoudi, and Mohamed Gargouri. 2017. “Lignocellulosic Biomass Fractionation: Production of Ethanol, Lignin and Carbon Source for Fungal Culture.” Waste and Biomass Valorization, March, 1–10. https://doi.org/10.1007/s12649-017-9859-3.
Tolonen, Lasse K., Minna Juvonen, Klaus Niemelä, Atte Mikkelson, Maija Tenkanen, and Herbert Sixta. 2015. “Supercritical Water Treatment for Cello-Oligosaccharide Production from Microcrystalline Cellulose.” Carbohydrate Research 401 (January): 16–23. https://doi.org/10.1016/j.carres.2014.10.012.
Tolonen, Lasse K., Gerhard Zuckerstätter, Paavo A. Penttilä, Walter Milacher, Wilhelm Habicht, Ritva Serimaa, Andrea Kruse, and Herbert Sixta. 2011. “Structural Changes in Microcrystalline Cellulose in Subcritical Water Treatment.” Biomacromolecules 12 (7): 2544–51. https://doi.org/10.1021/bm200351y.
Viell, Jörn, Andreas Harwardt, Jan Seiler, and Wolfgang Marquardt. 2013. “Is Biomass Fractionation by Organosolv-like Processes Economically Viable? A Conceptual Design Study.” Bioresource Technology 150 (Supplement C): 89–97. https://doi.org/10.1016/j.biortech.2013.09.078.
149
Wu, Kai, Zhengjun Shi, Haiyan Yang, Zhengdiao Liao, and Jing Yang. 2017. “Effect of Ethanol Organosolv Lignin from Bamboo on Enzymatic Hydrolysis of Avicel.” ACS Sustainable Chemistry & Engineering 5 (2): 1721–29. https://doi.org/10.1021/acssuschemeng.6b02475.
Yang, Dong, Lin-Xin Zhong, Tong-Qi Yuan, Xin-Wen Peng, and Run-Cang Sun. 2013. “Studies on the Structural Characterization of Lignin, Hemicelluloses and Cellulose Fractionated by Ionic Liquid Followed by Alkaline Extraction from Bamboo.” Industrial Crops and Products 43 (May): 141–49. https://doi.org/10.1016/j.indcrop.2012.07.024.
Yoo, Chang Geun, Mi Li, Xianzhi Meng, Yunqiao Pu, and Arthur J. Ragauskas. 2017. “Effects of Organosolv and Ammonia Pretreatments on Lignin Properties and Its Inhibition for Enzymatic Hydrolysis.” Green Chemistry 19 (8): 2006–16. https://doi.org/10.1039/C6GC03627A.
Yu, Yun, Xia Lou, and Hongwei Wu. 2008. “Some Recent Advances in Hydrolysis of Biomass in Hot-Compressed Water and Its Comparisons with Other Hydrolysis Methods.” Energy & Fuels 22 (1): 46–60. https://doi.org/10.1021/ef700292p.
Yu, Yun, and Hongwei Wu. 2009. “Characteristics and Precipitation of Glucose Oligomers in the Fresh Liquid Products Obtained from the Hydrolysis of Cellulose in Hot-Compressed Water.” Industrial & Engineering Chemistry Research 48 (23): 10682–90. https://doi.org/10.1021/ie900768m.
———. 2010a. “Understanding the Primary Liquid Products of Cellulose Hydrolysis in Hot-Compressed Water at Various Reaction Temperatures.” Energy & Fuels 24 (3): 1963–71. https://doi.org/10.1021/ef9013746.
———. 2010b. “Significant Differences in the Hydrolysis Behavior of Amorphous and Crystalline Portions within Microcrystalline Cellulose in Hot-Compressed Water.” Industrial & Engineering Chemistry Research 49 (8): 3902–9. https://doi.org/10.1021/ie901925g.
Yu, Zhiying, Hasan Jameel, Hou-min Chang, and Sunkyu Park. 2011. “The Effect of Delignification of Forest Biomass on Enzymatic Hydrolysis.” Bioresource Technology 102 (19): 9083–89. https://doi.org/10.1016/j.biortech.2011.07.001.
Yuan, Tong-Qi, Feng Xu, and Run-Cang Sun. 2013. “Role of Lignin in a Biorefinery: Separation Characterization and Valorization.” Journal of Chemical Technology & Biotechnology 88 (3): 346–52. https://doi.org/10.1002/jctb.3996.
Zhao, Yan, Wen-Jing Lu, Hong-Tao Wang, and Dong Li. 2009. “Combined Supercritical and Subcritical Process for Cellulose Hydrolysis to Fermentable Hexoses.” Environmental Science & Technology 43 (5): 1565–70. https://doi.org/10.1021/es803122f.
Zhu, Shengdong, Yuanxin Wu, Qiming Chen, Ziniu Yu, Cunwen Wang, Shiwei Jin, Yigang Ding, and Gang Wu. 2006. “Dissolution of Cellulose with Ionic Liquids and Its Application: A Mini-Review” 8 (4): 325–27. https://doi.org/10.1039/B601395C.

150
151
II. Biological conversion of cellulose-
derived products
This section deals with the study of the fermentation of cellulose-derived sugars by C.
acetobutylicum. Two articles present the results found for this purpose.
In the first article, model sugars were used to study the response of C. acetobutylicum when the
carbon source is a mixture of glucose and cellobiose, that represent mixtures obtained from
cellulose hydrolysis.
In the second article, the fermentation of cellulose-derived sugar mixtures by C. acetobutylicum is
studied. Firstly, sugar mixture obtained by microcrystalline cellulose hydrothermal liquefaction
is studied to identify the order of utilization of the different carbohydrates. Moreover, the yields
in building blocks obtained with substrates produced from the liquefaction of real biomasses (i.e.
beech, organosolv and SC/AA pulps) are reported.
152
In this article the utilization of glucose and cellobiose mixtures by C. acetobutylicum was studied.
The main objective is to identify the behavior of C. acetobutylicum when the carbon source is a
mixture of glucose and cellobiose and its fermentation pattern. The effect of the pre-culture
substrate on the cell growth was also studied. This work provides useful information to establish
the best conditions for the fermentation of cellulose-derived sugars.
1. Article 3:
Diauxic growth of Clostridium acetobutylicum
ATCC 824 when grown on mixtures of glucose and
cellobiose
Article accepted to Applied Microbiology and Biotechnology Express (AMB Express).
ABSTRACT
Clostridium acetobutylicum, a promising organism for biomass transformation, has the capacity to
utilize a wide variety of carbon sources. During pre-treatments of (ligno) cellulose through
thermic and/or enzymatic processes, complex mixtures of oligo saccharides with beta 1,4-
glycosidic bonds can be produced.
In this paper, the capability of C. acetobutylicum to ferment glucose and cellobiose, alone and in
mixtures was studied. Kinetic studies indicated that a diauxic growth occurs when both glucose
and cellobiose are present in the medium
In mixtures, D-glucose is the preferred substrate even if cells were pre grown with cellobiose as
the substrate. After the complete consumption of glucose, the growth kinetics exhibits an
adaptation time, of few hours, before to be able to use cellobiose. Because of this diauxic
phenomenon, the nature of the carbon source deriving from a cellulose hydrolysis pre-treatment
153
could strongly influence the kinetic performances of a fermentation process with C.
acetobutylicum.
Key words: Biomass, cellulose, cellobiose, diauxie, fermentation, Clostridium acetobutylicum.
1.1. Introduction
Lignocellulosic biomass represents an interesting alternative to fossil carbon resources
(McKendry 2002; Mosier et al. 2005; Wyman et al. 2005; Briens et al. 2008; Wettstein et al. 2012;
Nanda et al. 2014).
Indeed, lignocellulosic biomass can be transformed into energy and fuels through a
variety of chemical, thermo-chemical and biological conversion processes. , Among biological
conversion processes, anaerobic digestion and more specifically fermentation processes are the
most implemented in industries (Lin and Tanaka 2005; Azman et al. 2015), because it offers the
most important biological conversion ways to transform a wide variety of organic materials
mainly coming from agroindustry such as by-products into fuels and chemical products with
higher values (McKendry 2002; Briens et al. 2008, Turon et al. 2016). However, fermentation
processes need an efficient monitoring and control to ensure optimal conditions for productions
and yields (Lin and Tanaka 2005; Azman et al. 2015).
Bioethanol, one of the main fermentation products, is predominantly produced using yeast
through the fermentation of easily degradable carbohydrate substrates, such as corn starch and
sugar cane (Henstra et al. 2007). Nonetheless, the utilization of these kinds of substrates to
produce biofuels threatens food supplies and biodiversity. For this reason, the production of
new generation biofuels using bacteria may offer an interesting alternative to this problem
(Ranjan and Moholkar 2012; Morone and Pandey 2014). As an alternative, some Clostridium
species can produce Acetone-Butanol-Ethanol (ABE) from renewable resources, such as biomass
and derivatives (Lee et al. 2008a; Tracy et al. 2012; Jang et al. 2012; Gu et al. 2014). Butanol can
154
be blended with gasoline or used directly as a fuel for transportation (Qureshi and Ezeji 2008;
Pfromm et al. 2010; Ranjan and Moholkar 2012). For this purpose, a diversity of Clostridium
strains coming from the butyric and butylic groups has been studied (C.
saccharoperbutylacetonicum, C. acetobutylicum, C. beijerinckii, C. butyricum)(Lee et al. 2008a; Jang et
al. 2012; Gu et al. 2014).
C. acetobutylicum is one of the most studied species thanks to its capability of producing
butanol and hydrogen by anaerobic fermentation in high yields, from a wide range of
substrates (Qureshi and Ezeji 2008; Survase et al. 2011b; Napoli et al. 2011; Li et al. 2012; Jurgens
et al. 2012; Gao et al. 2014; Aristilde et al. 2015; Raganati et al. 2015). This strain was largely used
in the ABE fermentation process during the 1910s until the end of 1950s, because the
petrochemical industry development led to the decline of this fermentation as an industrial
process (Jones and Woods 1986). An important feature of the ABE fermentation is its biphasic
development leading to two distinct groups of metabolic products. The first phase is the
acidogenesis, which is characteristized by acids (mainly butyric, acetic and lactic acid) and
hydrogen production. During acidogenesis, the cells will usually display an active growth
including an exponential growth phase (Anderschet al. 1983; Hartmanis and Gatenbeck 1984).
The second phase is the solventogenesis, which is characteristized by organic acids re-
assimilation and solvent production, with butanol, acetone and ethanol as the major products
(Monot et al. 1984). The transition between the two phases is the result of strong gene
expression changes (Grupe and Gottschalk 1992; Girbal et al. 1995).Nowadays, with the
depletion of oil, renewable processes to replace fossil carbon need to be developed. But, a major
factor that determines the viability of this process is the cost of feedstock. In this regard,
lignocellulosic biomasses are considered as interesting feedstocks for fermentation (Ezeji et al.
2007; Jang et al. 2012), Whereas its complex structure composed of cellulose embedded in a
complex hemicellulose and lignin matrix may hinder biological conversion due to a high
155
resistance to most chemical and biological pretreatments (Wyman et al. 2005; Kumar et al. 2009;
Rinaldi and Schüth 2009; Hendriks and Zeeman 2009; Alvira et al. 2010; Jurgens et al. 2012).
To enhance the fermentability of cellulose a preliminary treatment is frequently used.
Chemical, thermal and enzymatic pre-treatments allow to produce a mixture of carbohydrates
and other organic compounds that are soluble and accessible to bacteria (Kumar et al. 2009;
Rinaldi and Schüth 2009; Alvira et al. 2010; Ibrahim et al. 2015). The conversion of each one of
these compounds into added-value products and building blocks is crucial to increase the
efficiency of an integrated bio-refinery, and the understanding the metabolism of individual
carbohydrates and mixtures is very important to lower the cost of fermentation process. This
and the ability of saccharolytic clostridia to use a wide range of carbohydrates have prompted
research dedicated to the production of a cheaper substrates (Jones and Woods 1986; Lee et al.
2008a; Tracy et al. 2012; Gu et al. 2014).
In addition, the growth of C. acetobutylicum on a mixture of substrates has been already
studied using different combinations of carbon sources (glucose and xylose, glucose and
mannose, D-glucose and glycerol, …) and different metabolic responses were obtained
according to the nutritional environment (Mes-Hartree and Saddler 1982; Ounine et al. 1985;
Fond et al. 1986; Vasconcelos et al. 1994; Mitchell et al. 1995; Survase et al. 2011a). Recently, the
interest in C. acetobutylicum as un effective biofuel producer of butanol instead of ethanol from
lignocellulose derivated substrates (glucose, cellobiose and xylose) has increased, resulting in
numerous studies privileging mainly butanol production from xylose alone or in mixture with
glucose rather than with cellobiose (Patakova et al., 2013; Nogué and Karhumaa, 2014; Raganati
et al., 2015; Zhao et al., 2016) whereas this last substrate with glucose and other cello-
oligosaccharides in mixture would be also expected to be major products of lignocellulose
degradation.
Indeed, despite a recent proteomic study describing the influence of lignin in the
metabolic behavior of C. acetobutylicum ATCC 824 with cellobiose as the substrate (Raut et al.,
156
2016), the capability of Clostridium strains to ferment mixtures of cellobiose and glucose in
synthetic medium is not well studied yet. Furthermore, bacteria have developed mechanisms
that allow them to use selectively mixtures of different carbon sources (Mitchell et al. 1995).
In this study, kinetics of C. acetobutylicum cultivated with glucose and/or cellobiose, two
substrate models representatives of cellulose hydrolysis products were compared. Only the
acidogenic phase in which the active growth phase and substrate consumptions could be
studied was considered. Transitions and re-assimilation of acids mechanisms were excluded
from this work.
1.2. Materials and Methods
1.2.1. Microorganism and media
Spores of Clostridium acetobutylicum ATCC 824 were maintained in Difco™ Reinforced
Clostridial Medium (RCM) at ambient temperature. Whereas precultures were different for
each culture experiment, they were prepared rigorously in a similar way. Each experiment was
started with the spores of C. acetobutylicum. The spore culture was diluted to a concentration of
10% in 10 mL of RCM fresh media (Hungate tubes) and then heat shocked at 80℃ for 20 min to
induce germination. Reactivated cultures were incubated in fresh RCM medium at 37℃ for 12h
and then transferred into 30 mL (pre-culture tubes) of a synthetic medium. In fact, the volume
of preculture was prepared depending of the final volume of culture in order to get a ratio of
1/4. The synthetic medium was composed of 20 g/L glucose, 0.5 g/L KH2PO4, 1.5 g/L
(NH4)2SO4, 1 g/L MgCl2, 0.15 g/L CaCl2, 1.5 g/L yeast extract, 0.01 g/L FeSO4.7H2O, 0.01 g/L
MnSO4.H2O, 3 g/L CaCO3, 4x10⁻⁵ g/L biotin. All the Chemicals, yeast extract and biotin were
provided by Sigma Aldrich.
157
1.2.2. Fermentation
Batch fermentations were carried out in a bioreactor controlled by an Applikon ADI
1030 bio controller (Applikon Biotechnology). Throughout all fermentation experiments,
temperature was maintained at 37℃ and pH at 5.5 by the automatic addition of 3N NaOH, 1N
HCl using the biocontroler and a pH probe (Mettler Toledo). The bioreactor was initially
purged with nitrogen to ensure an anaerobic atmosphere and then inoculated with 6% (v/v)
active growing pre-cultures into 1.5 L of synthetic media with the same composition of the pre-
culture media (without CaCO3 to prevent interference with DO measurements). The glucose
concentrations for the fermentation studies were comprised between 25 - 35 g/L (138 – 195
mM), unless otherwise indicated. Other experiments with cellobiose were carried out with the
same glucose-equivalent mass concentration. However, controlling residual substrate from pre-
culture was not possible. For this reason, the initial substrate concentration was not exactly the
same. These variations did not alter the study case and the desired results. Each experience was
carried out until complete substrate consumption. All the experiments were performed at least
in duplicate.
1.2.3. Analyses
Cell density was measured at 600 nm using a spectrophotometer (HITACHI U-2000).
The relationship between the cell dry weight and the optical density was established thanks to a
calibration made by triplicate using spectrophotometer at 600 nm. The correlation factor found
was 0.346 g/L cell dry weight per unity of absorbance. This value was in agreement with others
related in the literature (Kim et al. 1984)
Glucose, cellobiose, acetone, ethanol, butanol, acetic acid, lactic acid and butyric acid
concentrations were measured by high-performance liquid chromatography equipped with a
refractive index detector and an ultraviolet-visible spectroscopy (HPLC-RID-UV) using a
158
Aminex HPX 87h column. The samples were filtered with a 0.2 µm filter and the injection
volume was 10 µL. The oven kept the column at 45ᵒC; the mobile phase was a 25mM sulfuric
acid (H2SO4) solution. The analysis time was 35 min in isocratic mode.
1.2.4. Calculations
The main products of glucose or cellobiose fermentation by C. cellulolyticum were acetate,
Butyrate, ethanol, butanol, acetone, lactate, H2, and CO2, as previously described (Vasconcelos et
al., 1994) Carbon recoveries were calculated from the production of metabolites, and biomass,
present in the supernatant. Biomass was taken into account on the basis of the cell dry weight
and a mean biomass formula of C4H7O2N (Guedon et al. 1999). According to the metabolic scheme
(Vasconcelos, et al.,1994),the conversion of glucose to products can be written as follows:
glucose + 2 ADP + 2 NADH → 2 ethanol +2 ATP + 2 NAD+ + 2 CO2 + 2 H2
glucose + 4 ADP + 2 NAD+ → 2 acetate + 4 ATP + 2 NADH + 2 CO2 + 2 H2
glucose + 3 ADP → butyrate + 3 ATP + 2 NADH + 2 CO2 + 2 H2
glucose + 2 ADP + 2 NADH → butanol + 2 ATP + 2 NAD+ + 2 CO2 + 2 H2
glucose + 2 ADP + 2 NAD+ → acetone + 3 ATP + 2 NADH + 3 CO2 + 2 H2
For example, from the last stoichiometric equation, each acetone molecule produced is associated
to the formation of 3 CO2 molecules. Therefore, the CO2 production was calculated on the basis
of product formation, as the sum of [acetate], 2*[butyrate], [ethanol], 2*[butanol], and 3*[acetone]
concentrations.
CO2 production was calculated as the sum of [acetate], 2*[butyrate], [ethanol],
2*[butanol], and 3*[acetone] concentrations.
1.3. Results
159
1.3.1. General growth and metabolic features of Clostridium acetobutylicum ATCC 824
cultivated with glucose or cellobiose
kinetics of growth and metabolism of C acetobutylicum with glucose or cellobiose as the carbon
and energy source were performed with precultures carried out with either glucose or cellobiose
(figure 1). Pre cultures and cultures performed with the same carbon source were compared with
precultures and cultures performed with the switched substrates. The pH was set at 5.5 in order
to favor acidogenesis, resulting In butyric, acetic and lactic acids, as the main products whatever
the substrate used
The carbon balances for these experiments were comprised between 90 and 98%,
indicating that most of the carbon substrates and products have been taken into account.
Therefore, resulting kinetics can be fully interpreted.
Figure 1a shows the growth kinetic of C. acetobutylicum on glucose inoculated with a
preculture grown with the same substrate. Taking into account the residual substrate coming
from the preculture, the initial glucose concentration was 136 mM (25 g/L). After approximately
13 h of culture, all the glucose was completely consumed and no lag phase was observed since
the culture rapidly entered in exponential phase. In these experimental conditions, a maximal
specific growth rate (µmax) of 0.26 h-1 was reached after 3 hours of culture whereas a maximal cell
concentration of 2.36 g/L (dry cell weight) was obtained when glucose was entirely depleted.
Glucose fermentation by C. acetobutylicum was accompanied by the accumulation of acidic
products (figure 1d) such as butyric, acetic and lactic acid up to 74mM, 40 mM and 9 mM
respectively, whereas butanol was a minor product with a production of only 8 mM.
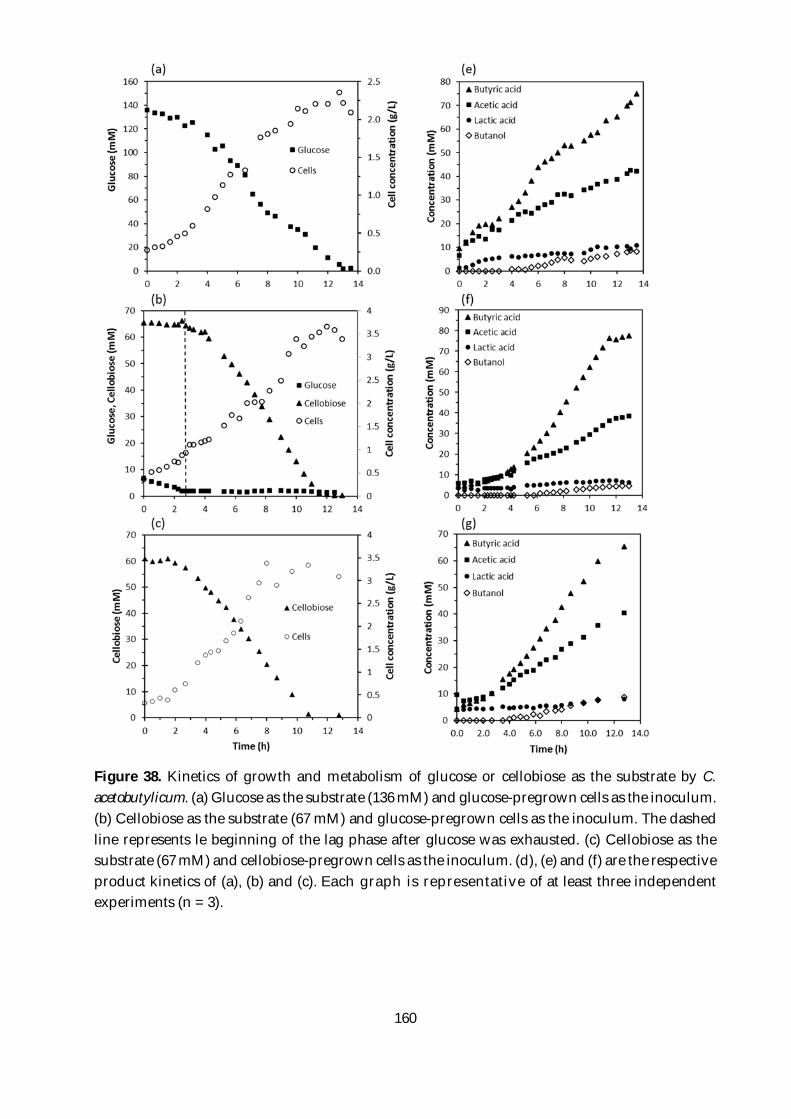
160
Figure 38. Kinetics of growth and metabolism of glucose or cellobiose as the substrate by C. acetobutylicum. (a) Glucose as the substrate (136 mM) and glucose-pregrown cells as the inoculum. (b) Cellobiose as the substrate (67 mM) and glucose-pregrown cells as the inoculum. The dashed line represents le beginning of the lag phase after glucose was exhausted. (c) Cellobiose as the substrate (67 mM) and cellobiose-pregrown cells as the inoculum. (d), (e) and (f) are the respective product kinetics of (a), (b) and (c). Each graph is representative of at least three independent experiments (n = 3).
161
Figure 38b and c report the growth kinetics of of C. acetobutilycum with cellobiose (67
and 61 mM respectively) as the carbon and energy source, and with glucose or cellobiose as the
respective preculture substrates.
When inoculated with a preculture cultivated with glucose, an immediate and short growth
phase occurred during the 3 first hours of culture (Figure 38b). During this phase, no cellobiose
was used, whereas glucose coming from preculture (7.2 mM) was completely exhausted. Then,
the consumption of cellobiose by C. acetobutylicum occurred until exhaustion and was associated
with an active cell growth.
Interestingly, as indicated by the dashed line (Figure 38b), the use of cellobiose was
accompanied by a short lag phase during approximately 2 hours after glucose exhaustion. Then
the growth of C. acetobutylicum started and reached a µmax of 0.21 h-1 and maximal biomass
concentration of 3.7 g/L after 12 hours of culture.
As observed during fermentation kinetics performed with glucose in Figure 38a, the
product pattern obtained with cellobiose as the carbon source and with glucose as the
preculture substrate (Figure 38e) is similar since butyric (76 mM), acetic (35 mM) and lactic
acids (5.5 mM) were the main products at the end of the culture whereas butanol accumulated
at a low concentration.
Figure 38c displays the growth kinetic of C. acetobutylicum with cellobiose as the substrate
(61 mM) after an inoculation with a preculture grown with cellobiose. In less than 11 hours, all
the cellobiose was fully consumed by C. acetobutylicum, resulting in an active cell growth without
apparent lag phase. In these conditions, a µmax of 0.23 h-1 and a maximal cell concentration of 3.4
g/L after 8 hours of culture were observed. Similarly to the previous kinetics (Figure 38a, b), the
product pattern obtained with cellobiose as the carbon source in the fermentation broth and in
precultures (Figure 38f) are similar (Figure 38d, e), indicating that neither the carbon source in
precultures, nor the carbon source in cultures have an influence on the carbon distribution during
fermentation.
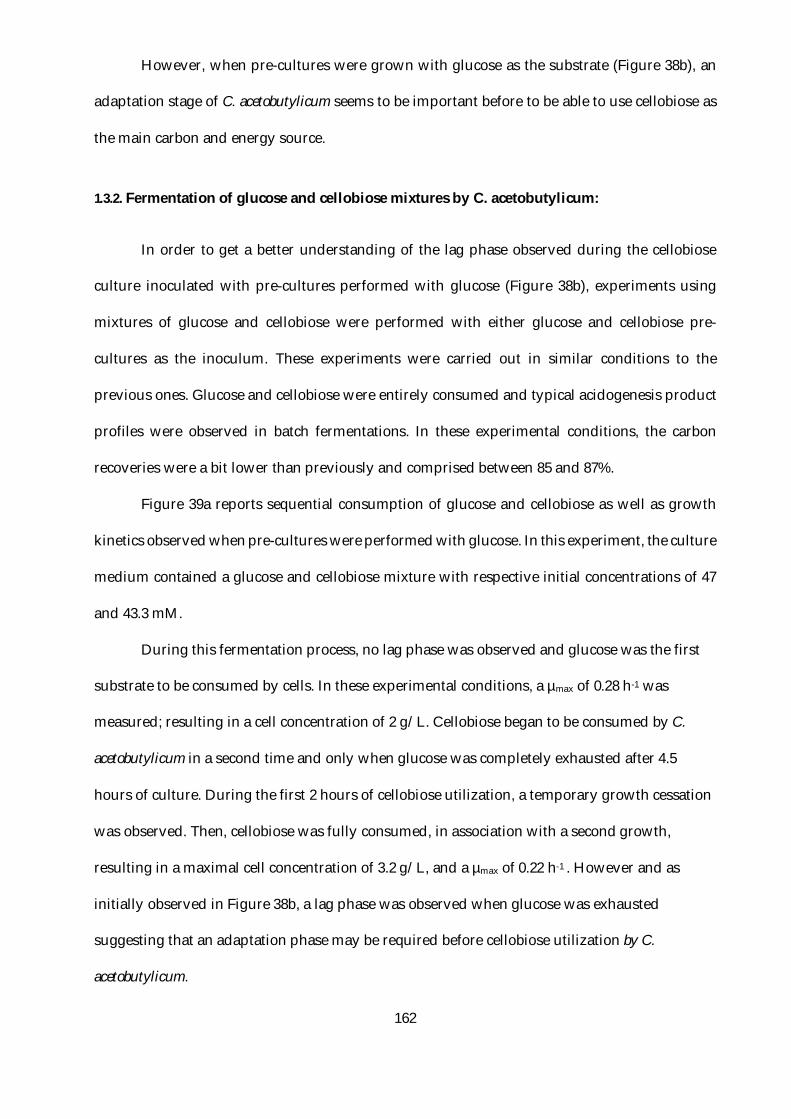
162
However, when pre-cultures were grown with glucose as the substrate (Figure 38b), an
adaptation stage of C. acetobutylicum seems to be important before to be able to use cellobiose as
the main carbon and energy source.
1.3.2. Fermentation of glucose and cellobiose mixtures by C. acetobutylicum:
In order to get a better understanding of the lag phase observed during the cellobiose
culture inoculated with pre-cultures performed with glucose (Figure 38b), experiments using
mixtures of glucose and cellobiose were performed with either glucose and cellobiose pre-
cultures as the inoculum. These experiments were carried out in similar conditions to the
previous ones. Glucose and cellobiose were entirely consumed and typical acidogenesis product
profiles were observed in batch fermentations. In these experimental conditions, the carbon
recoveries were a bit lower than previously and comprised between 85 and 87%.
Figure 39a reports sequential consumption of glucose and cellobiose as well as growth
kinetics observed when pre-cultures were performed with glucose. In this experiment, the culture
medium contained a glucose and cellobiose mixture with respective initial concentrations of 47
and 43.3 mM.
During this fermentation process, no lag phase was observed and glucose was the first
substrate to be consumed by cells. In these experimental conditions, a µmax of 0.28 h-1 was
measured; resulting in a cell concentration of 2 g/L. Cellobiose began to be consumed by C.
acetobutylicum in a second time and only when glucose was completely exhausted after 4.5
hours of culture. During the first 2 hours of cellobiose utilization, a temporary growth cessation
was observed. Then, cellobiose was fully consumed, in association with a second growth,
resulting in a maximal cell concentration of 3.2 g/L, and a µmax of 0.22 h-1 . However and as
initially observed in Figure 38b, a lag phase was observed when glucose was exhausted
suggesting that an adaptation phase may be required before cellobiose utilization by C.
acetobutylicum.
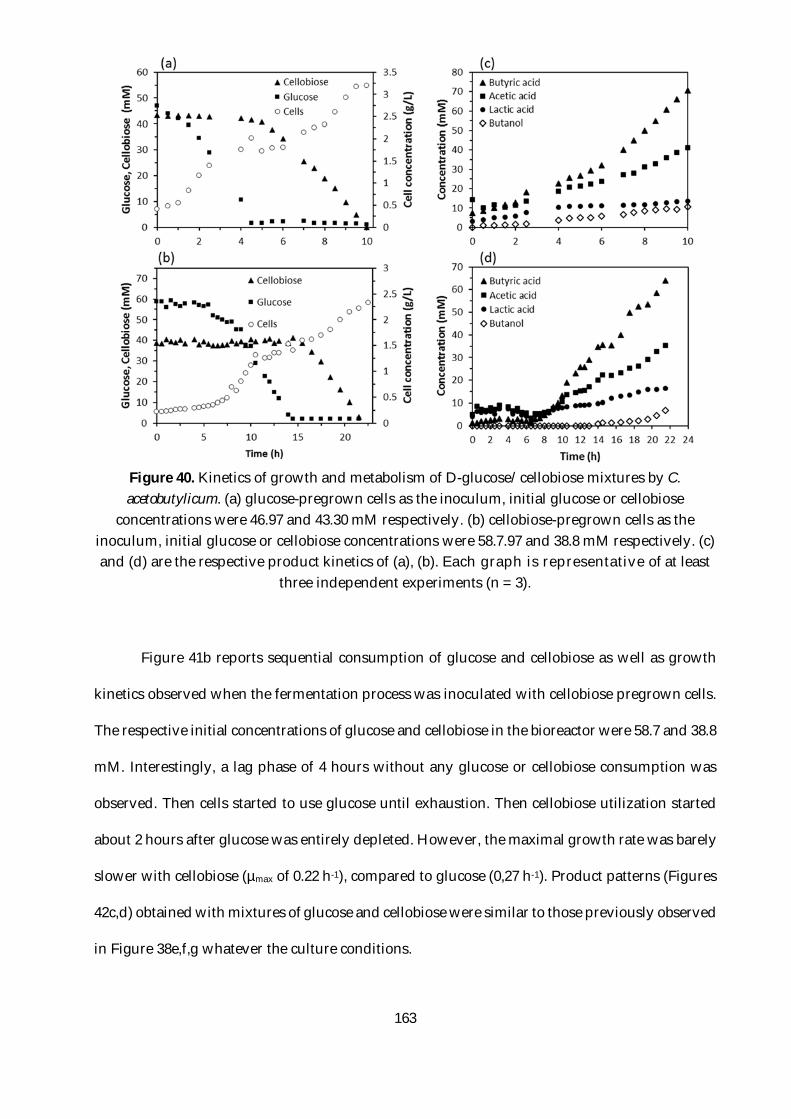
163
Figure 40. Kinetics of growth and metabolism of D-glucose/cellobiose mixtures by C. acetobutylicum. (a) glucose-pregrown cells as the inoculum, initial glucose or cellobiose
concentrations were 46.97 and 43.30 mM respectively. (b) cellobiose-pregrown cells as the inoculum, initial glucose or cellobiose concentrations were 58.7.97 and 38.8 mM respectively. (c) and (d) are the respective product kinetics of (a), (b). Each graph is representative of at least
three independent experiments (n = 3).
Figure 41b reports sequential consumption of glucose and cellobiose as well as growth
kinetics observed when the fermentation process was inoculated with cellobiose pregrown cells.
The respective initial concentrations of glucose and cellobiose in the bioreactor were 58.7 and 38.8
mM. Interestingly, a lag phase of 4 hours without any glucose or cellobiose consumption was
observed. Then cells started to use glucose until exhaustion. Then cellobiose utilization started
about 2 hours after glucose was entirely depleted. However, the maximal growth rate was barely
slower with cellobiose (µmax of 0.22 h-1), compared to glucose (0,27 h-1). Product patterns (Figures
42c,d) obtained with mixtures of glucose and cellobiose were similar to those previously observed
in Figure 38e,f,g whatever the culture conditions.
164
In this study, results strongly suggest that glucose is definitely the preferred substrate,
since it is always used in first place, even if pre-cultures were performed with cellobiose are
exposed to a mixture of glucose and cellobiose. However, glucose consumption does not start
immediately a lag phase is always observed when carbon substrates in pre cultures and in
cultures are different, suggesting that a physiological adaptation may occur, resulting in a
growth cessation. In fact, glucose and cellobiose are able to influence the consumption of each
other by C. acetobutylicum.
1.4. Discussion
In this study, fermentations of glucose and/or cellobiose by C. acetobutylicum were
performed in batch mode. Mono-substrate cultures showed that C. acetobutylicum is able to grow
with cellobiose as efficiently as with glucose.
With glucose as the substrate, kinetics of growth, substrate consumption and products
formation were in good agreement with previous studies (Jones and Woods 1986b; Girbal et al.
1995). Interestingly, no major difference was observed when cellobiose was the sole carbon
substrate: specific growth rates measured with both substrate were almost similar, and no
significant change in fermentation patterns (acidogenic phase) was observed. In fact, little was
known about the cellobiose metabolism by C. acetobutylicum and such a study was never deeply
investigated so far. Indeed, only studies dedicated to enzymatic activities expressed by C.
acetobutylicum during the fermentation of cellobiose were reported in the literature (Allcock and
Woods 1981; Mes-Hartree and Saddler 1982; Lee et al.1985; López-Contreras et al. 2000
However, and contrary to C. thermocellum (Weimer and Zeikus 1977), cultures grown on
glucose/cellobiose mixtures demonstrated that C. acetobutylicum was unable to co-utilize both
substrates at the same time and glucose was consistently the preferred carbon source. In the
present work, growth cessations were always observed after glucose exhaustion and before
cellobiose utilization, resulting in a second growth phase.
165
This phenomenon was reported for the first time by (Monod 1942), and was called
“diauxie”. It is nowadays better known under the generic term of catabolic repression since some
substrates have the ability to repress the expression of genes encoding catabolic enzymes and/or
protein transporters, as already described in bacterial species (Magasanik 1961; Brückner and
Titgemeyer 2002; Deutscher, Francke, and Postma 2006; Deutscher 2008; Görke and Stülke 2008)
but these mechanisms are not the same for each strain and their complete characterization is still
being studied.
Besides, the effect of carbon source on cell growth and fermentation products by C.
acetobutylicum has been previously studied for different mixtures (Vasconcelos et al. 1994). In
continuous cultures, C. acetobutylicum grown with glucose at neutral pH, produced only acids. In
the same conditions, but with substrate mixtures of glucose and glycerol, alcohols were produced
in higher yields but no catabolic repression was observed with these carbon sources. However,
the repression of lactose transport system by glucose (Yu et al. 2007) as well as diauxic growths
of C. acetobutylicum cultivated on mixtures of xylose and glucose (Jiang et al. 2014) have been
reported, demonstrating that these mechanisms are of a great importance and participate to the
control of carbon catabolic fluxes of cells depending on the nature of carbon sources.
In this study, similar mechanisms could be involved according to our results. Indeed, two
putative PTSs (phosphotransferase systems) operon genes, strongly induced by cellobiose with
functions connected to cellobiose metabolism, were reported by Servinsky et al. (2010),
suggesting that C. acetobutylicum displays multiple mechanisms to import, phosphorylate and
hydrolyse B-glucosides for entry into glycolyse. Besides, the similarity of the C. acetobutylicum
PTS to PTSs found in other well characterized low GC gram positive bacteria, has led to the
suggestion that they may also play a role in carbon catabolite repression (Behrens et al., 2001;
Saier and Reizer, 1992; Singh et al., 2008; Tangney et al., 2003).This hypothesis was reinforced by
the fact that a recent proteomic study revealed that such PTS operons, especially those involved
in cellobiose uptake in C. acetobutylicum was shown to be down regulated in the presence of lignin
166
residues, in mixture with cellobiose (Raut et al., 2016). In this study, our results suggests that an
analogous phenomenon may exist that was never reported for C. acetobutylicum when cultivated
with mixtures of glucose and cellobiose, and therefore is an original contribution to the
comprehension of carbohydrate metabolism by Clostridial sp.
Besides, diauxic growths observed during the kinetic studies may have a great importance
for ABE fermentation processes of pretreated (ligno) cellulosic biomass. From a technological
point of view, this observation may be of critical importance if industrial substrates mixes were
to be used for hydrogen and/or other chemical precursor productions by C. acetobutylicum, since
substrate consumption discontinuities could occur and may affect production performances and
productivities of processes
More studies with other complex mixtures of cellulosic derivatives as well as with various
operating conditions will help to understand how C. acetobutylicum can manage its carbohydrate
metabolism in order to perform an efficient ABE production process.
List of abbreviations ATCC: American Type Culture Collection ABE: Acetone-Butanol-Ethanol PTS: Phosphotransferase System RCM: Reinforced Clostridial Medium 1.5. References
Allcock ER, Woods DR (1981) Carboxymethyl cellulase and cellobiase production by Clostridium acetobutylicum in an industrial fermentation medium. Appl Environ Microbiol 41(2):539-41.
Alvira P, Tomás-Pejó E, Ballesteros M, Negro MJ (2010) Pretreatment technologies for an efficient bioethanol production process based on enzymatic hydrolysis: A review. Bioresour Technol 101:4851–4861. doi: 10.1016/j.biortech.2009.11.093
Aristilde L, Lewis IA, Park JO, Rabinowitz JD (2015) Hierarchy in Pentose Sugar Metabolism in Clostridium acetobutylicum. Appl Environ Microbiol 81:1452–1462. doi: 10.1128/AEM.03199-14
Azman S, Khadem AF, Lier JB van, Zeeman G, Plugge CM (2015) Presence and Role of Anaerobic Hydrolytic Microbes in Conversion of Lignocellulosic Biomass for Biogas Production. Crit Rev Environ Sci Technol 45:2523–2564. doi: 10.1080/10643389.2015.1053727
167
Behrens S, Mitchell WJ, Bahl H (2001) Molecular analysis of the mannitol operon of Clostridium acetobutylicum encoding a phosphotransferase system and a putative PTS-modulated regulator. Microbiology 147: 75-86.
Boz N, Degirmenbasi N, Kalyon DM (2009) Conversion of biomass to fuel: Transesterification of vegetable oil to biodiesel using KF loaded nano-γ-Al2O3 as catalyst. Appl Catal B Environ 89:590–596. doi: 10.1016/j.apcatb.2009.01.026
Briens C, Piskorz J, Berruti F (2008) Biomass Valorization for Fuel and Chemicals Production -- A Review. Int J Chem React Eng. doi: 10.2202/1542-6580.1674
Climent MJ, Corma A, De Frutos P, Iborra S, Noy M, Velty A, Concepción P (2010) Chemicals from biomass: Synthesis of glycerol carbonate by transesterification and carbonylation with urea with hydrotalcite catalysts. The role of acid–base pairs. J Catal 269:140–149. doi: 10.1016/j.jcat.2009.11.001
Ezeji TC, Qureshi N, Blaschek HP (2007) Bioproduction of butanol from biomass: from genes to bioreactors. Curr Opin Biotechnol 18:220–227. doi: 10.1016/j.copbio.2007.04.002
Fond O, Engasser J-M, Matta-El-Amouri G, Petitdemange H (1986) The acetone butanol fermentation on glucose and xylose. I. Regulation and kinetics in batch cultures. Biotechnol Bioeng 28:160–166. doi: 10.1002/bit.260280203
Gao K, Boiano S, Marzocchella A, Rehmann L (2014) Cellulosic butanol production from alkali-pretreated switchgrass (Panicum virgatum) and phragmites (Phragmites australis). Bioresour Technol 174:176–181. doi: 10.1016/j.biortech.2014.09.152
Girbal L, Croux C, Vasconcelos I, Soucaille P (1995) Regulation of metabolic shifts in Clostridium acetobutylicum ATCC 824. FEMS Microbiol Rev 17:287–297. doi: doi:10.1016/0168-6445(95)00017-7
Gu Y, Jiang Y, Yang S, Jiang W (2014) Utilization of economical substrate-derived carbohydrates by solventogenic clostridia: pathway dissection, regulation and engineering. Curr Opin Biotechnol 29:124–131. doi: 10.1016/j.copbio.2014.04.004
Guedon E, Payot S, Desvaux M, Petitdemange H (1999) Carbon and Electron Flow in Clostridium cellulolyticum Grown in Chemostat Culture on Synthetic Medium. J Bacteriol 181:3262–3269.
Hendriks ATWM, Zeeman G (2009) Pretreatments to enhance the digestibility of lignocellulosic biomass. Bioresour Technol 100:10–18. doi: 10.1016/j.biortech.2008.05.027
Henstra AM, Sipma J, Rinzema A, Stams AJ (2007) Microbiology of synthesis gas fermentation for biofuel production. Curr Opin Biotechnol 18:200–206. doi: 10.1016/j.copbio.2007.03.008
Ibrahim MF, Abd-Aziz S, Yusoff MEM, Phang LY, Hassan MA (2015) Simultaneous enzymatic saccharification and ABE fermentation using pretreated oil palm empty fruit bunch as substrate to produce butanol and hydrogen as biofuel. Renew Energy 77:447–455. doi: 10.1016/j.renene.2014.12.047
Jang Y-S, Malaviya A, Cho C, Lee J, Lee SY (2012) Butanol production from renewable biomass by clostridia. Bioresour Technol 123:653–663. doi: 10.1016/j.biortech.2012.07.104
Jones DT, Woods DR (1986) Acetone-butanol fermentation revisited. Microbiol Rev 50:484–524. Jurgens G, Survase S, Berezina O, Sklavounos E, Linnekoski J, Kurkijärvi A, Väkevä M, Heiningen
A van, Granström T (2012) Butanol production from lignocellulosics. Biotechnol Lett 34:1415–1434. doi: 10.1007/s10529-012-0926-3
Kim BH, Bellows P, Datta R, Zeikus JG (1984) Control of Carbon and Electron Flow in Clostridium acetobutylicum Fermentations: Utilization of Carbon Monoxide to Inhibit Hydrogen Production and to Enhance Butanol Yields. Appl Environ Microbiol 48:764–770.
Kumar P, Barrett DM, Delwiche MJ, Stroeve P (2009) Methods for Pretreatment of Lignocellulosic Biomass for Efficient Hydrolysis and Biofuel Production. Ind Eng Chem Res 48:3713–3729. doi: 10.1021/ie801542g
Lee SF, Forsberg CW, Gibbins LN (1985) Cellulolytic activity of Clostridium acetobutylicum. Appl environ microbiol 50: 220-228.
168
López-Contreras AM, Claassen PA, Mooibroek H, De Vos WM (2000) Utilisation of saccharides in extruded domestic organic waste by Clostridium acetobutylicum ATCC 824 for production of acetone, butanol and ethanol. Appl microbial biotechnol 54: 162-167.
Lee SY, Park JH, Jang SH, Nielsen LK, Kim J, Jung KS (2008a) Fermentative butanol production by clostridia. Biotechnol Bioeng 101:209–228. doi: 10.1002/bit.22003
Lee SY, Park JH, Jang SH, Nielsen LK, Kim J, Jung KS (2008b) Fermentative butanol production by clostridia. Biotechnol Bioeng 101:209–228. doi: 10.1002/bit.22003
Li X, Li Z, Zheng J, Shi Z, Li L (2012) Yeast extract promotes phase shift of bio-butanol fermentation by Clostridium acetobutylicum ATCC824 using cassava as substrate. Bioresour Technol 125:43–51. doi: 10.1016/j.biortech.2012.08.056
Lin Y, Tanaka S (2005) Ethanol fermentation from biomass resources: current state and prospects. Appl Microbiol Biotechnol 69:627–642. doi: 10.1007/s00253-005-0229-x
McKendry P (2002) Energy production from biomass (part 2): conversion technologies. Bioresour Technol 83:47–54.
Mes-Hartree M, Saddler JN (1982) Butanol production of Clostridium acetobutylicum grown on sugars found in hemicellulose hydrolysates. Biotechnol Lett 4:247–252. doi: 10.1007/BF00132395
Mitchell WJ, Albasheri KA, Yazdanian M (1995) Factors affecting utilization of carbohydrates by clostridia. FEMS Microbiol Rev 17:317–329.
Monod J (1942) Recherches sur la croissance des cultures bactériennes. Paris: Herman et Cie. Morone A, Pandey RA (2014) Lignocellulosic biobutanol production: Gridlocks and potential
remedies. Renew Sustain Energy Rev 37:21–35. doi: 10.1016/j.rser.2014.05.009 Mosier N, Wyman C, Dale B, Elander R, Lee YY, Holtzapple M, Ladisch M (2005) Features of
promising technologies for pretreatment of lignocellulosic biomass. Bioresour Technol 96:673–686. doi: 10.1016/j.biortech.2004.06.025
Nanda S, Mohammad J, Reddy SN, Kozinski JA, Dalai AK (2014) Pathways of lignocellulosic biomass conversion to renewable fuels. Biomass Convers Biorefinery 4:157–191. doi: 10.1007/s13399-013-0097-z
Napoli F, Olivieri G, Russo ME, Marzocchella A, Salatino P (2011) Continuous lactose fermentation by Clostridium acetobutylicum – Assessment of acidogenesis kinetics. Bioresour Technol 102:1608–1614. doi: 10.1016/j.biortech.2010.09.004
Nogué VS, Karhumaa K (2015) Xylose fermentation as a challenge for commercialization of lignocellulosic fuels and chemicals. Biotechnol lett 37: 761-772
Ounine K, Petitdemange H, Raval G, Gay R (1985) Regulation and butanol inhibition of D-xylose and D-glucose uptake in Clostridium acetobutylicum. Appl Environ Microbiol 49:874–878.
Patakova P, Linhova M, Rychtera M, Paulova L, Melzoch K (2013) Novel and neglected issues of acetone–butanol–ethanol (ABE) fermentation by clostridia: Clostridium metabolic diversity, tools for process mapping and continuous fermentation systems. Biotechnol adv 31:58-67.
Pfromm PH, Amanor-Boadu V, Nelson R, Vadlani P, Madl R (2010) Bio-butanol vs. bio-ethanol: A technical and economic assessment for corn and switchgrass fermented by yeast or Clostridium acetobutylicum. Biomass Bioenergy 34:515–524. doi: 10.1016/j.biombioe.2009.12.017
Qureshi N, Ezeji TC (2008) Butanol, “a superior biofuel” production from agricultural residues (renewable biomass): recent progress in technology. Biofuels Bioprod Biorefining 2:319–330. doi: 10.1002/bbb.85
Raganati F, Olivieri G, Götz P, Marzocchella A, Salatino P (2015) Butanol production from hexoses and pentoses by fermentation of Clostridium acetobutylicum. Anaerobe 34:146–155. doi: 10.1016/j.anaerobe.2015.05.008
Ranjan A, Moholkar VS (2012) Biobutanol: science, engineering, and economics. Int J Energy Res 36:277–323. doi: 10.1002/er.1948
169
Raut MP, Couto N, Pham TK, Evans C, Noirel J, Wright PC (2016) Quantitative proteomic analysis of the influence of lignin on biofuel production by Clostridium acetobutylicum ATCC 824. Biotechnol Biofuels 9:113.
Rinaldi R, Schüth F (2009) Acid Hydrolysis of Cellulose as the Entry Point into Biorefinery Schemes. ChemSusChem 2:1096–1107. doi: 10.1002/cssc.200900188
Saier Jr MH, Reizer J (1992) Proposed uniform nomenclature for the proteins and protein domains of the bacterial phosphoenolpyruvate: sugar phosphotransferase system. J bacteriol 174: 1433.
Servinsky MD, Kiel JT, Dupuy NF, Sund CJ (2010) Transcriptional analysis of differential carbohydrate utilization by Clostridium acetobutylicum. Microbiology 156: 3478-3491.
Singh KD, Schmalisch MH, Stülke J, Görke B (2008) Carbon catabolite repression in Bacillus subtilis: quantitative analysis of repression exerted by different carbon sources. J bacteriol 190: 7275-7284.
Survase SA, Heiningen A van, Granström T (2011a) Continuous bio-catalytic conversion of sugar mixture to acetone–butanol–ethanol by immobilized Clostridium acetobutylicum DSM 792. Appl Microbiol Biotechnol 93:2309–2316. doi: 10.1007/s00253-011-3761-x
Survase SA, Sklavounos E, Jurgens G, van Heiningen A, Granström T (2011b) Continuous acetone–butanol–ethanol fermentation using SO2–ethanol–water spent liquor from spruce. Bioresour Technol 102:10996–11002. doi: 10.1016/j.biortech.2011.09.034
Tangney M, Galinier A, Deutscher J, Mitchell WJ (2003) Analysis of the elements of catabolite repression in Clostridium acetobutylicum ATCC 824. J Mol Microbiol Biotechnol 6: 6-11.
Tracy BP, Jones SW, Fast AG, Indurthi DC, Papoutsakis ET (2012) Clostridia: the importance of their exceptional substrate and metabolite diversity for biofuel and biorefinery applications. Curr Opin Biotechnol 23:364–381. doi: 10.1016/j.copbio.2011.10.008
Turon V, Trably E, Fouilland E, Steyer J-P (2016) Potentialities of dark fermentation effluents as substrates for microalgae growth: A review. Process Biochem. doi: 10.1016/j.procbio.2016.03.018
Vasconcelos I, Girbal L, Soucaille P (1994) Regulation of carbon and electron flow in Clostridium acetobutylicum grown in chemostat culture at neutral pH on mixtures of glucose and glycerol. J Bacteriol 176:1443–1450.
Wettstein SG, Alonso DM, Gürbüz EI, Dumesic JA (2012) A roadmap for conversion of lignocellulosic biomass to chemicals and fuels. Curr Opin Chem Eng 1:218–224. doi: 10.1016/j.coche.2012.04.002
Wyman CE, Dale BE, Elander RT, Holtzapple M, Ladisch MR, Lee YY (2005) Coordinated development of leading biomass pretreatment technologies. Bioresour Technol 96:1959–1966. doi: 10.1016/j.biortech.2005.01.010
Zhao X, Condruz S, Chen J, Jolicoeur M (2016) A quantitative metabolomics study of high sodium response in Clostridium acetobutylicum ATCC 824 acetone-butanol-ethanol (ABE) fermentation. Sci Rep 6:28307.

170
171
In this article, the fermentation is studied starting from the cellulose liquefaction products, which
less inhibitors. Then the cellulose-rich pulps that have some residual lignin that might be
detrimental for the bacterial growth and finishing with the raw biomass hydrolysates that will
present more problems due to the high quantity of lignin-derived products. In order to establish
the fermentation conditions, the effect of the pH on the utilization of glucose and cellobiose
(Appendice 5) was a crucial point to achieve a successful ABE fermentation.
2. Article 4:
From wood to building blocks: ABE fermentation
of carbohydrates produced by hydrothermal
depolymerization of wood pulps
Article in preparation to be submitted.
Highlights:
-First integration of pulping, liquefaction and fermentation.
-Delignification of lignocellulosic biomass was good enough to allow butanol production. Raw-
beech hydrolysates were not fermentable.
-C. acetobutylicum was able to utilise several carbon substrates from the raw material source,
establishing an utilization order.
-First time reported cellotriose. cellotetraose and cellopentaose utilization by C. acetobutylicum.
ABSTRACT
Lignocellulosic biomass is a potential source of renewable carbon. The development of effective
biorefinery processes for the valorization of biomass into fuels and chemicals is a major
172
challenges for the current society. Traditional saccharification of cellulosic materials uses
enzymes that are expensive and have long reaction times (2-3 days). Hydrothermal
depolymerization of cellulosic materials is a potential alternative for the production of
fermentable substrates. In this work, sugar mixtures coming from cellulosic materials
depolymerized by hydrothermal liquefaction are fermented by Clostridium acetobutylicum for the
production of building blocks (butanol, acetone, acetic acid, butyric acid). Microcrystalline
cellulose (Avicel) was depolymerized by hydrothermal liquefaction at 180, 200 and 220ᵒC and
then fermented by C. acetobutylicum to study the utilization of a sugar mixture. An order of
utilization of the different sugars present in mixtures was observed. Because valorization of all
the components of biomass is a key factor for a viable biorefinery, cellulose-rich pulps coming
from beech wood fractionation were liquefied at the same temperatures and then used as
substrates for the production of building blocks by C. acetobutylicum. The sugar and non-sugar
content of all the liquefied mixtures were quantified and correlate to itheir fermentability. The
kinetics of the total sugars utilization and building blocks production by C. acetobutylicum were
assessed.
2.1. Introduction
Energy sources are essential for human development. With the steady increase of global
population, energy availability coming from non-renewable sources is getting more and more
limited and their exploitation and use impact negatively the environment. Finding renewable
sources capable to replace fossil carbon derived energy and chemicals is now a major concern of
society.(OPEC, 2016) Lignocellulosic biomass is a renewable source of carbon that can be
transform into fuels and chemicals. Its abundance and distribution around the world make this
resource a promising alternative to fossil carbon.(Harmsen et al., 2014; H. Isikgor and
Remzi Becer, 2015; Ragauskas et al., 2006b)
173
Lignocellulosic biomass is mainly composed of cellulose, hemicellulose, lignin and some
extractive compounds. In order to ensure an efficient valorization of all three components, a
fractionation process is normally needed, allowing to separate the (holo)cellulosic fraction from
lignin.(Kumar et al., 2009; Ragauskas et al., 2006a) Biomass is the only renewable resource that
can be directly transformed into chemicals and fuels.
Conversion of biomass can be achieved by different types of technology that can be divided in
two major groups: thermochemical and biological. Thermochemical conversion of biomass by
fast pyrolysis allows a fast conversion with high liquid yields but no much selectivity.(Briens et
al., 2008; Jia et al., 2017; Lédé, 2012) On the other hand, biological conversion is characterized by
its high selectivity with slow kinetics that often last days.(Alvira et al., 2010) Traditionally,
saccharification of cellulosic materials is performed by enzymatic hydrolysis using a wide variety
of cellulases, β-glucosidases, endo- and exoglucanases.(Ibrahim et al., 2015; Obama et al., 2012)
This process allows to produce glucose with yields around 80-90%. The main drawback of such
approachis the high cost of enzymes and the inability to recycle them.(Jiang et al., 2016)
Additionally, the presence of the some aldehydes and phenols will have a detrimental effect on
the enzymatic efficiency.(Jönsson and Martín, 2016; Palmqvist and Hahn-Hägerdal, 2000)
Clostridium acetobutylicum is able to produce acetone, butanol and ethanol (ABE) in high yields.
Butanol is a promising renewable fuel because its energy content (27 MJ/mol) is very similar to
that of gasoline (32 MJ/mol)(Liu et al., 2015).
Several studies reporting the utilization of a wide variety of carbon sources by C. acetobutylicum
can be found in the literature.(Aristilde et al., 2015; Bruder et al., 2015; Girbal and Soucaille, 1994;
Grimmler et al., 2010; Mes-Hartree and Saddler, 1982; Raganati et al., 2015; Survase et al., 2011)
However, most of these studies made use of model compounds (or model mixtures) cultivating
C. acetobutylicum with only one carbon source. On the contrary, the real feedstock in an industrial
biorefinery represents a much more complex mixture and its utilization has not been yet well
studied.
174
The objective of this work is to study the valorization of lignocellulosic biomass for the
production of acids and solvents by fermentation using C. acetobutylicum. In our previous work,
beech was fractionated by two methods: organosolv and SC/AA, in order to recover a cellulose-
rich material with a low quantity of lignin in order to limit detrimental effect on micro-organisms
used in fermentation processes.
The two pulps and a model cellulose (Avicel PH-101) were liquefied in order to obtain complex
mixtures of sugars that can be used in a fermentation process. The Avicel cellulose was studied
as a model representation of lignocellulosic biomass.
This work is focused on the fermentation process of the hydrolysates recovered from the
liquefaction of these cellulosic materials.
The utilization order of a complex mixture of cellulose-derived carbohydrates has been studied,
reporting for the first time the utilization by C. acetobutylicum of cellotriose, cellotetraose and
cellopentaose, three majors cello oligosaccharides present in cellulose hydrolysis mixtures.
Kinetics of acid and solvent production by C. acetobutylicum are also reported. The substrate
utilization and fermentation products patterns and yields were assessed.
2.2. Materials and Methods
Figure 43 shows a schem of the general procedure follow in this work.
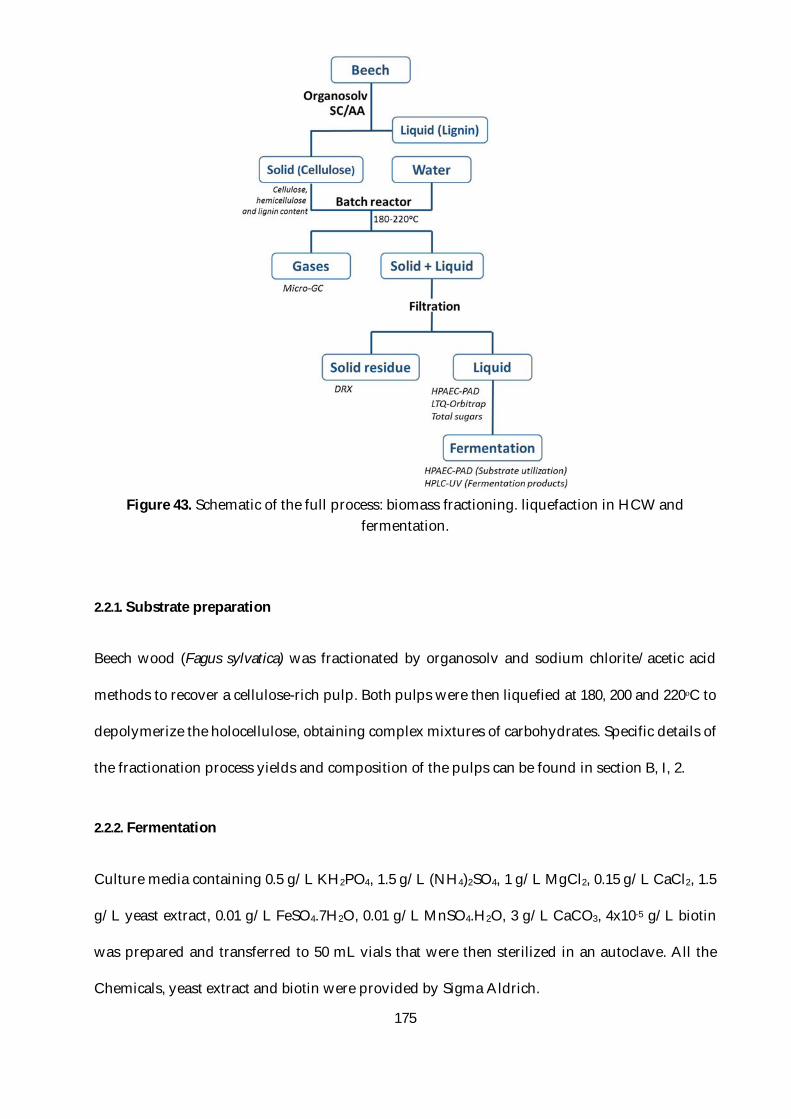
175
Figure 43. Schematic of the full process: biomass fractioning. liquefaction in HCW and
fermentation.
2.2.1. Substrate preparation
Beech wood (Fagus sylvatica) was fractionated by organosolv and sodium chlorite/acetic acid
methods to recover a cellulose-rich pulp. Both pulps were then liquefied at 180, 200 and 220ᵒC to
depolymerize the holocellulose, obtaining complex mixtures of carbohydrates. Specific details of
the fractionation process yields and composition of the pulps can be found in section B, I, 2.
2.2.2. Fermentation
Culture media containing 0.5 g/L KH2PO4, 1.5 g/L (NH4)2SO4, 1 g/L MgCl2, 0.15 g/L CaCl2, 1.5
g/L yeast extract, 0.01 g/L FeSO4.7H2O, 0.01 g/L MnSO4.H2O, 3 g/L CaCO3, 4x10⁻⁵ g/L biotin
was prepared and transferred to 50 mL vials that were then sterilized in an autoclave. All the
Chemicals, yeast extract and biotin were provided by Sigma Aldrich.
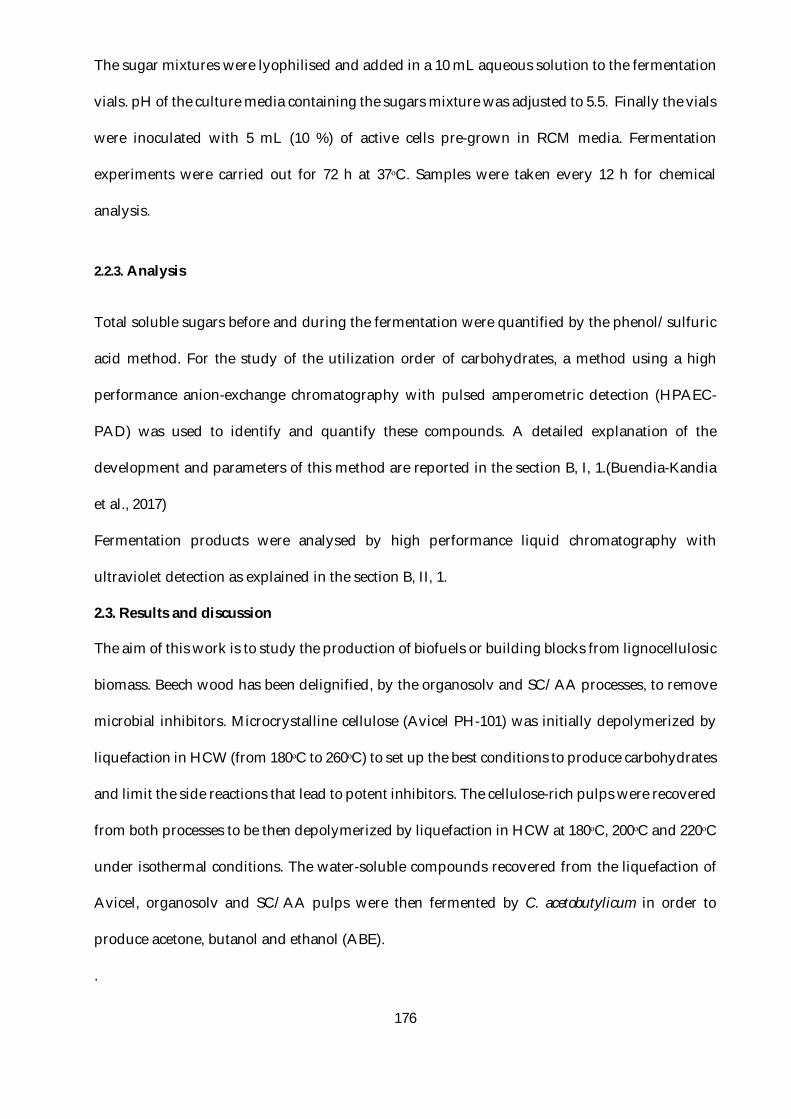
176
The sugar mixtures were lyophilised and added in a 10 mL aqueous solution to the fermentation
vials. pH of the culture media containing the sugars mixture was adjusted to 5.5. Finally the vials
were inoculated with 5 mL (10 %) of active cells pre-grown in RCM media. Fermentation
experiments were carried out for 72 h at 37ᵒC. Samples were taken every 12 h for chemical
analysis.
2.2.3. Analysis
Total soluble sugars before and during the fermentation were quantified by the phenol/sulfuric
acid method. For the study of the utilization order of carbohydrates, a method using a high
performance anion-exchange chromatography with pulsed amperometric detection (HPAEC-
PAD) was used to identify and quantify these compounds. A detailed explanation of the
development and parameters of this method are reported in the section B, I, 1.(Buendia-Kandia
et al., 2017)
Fermentation products were analysed by high performance liquid chromatography with
ultraviolet detection as explained in the section B, II, 1.
2.3. Results and discussion
The aim of this work is to study the production of biofuels or building blocks from lignocellulosic
biomass. Beech wood has been delignified, by the organosolv and SC/AA processes, to remove
microbial inhibitors. Microcrystalline cellulose (Avicel PH-101) was initially depolymerized by
liquefaction in HCW (from 180ᵒC to 260ᵒC) to set up the best conditions to produce carbohydrates
and limit the side reactions that lead to potent inhibitors. The cellulose-rich pulps were recovered
from both processes to be then depolymerized by liquefaction in HCW at 180ᵒC, 200ᵒC and 220ᵒC
under isothermal conditions. The water-soluble compounds recovered from the liquefaction of
Avicel, organosolv and SC/AA pulps were then fermented by C. acetobutylicum in order to
produce acetone, butanol and ethanol (ABE).
.
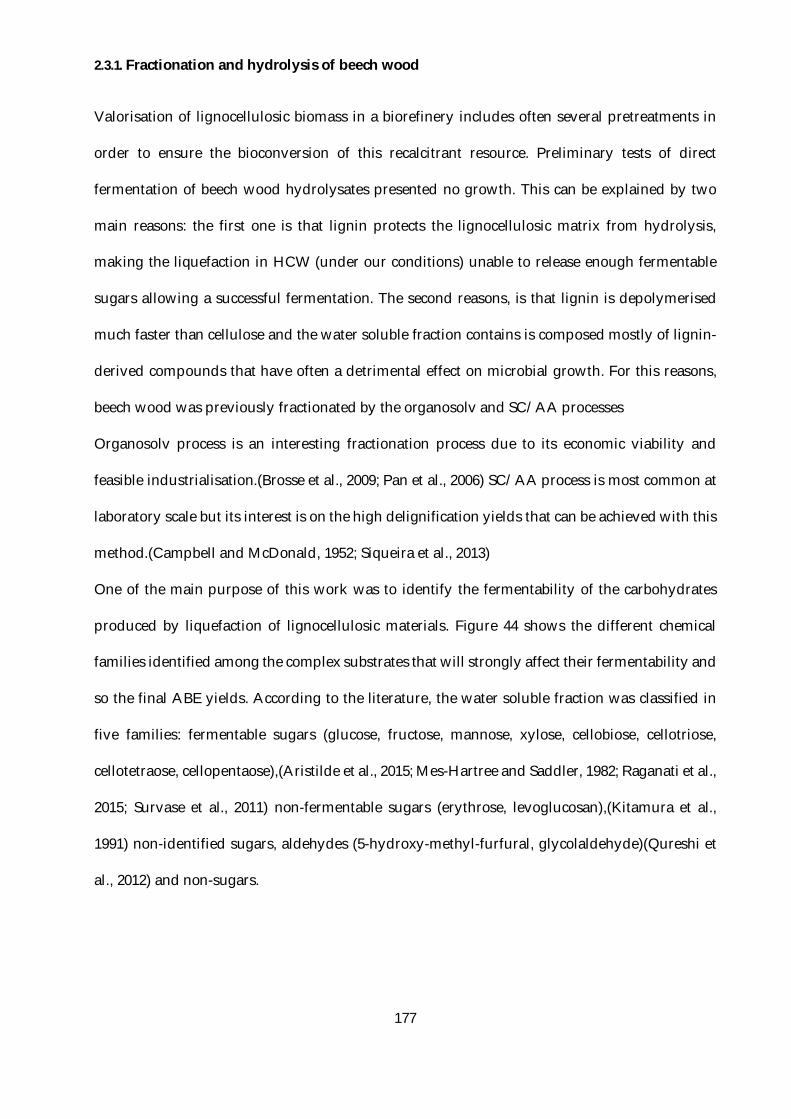
177
2.3.1. Fractionation and hydrolysis of beech wood
Valorisation of lignocellulosic biomass in a biorefinery includes often several pretreatments in
order to ensure the bioconversion of this recalcitrant resource. Preliminary tests of direct
fermentation of beech wood hydrolysates presented no growth. This can be explained by two
main reasons: the first one is that lignin protects the lignocellulosic matrix from hydrolysis,
making the liquefaction in HCW (under our conditions) unable to release enough fermentable
sugars allowing a successful fermentation. The second reasons, is that lignin is depolymerised
much faster than cellulose and the water soluble fraction contains is composed mostly of lignin-
derived compounds that have often a detrimental effect on microbial growth. For this reasons,
beech wood was previously fractionated by the organosolv and SC/AA processes
Organosolv process is an interesting fractionation process due to its economic viability and
feasible industrialisation.(Brosse et al., 2009; Pan et al., 2006) SC/AA process is most common at
laboratory scale but its interest is on the high delignification yields that can be achieved with this
method.(Campbell and McDonald, 1952; Siqueira et al., 2013)
One of the main purpose of this work was to identify the fermentability of the carbohydrates
produced by liquefaction of lignocellulosic materials. Figure 44 shows the different chemical
families identified among the complex substrates that will strongly affect their fermentability and
so the final ABE yields. According to the literature, the water soluble fraction was classified in
five families: fermentable sugars (glucose, fructose, mannose, xylose, cellobiose, cellotriose,
cellotetraose, cellopentaose),(Aristilde et al., 2015; Mes-Hartree and Saddler, 1982; Raganati et al.,
2015; Survase et al., 2011) non-fermentable sugars (erythrose, levoglucosan),(Kitamura et al.,
1991) non-identified sugars, aldehydes (5-hydroxy-methyl-furfural, glycolaldehyde)(Qureshi et
al., 2012) and non-sugars.
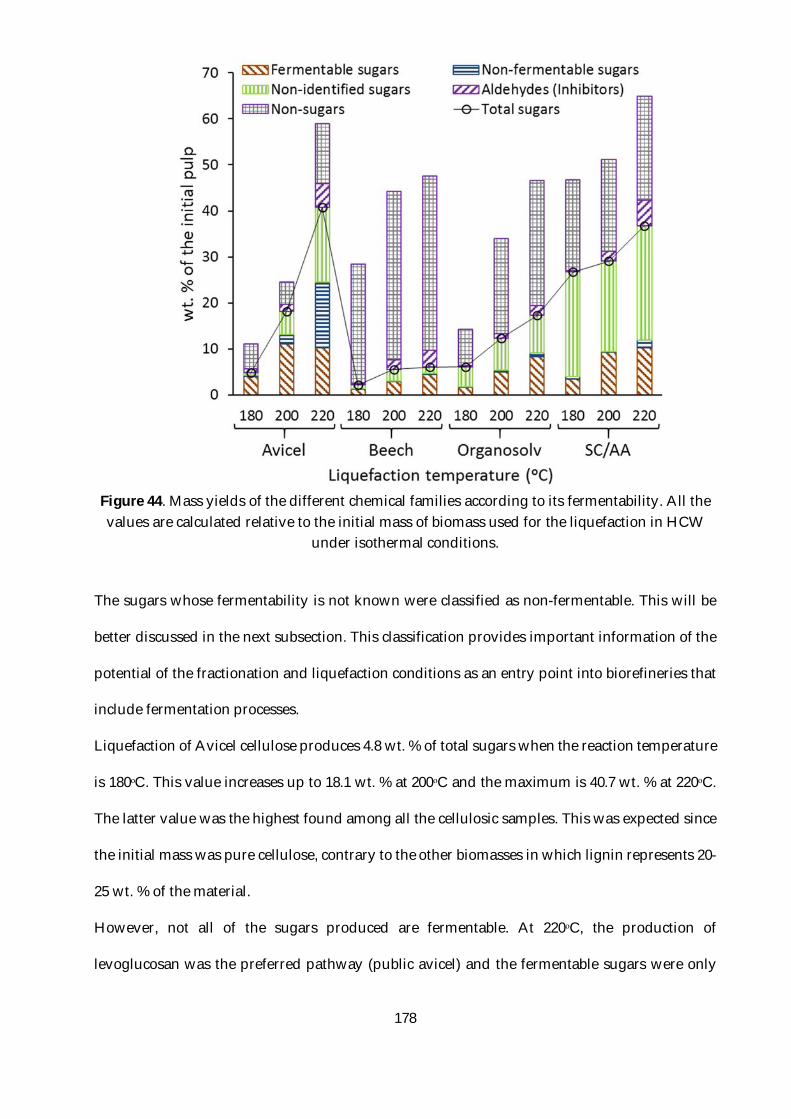
178
Figure 44. Mass yields of the different chemical families according to its fermentability. All the values are calculated relative to the initial mass of biomass used for the liquefaction in HCW
under isothermal conditions.
The sugars whose fermentability is not known were classified as non-fermentable. This will be
better discussed in the next subsection. This classification provides important information of the
potential of the fractionation and liquefaction conditions as an entry point into biorefineries that
include fermentation processes.
Liquefaction of Avicel cellulose produces 4.8 wt. % of total sugars when the reaction temperature
is 180ᵒC. This value increases up to 18.1 wt. % at 200ᵒC and the maximum is 40.7 wt. % at 220ᵒC.
The latter value was the highest found among all the cellulosic samples. This was expected since
the initial mass was pure cellulose, contrary to the other biomasses in which lignin represents 20-
25 wt. % of the material.
However, not all of the sugars produced are fermentable. At 220ᵒC, the production of
levoglucosan was the preferred pathway (public avicel) and the fermentable sugars were only
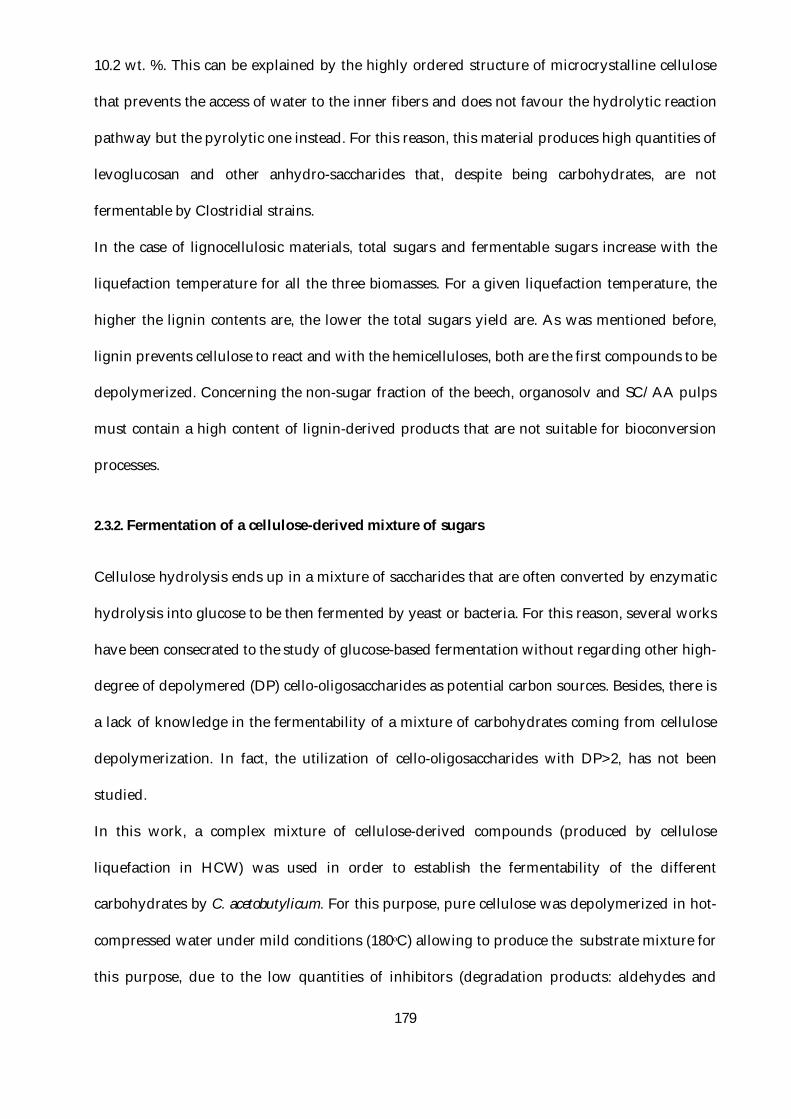
179
10.2 wt. %. This can be explained by the highly ordered structure of microcrystalline cellulose
that prevents the access of water to the inner fibers and does not favour the hydrolytic reaction
pathway but the pyrolytic one instead. For this reason, this material produces high quantities of
levoglucosan and other anhydro-saccharides that, despite being carbohydrates, are not
fermentable by Clostridial strains.
In the case of lignocellulosic materials, total sugars and fermentable sugars increase with the
liquefaction temperature for all the three biomasses. For a given liquefaction temperature, the
higher the lignin contents are, the lower the total sugars yield are. As was mentioned before,
lignin prevents cellulose to react and with the hemicelluloses, both are the first compounds to be
depolymerized. Concerning the non-sugar fraction of the beech, organosolv and SC/AA pulps
must contain a high content of lignin-derived products that are not suitable for bioconversion
processes.
2.3.2. Fermentation of a cellulose-derived mixture of sugars
Cellulose hydrolysis ends up in a mixture of saccharides that are often converted by enzymatic
hydrolysis into glucose to be then fermented by yeast or bacteria. For this reason, several works
have been consecrated to the study of glucose-based fermentation without regarding other high-
degree of depolymered (DP) cello-oligosaccharides as potential carbon sources. Besides, there is
a lack of knowledge in the fermentability of a mixture of carbohydrates coming from cellulose
depolymerization. In fact, the utilization of cello-oligosaccharides with DP>2, has not been
studied.
In this work, a complex mixture of cellulose-derived compounds (produced by cellulose
liquefaction in HCW) was used in order to establish the fermentability of the different
carbohydrates by C. acetobutylicum. For this purpose, pure cellulose was depolymerized in hot-
compressed water under mild conditions (180ᵒC) allowing to produce the substrate mixture for
this purpose, due to the low quantities of inhibitors (degradation products: aldehydes and
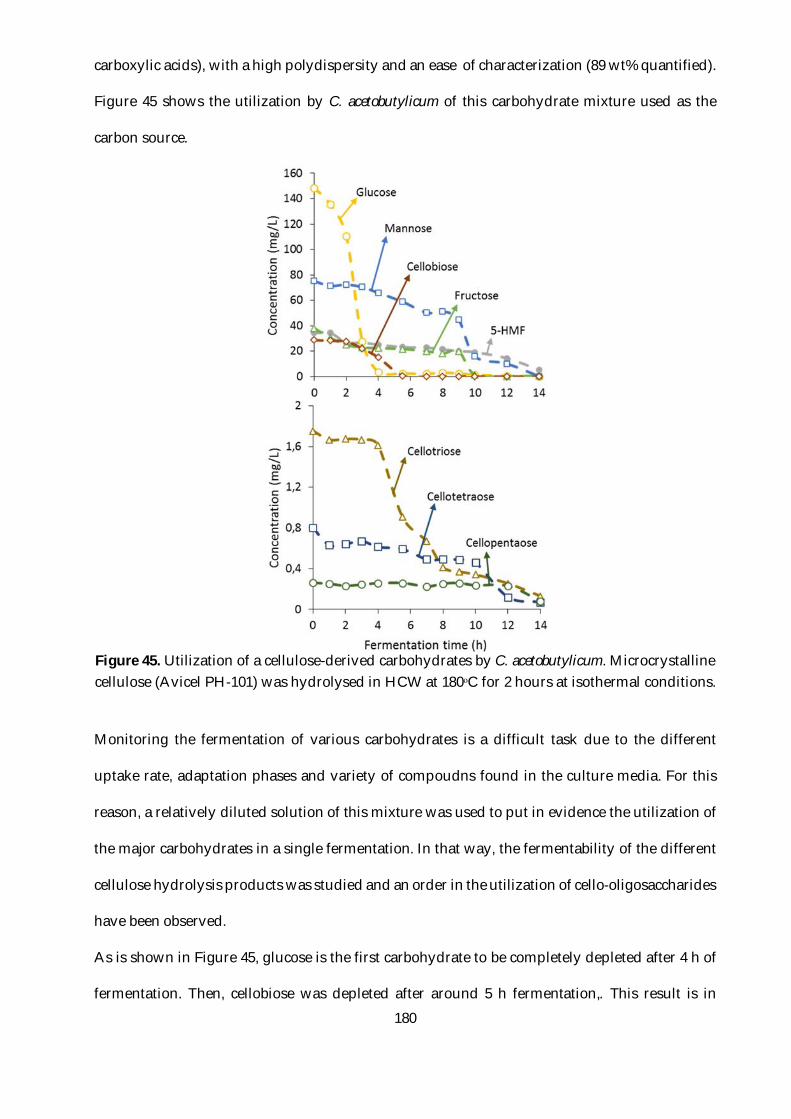
180
carboxylic acids), with a high polydispersity and an ease of characterization (89 wt% quantified).
Figure 45 shows the utilization by C. acetobutylicum of this carbohydrate mixture used as the
carbon source.
Figure 45. Utilization of a cellulose-derived carbohydrates by C. acetobutylicum. Microcrystalline cellulose (Avicel PH-101) was hydrolysed in HCW at 180ᵒC for 2 hours at isothermal conditions.
Monitoring the fermentation of various carbohydrates is a difficult task due to the different
uptake rate, adaptation phases and variety of compoudns found in the culture media. For this
reason, a relatively diluted solution of this mixture was used to put in evidence the utilization of
the major carbohydrates in a single fermentation. In that way, the fermentability of the different
cellulose hydrolysis products was studied and an order in the utilization of cello-oligosaccharides
have been observed.
As is shown in Figure 45, glucose is the first carbohydrate to be completely depleted after 4 h of
fermentation. Then, cellobiose was depleted after around 5 h fermentation,. This result is in
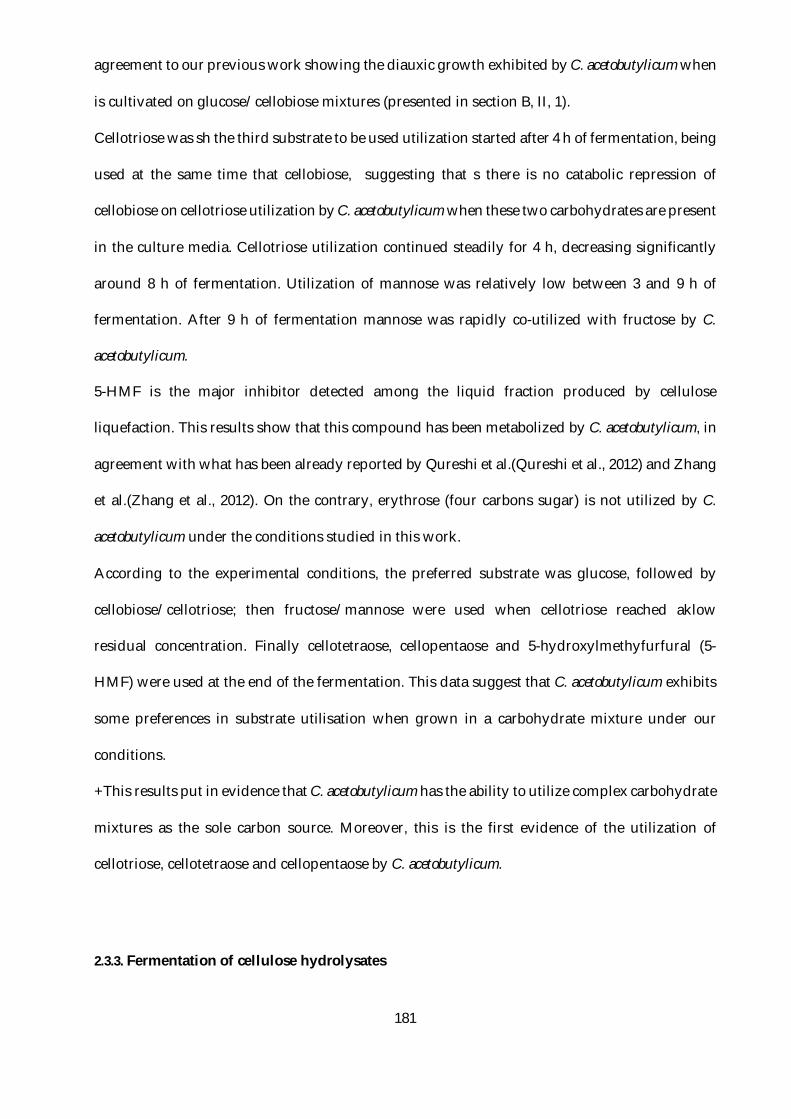
181
agreement to our previous work showing the diauxic growth exhibited by C. acetobutylicum when
is cultivated on glucose/cellobiose mixtures (presented in section B, II, 1).
Cellotriose was sh the third substrate to be used utilization started after 4 h of fermentation, being
used at the same time that cellobiose, suggesting that s there is no catabolic repression of
cellobiose on cellotriose utilization by C. acetobutylicum when these two carbohydrates are present
in the culture media. Cellotriose utilization continued steadily for 4 h, decreasing significantly
around 8 h of fermentation. Utilization of mannose was relatively low between 3 and 9 h of
fermentation. After 9 h of fermentation mannose was rapidly co-utilized with fructose by C.
acetobutylicum.
5-HMF is the major inhibitor detected among the liquid fraction produced by cellulose
liquefaction. This results show that this compound has been metabolized by C. acetobutylicum, in
agreement with what has been already reported by Qureshi et al.(Qureshi et al., 2012) and Zhang
et al.(Zhang et al., 2012). On the contrary, erythrose (four carbons sugar) is not utilized by C.
acetobutylicum under the conditions studied in this work.
According to the experimental conditions, the preferred substrate was glucose, followed by
cellobiose/cellotriose; then fructose/mannose were used when cellotriose reached aklow
residual concentration. Finally cellotetraose, cellopentaose and 5-hydroxylmethyfurfural (5-
HMF) were used at the end of the fermentation. This data suggest that C. acetobutylicum exhibits
some preferences in substrate utilisation when grown in a carbohydrate mixture under our
conditions.
+This results put in evidence that C. acetobutylicum has the ability to utilize complex carbohydrate
mixtures as the sole carbon source. Moreover, this is the first evidence of the utilization of
cellotriose, cellotetraose and cellopentaose by C. acetobutylicum.
2.3.3. Fermentation of cellulose hydrolysates
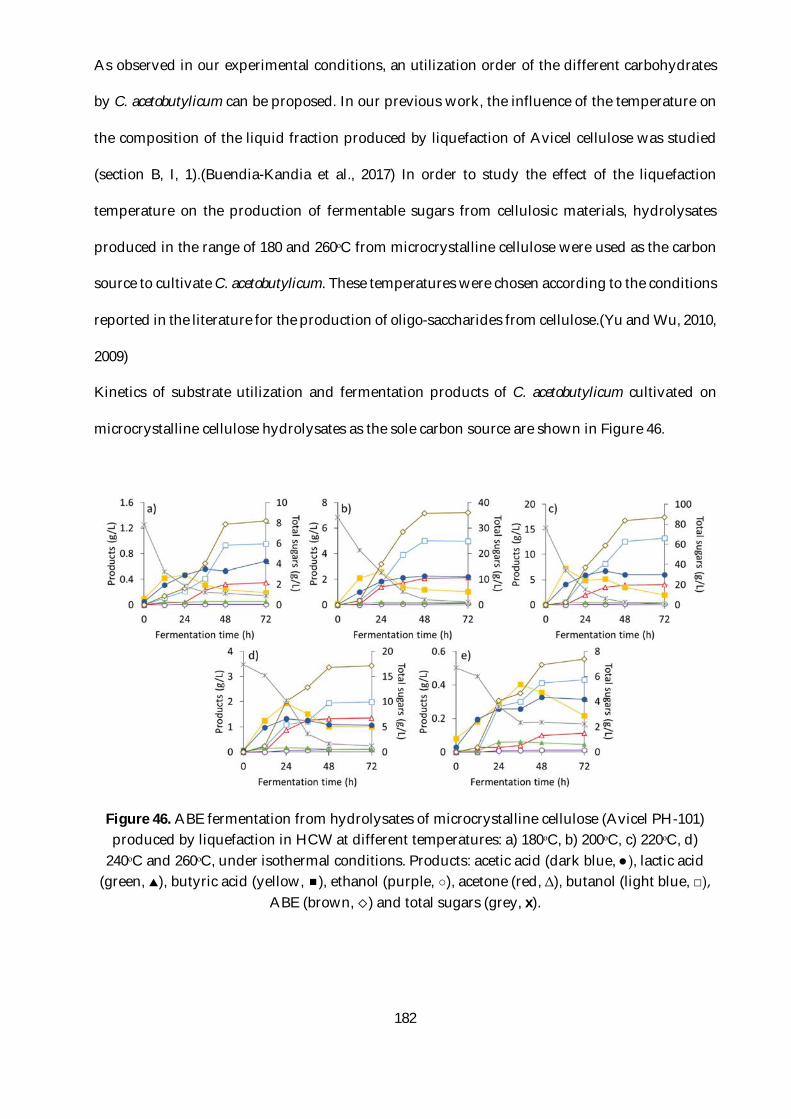
182
As observed in our experimental conditions, an utilization order of the different carbohydrates
by C. acetobutylicum can be proposed. In our previous work, the influence of the temperature on
the composition of the liquid fraction produced by liquefaction of Avicel cellulose was studied
(section B, I, 1).(Buendia-Kandia et al., 2017) In order to study the effect of the liquefaction
temperature on the production of fermentable sugars from cellulosic materials, hydrolysates
produced in the range of 180 and 260ᵒC from microcrystalline cellulose were used as the carbon
source to cultivate C. acetobutylicum. These temperatures were chosen according to the conditions
reported in the literature for the production of oligo-saccharides from cellulose.(Yu and Wu, 2010,
2009)
Kinetics of substrate utilization and fermentation products of C. acetobutylicum cultivated on
microcrystalline cellulose hydrolysates as the sole carbon source are shown in Figure 46.
Figure 46. ABE fermentation from hydrolysates of microcrystalline cellulose (Avicel PH-101) produced by liquefaction in HCW at different temperatures: a) 180ᵒC, b) 200ᵒC, c) 220ᵒC, d)
240ᵒC and 260ᵒC, under isothermal conditions. Products: acetic acid (dark blue, ●), lactic acid (green, ), butyric acid (yellow, ), ethanol (purple, ○), acetone (red, Δ), butanol (light blue, □),
ABE (brown, ) and total sugars (grey, x).
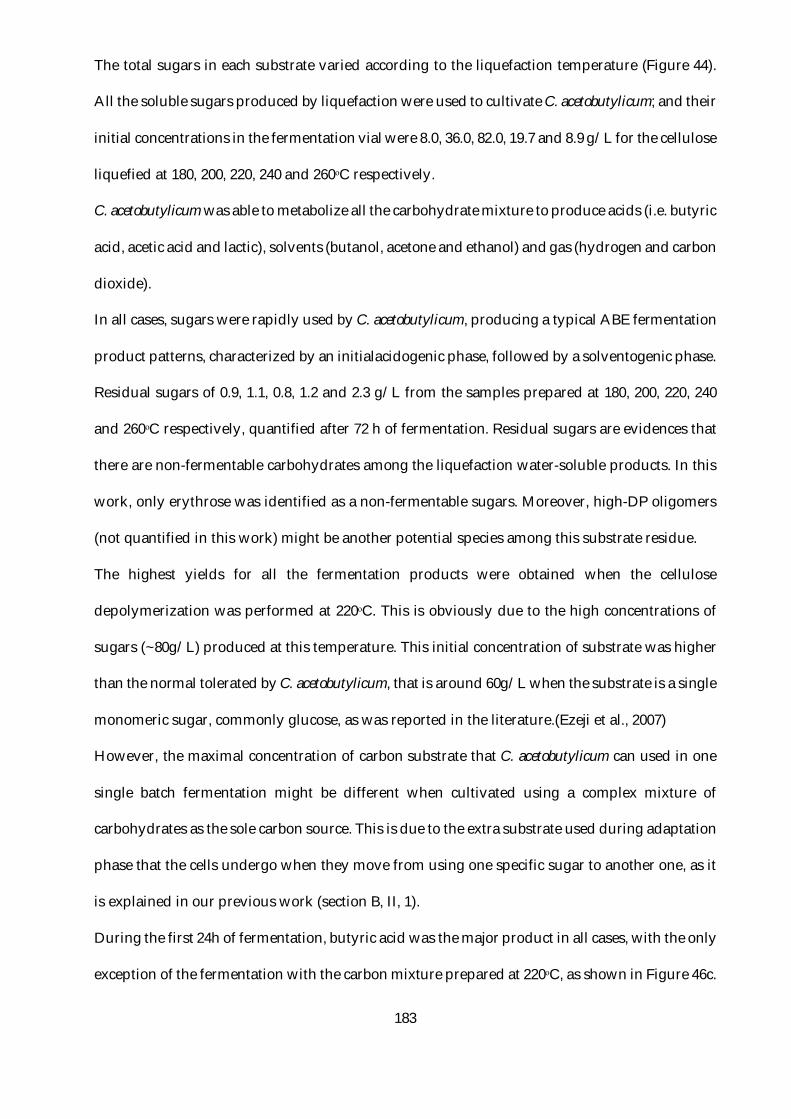
183
The total sugars in each substrate varied according to the liquefaction temperature (Figure 44).
All the soluble sugars produced by liquefaction were used to cultivate C. acetobutylicum; and their
initial concentrations in the fermentation vial were 8.0, 36.0, 82.0, 19.7 and 8.9 g/L for the cellulose
liquefied at 180, 200, 220, 240 and 260ᵒC respectively.
C. acetobutylicum was able to metabolize all the carbohydrate mixture to produce acids (i.e. butyric
acid, acetic acid and lactic), solvents (butanol, acetone and ethanol) and gas (hydrogen and carbon
dioxide).
In all cases, sugars were rapidly used by C. acetobutylicum, producing a typical ABE fermentation
product patterns, characterized by an initialacidogenic phase, followed by a solventogenic phase.
Residual sugars of 0.9, 1.1, 0.8, 1.2 and 2.3 g/L from the samples prepared at 180, 200, 220, 240
and 260ᵒC respectively, quantified after 72 h of fermentation. Residual sugars are evidences that
there are non-fermentable carbohydrates among the liquefaction water-soluble products. In this
work, only erythrose was identified as a non-fermentable sugars. Moreover, high-DP oligomers
(not quantified in this work) might be another potential species among this substrate residue.
The highest yields for all the fermentation products were obtained when the cellulose
depolymerization was performed at 220ᵒC. This is obviously due to the high concentrations of
sugars (~80g/L) produced at this temperature. This initial concentration of substrate was higher
than the normal tolerated by C. acetobutylicum, that is around 60g/L when the substrate is a single
monomeric sugar, commonly glucose, as was reported in the literature.(Ezeji et al., 2007)
However, the maximal concentration of carbon substrate that C. acetobutylicum can used in one
single batch fermentation might be different when cultivated using a complex mixture of
carbohydrates as the sole carbon source. This is due to the extra substrate used during adaptation
phase that the cells undergo when they move from using one specific sugar to another one, as it
is explained in our previous work (section B, II, 1).
During the first 24h of fermentation, butyric acid was the major product in all cases, with the only
exception of the fermentation with the carbon mixture prepared at 220ᵒC, as shown in Figure 46c.
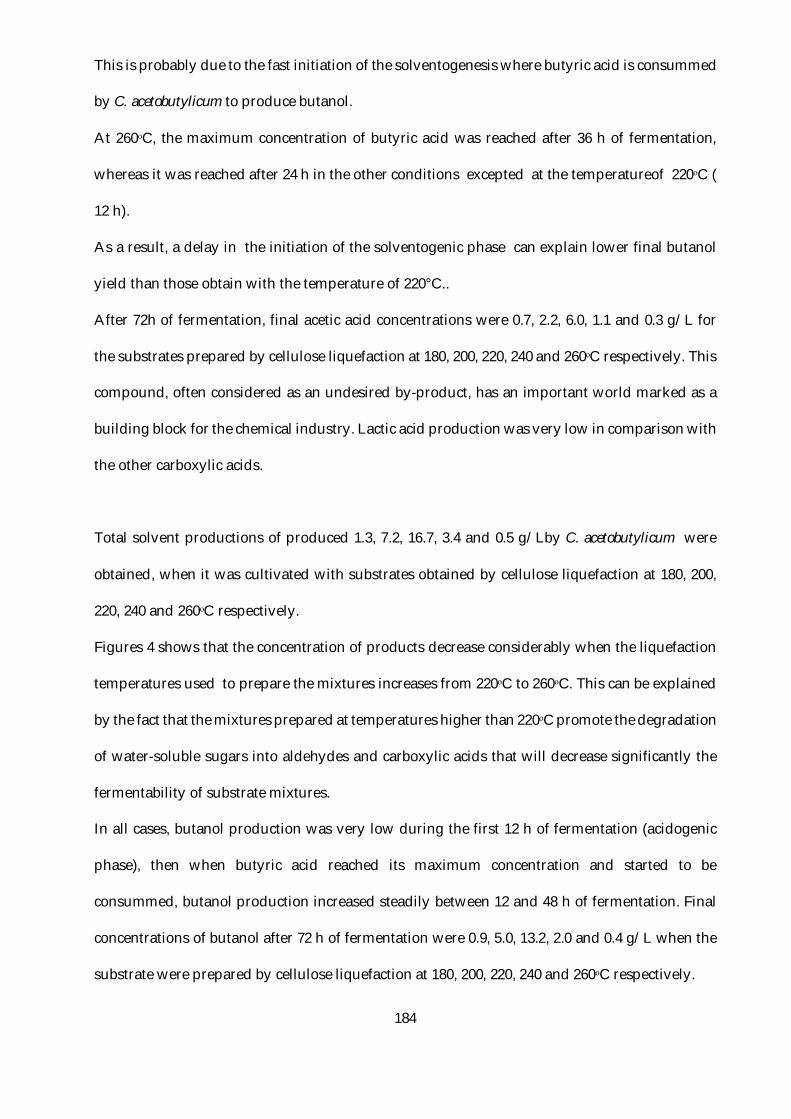
184
This is probably due to the fast initiation of the solventogenesis where butyric acid is consummed
by C. acetobutylicum to produce butanol.
At 260ᵒC, the maximum concentration of butyric acid was reached after 36 h of fermentation,
whereas it was reached after 24 h in the other conditions excepted at the temperatureof 220ᵒC (
12 h).
As a result, a delay in the initiation of the solventogenic phase can explain lower final butanol
yield than those obtain with the temperature of 220°C..
After 72h of fermentation, final acetic acid concentrations were 0.7, 2.2, 6.0, 1.1 and 0.3 g/L for
the substrates prepared by cellulose liquefaction at 180, 200, 220, 240 and 260ᵒC respectively. This
compound, often considered as an undesired by-product, has an important world marked as a
building block for the chemical industry. Lactic acid production was very low in comparison with
the other carboxylic acids.
Total solvent productions of produced 1.3, 7.2, 16.7, 3.4 and 0.5 g/Lby C. acetobutylicum were
obtained, when it was cultivated with substrates obtained by cellulose liquefaction at 180, 200,
220, 240 and 260ᵒC respectively.
Figures 4 shows that the concentration of products decrease considerably when the liquefaction
temperatures used to prepare the mixtures increases from 220ᵒC to 260ᵒC. This can be explained
by the fact that the mixtures prepared at temperatures higher than 220ᵒC promote the degradation
of water-soluble sugars into aldehydes and carboxylic acids that will decrease significantly the
fermentability of substrate mixtures.
In all cases, butanol production was very low during the first 12 h of fermentation (acidogenic
phase), then when butyric acid reached its maximum concentration and started to be
consummed, butanol production increased steadily between 12 and 48 h of fermentation. Final
concentrations of butanol after 72 h of fermentation were 0.9, 5.0, 13.2, 2.0 and 0.4 g/L when the
substrate were prepared by cellulose liquefaction at 180, 200, 220, 240 and 260ᵒC respectively.
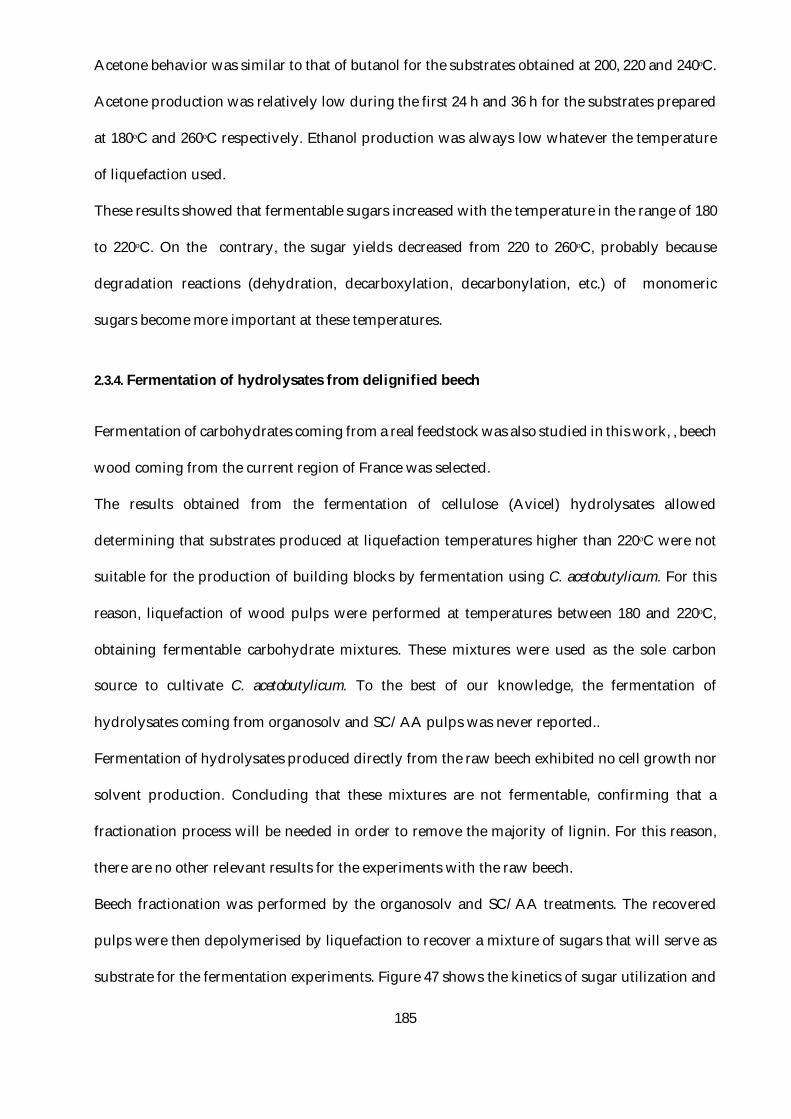
185
Acetone behavior was similar to that of butanol for the substrates obtained at 200, 220 and 240ᵒC.
Acetone production was relatively low during the first 24 h and 36 h for the substrates prepared
at 180ᵒC and 260ᵒC respectively. Ethanol production was always low whatever the temperature
of liquefaction used.
These results showed that fermentable sugars increased with the temperature in the range of 180
to 220ᵒC. On the contrary, the sugar yields decreased from 220 to 260ᵒC, probably because
degradation reactions (dehydration, decarboxylation, decarbonylation, etc.) of monomeric
sugars become more important at these temperatures.
2.3.4. Fermentation of hydrolysates from delignified beech
Fermentation of carbohydrates coming from a real feedstock was also studied in this work, , beech
wood coming from the current region of France was selected.
The results obtained from the fermentation of cellulose (Avicel) hydrolysates allowed
determining that substrates produced at liquefaction temperatures higher than 220ᵒC were not
suitable for the production of building blocks by fermentation using C. acetobutylicum. For this
reason, liquefaction of wood pulps were performed at temperatures between 180 and 220ᵒC,
obtaining fermentable carbohydrate mixtures. These mixtures were used as the sole carbon
source to cultivate C. acetobutylicum. To the best of our knowledge, the fermentation of
hydrolysates coming from organosolv and SC/AA pulps was never reported..
Fermentation of hydrolysates produced directly from the raw beech exhibited no cell growth nor
solvent production. Concluding that these mixtures are not fermentable, confirming that a
fractionation process will be needed in order to remove the majority of lignin. For this reason,
there are no other relevant results for the experiments with the raw beech.
Beech fractionation was performed by the organosolv and SC/AA treatments. The recovered
pulps were then depolymerised by liquefaction to recover a mixture of sugars that will serve as
substrate for the fermentation experiments. Figure 47 shows the kinetics of sugar utilization and
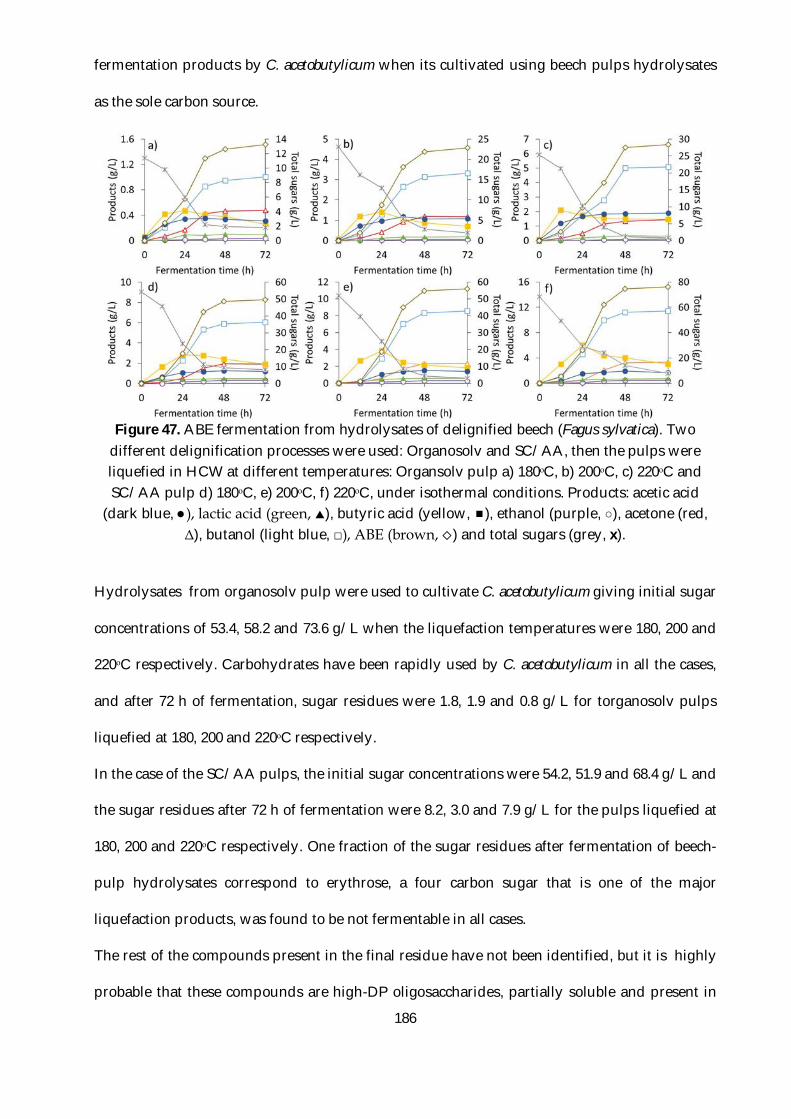
186
fermentation products by C. acetobutylicum when its cultivated using beech pulps hydrolysates
as the sole carbon source.
Figure 47. ABE fermentation from hydrolysates of delignified beech (Fagus sylvatica). Two
different delignification processes were used: Organosolv and SC/AA, then the pulps were liquefied in HCW at different temperatures: Organsolv pulp a) 180ᵒC, b) 200ᵒC, c) 220ᵒC and SC/AA pulp d) 180ᵒC, e) 200ᵒC, f) 220ᵒC, under isothermal conditions. Products: acetic acid
(dark blue, ●), lactic acid (green, ), butyric acid (yellow, ), ethanol (purple, ○), acetone (red, Δ), butanol (light blue, □), ABE (brown, ) and total sugars (grey, x).
Hydrolysates from organosolv pulp were used to cultivate C. acetobutylicum giving initial sugar
concentrations of 53.4, 58.2 and 73.6 g/L when the liquefaction temperatures were 180, 200 and
220ᵒC respectively. Carbohydrates have been rapidly used by C. acetobutylicum in all the cases,
and after 72 h of fermentation, sugar residues were 1.8, 1.9 and 0.8 g/L for torganosolv pulps
liquefied at 180, 200 and 220ᵒC respectively.
In the case of the SC/AA pulps, the initial sugar concentrations were 54.2, 51.9 and 68.4 g/L and
the sugar residues after 72 h of fermentation were 8.2, 3.0 and 7.9 g/L for the pulps liquefied at
180, 200 and 220ᵒC respectively. One fraction of the sugar residues after fermentation of beech-
pulp hydrolysates correspond to erythrose, a four carbon sugar that is one of the major
liquefaction products, was found to be not fermentable in all cases.
The rest of the compounds present in the final residue have not been identified, but it is highly
probable that these compounds are high-DP oligosaccharides, partially soluble and present in
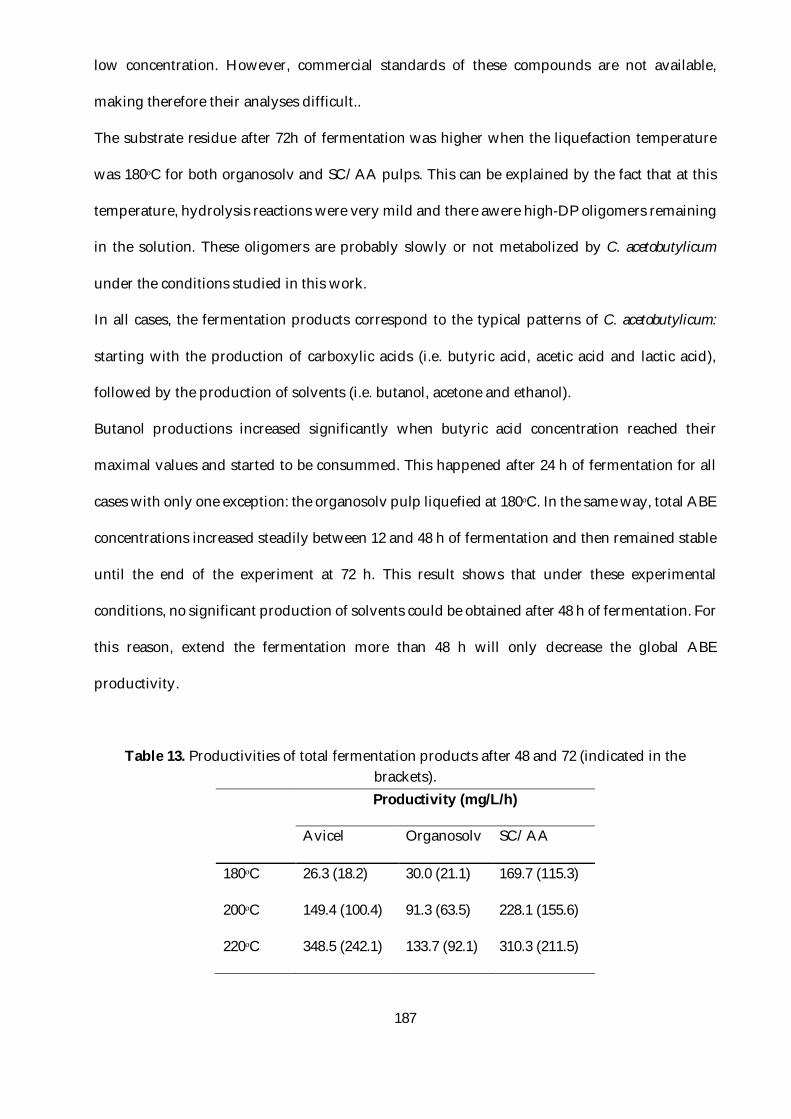
187
low concentration. However, commercial standards of these compounds are not available,
making therefore their analyses difficult..
The substrate residue after 72h of fermentation was higher when the liquefaction temperature
was 180ᵒC for both organosolv and SC/AA pulps. This can be explained by the fact that at this
temperature, hydrolysis reactions were very mild and there awere high-DP oligomers remaining
in the solution. These oligomers are probably slowly or not metabolized by C. acetobutylicum
under the conditions studied in this work.
In all cases, the fermentation products correspond to the typical patterns of C. acetobutylicum:
starting with the production of carboxylic acids (i.e. butyric acid, acetic acid and lactic acid),
followed by the production of solvents (i.e. butanol, acetone and ethanol).
Butanol productions increased significantly when butyric acid concentration reached their
maximal values and started to be consummed. This happened after 24 h of fermentation for all
cases with only one exception: the organosolv pulp liquefied at 180ᵒC. In the same way, total ABE
concentrations increased steadily between 12 and 48 h of fermentation and then remained stable
until the end of the experiment at 72 h. This result shows that under these experimental
conditions, no significant production of solvents could be obtained after 48 h of fermentation. For
this reason, extend the fermentation more than 48 h will only decrease the global ABE
productivity.
Table 13. Productivities of total fermentation products after 48 and 72 (indicated in the brackets).
Productivity (mg/L/h)
Avicel Organosolv SC/AA
180ᵒC 26.3 (18.2) 30.0 (21.1) 169.7 (115.3)
200ᵒC 149.4 (100.4) 91.3 (63.5) 228.1 (155.6)
220ᵒC 348.5 (242.1) 133.7 (92.1) 310.3 (211.5)
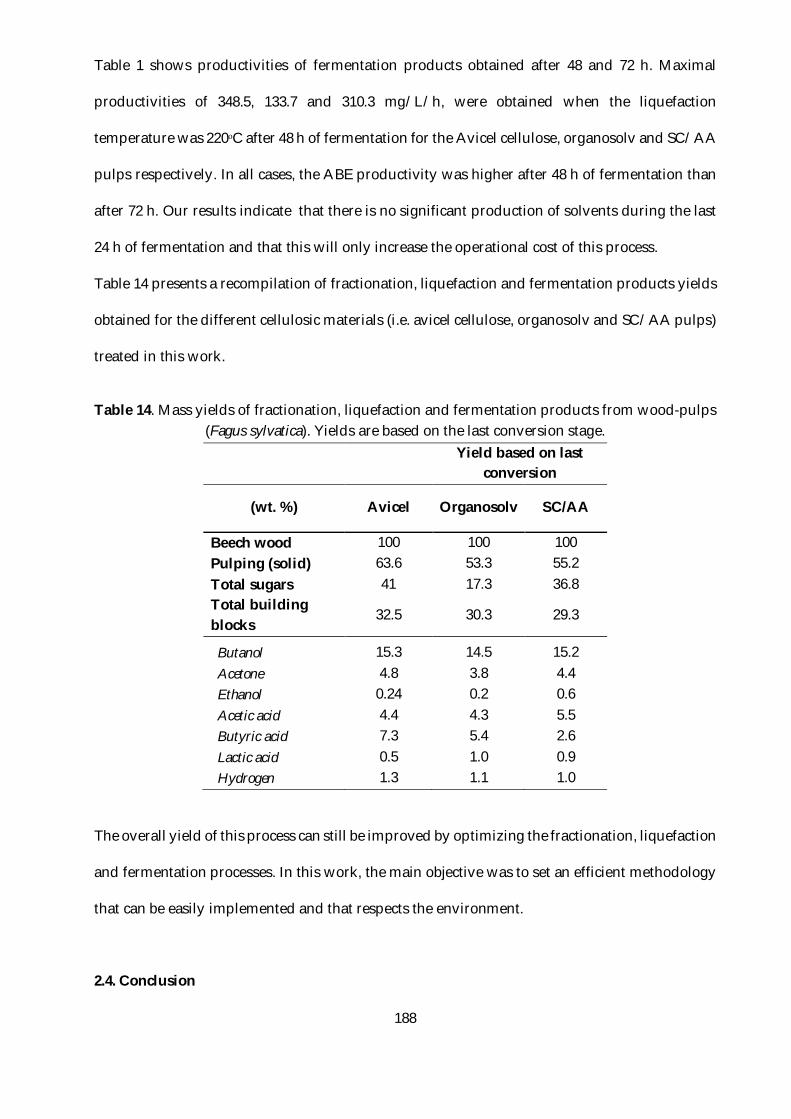
188
Table 1 shows productivities of fermentation products obtained after 48 and 72 h. Maximal
productivities of 348.5, 133.7 and 310.3 mg/L/h, were obtained when the liquefaction
temperature was 220ᵒC after 48 h of fermentation for the Avicel cellulose, organosolv and SC/AA
pulps respectively. In all cases, the ABE productivity was higher after 48 h of fermentation than
after 72 h. Our results indicate that there is no significant production of solvents during the last
24 h of fermentation and that this will only increase the operational cost of this process.
Table 14 presents a recompilation of fractionation, liquefaction and fermentation products yields
obtained for the different cellulosic materials (i.e. avicel cellulose, organosolv and SC/AA pulps)
treated in this work.
Table 14. Mass yields of fractionation, liquefaction and fermentation products from wood-pulps
(Fagus sylvatica). Yields are based on the last conversion stage.
Yield based on last
conversion
(wt. %) Avicel Organosolv SC/AA
Beech wood 100 100 100 Pulping (solid) 63.6 53.3 55.2 Total sugars 41 17.3 36.8 Total building blocks
32.5 30.3 29.3
Butanol 15.3 14.5 15.2 Acetone 4.8 3.8 4.4 Ethanol 0.24 0.2 0.6 Acetic acid 4.4 4.3 5.5 Butyric acid 7.3 5.4 2.6 Lactic acid 0.5 1.0 0.9 Hydrogen 1.3 1.1 1.0
The overall yield of this process can still be improved by optimizing the fractionation, liquefaction
and fermentation processes. In this work, the main objective was to set an efficient methodology
that can be easily implemented and that respects the environment.
2.4. Conclusion
189
Fractionation and liquefaction were found to be fast and efficient processes to produce
fermentable substrates that can be used as building blocks. On the contrary, raw beech
hydrolysates were not metabolized by C. acetobutylicum. In addition, an utilization order of the
major cellulose-derived sugars was also observed, highlighting the first evidence of cellotriose,
cellotetraose and cellopentaose utilization by C. acetobutylicum. The fermentability of the sugars
produced by cellulose liquefaction was found to be maximum at 220ᵒC. The fermentation
experiments were performed during 72 h but the maximum ABE productivities were found after
48 h of fermentation. In general, the fermentation of beech-pulp hydrolysates may represent an
interesting approach for a building block biorefinery.
2.5. References
Alvira, P., Tomás-Pejó, E., Ballesteros, M., Negro, M.J., 2010. Pretreatment technologies for an efficient bioethanol production process based on enzymatic hydrolysis: A review. Bioresour. Technol. 101, 4851–4861. https://doi.org/10.1016/j.biortech.2009.11.093
Aristilde, L., Lewis, I.A., Park, J.O., Rabinowitz, J.D., 2015. Hierarchy in Pentose Sugar Metabolism in Clostridium acetobutylicum. Appl. Environ. Microbiol. 81, 1452–1462. https://doi.org/10.1128/AEM.03199-14
Briens, C., Piskorz, J., Berruti, F., 2008. Biomass Valorization for Fuel and Chemicals Production -- A Review. Int. J. Chem. React. Eng. 6. https://doi.org/10.2202/1542-6580.1674
Brosse, N., Sannigrahi, P., Ragauskas, A., 2009. Pretreatment of Miscanthus x giganteus Using the Ethanol Organosolv Process for Ethanol Production. Ind. Eng. Chem. Res. 48, 8328–8334. https://doi.org/10.1021/ie9006672
Bruder, M., Moo-Young, M., Chung, D.A., Chou, C.P., 2015. Elimination of carbon catabolite repression in Clostridium acetobutylicum-a journey toward simultaneous use of xylose and glucose. Appl. Microbiol. Biotechnol. 99, 7579–88. https://doi.org/10.1007/s00253-015-6611-4
Buendia-Kandia, F., Mauviel, G., Guedon, E., Rondags, E., Petitjean, D., Dufour, A., 2017. Decomposition of cellulose in hot-compressed water: detailed analysis of the products and effect of operating conditions. Energy Fuels. https://doi.org/10.1021/acs.energyfuels.7b02994
Campbell, W.G., McDonald, I.R.C., 1952. The chemistry of the wood cell wall. Part I. The delignification of beech and spruce woods by sodium chlorite in buffered aqueous solution. J. Chem. Soc. Resumed 2644–2650. https://doi.org/10.1039/JR9520002644
Ezeji, T.C., Qureshi, N., Blaschek, H.P., 2007. Bioproduction of butanol from biomass: from genes to bioreactors. Curr. Opin. Biotechnol. 18, 220–227. https://doi.org/10.1016/j.copbio.2007.04.002
190
Girbal, L., Soucaille, P., 1994. Regulation of Clostridium acetobutylicum metabolism as revealed by mixed-substrate steady-state continuous cultures: role of NADH/NAD ratio and ATP pool. J. Bacteriol. 176, 6433–6438.
Grimmler, C., Held, C., Liebl, W., Ehrenreich, A., 2010. Transcriptional analysis of catabolite repression in Clostridium acetobutylicum growing on mixtures of d-glucose and d-xylose. J. Biotechnol. 150, 315–323. https://doi.org/10.1016/j.jbiotec.2010.09.938
Harmsen, P.F.H., Hackmann, M.M., Bos, H.L., 2014. Green building blocks for bio-based plastics. Biofuels Bioprod. Biorefining 8, 306–324. https://doi.org/10.1002/bbb.1468
H. Isikgor, F., Remzi Becer, C., 2015. Lignocellulosic biomass: a sustainable platform for the production of bio-based chemicals and polymers. Polym. Chem. 6, 4497–4559. https://doi.org/10.1039/C5PY00263J
Ibrahim, M.F., Abd-Aziz, S., Yusoff, M.E.M., Phang, L.Y., Hassan, M.A., 2015. Simultaneous enzymatic saccharification and ABE fermentation using pretreated oil palm empty fruit bunch as substrate to produce butanol and hydrogen as biofuel. Renew. Energy 77, 447–455. https://doi.org/10.1016/j.renene.2014.12.047
Jia, L., Buendia-Kandia, F., Dumarcay, S., Poirot, H., Mauviel, G., Gerardin, P., Dufour, A., 2017. Fast Pyrolysis of Heartwood, Sapwood and Bark: a Complementary Application of On-line Photoionization Mass Spectrometry and Conventional Py-GC/MS. Energy Fuels. https://doi.org/10.1021/acs.energyfuels.7b00110
Jiang, L., Zheng, A., Zhao, Z., He, F., Li, H., Wu, N., 2016. The comparison of obtaining fermentable sugars from cellulose by enzymatic hydrolysis and fast pyrolysis. Bioresour. Technol. 200, 8–13. https://doi.org/10.1016/j.biortech.2015.09.096
Jönsson, L.J., Martín, C., 2016. Pretreatment of lignocellulose: Formation of inhibitory by-products and strategies for minimizing their effects. Bioresour. Technol., Pretreatment of Biomass 199, 103–112. https://doi.org/10.1016/j.biortech.2015.10.009
Kitamura, Y., Abe, Y., Yasui, T., 1991. Metabolism of Levoglucosan (1, 6-Anhydro-α-d-glucopyranose) in Microorganisms. Agric. Biol. Chem. 55, 515–521.
Kumar, R., Mago, G., Balan, V., Wyman, C.E., 2009. Physical and chemical characterizations of corn stover and poplar solids resulting from leading pretreatment technologies. Bioresour. Technol. 100, 3948–3962. https://doi.org/10.1016/j.biortech.2009.01.075
Lédé, J., 2012. Cellulose pyrolysis kinetics: An historical review on the existence and role of intermediate active cellulose. J. Anal. Appl. Pyrolysis 94, 17–32. https://doi.org/10.1016/j.jaap.2011.12.019
Liu, K., Atiyeh, H.K., Pardo-Planas, O., Ezeji, T.C., Ujor, V., Overton, J.C., Berning, K., Wilkins, M.R., Tanner, R.S., 2015. Butanol production from hydrothermolysis-pretreated switchgrass: Quantification of inhibitors and detoxification of hydrolyzate. Bioresour. Technol. 189, 292–301. https://doi.org/10.1016/j.biortech.2015.04.018
Mes-Hartree, M., Saddler, J.N., 1982. Butanol production of Clostridium acetobutylicum grown on sugars found in hemicellulose hydrolysates. Biotechnol. Lett. 4, 247–252. https://doi.org/10.1007/BF00132395
Obama, P., Ricochon, G., Muniglia, L., Brosse, N., 2012. Combination of enzymatic hydrolysis and ethanol organosolv pretreatments: Effect on lignin structures, delignification yields and cellulose-to-glucose conversion. Bioresour. Technol. 112, 156–163. https://doi.org/10.1016/j.biortech.2012.02.080
OPEC, 2016. World Oil Outlook.
191
Palmqvist, E., Hahn-Hägerdal, B., 2000. Fermentation of lignocellulosic hydrolysates. II: inhibitors and mechanisms of inhibition. Bioresour. Technol. 74, 25–33. https://doi.org/10.1016/S0960-8524(99)00161-3
Pan, X., Gilkes, N., Kadla, J., Pye, K., Saka, S., Gregg, D., Ehara, K., Xie, D., Lam, D., Saddler, J., 2006. Bioconversion of hybrid poplar to ethanol and co-products using an organosolv fractionation process: Optimization of process yields. Biotechnol. Bioeng. 94, 851–861. https://doi.org/10.1002/bit.20905
Qureshi, N., Bowman, M.J., Saha, B.C., Hector, R., Berhow, M.A., Cotta, M.A., 2012. Effect of cellulosic sugar degradation products (furfural and hydroxymethyl furfural) on acetone–butanol–ethanol (ABE) fermentation using Clostridium beijerinckii P260. Food Bioprod. Process. 90, 533–540. https://doi.org/10.1016/j.fbp.2011.09.002
Raganati, F., Olivieri, G., Götz, P., Marzocchella, A., Salatino, P., 2015. Butanol production from hexoses and pentoses by fermentation of Clostridium acetobutylicum. Anaerobe 34, 146–155. https://doi.org/10.1016/j.anaerobe.2015.05.008
Ragauskas, A.J., Nagy, M., Kim, D.H., Eckert, C.A., Hallett, J.P., Liotta, C.L., 2006a. From wood to fuels: Integrating biofuels and pulp production. Ind. Biotechnol. 2, 55–65. https://doi.org/10.1089/ind.2006.2.55
Ragauskas, A.J., Williams, C.K., Davison, B.H., Britovsek, G., Cairney, J., Eckert, C.A., Frederick, W.J., Hallett, J.P., Leak, D.J., Liotta, C.L., Mielenz, J.R., Murphy, R., Templer, R., Tschaplinski, T., 2006b. The Path Forward for Biofuels and Biomaterials. Science 311, 484–489. https://doi.org/10.1126/science.1114736
Siqueira, G., Várnai, A., Ferraz, A., Milagres, A.M.F., 2013. Enhancement of cellulose hydrolysis in sugarcane bagasse by the selective removal of lignin with sodium chlorite. Appl. Energy, Special Issue on Advances in sustainable biofuel production and use - XIX International Symposium on Alcohol Fuels - ISAF 102, 399–402. https://doi.org/10.1016/j.apenergy.2012.07.029
Survase, S.A., Heiningen, A. van, Granström, T., 2011. Continuous bio-catalytic conversion of sugar mixture to acetone–butanol–ethanol by immobilized Clostridium acetobutylicum DSM 792. Appl. Microbiol. Biotechnol. 93, 2309–2316. https://doi.org/10.1007/s00253-011-3761-x
Yu, Y., Wu, H., 2010. Significant Differences in the Hydrolysis Behavior of Amorphous and Crystalline Portions within Microcrystalline Cellulose in Hot-Compressed Water. Ind. Eng. Chem. Res. 49, 3902–3909. https://doi.org/10.1021/ie901925g
Yu, Y., Wu, H., 2009. Characteristics and Precipitation of Glucose Oligomers in the Fresh Liquid Products Obtained from the Hydrolysis of Cellulose in Hot-Compressed Water. Ind. Eng. Chem. Res. 48, 10682–10690. https://doi.org/10.1021/ie900768m
Zhang, Y., Han, B., Ezeji, T.C., 2012. Biotransformation of furfural and 5-hydroxymethyl furfural (HMF) by Clostridium acetobutylicum ATCC 824 during butanol fermentation. New Biotechnol. 29, 345–351. https://doi.org/10.1016/j.nbt.2011.09.001

192
193
III. Integration of thermochemical and
biochemical processes
This section presents one article on a model developed in Aspen Plus® showing the integration
of all the processes of the proposed biorefinery: organosolv fractionation of beech wood,
hydrothermal liquefaction of the cellulose-rich pulp and fermentation of the sugar mixture by C.
acetobutylicum. The recovery of lignin and hemicellulose are also included in this model. This
model facilitates the establishment of the mass and energy balances. A simple energy analysis is
assessed for the operation units used in this biorefinery strategy, in order to identify the critical
points to optimize in terms of energetic performance.
1. Article 5:
Process integration modeling for a wood
biorefinery: Pulping, Liquefaction and
Fermentation to produce Building Blocks
Article in preparation.
1.1. Introduction
One of the major concerns of the actual society is the necessity of fossil resources to produce fuels
and building blocks.(Ragauskas, Williams, et al. 2006; Ragauskas, Nagy, et al. 2006; P. F. H.
Harmsen, Hackmann, and Bos 2014; Choi et al. 2015) Lignocellulosic biomass is now considered
194
one of the most promising sources of renewable carbon in order to replace the fossil-based ones.
Biomass is mainly composed of cellulose (40-60wt.%), hemicellulose (20-40wt.%) and lignin (15-
35wt.%). These macromolecules form a tridimensional matrix that protects biomass from
chemical and biological conversion, impelling different pretreatments processes to valorize this
renewable resource effectively.(Mosier et al. 2005; Alvira et al. 2010; P. Harmsen et al. 2010)
Each one of these macromolecules is a potential resources to produce a variety of chemicals with
different functionalized groups of interest in different sectors of the industrial market.(Briens,
Piskorz, and Berruti 2008; García et al. 2011; Amidon et al. 2011)
The conversion of biomass into fuels and chemicals requires several operation units that vary
according to the industrial and chemical market needs.
Fractionation (or pulping) processes, such as: Kraft,(Chakar and Ragauskas 2004)
organosolv,(Brosse, Sannigrahi, and Ragauskas 2009; García et al. 2011) chlorite/acid,(Campbell
and McDonald 1952; Siqueira et al. 2013) ionic liquids,(Lee et al. 2009) ozone,(Alvira et al. 2010)
among others,(Mosier et al. 2005; Alvira et al. 2010; Moreno et al. 2015) allow separating these 3
macromolecules. Then each fraction will be subjected to the most convenient process for its
valorization.
Raw or fractionated biomass can be converted into chemicals of industrial interest by different
processes: 1) chemical (acid/basic impregnation, hydrolysis, catalysis),(Rinaldi and Schüth 2009;
Jiang et al. 2015) 2) thermochemical (pyrolysis, hydrothermal liquefaction, gasification)(Peterson
et al. 2008; Elliott 2008; Bridgwater 2012) and 3) biological (enzymatic hydrolysis, fermentation,
anaerobic digestion)(Chen et al. 2015; Moreno et al. 2015) processes.
The development of a multifunctional biorefinery integrating different of these technologies is
required for a cost-effective valorization of biomass. Process modeling is a powerful tool to
analyze and optimize the design and energy performance of the combined technologies used in
biorefineries. (García et al. 2011; Jones et al. 2014; Duque, Cardona, and Moncada 2015)
195
Numerous authors have reported models able to represent technologies used in a biorefinery
using Aspen Plus®,.(Nikoo and Mahinpey 2008; Abdelouahed et al. 2012; François et al. 2013;
Liu, Zhang, and Bao 2016) a commercial simulation software. NREL has reported a model of an
integrated biorefinery for the production of bioethanol from corn stover. In this model the main
sections are pretreatment of biomass, enzymatic hydrolysis, fermentation and production of
enzymes.(“Biorefinery Analysis Process Models | NREL” n.d.; Wooley and Putsche 1996)
However, only few works have yet reported an integrated biorefinery process based on
experimental data. Furthermore, no biorefinery model has been yet presented combining biomass
pulping, depolymerization of the pulp by a thermochemical process and followed by
fermentation of the as-produced sugars.
In this work, a model representing the valorization of beech wood in biorefinery was assessed.
The proposed biorefinery process is divided in three sections. Firstly, biomass pulping by
organosolv process recovering separated fractions rich in cellulose, hemicellulose and lignin
respectively.
Secondly, the cellulose-rich pulp is depolymerized by hydrothermal liquefaction allowing
producing water soluble sugars.
Finally, the sugars obtained are used as substrate in a fermentation process to produce building
blocks such as: butanol, acetone, ethanol, acetic acid, butyric acid and hydrogen.
Experimental data was collected by the authors for all three sections. Operating conditions, yields
and concentrations were simulated according to this data.

196
The model obtained allows establishing an energy and mass balance from raw biomass to
targeted building blocks. The purpose of this work is to build a simplified (but realistic) process
model of an integrated biorefinery based on various experimental results.
1.2. Presentation of the Aspen Plus® model
1.2.1. Overview of the process
The proposed biorefinery process includes three stages: pulping, liquefaction and fermentation.
Experimental studies of all three stages have been already performed and reported in results
section I and II. In those sections there is more information about the set-ups used for those
experimental works.
Figure 48. Scheme of the biorefinery process
The biorefinery process, including pulping, liquefaction and fermentation, was developed using
the commercial simulation software Aspen Plus®. An overview of the biorefinery process
proposed is shown in Figure 48.
OrganosolvFractionation
LigninRecovery
HydrothermalDepolymerization
FermentationAcidogenesis Solventogenesis
Beech
H2O/EtOHLignin
Hemicelluloses
Pulp(Cellulose-rich)
Sugars
Bacteria
Building Blocks
Gas
H2O
H2O
180ᵒC
180-240ᵒC 37ᵒC
20ᵒC
Gas
Hydrochar
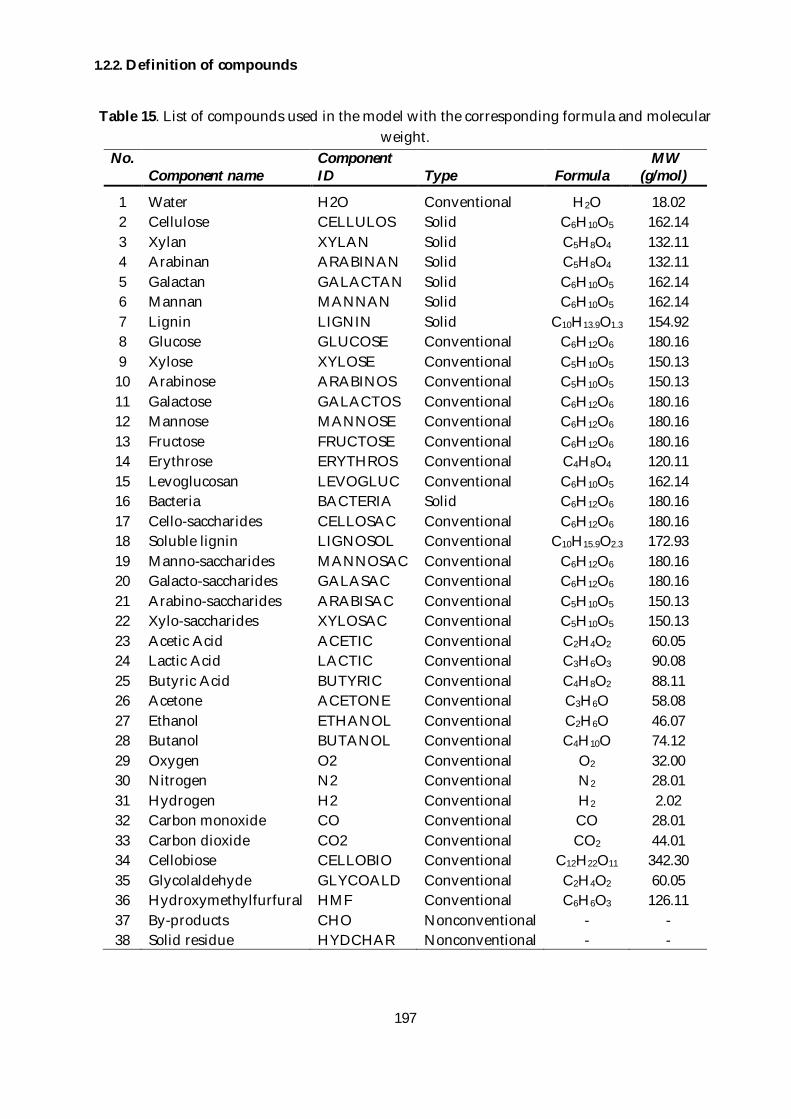
197
1.2.2. Definition of compounds
Table 15. List of compounds used in the model with the corresponding formula and molecular weight.
No. Component name
Component ID Type Formula
MW (g/mol)
1 Water H2O Conventional H2O 18.02 2 Cellulose CELLULOS Solid C6H10O5 162.14 3 Xylan XYLAN Solid C5H8O4 132.11 4 Arabinan ARABINAN Solid C5H8O4 132.11 5 Galactan GALACTAN Solid C6H10O5 162.14 6 Mannan MANNAN Solid C6H10O5 162.14 7 Lignin LIGNIN Solid C10H13.9O1.3 154.92 8 Glucose GLUCOSE Conventional C6H12O6 180.16 9 Xylose XYLOSE Conventional C5H10O5 150.13
10 Arabinose ARABINOS Conventional C5H10O5 150.13 11 Galactose GALACTOS Conventional C6H12O6 180.16 12 Mannose MANNOSE Conventional C6H12O6 180.16 13 Fructose FRUCTOSE Conventional C6H12O6 180.16 14 Erythrose ERYTHROS Conventional C4H8O4 120.11 15 Levoglucosan LEVOGLUC Conventional C6H10O5 162.14 16 Bacteria BACTERIA Solid C6H12O6 180.16 17 Cello-saccharides CELLOSAC Conventional C6H12O6 180.16 18 Soluble lignin LIGNOSOL Conventional C10H15.9O2.3 172.93 19 Manno-saccharides MANNOSAC Conventional C6H12O6 180.16 20 Galacto-saccharides GALASAC Conventional C6H12O6 180.16 21 Arabino-saccharides ARABISAC Conventional C5H10O5 150.13 22 Xylo-saccharides XYLOSAC Conventional C5H10O5 150.13 23 Acetic Acid ACETIC Conventional C2H4O2 60.05 24 Lactic Acid LACTIC Conventional C3H6O3 90.08 25 Butyric Acid BUTYRIC Conventional C4H8O2 88.11 26 Acetone ACETONE Conventional C3H6O 58.08 27 Ethanol ETHANOL Conventional C2H6O 46.07 28 Butanol BUTANOL Conventional C4H10O 74.12 29 Oxygen O2 Conventional O2 32.00 30 Nitrogen N2 Conventional N2 28.01 31 Hydrogen H2 Conventional H2 2.02 32 Carbon monoxide CO Conventional CO 28.01 33 Carbon dioxide CO2 Conventional CO2 44.01 34 Cellobiose CELLOBIO Conventional C12H22O11 342.30 35 Glycolaldehyde GLYCOALD Conventional C2H4O2 60.05 36 Hydroxymethylfurfural HMF Conventional C6H6O3 126.11 37 By-products CHO Nonconventional - - 38 Solid residue HYDCHAR Nonconventional - -
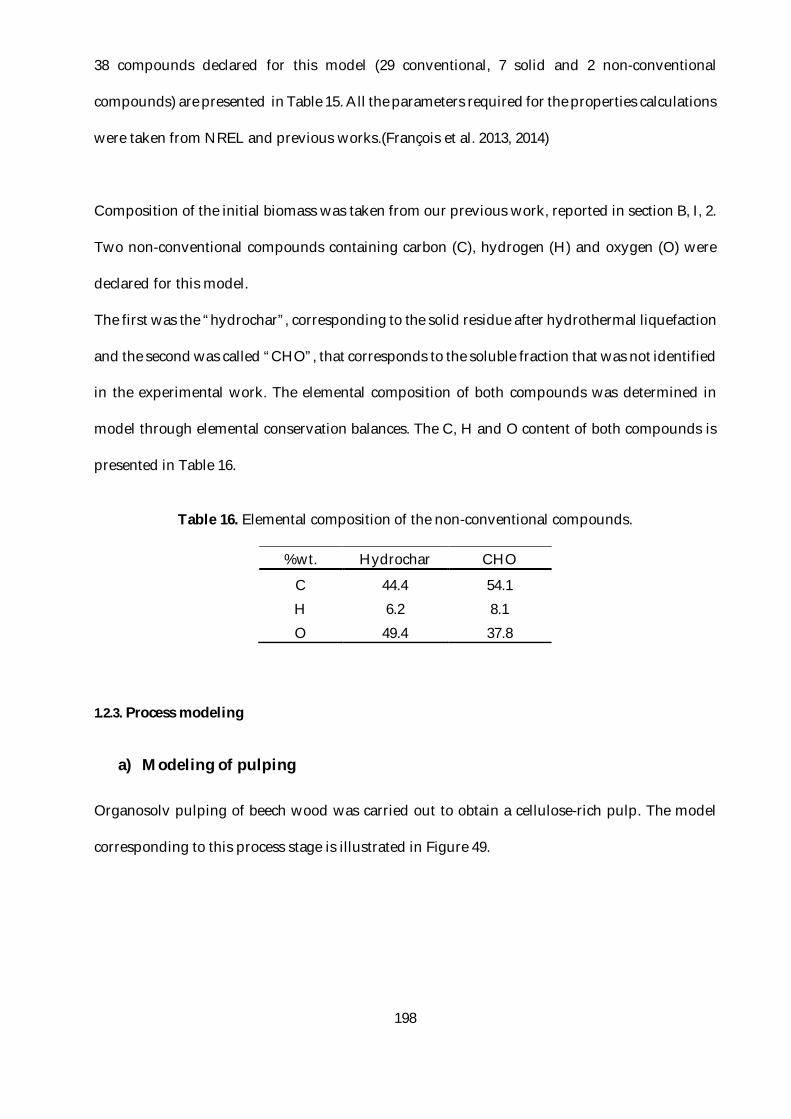
198
38 compounds declared for this model (29 conventional, 7 solid and 2 non-conventional
compounds) are presented in Table 15. All the parameters required for the properties calculations
were taken from NREL and previous works.(François et al. 2013, 2014)
Composition of the initial biomass was taken from our previous work, reported in section B, I, 2.
Two non-conventional compounds containing carbon (C), hydrogen (H) and oxygen (O) were
declared for this model.
The first was the “hydrochar”, corresponding to the solid residue after hydrothermal liquefaction
and the second was called “CHO”, that corresponds to the soluble fraction that was not identified
in the experimental work. The elemental composition of both compounds was determined in
model through elemental conservation balances. The C, H and O content of both compounds is
presented in Table 16.
Table 16. Elemental composition of the non-conventional compounds.
%wt. Hydrochar CHO
C 44.4 54.1 H 6.2 8.1 O 49.4 37.8
1.2.3. Process modeling
a) Modeling of pulping
Organosolv pulping of beech wood was carried out to obtain a cellulose-rich pulp. The model
corresponding to this process stage is illustrated in Figure 49.
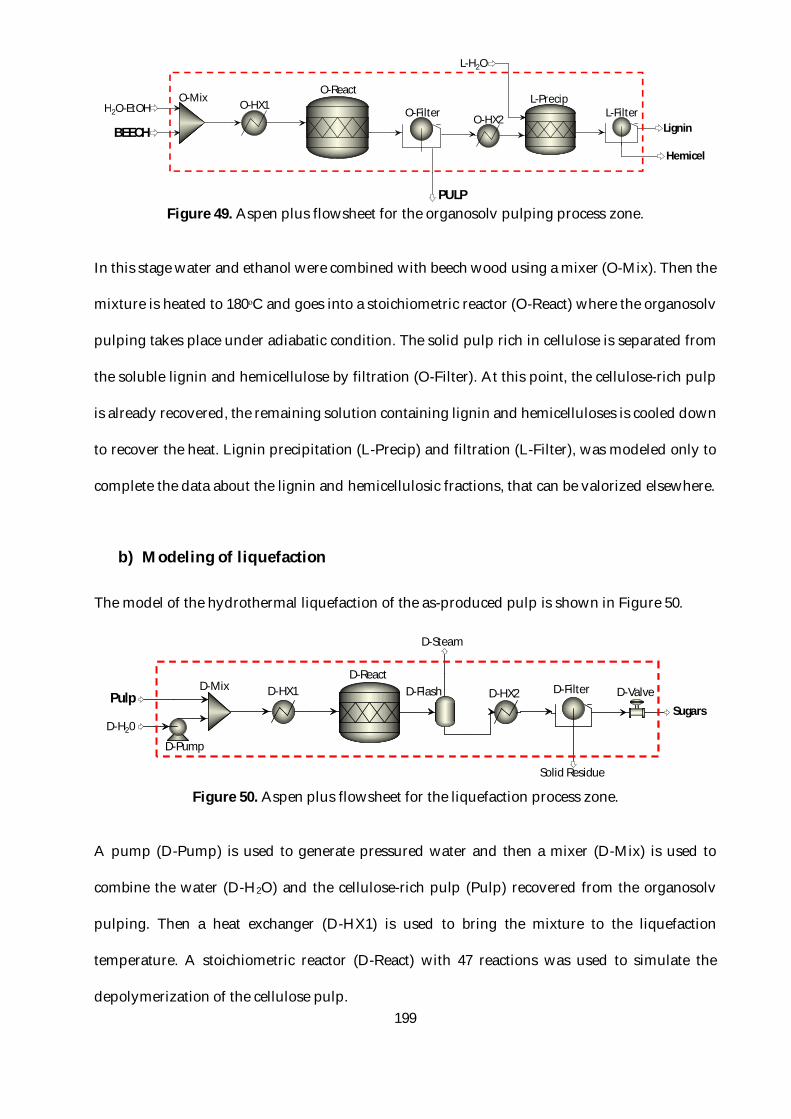
199
Figure 49. Aspen plus flowsheet for the organosolv pulping process zone.
In this stage water and ethanol were combined with beech wood using a mixer (O-Mix). Then the
mixture is heated to 180ᵒC and goes into a stoichiometric reactor (O-React) where the organosolv
pulping takes place under adiabatic condition. The solid pulp rich in cellulose is separated from
the soluble lignin and hemicellulose by filtration (O-Filter). At this point, the cellulose-rich pulp
is already recovered, the remaining solution containing lignin and hemicelluloses is cooled down
to recover the heat. Lignin precipitation (L-Precip) and filtration (L-Filter), was modeled only to
complete the data about the lignin and hemicellulosic fractions, that can be valorized elsewhere.
b) Modeling of liquefaction
The model of the hydrothermal liquefaction of the as-produced pulp is shown in Figure 50.
Figure 50. Aspen plus flowsheet for the liquefaction process zone.
A pump (D-Pump) is used to generate pressured water and then a mixer (D-Mix) is used to
combine the water (D-H2O) and the cellulose-rich pulp (Pulp) recovered from the organosolv
pulping. Then a heat exchanger (D-HX1) is used to bring the mixture to the liquefaction
temperature. A stoichiometric reactor (D-React) with 47 reactions was used to simulate the
depolymerization of the cellulose pulp.
H2O-EtOH
BEECH
L-H2O
PULP
Lignin
Hemicel
O-MixO-HX1
O-HX2O-Filter L-FilterL-Precip
O-React
D-H20
D-HX1Pulp D-HX2Sugars
Solid Residue
D-Steam
D-ReactD-Mix D-Flash D-Filter D-Valve
D-Pump
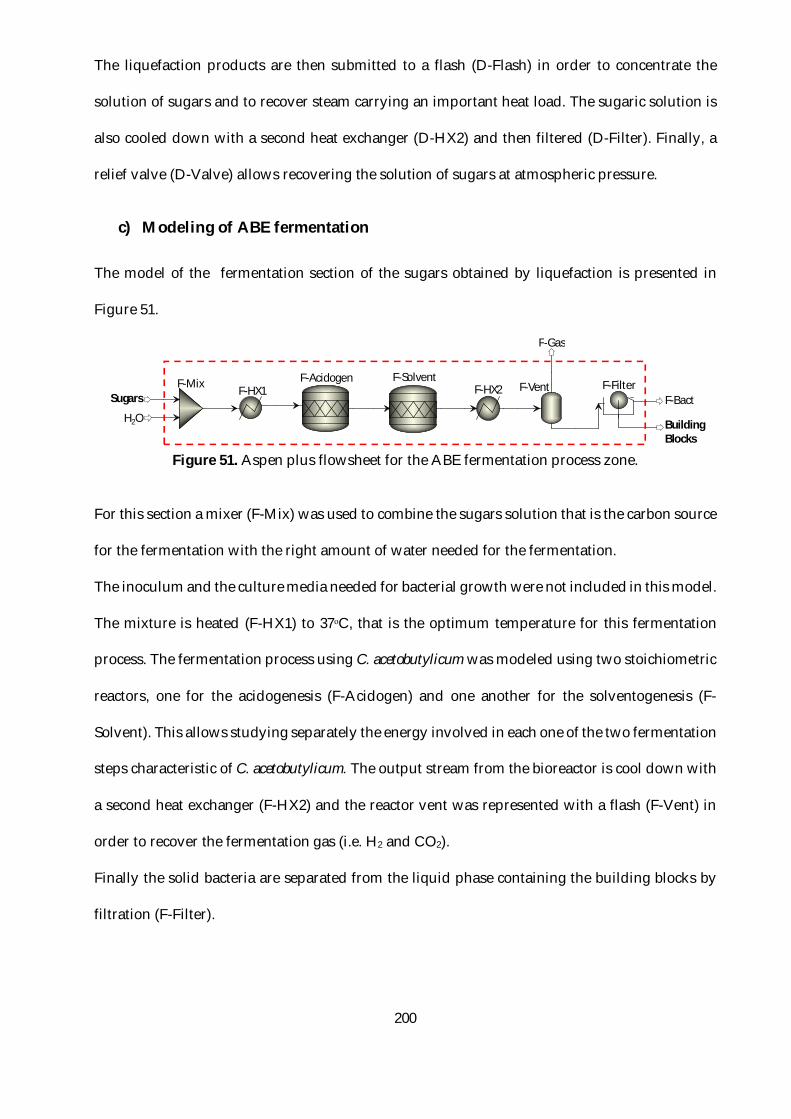
200
The liquefaction products are then submitted to a flash (D-Flash) in order to concentrate the
solution of sugars and to recover steam carrying an important heat load. The sugaric solution is
also cooled down with a second heat exchanger (D-HX2) and then filtered (D-Filter). Finally, a
relief valve (D-Valve) allows recovering the solution of sugars at atmospheric pressure.
c) Modeling of ABE fermentation
The model of the fermentation section of the sugars obtained by liquefaction is presented in
Figure 51.
Figure 51. Aspen plus flowsheet for the ABE fermentation process zone.
For this section a mixer (F-Mix) was used to combine the sugars solution that is the carbon source
for the fermentation with the right amount of water needed for the fermentation.
The inoculum and the culture media needed for bacterial growth were not included in this model.
The mixture is heated (F-HX1) to 37ᵒC, that is the optimum temperature for this fermentation
process. The fermentation process using C. acetobutylicum was modeled using two stoichiometric
reactors, one for the acidogenesis (F-Acidogen) and one another for the solventogenesis (F-
Solvent). This allows studying separately the energy involved in each one of the two fermentation
steps characteristic of C. acetobutylicum. The output stream from the bioreactor is cool down with
a second heat exchanger (F-HX2) and the reactor vent was represented with a flash (F-Vent) in
order to recover the fermentation gas (i.e. H2 and CO2).
Finally the solid bacteria are separated from the liquid phase containing the building blocks by
filtration (F-Filter).
Sugars
H2O
F-Mix F-HX1 F-HX2F-Acidogen F-Solvent
F-Vent F-Filter
F-Gas
F-Bact
BuildingBlocks
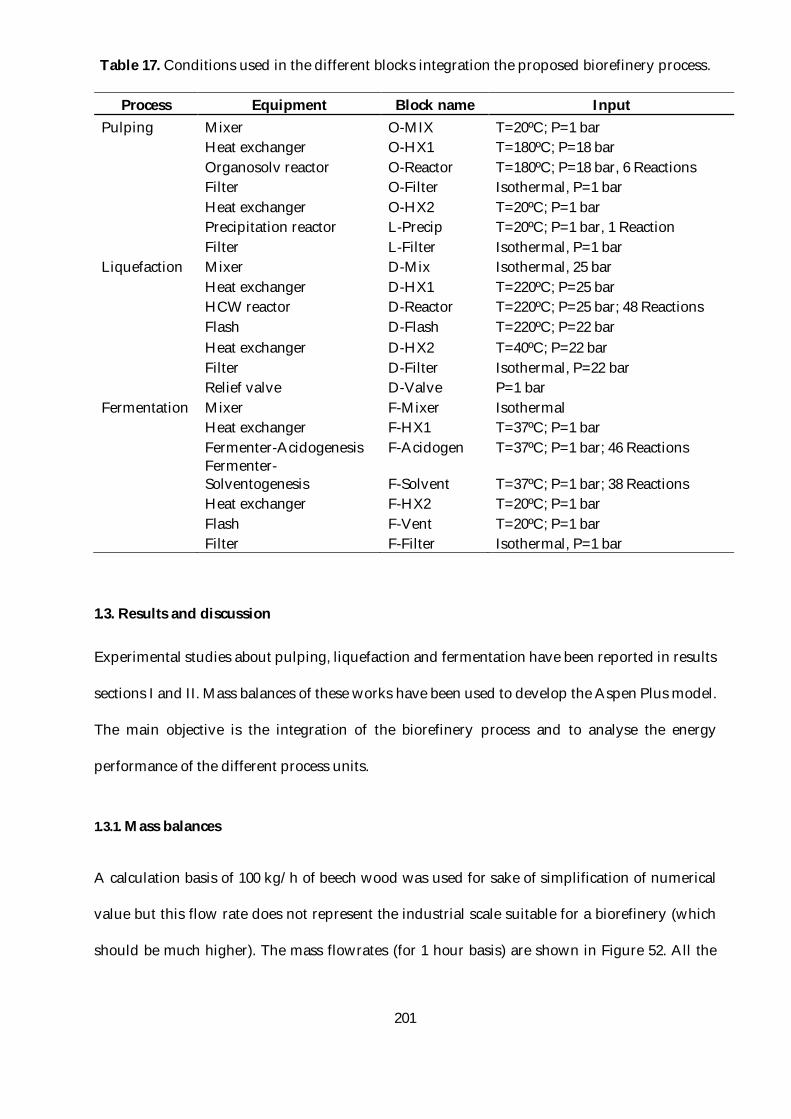
201
Table 17. Conditions used in the different blocks integration the proposed biorefinery process.
Process Equipment Block name Input Pulping Mixer O-MIX T=20ºC; P=1 bar Heat exchanger O-HX1 T=180ºC; P=18 bar Organosolv reactor O-Reactor T=180ºC; P=18 bar, 6 Reactions Filter O-Filter Isothermal, P=1 bar Heat exchanger O-HX2 T=20ºC; P=1 bar Precipitation reactor L-Precip T=20ºC; P=1 bar, 1 Reaction Filter L-Filter Isothermal, P=1 bar Liquefaction Mixer D-Mix Isothermal, 25 bar Heat exchanger D-HX1 T=220ºC; P=25 bar HCW reactor D-Reactor T=220ºC; P=25 bar; 48 Reactions Flash D-Flash T=220ºC; P=22 bar Heat exchanger D-HX2 T=40ºC; P=22 bar Filter D-Filter Isothermal, P=22 bar Relief valve D-Valve P=1 bar Fermentation Mixer F-Mixer Isothermal Heat exchanger F-HX1 T=37ºC; P=1 bar Fermenter-Acidogenesis F-Acidogen T=37ºC; P=1 bar; 46 Reactions
Fermenter-Solventogenesis F-Solvent T=37ºC; P=1 bar; 38 Reactions
Heat exchanger F-HX2 T=20ºC; P=1 bar Flash F-Vent T=20ºC; P=1 bar Filter F-Filter Isothermal, P=1 bar
1.3. Results and discussion
Experimental studies about pulping, liquefaction and fermentation have been reported in results
sections I and II. Mass balances of these works have been used to develop the Aspen Plus model.
The main objective is the integration of the biorefinery process and to analyse the energy
performance of the different process units.
1.3.1. Mass balances
A calculation basis of 100 kg/h of beech wood was used for sake of simplification of numerical
value but this flow rate does not represent the industrial scale suitable for a biorefinery (which
should be much higher). The mass flowrates (for 1 hour basis) are shown in Figure 52. All the
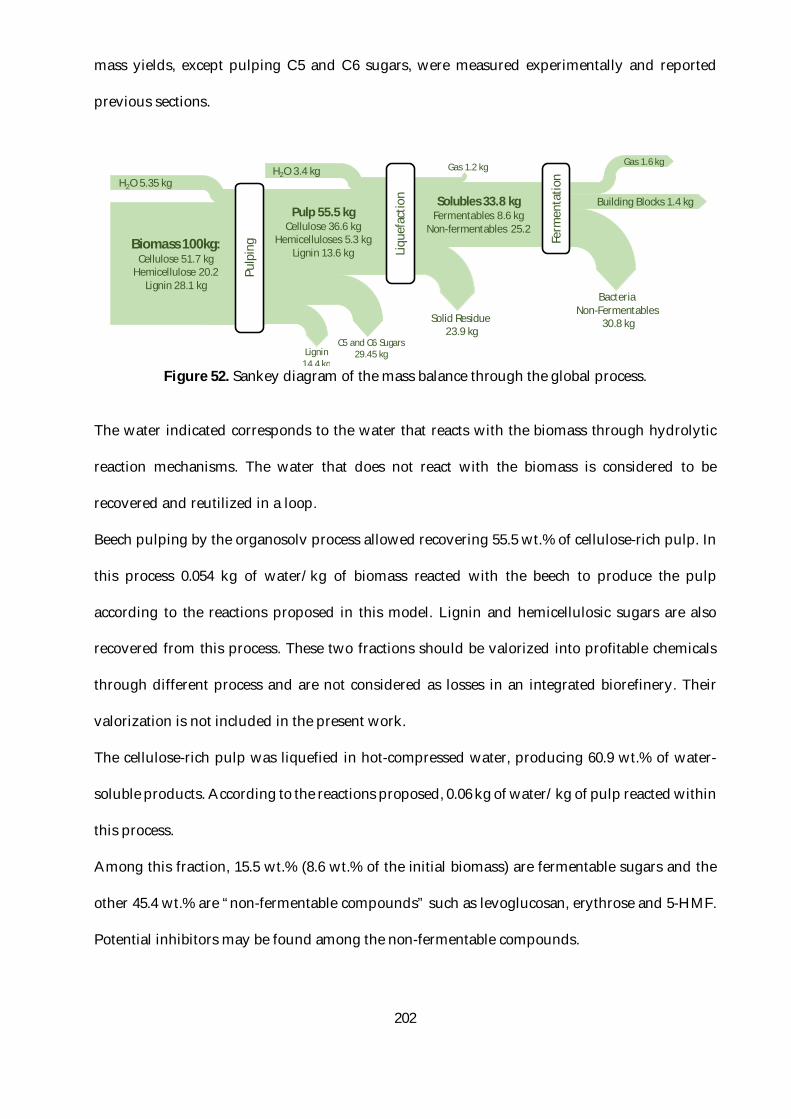
202
mass yields, except pulping C5 and C6 sugars, were measured experimentally and reported
previous sections.
Figure 52. Sankey diagram of the mass balance through the global process.
The water indicated corresponds to the water that reacts with the biomass through hydrolytic
reaction mechanisms. The water that does not react with the biomass is considered to be
recovered and reutilized in a loop.
Beech pulping by the organosolv process allowed recovering 55.5 wt.% of cellulose-rich pulp. In
this process 0.054 kg of water/kg of biomass reacted with the beech to produce the pulp
according to the reactions proposed in this model. Lignin and hemicellulosic sugars are also
recovered from this process. These two fractions should be valorized into profitable chemicals
through different process and are not considered as losses in an integrated biorefinery. Their
valorization is not included in the present work.
The cellulose-rich pulp was liquefied in hot-compressed water, producing 60.9 wt.% of water-
soluble products. According to the reactions proposed, 0.06 kg of water/kg of pulp reacted within
this process.
Among this fraction, 15.5 wt.% (8.6 wt.% of the initial biomass) are fermentable sugars and the
other 45.4 wt.% are “non-fermentable compounds” such as levoglucosan, erythrose and 5-HMF.
Potential inhibitors may be found among the non-fermentable compounds.
Biomass 100kg:Cellulose 51.7 kg
Hemicellulose 20.2Lignin 28.1 kg
Pulp 55.5 kgCellulose 36.6 kg
Hemicelluloses 5.3 kgLignin 13.6 kg
C5 and C6 Sugars29.45 kg
H2O 3.4 kg
Solid Residue23.9 kg
Solubles 33.8 kgFermentables 8.6 kg
Non-fermentables 25.2
Building Blocks 1.4 kg
Ferm
enta
tion
Gas 1.6 kg
BacteriaNon-Fermentables
30.8 kg
Lignin14.4 kg
H2O 5.35 kg
Pulp
ing
Liqu
efac
tion
Gas 1.2 kg
203
Detailed information about the water soluble fraction after liquefaction can be found in section
B, I, 1.
In the final stage, the water-soluble fraction was fermented using C. acetobutylicum where 16.3
wt.% of the fermentable sugars (1.4 wt.% of the original biomass) are transformed into building
blocks (i.e. butanol, acetone, ethanol, butyric acid, acetic acid, lactic acid) which is a very small
mass yields. Therefore, this type of biorefinery could not be of interest if optimized and notably
if all the streams (lignin, hemicelluloses, not sugaric products) not yet considered in this work are
also converted into added-value products.
Gas produced in the ABE fermentation process is a mixture of hydrogen (H2) and carbon dioxide
(CO2). The gas mass and composition were calculated according to the reactions proposed in the
model, giving 4.7 wt.% (relative to the fermentable sugars) of gas with a composition of 92.5 wt.%
of CO2, 3.1 wt.% of H2 and 4.4 wt.% of H2O that evaporates in the flash module.
The H2/CO2 molar ratio is 1.35 that is in agreement with those found in the literature for the ABE
fermentation using clostridia sp.((Vasconcelos, Girbal, and Soucaille 1994; Girbal et al. 1995)
The yield of each one of the three stages is in agreement with the literature.(Ragauskas et al. 2006;
Brosse, Sannigrahi, and Ragauskas 2009; Yu and Wu 2010; Gao et al. 2014; Raganati et al. 2015)
However, to the best of our knowledge, this is the first work combining these three processes
including pulping, hydrothermal liquefaction and ABE fermentation.
Several other processes allow the recovery of similar yields of building blocks. Nevertheless,
these processes use complicated pretreatments requiring hazardous chemicals and high
quantities of energy.(Mosier et al. 2005; Alvira et al. 2010) After biomass pretreatment and/or
fractionation, an expensive enzymatic hydrolysis that lasts 2 or 3 days is used for its
depolymerization(Chum et al. 1988; Jiang et al. 2016), in comparison with the sugar production
by liquefaction proposed here that may last 2 or 3 hours.
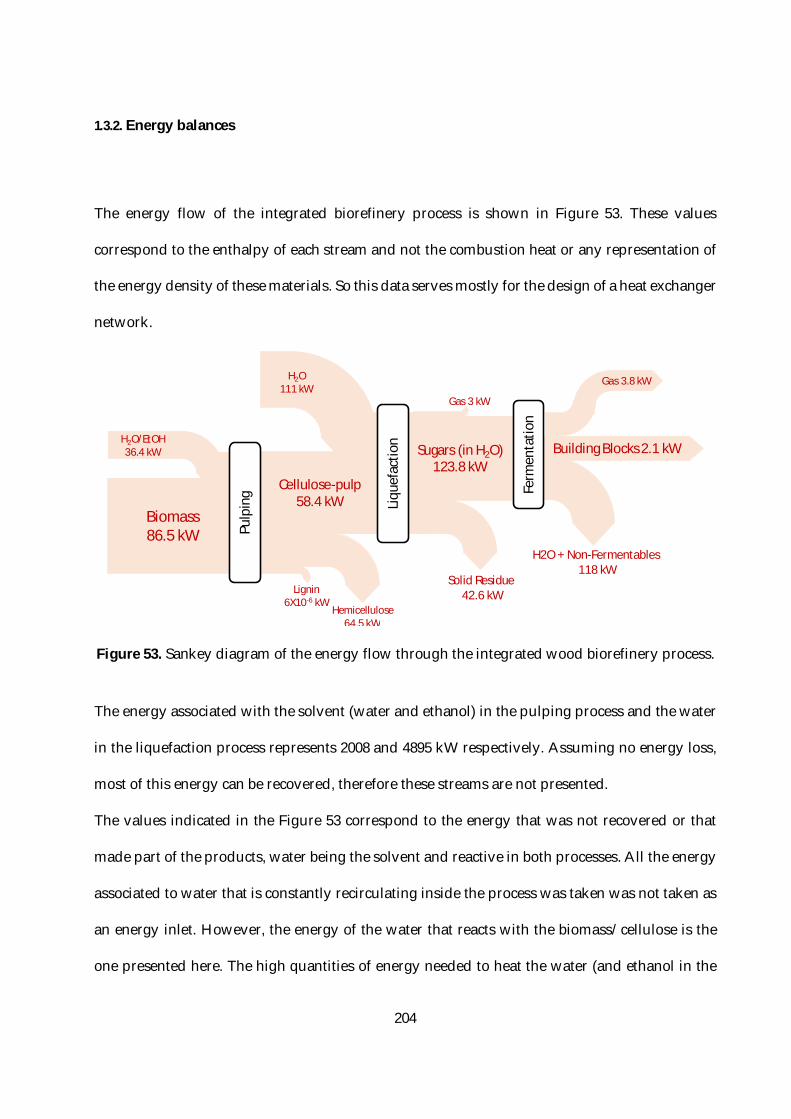
204
1.3.2. Energy balances
The energy flow of the integrated biorefinery process is shown in Figure 53. These values
correspond to the enthalpy of each stream and not the combustion heat or any representation of
the energy density of these materials. So this data serves mostly for the design of a heat exchanger
network.
Figure 53. Sankey diagram of the energy flow through the integrated wood biorefinery process.
The energy associated with the solvent (water and ethanol) in the pulping process and the water
in the liquefaction process represents 2008 and 4895 kW respectively. Assuming no energy loss,
most of this energy can be recovered, therefore these streams are not presented.
The values indicated in the Figure 53 correspond to the energy that was not recovered or that
made part of the products, water being the solvent and reactive in both processes. All the energy
associated to water that is constantly recirculating inside the process was taken was not taken as
an energy inlet. However, the energy of the water that reacts with the biomass/cellulose is the
one presented here. The high quantities of energy needed to heat the water (and ethanol in the
H2O/EtOH36.4 kW
Biomass86.5 kW
Cellulose-pulp58.4 kW
Pulp
ing
Hemicellulose64.5 kW
Lignin6X10-6 kW
H2O111 kW
Solid Residue42.6 kW
Sugars (in H2O)123.8 kW
Building Blocks 2.1 kW
Ferm
enta
tion
Gas 3.8 kW
H2O + Non-Fermentables118 kW
Liqu
efac
tion
Gas 3 kW
205
case of the pulping) that can be recovered impels the utilization of an integrated heat exchangers
network.
The reactor for the organosolv fractionation was set in adiabatic mode instead of isothermal
mode. In adiabatic mode temperature increases only 5ᵒC, that are not detrimental for this process.
Moreover, this will avoid an additional heat exchanger needed if it was isothermal, only to recover a
relatively low quantity of energy.
Initial biomass and solvent (water/ethanol) used in the pulping process represent 86.5 and 36.4
kW respectively. Most of the energy used in the pulping stage is needed to heat the solvents. Most
of this energy is recovered after the pulp which is separated by filtration.
A cellulose-rich pulp, solid lignin and a hemicellulosic solution with enthalpic 58.4, 6x10⁻⁶ and
64.5 kW are obtained from this fractionation process. The lignin and hemicellulosic sugars can be
valorized in other processes.
Cellulose-pulp is then liquefied in hot-compressed water. The water used for this process carries
an energy flow of 111 kW. This is the most energetically expensive stage due to the heating of the
water but mostly to the energy needed to evaporate and concentrate the sugar solution after
liquefaction. A solid residue partially carbonized with 42.6 kW can be recovered to be valorized
in another process or to produce heat. Small amount of permanent gas with 3 kW are also
produced.
The water solubles are then fermented producing building blocks and permanent gas containing
2.1 and 3.8 kW. The remaining water, bacteria and non-fermentable compounds represent 118
kW, that is most of the energy. Most of the enthalpy associated with compounds that are not
metabolized during the fermentation can be separated in order to improve the energy
performance of this stage.
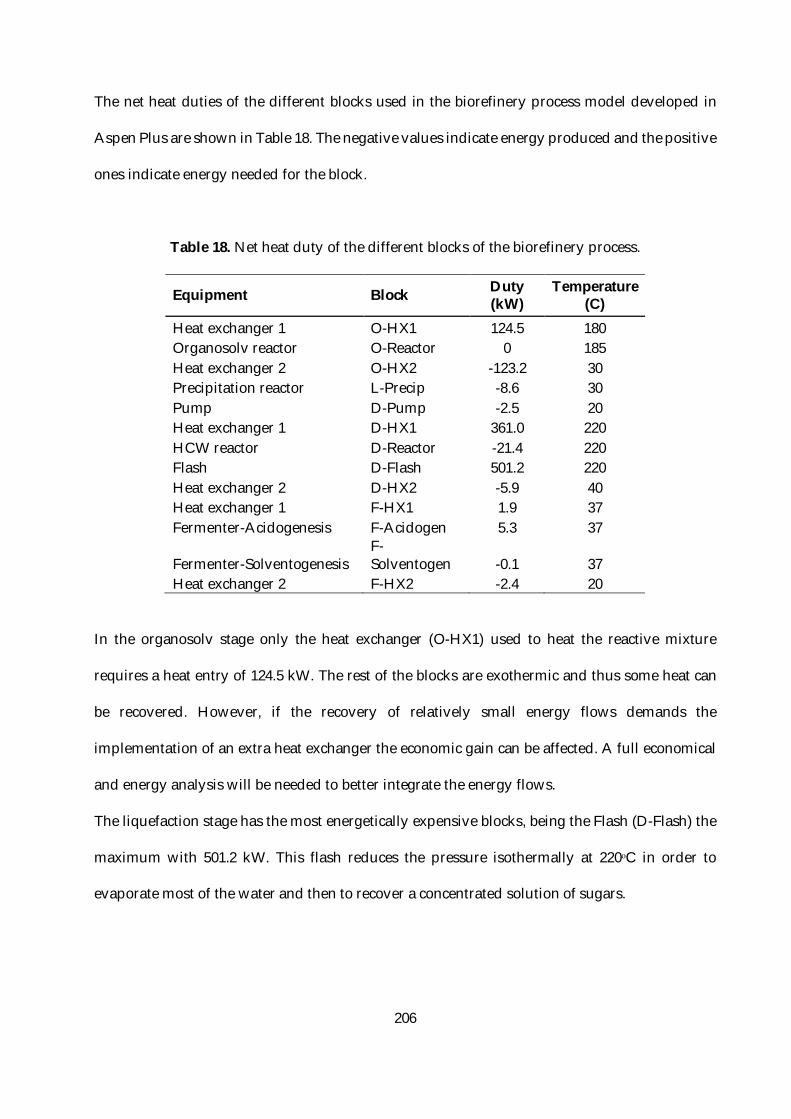
206
The net heat duties of the different blocks used in the biorefinery process model developed in
Aspen Plus are shown in Table 18. The negative values indicate energy produced and the positive
ones indicate energy needed for the block.
Table 18. Net heat duty of the different blocks of the biorefinery process.
Equipment Block Duty (kW)
Temperature (C)
Heat exchanger 1 O-HX1 124.5 180 Organosolv reactor O-Reactor 0 185 Heat exchanger 2 O-HX2 -123.2 30 Precipitation reactor L-Precip -8.6 30 Pump D-Pump -2.5 20 Heat exchanger 1 D-HX1 361.0 220 HCW reactor D-Reactor -21.4 220 Flash D-Flash 501.2 220 Heat exchanger 2 D-HX2 -5.9 40 Heat exchanger 1 F-HX1 1.9 37 Fermenter-Acidogenesis F-Acidogen 5.3 37
Fermenter-Solventogenesis F-Solventogen -0.1 37
Heat exchanger 2 F-HX2 -2.4 20
In the organosolv stage only the heat exchanger (O-HX1) used to heat the reactive mixture
requires a heat entry of 124.5 kW. The rest of the blocks are exothermic and thus some heat can
be recovered. However, if the recovery of relatively small energy flows demands the
implementation of an extra heat exchanger the economic gain can be affected. A full economical
and energy analysis will be needed to better integrate the energy flows.
The liquefaction stage has the most energetically expensive blocks, being the Flash (D-Flash) the
maximum with 501.2 kW. This flash reduces the pressure isothermally at 220ᵒC in order to
evaporate most of the water and then to recover a concentrated solution of sugars.
207
Moreover, the heat exchanger (D-HX1) use to heat the reactive mixture entering the liquefaction
reactor has the second biggest energy demand, converting the liquefaction stage in the critical
point to optimize the energy performance of the global process.
The energy need of the fermentation stage is significantly lower in comparison to the other stages.
The acidogenic phase of the fermentation requires only 5.3 kW, being a hundred times lower than
the flash used during the liquefaction process.
Sugar yield at 180ᵒC is relatively low, and energy load used in the HCW reactor at 240ᵒC is
relatively high. For this reason, temperatures around these values are not attractive for the
production of sugars by hydrothermal liquefaction.
1.4. Conclusion
Process modeling is a powerful approach to analyse the energy and mass balances of the process.
The integrated model presented here demonstrate that the mass yield in ABE products is very
small (1.4wt.%) and that the other streams should be converted into added-value products.
Therefore, many work is still needed to improve the mass yield of biorefineries if bacteria are
used or other process scheme should be looked for (for instance combining thermochemical
depolymerization with chemical catalysis instead of biochemical conversion by bacteria).
The quantity of water used in the hydrothermal liquefaction is the most important variable
affecting the energy efficiency of this biorefinery process and thus the profitability. Using less
water for this stage or the implementation of a technology producing a more concentrated sugaric
solutions (as pyrolysis) are the most important points to optimize this process.
Moreover, the fractionation reactor (organosolv) was found to be more energetically efficient in
adiabatic mode than in isothermal mode, avoiding the requirement of an extra heat exchanger to
regulate its temperature. Aspen Plus modelling as to be combined with techno-economic analysis
in order to assess better biorefineries integrated processes.
208
References
Abdelouahed, L., O. Authier, G. Mauviel, J. P. Corriou, G. Verdier, and A. Dufour. 2012. “Detailed Modeling of Biomass Gasification in Dual Fluidized Bed Reactors under Aspen Plus.” Energy & Fuels 26 (6): 3840–55. https://doi.org/10.1021/ef300411k.
Alvira, P., E. Tomás-Pejó, M. Ballesteros, and M. J. Negro. 2010. “Pretreatment Technologies for an Efficient Bioethanol Production Process Based on Enzymatic Hydrolysis: A Review.” Bioresource Technology 101 (13): 4851–61. https://doi.org/10.1016/j.biortech.2009.11.093.
Amidon, Thomas E., Biljana Bujanovic, Shijie Liu, and Joel R. Howard. 2011. “Commercializing Biorefinery Technology: A Case for the Multi-Product Pathway to a Viable Biorefinery.” Forests 2 (4): 929–47. https://doi.org/10.3390/f2040929.
“Biorefinery Analysis Process Models | NREL.” n.d. Accessed May 14, 2018. https://www.nrel.gov/extranet/biorefinery/aspen-models/.
Bridgwater, A. V. 2012. “Review of Fast Pyrolysis of Biomass and Product Upgrading.” Biomass and Bioenergy, Overcoming Barriers to Bioenergy: Outcomes of the Bioenergy Network of Excellence 2003 – 2009, 38 (March): 68–94. https://doi.org/10.1016/j.biombioe.2011.01.048.
Briens, Cedric, Jan Piskorz, and Franco Berruti. 2008. “Biomass Valorization for Fuel and Chemicals Production -- A Review.” International Journal of Chemical Reactor Engineering 6 (1). https://doi.org/10.2202/1542-6580.1674.
Brosse, Nicolas, Poulomi Sannigrahi, and Arthur Ragauskas. 2009. “Pretreatment of Miscanthus x Giganteus Using the Ethanol Organosolv Process for Ethanol Production.” Industrial & Engineering Chemistry Research 48 (18): 8328–34. https://doi.org/10.1021/ie9006672.
Buendia-Kandia, Felipe, Guillain Mauviel, Emmanuel Guedon, Emmanuel Rondags, Dominique Petitjean, and Anthony Dufour. 2017. “Decomposition of Cellulose in Hot-Compressed Water: Detailed Analysis of the Products and Effect of Operating Conditions.” Energy & Fuels, November. https://doi.org/10.1021/acs.energyfuels.7b02994.
Buendia-Kandia, Felipe, Emmanuel Rondags, Xavier Framboisier, Guillain Mauviel, Anthony Dufour, and Emmanuel Guedon. 2018. “Diauxic Growth of Clostridium Acetobutylicum ATCC 824 When Grown on Mixtures of Glucose and Cellobiose, Representative of Cellulose Hydrolysis Products.” Submitted.
Campbell, W. G., and I. R. C. McDonald. 1952. “The Chemistry of the Wood Cell Wall. Part I. The Delignification of Beech and Spruce Woods by Sodium Chlorite in Buffered Aqueous Solution.” Journal of the Chemical Society (Resumed), no. 0 (January): 2644–50. https://doi.org/10.1039/JR9520002644.
Chakar, Fadi S., and Arthur J. Ragauskas. 2004. “Review of Current and Future Softwood Kraft Lignin Process Chemistry.” Industrial Crops and Products, 6th International Lignin Institute conference, 20 (2): 131–41. https://doi.org/10.1016/j.indcrop.2004.04.016.
Chen, Hongmei, Jia Zhao, Tianhang Hu, Xuebing Zhao, and Dehua Liu. 2015. “A Comparison of Several Organosolv Pretreatments for Improving the Enzymatic Hydrolysis of Wheat Straw: Substrate Digestibility, Fermentability and Structural Features.” Applied Energy 150 (Supplement C): 224–32. https://doi.org/10.1016/j.apenergy.2015.04.030.
Choi, Sol, Chan Woo Song, Jae Ho Shin, and Sang Yup Lee. 2015. “Biorefineries for the Production of Top Building Block Chemicals and Their Derivatives.” Metabolic Engineering 28 (Supplement C): 223–39. https://doi.org/10.1016/j.ymben.2014.12.007.
209
Chum, H. L., D. K. Johnson, S. Black, J. Baker, K. Grohmann, K. V. Sarkanen, K. Wallace, and H. A. Schroeder. 1988. “Organosolv Pretreatment for Enzymatic Hydrolysis of Poplars: I. Enzyme Hydrolysis of Cellulosic Residues.” Biotechnology and Bioengineering 31 (7): 643–49. https://doi.org/10.1002/bit.260310703.
Duque, Sergio H., Carlos A. Cardona, and Jonathan Moncada. 2015. “Techno-Economic and Environmental Analysis of Ethanol Production from 10 Agroindustrial Residues in Colombia.” Energy & Fuels 29 (2): 775–83. https://doi.org/10.1021/ef5019274.
Elliott, Douglas C. 2008. “Catalytic Hydrothermal Gasification of Biomass.” Biofuels, Bioproducts and Biorefining 2 (3): 254–65. https://doi.org/10.1002/bbb.74.
François, Jessica, Mathieu Fortin, Fabrice Patisson, and Anthony Dufour. 2014. “Assessing the Fate of Nutrients and Carbon in the Bioenergy Chain through the Modeling of Biomass Growth and Conversion.” Environmental Science & Technology 48 (23): 14007–15. https://doi.org/10.1021/es5032823.
François, Jessica, Guillain Mauviel, Michel Feidt, Caroline Rogaume, Yann Rogaume, Olivier Mirgaux, Fabrice Patisson, and Anthony Dufour. 2013. “Modeling of a Biomass Gasification CHP Plant: Influence of Various Parameters on Energetic and Exergetic Efficiencies.” Energy & Fuels 27 (12): 7398–7412. https://doi.org/10.1021/ef4011466.
Gao, Kai, Simone Boiano, Antonio Marzocchella, and Lars Rehmann. 2014. “Cellulosic Butanol Production from Alkali-Pretreated Switchgrass (Panicum Virgatum) and Phragmites (Phragmites Australis).” Bioresource Technology 174 (December): 176–81. https://doi.org/10.1016/j.biortech.2014.09.152.
García, Araceli, María González Alriols, Rodrigo Llano-Ponte, and Jalel Labidi. 2011. “Energy and Economic Assessment of Soda and Organosolv Biorefinery Processes.” Biomass and Bioenergy 35 (1): 516–25. https://doi.org/10.1016/j.biombioe.2010.10.002.
Girbal, Laurence, Christian Croux, Isabel Vasconcelos, and Phillippe Soucaille. 1995. “Regulation of Metabolic Shifts in Clostridium Acetobutylicum ATCC 824.” FEMS Microbiology Reviews 17 (March): 287–97. https://doi.org/doi:10.1016/0168-6445(95)00017-7.
Harmsen, Paulien F. H., Martijn M. Hackmann, and Harriëtte L. Bos. 2014. “Green Building Blocks for Bio-Based Plastics.” Biofuels, Bioproducts and Biorefining 8 (3): 306–24. https://doi.org/10.1002/bbb.1468.
Harmsen, Paulien, Wouter Huijgen, Laura Bermudez, and Robert Bakker. 2010. “Literature Review of Physical and Chemical Pretreatment Processes for Lignocellulosic Biomass.” Energy Research Centre of the Netherlands, 10–13.
Jiang, Liqun, Anqing Zheng, Zengli Zhao, Fang He, Haibin Li, and Weiguo Liu. 2015. “Obtaining Fermentable Sugars by Dilute Acid Hydrolysis of Hemicellulose and Fast Pyrolysis of Cellulose.” Bioresource Technology 182 (April): 364–67. https://doi.org/10.1016/j.biortech.2015.01.032.
Jiang, Liqun, Anqing Zheng, Zengli Zhao, Fang He, Haibin Li, and Nannan Wu. 2016. “The Comparison of Obtaining Fermentable Sugars from Cellulose by Enzymatic Hydrolysis and Fast Pyrolysis.” Bioresource Technology 200 (January): 8–13. https://doi.org/10.1016/j.biortech.2015.09.096.
Jones, Susanne B., Yunhua Zhu, Daniel B. Anderson, Richard T. Hallen, Douglas C. Elliott, Andrew J. Schmidt, Karl O. Albrecht, Todd R. Hart, Mark G. Butcher, and Corinne Drennan. 2014. “Process Design and Economics for the Conversion of Algal Biomass to Hydrocarbons: Whole Algae Hydrothermal Liquefaction and Upgrading.” Pacific Northwest National Laboratory (PNNL), Richland, WA (US).
Lee, Sang Hyun, Thomas V. Doherty, Robert J. Linhardt, and Jonathan S. Dordick. 2009. “Ionic Liquid-Mediated Selective Extraction of Lignin from Wood Leading to Enhanced Enzymatic Cellulose Hydrolysis.” Biotechnology and Bioengineering 102 (5): 1368–76. https://doi.org/10.1002/bit.22179.
210
Liu, Gang, Jian Zhang, and Jie Bao. 2016. “Cost Evaluation of Cellulase Enzyme for Industrial-Scale Cellulosic Ethanol Production Based on Rigorous Aspen Plus Modeling.” Bioprocess and Biosystems Engineering 39 (1): 133–40. https://doi.org/10.1007/s00449-015-1497-1.
Moreno, Antonio D., David Ibarra, Pablo Alvira, Elia Tomás-Pejó, and Mercedes Ballesteros. 2015. “A Review of Biological Delignification and Detoxification Methods for Lignocellulosic Bioethanol Production.” Critical Reviews in Biotechnology 35 (3): 342–54. https://doi.org/10.3109/07388551.2013.878896.
Mosier, Nathan, Charles Wyman, Bruce Dale, Richard Elander, Y. Y. Lee, Mark Holtzapple, and Michael Ladisch. 2005. “Features of Promising Technologies for Pretreatment of Lignocellulosic Biomass.” Bioresource Technology 96 (6): 673–86. https://doi.org/10.1016/j.biortech.2004.06.025.
Nikoo, Mehrdokht B., and Nader Mahinpey. 2008. “Simulation of Biomass Gasification in Fluidized Bed Reactor Using ASPEN PLUS.” Biomass and Bioenergy 32 (12): 1245–54. https://doi.org/10.1016/j.biombioe.2008.02.020.
Peterson, Andrew A., Frédéric Vogel, Russell P. Lachance, Morgan Fröling, Jr Michael J. Antal, and Jefferson W. Tester. 2008. “Thermochemical Biofuel Production in Hydrothermal Media: A Review of Sub- and Supercritical Water Technologies.” Energy & Environmental Science 1 (1): 32–65. https://doi.org/10.1039/B810100K.
Raganati, Francesca, Giuseppe Olivieri, Peter Götz, Antonio Marzocchella, and Piero Salatino. 2015. “Butanol Production from Hexoses and Pentoses by Fermentation of Clostridium Acetobutylicum.” Anaerobe 34 (August): 146–55. https://doi.org/10.1016/j.anaerobe.2015.05.008.
Ragauskas, Arthur J., Máté Nagy, Dong Ho Kim, Charles A. Eckert, Jason P. Hallett, and Charles L. Liotta. 2006. “From Wood to Fuels: Integrating Biofuels and Pulp Production.” Industrial Biotechnology 2 (1): 55–65. https://doi.org/10.1089/ind.2006.2.55.
Ragauskas, Arthur J., Charlotte K. Williams, Brian H. Davison, George Britovsek, John Cairney, Charles A. Eckert, William J. Frederick, et al. 2006. “The Path Forward for Biofuels and Biomaterials.” Science 311 (5760): 484–89. https://doi.org/10.1126/science.1114736.
Rinaldi, Roberto, and Ferdi Schüth. 2009. “Acid Hydrolysis of Cellulose as the Entry Point into Biorefinery Schemes.” ChemSusChem 2 (12): 1096–1107. https://doi.org/10.1002/cssc.200900188.
Siqueira, Germano, Anikó Várnai, André Ferraz, and Adriane M. F. Milagres. 2013. “Enhancement of Cellulose Hydrolysis in Sugarcane Bagasse by the Selective Removal of Lignin with Sodium Chlorite.” Applied Energy, Special Issue on Advances in sustainable biofuel production and use - XIX International Symposium on Alcohol Fuels - ISAF, 102 (February): 399–402. https://doi.org/10.1016/j.apenergy.2012.07.029.
Vasconcelos, I., L. Girbal, and P. Soucaille. 1994. “Regulation of Carbon and Electron Flow in Clostridium Acetobutylicum Grown in Chemostat Culture at Neutral PH on Mixtures of Glucose and Glycerol.” Journal of Bacteriology 176 (5): 1443–50.
Wooley, Robert J., and Victoria Putsche. 1996. “Development of an ASPEN PLUS Physical Property Database for Biofuels Components.”
Yu, Yun, and Hongwei Wu. 2010. “Understanding the Primary Liquid Products of Cellulose Hydrolysis in Hot-Compressed Water at Various Reaction Temperatures.” Energy & Fuels 24 (3): 1963–71. https://doi.org/10.1021/ef9013746.

211

212
213
C. CONCLUSIONS AND
PERSPECTIVES
In this work, a novel biorefinery approach combining thermochemical and biological processes
was proposed. In order to assess the main features and challenges of this methodology,
experimental studies about each one of the stages (fractionation of biomass, hydrothermal
liquefaction and fermentation) were performed in order to assess their combination in an
integrated biorefinery process. A simplified model using Aspen Plus has been developed in order
to assess the global mass and energy balances of this concept.
In the following paragraphs, the general conclusions of these studies are given and they
complement the conclusion presented in each sub-sections. These conclusions are accompanied
with some perspectives indicating the potential pathway for an optimal development of the
biorefinery proposed.
Organosolv and chlorite/acid (SC/AA) fractionation methods allowed recovering cellulose-rich
pulps with low lignin content. These pretreatments not only allow the removal of lignin, but also
the deconstruction of the complex lignocellulosic matrix, lowering the cellulose crystallinity.
SC/AA method gave a pulp with high cellulose and hemicelluloses content. This is an important
difference with the organosolv process. This former pulping method separates the hemicelluloses
from cellulose and hemicelluloses are then recovered with the lignin in the liquid phase.
These processes can be optimized in order to reduce the cellulose loses. Establishing an optimal
organosolv method with ethanol recycling is one of the most important point for its
implementation in industrial processes.
214
Concerning the study on the hydrothermal depolymerization of the microcrystalline cellulose,
several analytical methods were implemented in order to identify and quantify carboxylic acids,
carbohydrates, aldehydes and permanent gas. An improved analytical method using HPAEC-
PAD was developed for the analysis of complex mixtures of mono- and oligosaccharides. These
results allowed identifying the predominant reaction pathways involved during the
hydrothermal liquefaction of cellulose according to the temperature of reactions. In that way, it
was found that 220ᵒC was the best temperature for the production of soluble sugars and that
temperatures higher than 220°C will provoke almost a full decomposition of the sugars (in an
autoclave) by various secondary reactions (e.g. dehydration, retro-aldol condensation,
decarboxylation, decarbonylation). The best temperature range, for 2h of cellulose liquefaction in
a batch reactor, is between 180 and 220ᵒC.
Depolymerization of beech, organosolv and SC/AA pulps was assessed according to the best
conditions obtained during the study with microcrystalline cellulose.
Both pretreatments allowed significant improvement for the sugar production relative to the raw
beech. Since lignin serves as a barrier that increases cellulose recalcitrance, the lower its content
is, easier the depolymerization of cellulose is.
For this study, a batch reactor was used for the hydrothermal depolymerization of the substrates.
However, the sugars that are firstly produced endure secondary reactions that entails to
significant losses of fermentable material. Hydrothermal liquefaction using a fixed-bed reactor
allowed recovering the primary products. However, this technology uses high quantities of
water, which has to be heat up with high quantities of energy and the sugars produced will be
highly diluted.
For these reasons, the best technology for this purpose will require avoiding secondary reactions
as much as possible and the utilization of less water to decrease the energy consumption.
215
The development of a technology able to do this attracted a lot of interest for our team. Hereby,
5-6 months of this PhD were consecrated to develop a biomass conversion technology able to
handle concentrated slurries in continuous mode with a good control of the conversion of the
slurry. This subject is confidential and for this reason no details are given.
This technology will have to be compared more in depth with fast pyrolysis processes (followed
by hydrolysis of the pyrolysis oils). The Aspen Plus model will be refined in order to compare
these 2 types of processes. A technical-economical assessment has to be also conducted.
Several cultures of C. acetobutylicum with model molecules of glucose, cellobiose and
glucose/cellobiose mixtures were studied in order to gather information about its behavior with
cellulose-derived compounds. This study revealed that C. acetobutylicum exhibits a diauxic
growth when the sole carbon source was a mixture of glucose and cellobiose. More studies about
the effect of pH on the induction of cellobiose and the transition from glucose to cellobiose
utilization allowed settling optimal conditions to cultivate C. acetobutylicum in a mixture of
carbohydrates.
The fermentation of sugar mixtures coming from biomass liquefaction by C. acetobutylicum was
very challenging and required exhaustive care in order to achieve the desired fermentation
products pattern.
Since C. acetobutylicum was not able to utilize the liquefaction products coming from the raw
beech, the fractionation processes presented a crucial stage to achieve a successful fermentation.
The cultures growth on sugars from both pulps showed the normal distribution of products of C.
acetobutylicum. The yields were comparable to others found in the literature. The effect of the
inhibitory compounds was not studied in this work, but its comprehension is a critical point for
the development and scaling-up of this process. Moreover, the implementation of other
fermentation technologies presents interesting features to improve their efficiency. Indeed,
216
fermentation seems to be interesting only if the targeted products cannot be produced by
conventional chemical catalysis and if their added-value is very high.
In my opinion, the production of the world’s top building blocks according to the chemical
industry market is a good target. Here we give some interest exemples of the top biobased
molecules that include a biological conversion in their production and most representative
companies that produce them (in the brackets): glutamic acid, succinic acid (Myriant, BASF,
Bioamber and Reverdia), 3-hydroxypropionic acid (Perstorp), isoprene (Amyris), farnesene
(DuPont and Goodyear), lactic acid (many companies), itaconic acid (Lucite and Mitsubishi). 1
These are important building blocks for the current industry that include fermentation processes
and can integrate analogous approches to the one proposed in this work.
A simple model of the global process integration has been developed using Aspen Plus®. A brief
energy analysis of each operation units of the process was assessed. These results have pointed
out that the most important energy carrier component of the whole process is water, mostly used
during the hydrothermal liquefaction process.
This model allowed a better understanding of the impact of the operating mode (i.e. isothermal,
adiabatic, isenthalpic) of the different operation units on the product yields and energetic
efficiency. The most representatives are: 1) operating the fractionation reactor in adiabatic mode,
instead of isothermal mode that will require an extra heat exchanger and 2) keeping the flash after
liquefaction in isothermal mode, to remove high quantities of water without losing significant
quantities of sugars.
1 Choi, Sol, Chan Woo Song, Jae Ho Shin, and Sang Yup Lee. 2015. “Biorefineries for the Production of Top Building Block Chemicals and Their Derivatives.” Metabolic Engineering 28 (Supplement C): 223–39. https://doi.org/10.1016/j.ymben.2014.12.007.
H. Isikgor, Furkan, and C. Remzi Becer. 2015. “Lignocellulosic Biomass: A Sustainable Platform for the Production of Bio-Based Chemicals and Polymers.” Polymer Chemistry 6 (25): 4497–4559. https://doi.org/10.1039/C5PY00263J.
217
Pursuing a complete energetic analysis with a heat exchanger network optimization will be the
most useful evolution for this study. In order to compare these results with enzymatic hydrolysis
and with pyrolysis, a proper techno-economic analysis is needed.
In general, this work provides a new methodology for the valorization of cellulosic materials in
a biorefinery by combining a thermochemical and biochemical treatments. The yields obtained
so far do not seem competitive enough for the current industrial market.
In the biorefinery strategy proposed in this work, it has been shown that it is possible to produce
fermentable substrates from lignocellulosic biomass using thermochemical processes, since the
resulting substrates can be metabolize by C. acetobutylicum. Producing chemicals such as butanol,
acetone, acetic acid, butyric acid have not a price high enough to make this process cost-effective
and competitive in the market. However, an analogous method can be used with other biomass
and microorganism to produce other chemical molecules with higher added-value.
One of the best scenarios will be for the molecules that cannot be produced by a chemical route
and need a biological catalyst in order to be synthetized.
Since lignocellulosic biomass has different components with different chemistry, its potential
valorization cannot be evaluated for one process with only one final product. The viability of an
integrated biorefinery needs the study of the valorization of all the components of this material:
cellulose, lignin, extractives, hemicelluloses and even minerals. The development of biorefineries
will be analogous the crude-oil refineries which are very well integrated with an extensive
valorization of all the streams. This development could start with the diversification of pulp and
paper mills, by producing high added-value chemicals from cellulose, aromatics or carbons from
lignin, furans from hemicelluloses.
The development of an efficient biorefinery needs much more work in all the fields, but more
than anything, an open mind to create new strategies combining elements that maybe did not
seem to go well, but that in the end, can bring something positive.

218

219
D. APPENDICES

220
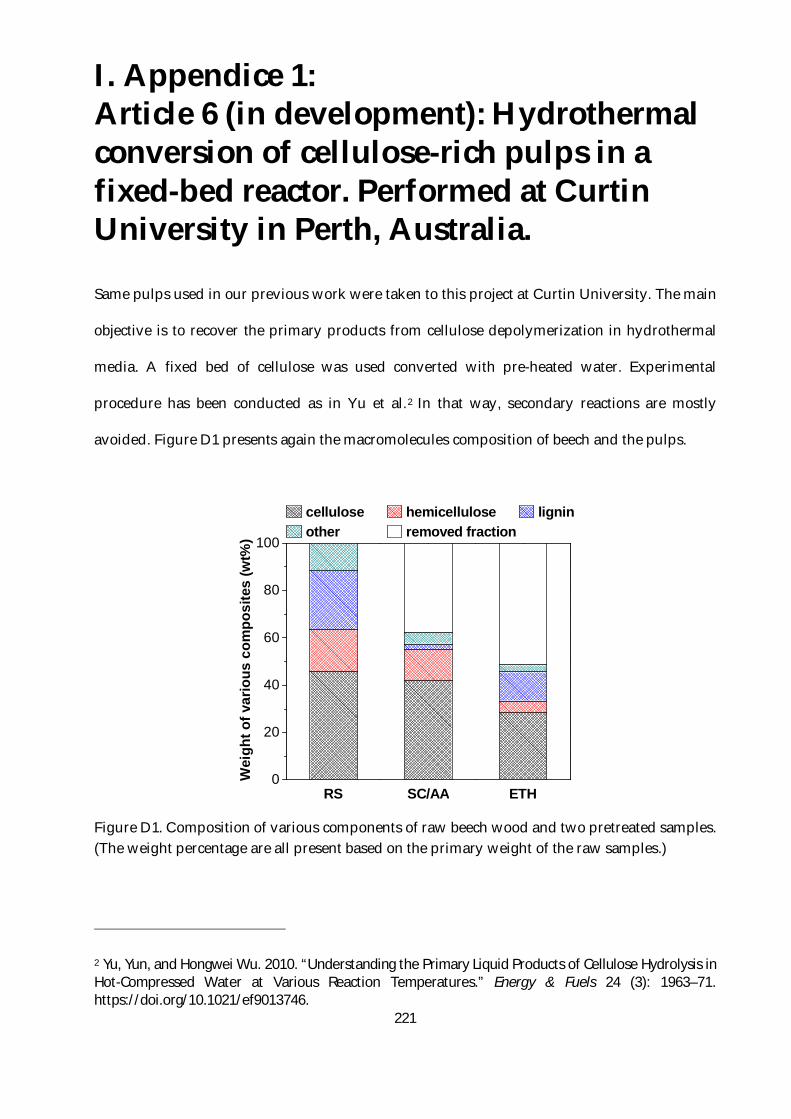
221
I. Appendice 1: Article 6 (in development): Hydrothermal conversion of cellulose-rich pulps in a fixed-bed reactor. Performed at Curtin University in Perth, Australia.
Same pulps used in our previous work were taken to this project at Curtin University. The main
objective is to recover the primary products from cellulose depolymerization in hydrothermal
media. A fixed bed of cellulose was used converted with pre-heated water. Experimental
procedure has been conducted as in Yu et al.2 In that way, secondary reactions are mostly
avoided. Figure D1 presents again the macromolecules composition of beech and the pulps.
Figure D1. Composition of various components of raw beech wood and two pretreated samples. (The weight percentage are all present based on the primary weight of the raw samples.)
2 Yu, Yun, and Hongwei Wu. 2010. “Understanding the Primary Liquid Products of Cellulose Hydrolysis in Hot-Compressed Water at Various Reaction Temperatures.” Energy & Fuels 24 (3): 1963–71. https://doi.org/10.1021/ef9013746.
0
20
40
60
80
100
ETHSC/AA
Wei
ght o
f var
ious
com
posi
tes
(wt%
)
RS
cellulose hemicellulose lignin other removed fraction
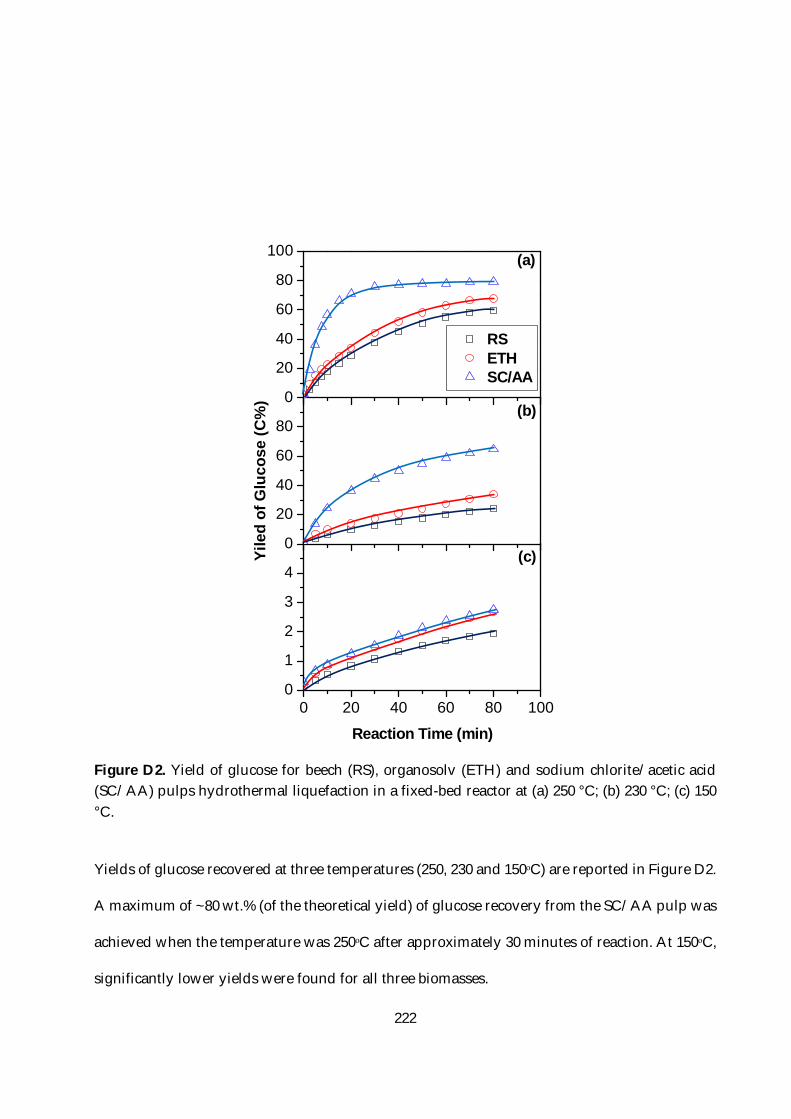
222
Figure D2. Yield of glucose for beech (RS), organosolv (ETH) and sodium chlorite/acetic acid (SC/AA) pulps hydrothermal liquefaction in a fixed-bed reactor at (a) 250 °C; (b) 230 °C; (c) 150 °C.
Yields of glucose recovered at three temperatures (250, 230 and 150ᵒC) are reported in Figure D2.
A maximum of ~80 wt.% (of the theoretical yield) of glucose recovery from the SC/AA pulp was
achieved when the temperature was 250ᵒC after approximately 30 minutes of reaction. At 150ᵒC,
significantly lower yields were found for all three biomasses.
0
20
40
60
80
100
0
20
40
60
80
0 20 40 60 80 1000
1
2
3
4
RSETHSC/AA
(a)
Yile
d of
Glu
cose
(C%
) (b)
Reaction Time (min)
(c)
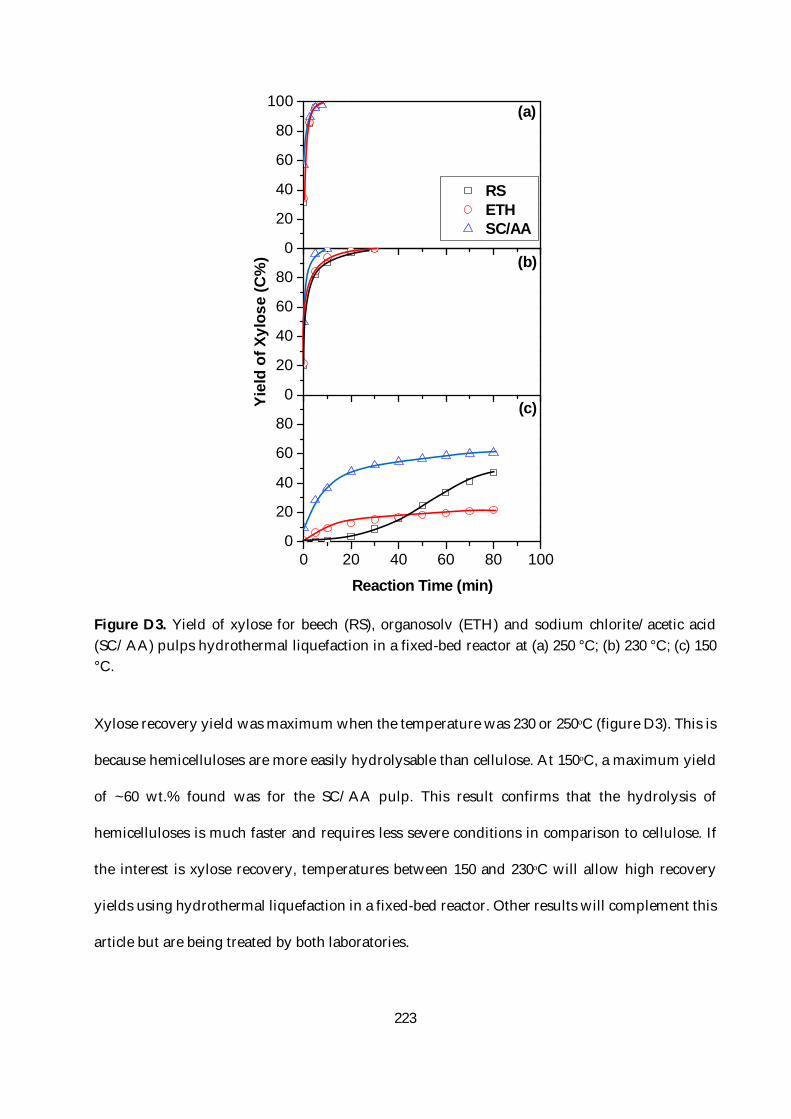
223
Figure D3. Yield of xylose for beech (RS), organosolv (ETH) and sodium chlorite/acetic acid (SC/AA) pulps hydrothermal liquefaction in a fixed-bed reactor at (a) 250 °C; (b) 230 °C; (c) 150 °C.
Xylose recovery yield was maximum when the temperature was 230 or 250ᵒC (figure D3). This is
because hemicelluloses are more easily hydrolysable than cellulose. At 150ᵒC, a maximum yield
of ~60 wt.% found was for the SC/AA pulp. This result confirms that the hydrolysis of
hemicelluloses is much faster and requires less severe conditions in comparison to cellulose. If
the interest is xylose recovery, temperatures between 150 and 230ᵒC will allow high recovery
yields using hydrothermal liquefaction in a fixed-bed reactor. Other results will complement this
article but are being treated by both laboratories.
0
20
40
60
80
100
0
20
40
60
80
0 20 40 60 80 1000
20
40
60
80
RSETHSC/AA
(a)
Yiel
d of
Xyl
ose
(C%
) (b)
Reaction Time (min)
(c)

224
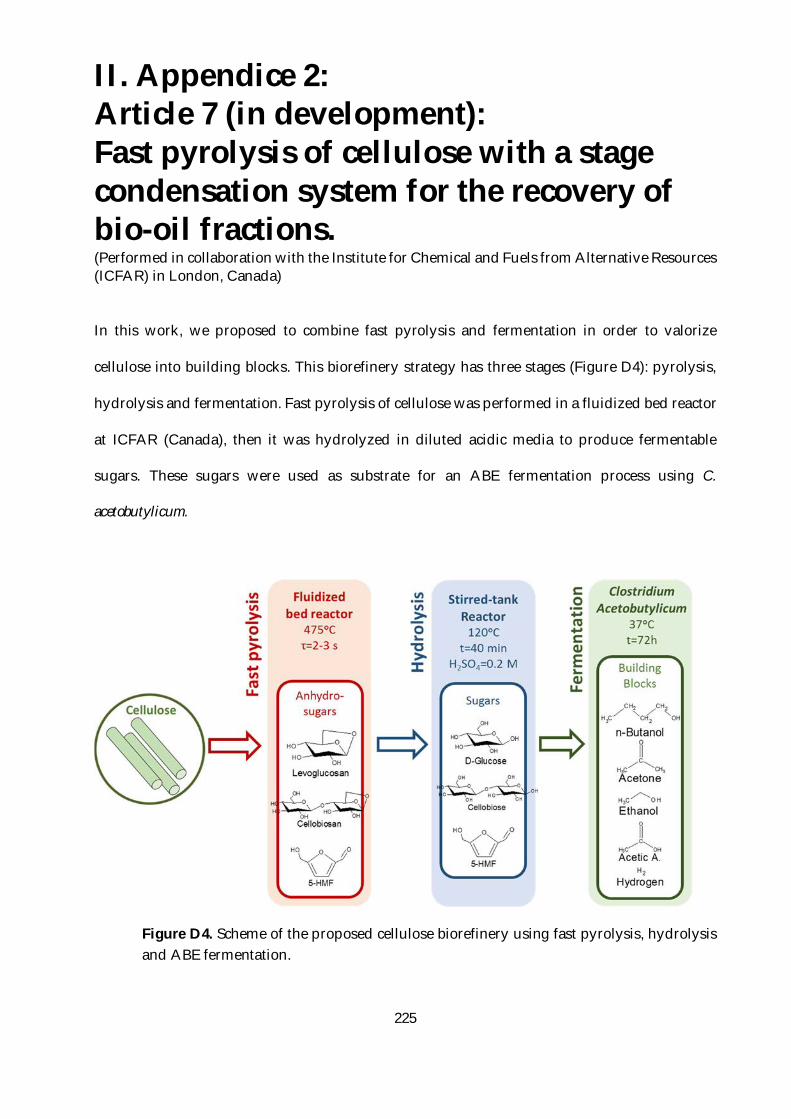
225
II. Appendice 2: Article 7 (in development): Fast pyrolysis of cellulose with a stage condensation system for the recovery of bio-oil fractions. (Performed in collaboration with the Institute for Chemical and Fuels from Alternative Resources (ICFAR) in London, Canada)
In this work, we proposed to combine fast pyrolysis and fermentation in order to valorize
cellulose into building blocks. This biorefinery strategy has three stages (Figure D4): pyrolysis,
hydrolysis and fermentation. Fast pyrolysis of cellulose was performed in a fluidized bed reactor
at ICFAR (Canada), then it was hydrolyzed in diluted acidic media to produce fermentable
sugars. These sugars were used as substrate for an ABE fermentation process using C.
acetobutylicum.
Figure D4. Scheme of the proposed cellulose biorefinery using fast pyrolysis, hydrolysis and ABE fermentation.
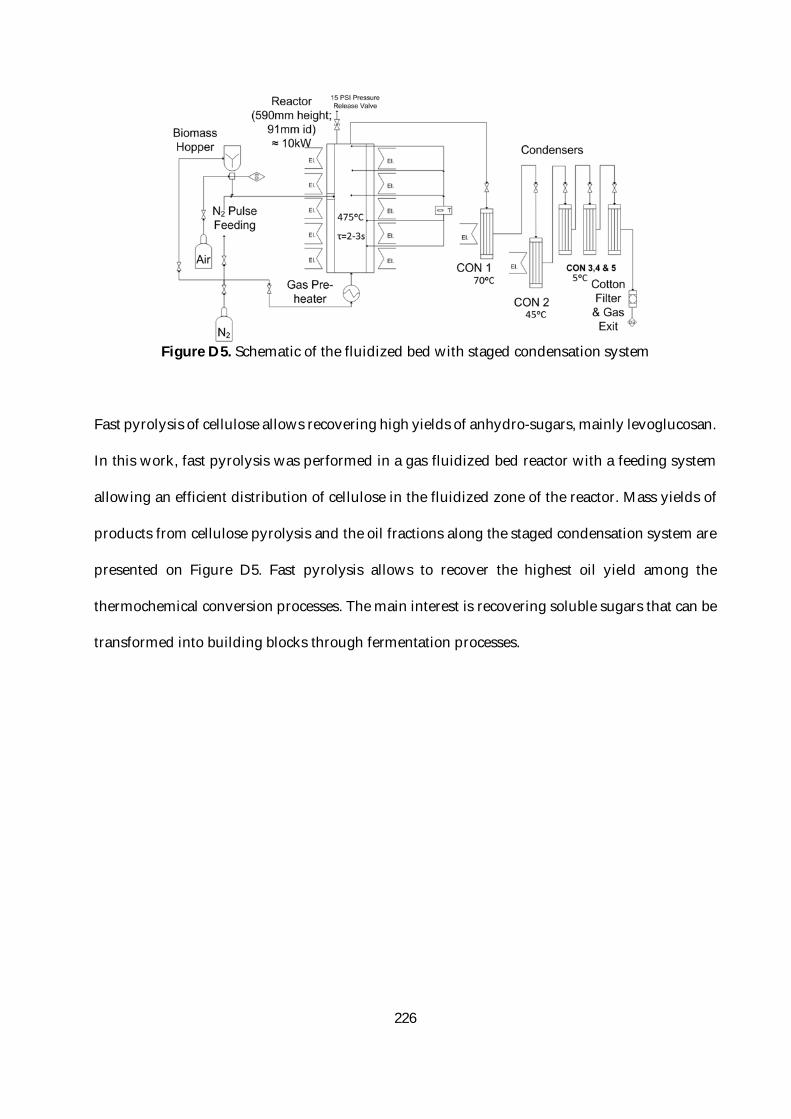
226
Figure D5. Schematic of the fluidized bed with staged condensation system
Fast pyrolysis of cellulose allows recovering high yields of anhydro-sugars, mainly levoglucosan.
In this work, fast pyrolysis was performed in a gas fluidized bed reactor with a feeding system
allowing an efficient distribution of cellulose in the fluidized zone of the reactor. Mass yields of
products from cellulose pyrolysis and the oil fractions along the staged condensation system are
presented on Figure D5. Fast pyrolysis allows to recover the highest oil yield among the
thermochemical conversion processes. The main interest is recovering soluble sugars that can be
transformed into building blocks through fermentation processes.
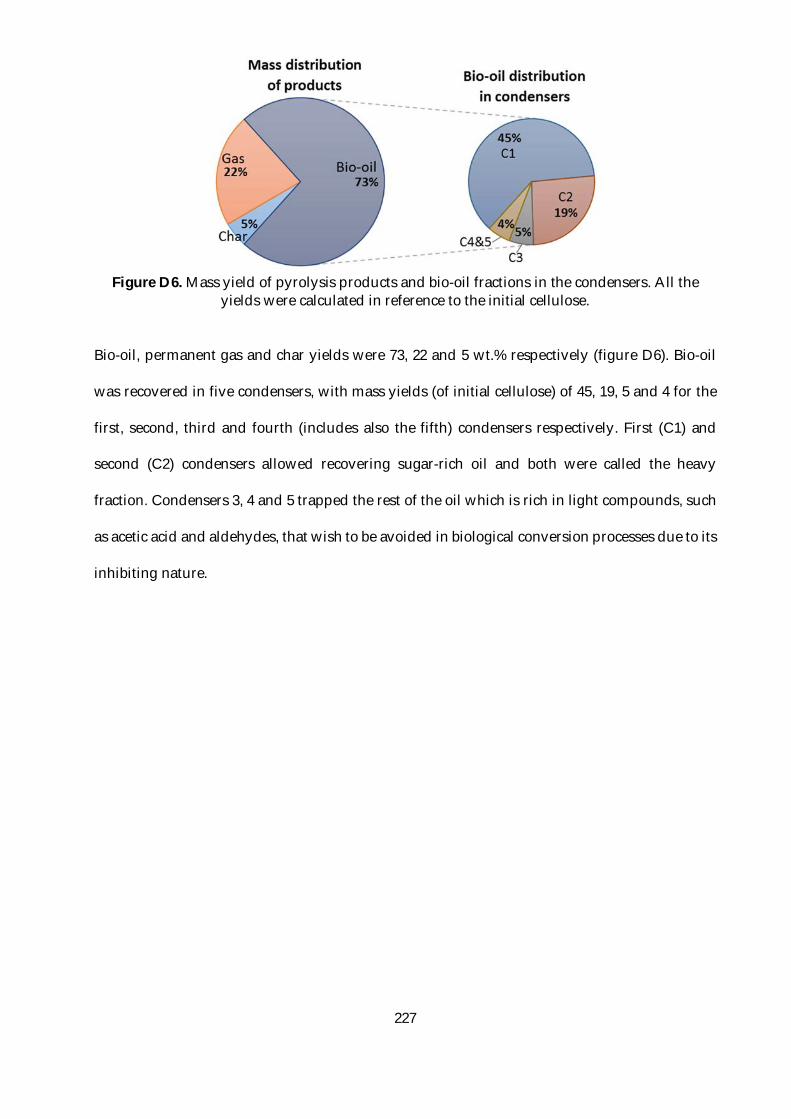
227
Figure D6. Mass yield of pyrolysis products and bio-oil fractions in the condensers. All the
yields were calculated in reference to the initial cellulose.
Bio-oil, permanent gas and char yields were 73, 22 and 5 wt.% respectively (figure D6). Bio-oil
was recovered in five condensers, with mass yields (of initial cellulose) of 45, 19, 5 and 4 for the
first, second, third and fourth (includes also the fifth) condensers respectively. First (C1) and
second (C2) condensers allowed recovering sugar-rich oil and both were called the heavy
fraction. Condensers 3, 4 and 5 trapped the rest of the oil which is rich in light compounds, such
as acetic acid and aldehydes, that wish to be avoided in biological conversion processes due to its
inhibiting nature.
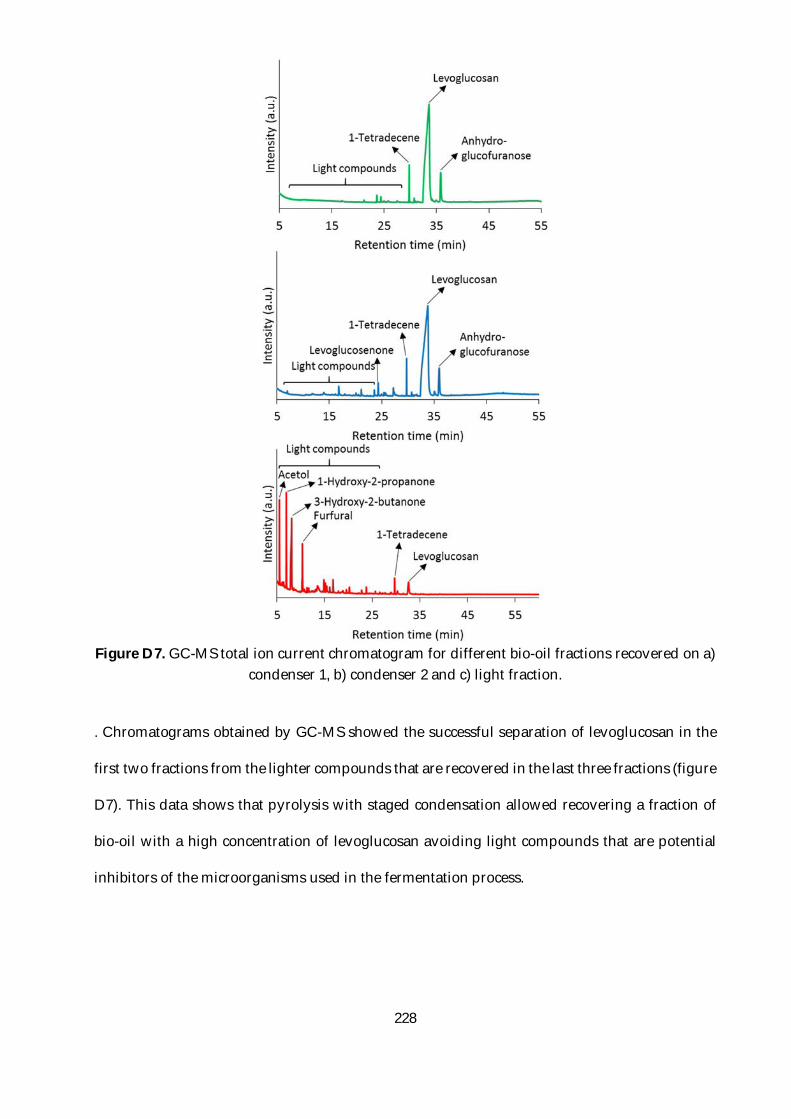
228
Figure D7. GC-MS total ion current chromatogram for different bio-oil fractions recovered on a)
condenser 1, b) condenser 2 and c) light fraction.
. Chromatograms obtained by GC-MS showed the successful separation of levoglucosan in the
first two fractions from the lighter compounds that are recovered in the last three fractions (figure
D7). This data shows that pyrolysis with staged condensation allowed recovering a fraction of
bio-oil with a high concentration of levoglucosan avoiding light compounds that are potential
inhibitors of the microorganisms used in the fermentation process.
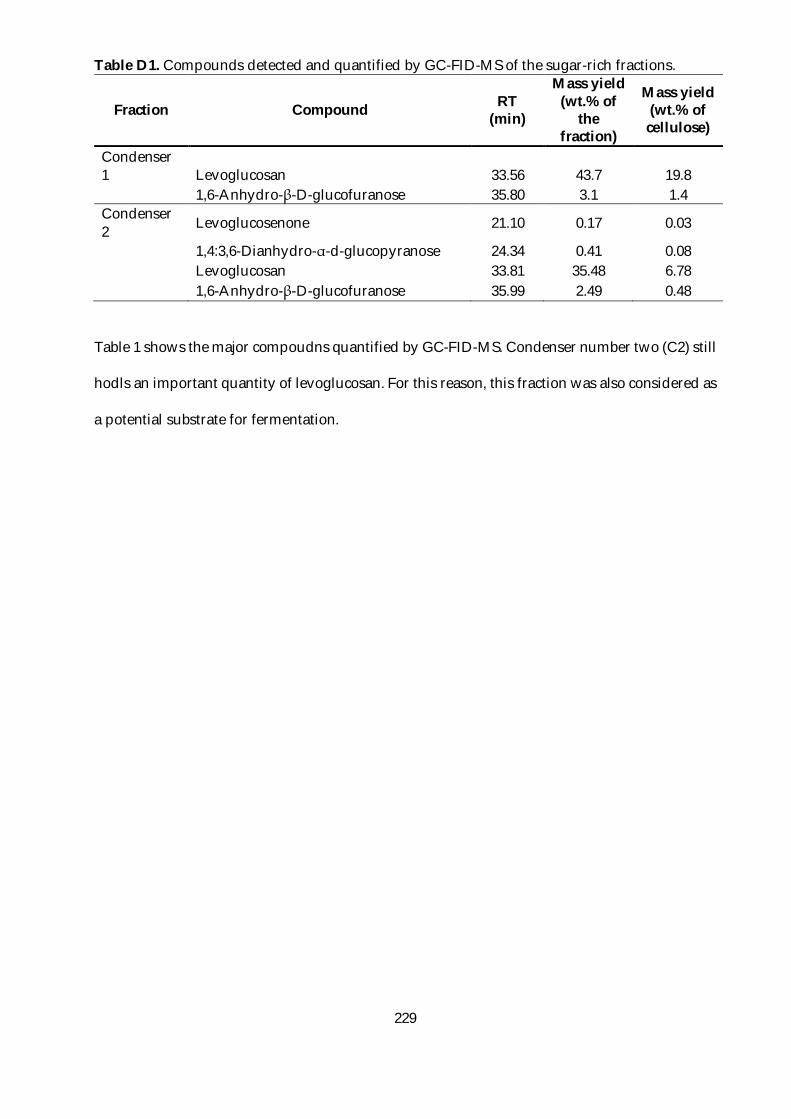
229
Table D1. Compounds detected and quantified by GC-FID-MS of the sugar-rich fractions.
Fraction Compound RT (min)
Mass yield (wt.% of
the fraction)
Mass yield (wt.% of
cellulose)
Condenser 1 Levoglucosan 33.56 43.7 19.8 1,6-Anhydro-β-D-glucofuranose 35.80 3.1 1.4 Condenser 2 Levoglucosenone 21.10 0.17 0.03
1,4:3,6-Dianhydro-α-d-glucopyranose 24.34 0.41 0.08 Levoglucosan 33.81 35.48 6.78 1,6-Anhydro-β-D-glucofuranose 35.99 2.49 0.48
Table 1 shows the major compoudns quantified by GC-FID-MS. Condenser number two (C2) still
hodls an important quantity of levoglucosan. For this reason, this fraction was also considered as
a potential substrate for fermentation.
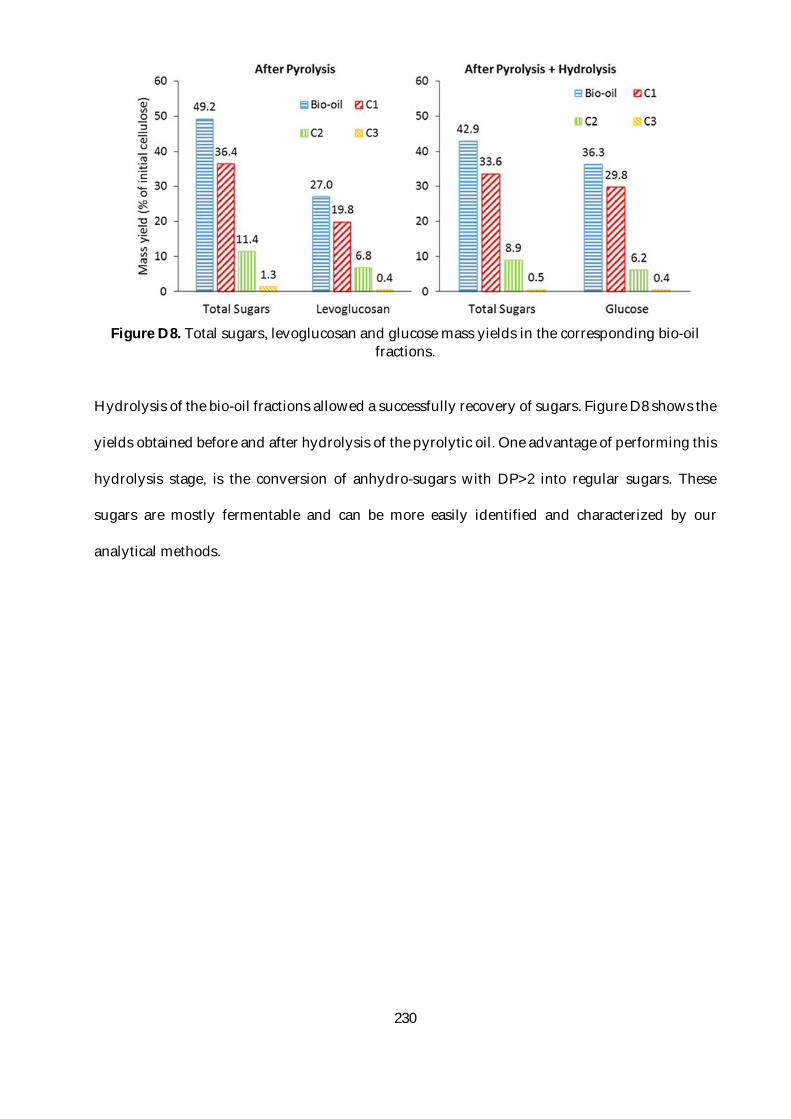
230
Figure D8. Total sugars, levoglucosan and glucose mass yields in the corresponding bio-oil
fractions.
Hydrolysis of the bio-oil fractions allowed a successfully recovery of sugars. Figure D8 shows the
yields obtained before and after hydrolysis of the pyrolytic oil. One advantage of performing this
hydrolysis stage, is the conversion of anhydro-sugars with DP>2 into regular sugars. These
sugars are mostly fermentable and can be more easily identified and characterized by our
analytical methods.
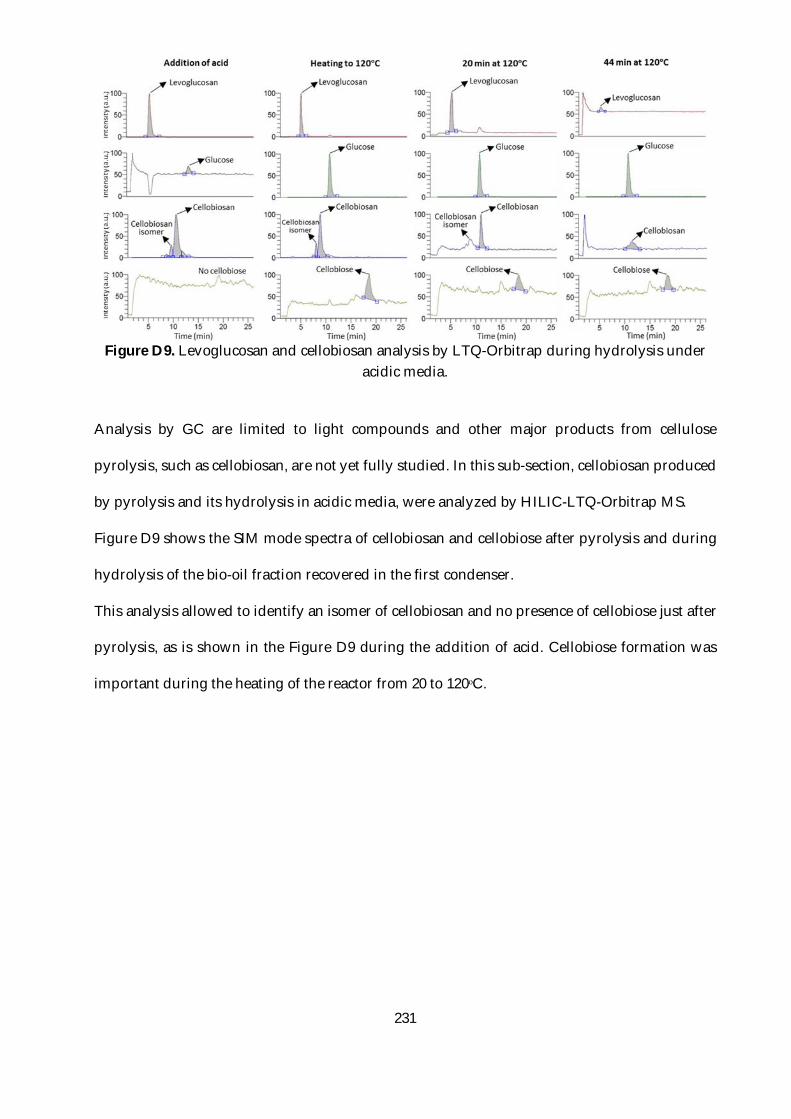
231
Figure D9. Levoglucosan and cellobiosan analysis by LTQ-Orbitrap during hydrolysis under
acidic media.
Analysis by GC are limited to light compounds and other major products from cellulose
pyrolysis, such as cellobiosan, are not yet fully studied. In this sub-section, cellobiosan produced
by pyrolysis and its hydrolysis in acidic media, were analyzed by HILIC-LTQ-Orbitrap MS.
Figure D9 shows the SIM mode spectra of cellobiosan and cellobiose after pyrolysis and during
hydrolysis of the bio-oil fraction recovered in the first condenser.
This analysis allowed to identify an isomer of cellobiosan and no presence of cellobiose just after
pyrolysis, as is shown in the Figure D9 during the addition of acid. Cellobiose formation was
important during the heating of the reactor from 20 to 120ᵒC.
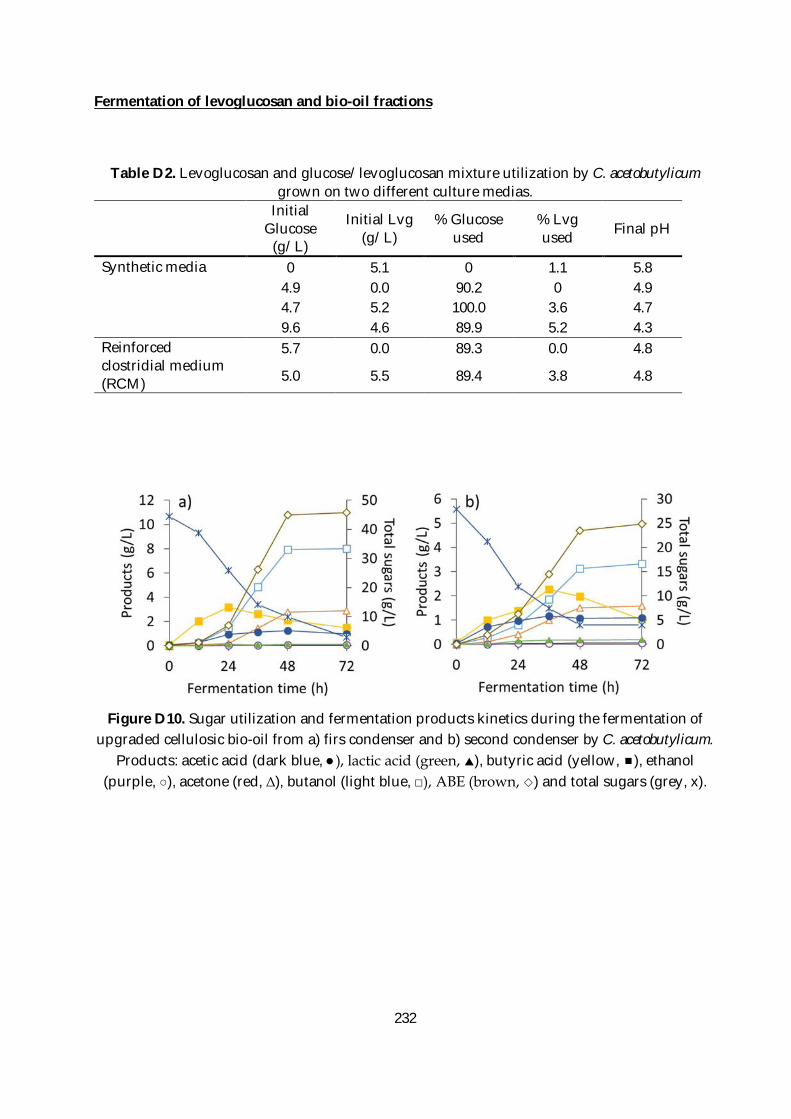
232
Fermentation of levoglucosan and bio-oil fractions
Table D2. Levoglucosan and glucose/levoglucosan mixture utilization by C. acetobutylicum grown on two different culture medias.
Initial Glucose
(g/L)
Initial Lvg (g/L)
% Glucose used
% Lvg used Final pH
Synthetic media 0 5.1 0 1.1 5.8 4.9 0.0 90.2 0 4.9 4.7 5.2 100.0 3.6 4.7 9.6 4.6 89.9 5.2 4.3 Reinforced clostridial medium (RCM)
5.7 0.0 89.3 0.0 4.8
5.0 5.5 89.4 3.8 4.8
Figure D10. Sugar utilization and fermentation products kinetics during the fermentation of
upgraded cellulosic bio-oil from a) firs condenser and b) second condenser by C. acetobutylicum. Products: acetic acid (dark blue, ●), lactic acid (green, ), butyric acid (yellow, ), ethanol
(purple, ○), acetone (red, Δ), butanol (light blue, □), ABE (brown, ) and total sugars (grey, x).
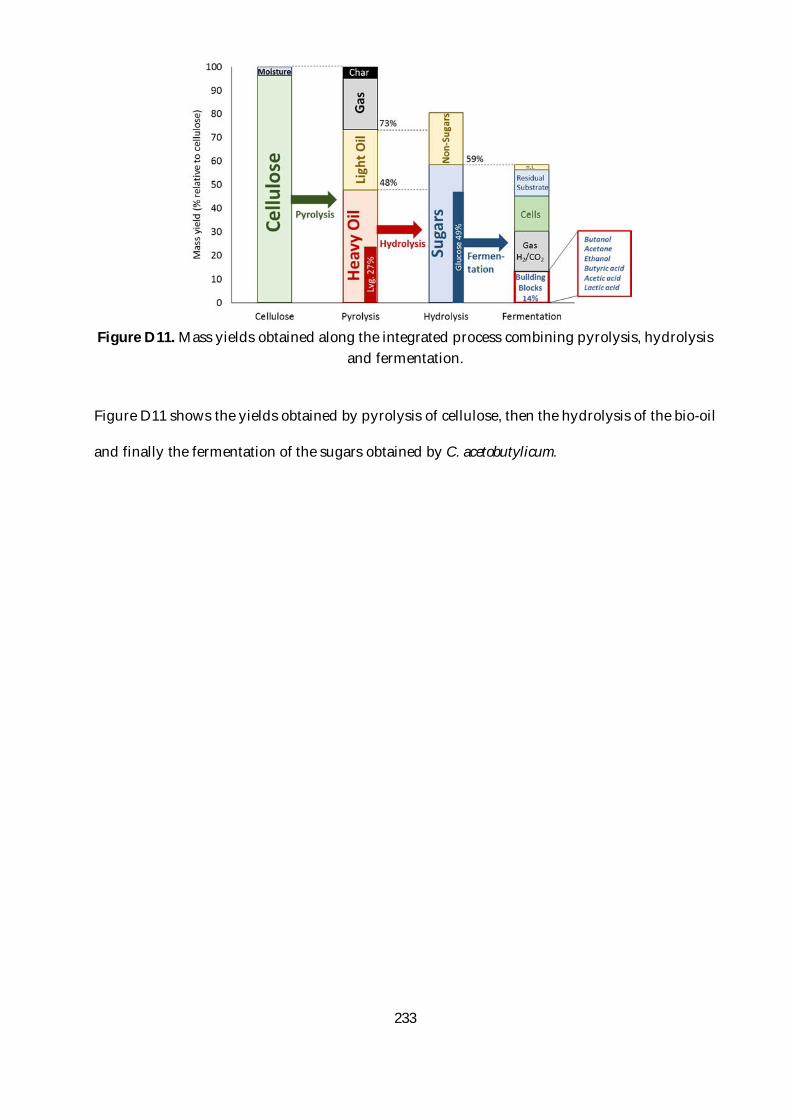
233
Figure D11. Mass yields obtained along the integrated process combining pyrolysis, hydrolysis
and fermentation.
Figure D11 shows the yields obtained by pyrolysis of cellulose, then the hydrolysis of the bio-oil
and finally the fermentation of the sugars obtained by C. acetobutylicum.
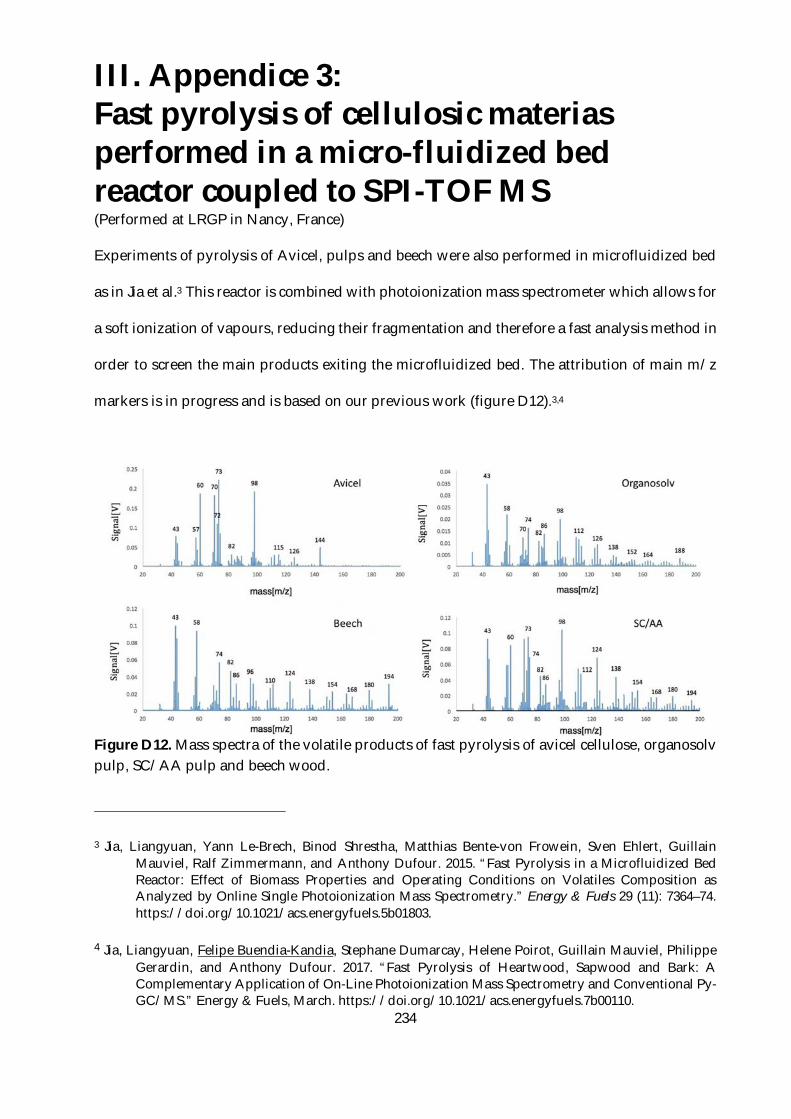
234
III. Appendice 3: Fast pyrolysis of cellulosic materias performed in a micro-fluidized bed reactor coupled to SPI-TOF MS (Performed at LRGP in Nancy, France)
Experiments of pyrolysis of Avicel, pulps and beech were also performed in microfluidized bed
as in Jia et al.3 This reactor is combined with photoionization mass spectrometer which allows for
a soft ionization of vapours, reducing their fragmentation and therefore a fast analysis method in
order to screen the main products exiting the microfluidized bed. The attribution of main m/z
markers is in progress and is based on our previous work (figure D12).3,4
Figure D12. Mass spectra of the volatile products of fast pyrolysis of avicel cellulose, organosolv pulp, SC/AA pulp and beech wood.
3 Jia, Liangyuan, Yann Le-Brech, Binod Shrestha, Matthias Bente-von Frowein, Sven Ehlert, Guillain Mauviel, Ralf Zimmermann, and Anthony Dufour. 2015. “Fast Pyrolysis in a Microfluidized Bed Reactor: Effect of Biomass Properties and Operating Conditions on Volatiles Composition as Analyzed by Online Single Photoionization Mass Spectrometry.” Energy & Fuels 29 (11): 7364–74. https://doi.org/10.1021/acs.energyfuels.5b01803.
4 Jia, Liangyuan, Felipe Buendia-Kandia, Stephane Dumarcay, Helene Poirot, Guillain Mauviel, Philippe
Gerardin, and Anthony Dufour. 2017. “Fast Pyrolysis of Heartwood, Sapwood and Bark: A Complementary Application of On-Line Photoionization Mass Spectrometry and Conventional Py-GC/MS.” Energy & Fuels, March. https://doi.org/10.1021/acs.energyfuels.7b00110.
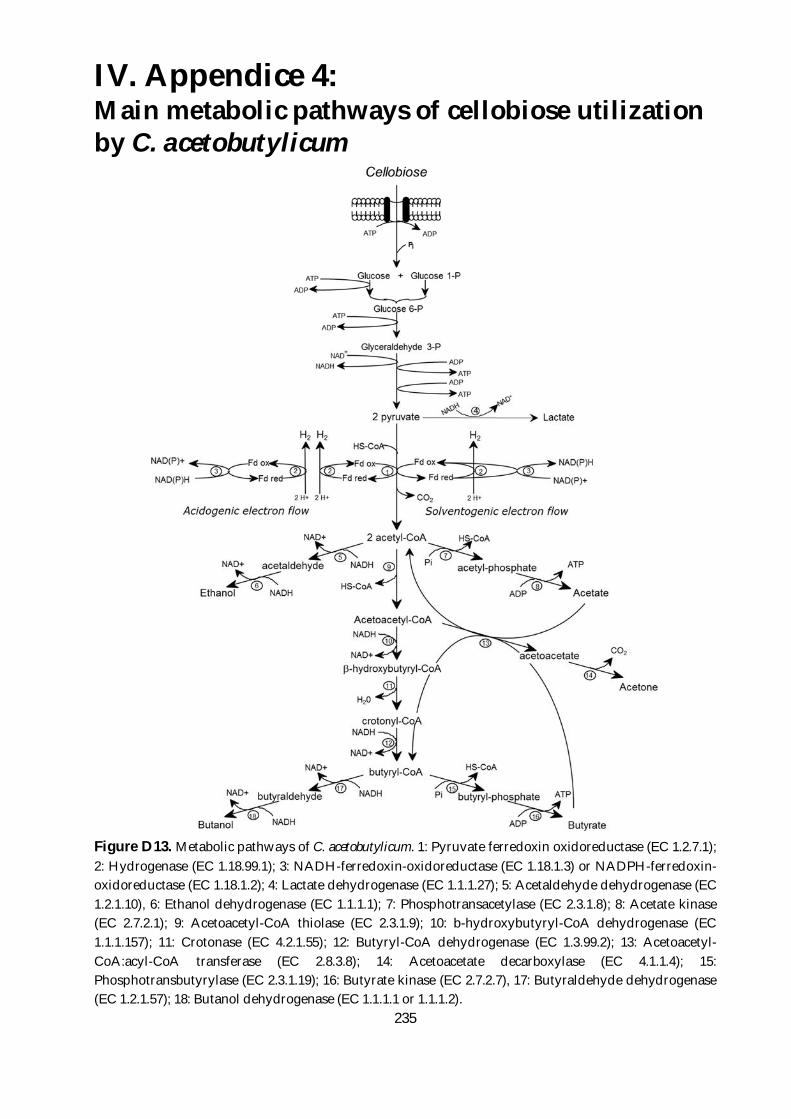
235
IV. Appendice 4: Main metabolic pathways of cellobiose utilization by C. acetobutylicum
Figure D13. Metabolic pathways of C. acetobutylicum. 1: Pyruvate ferredoxin oxidoreductase (EC 1.2.7.1); 2: Hydrogenase (EC 1.18.99.1); 3: NADH-ferredoxin-oxidoreductase (EC 1.18.1.3) or NADPH-ferredoxin-oxidoreductase (EC 1.18.1.2); 4: Lactate dehydrogenase (EC 1.1.1.27); 5: Acetaldehyde dehydrogenase (EC 1.2.1.10), 6: Ethanol dehydrogenase (EC 1.1.1.1); 7: Phosphotransacetylase (EC 2.3.1.8); 8: Acetate kinase (EC 2.7.2.1); 9: Acetoacetyl-CoA thiolase (EC 2.3.1.9); 10: b-hydroxybutyryl-CoA dehydrogenase (EC 1.1.1.157); 11: Crotonase (EC 4.2.1.55); 12: Butyryl-CoA dehydrogenase (EC 1.3.99.2); 13: Acetoacetyl-CoA:acyl-CoA transferase (EC 2.8.3.8); 14: Acetoacetate decarboxylase (EC 4.1.1.4); 15: Phosphotransbutyrylase (EC 2.3.1.19); 16: Butyrate kinase (EC 2.7.2.7), 17: Butyraldehyde dehydrogenase (EC 1.2.1.57); 18: Butanol dehydrogenase (EC 1.1.1.1 or 1.1.1.2).
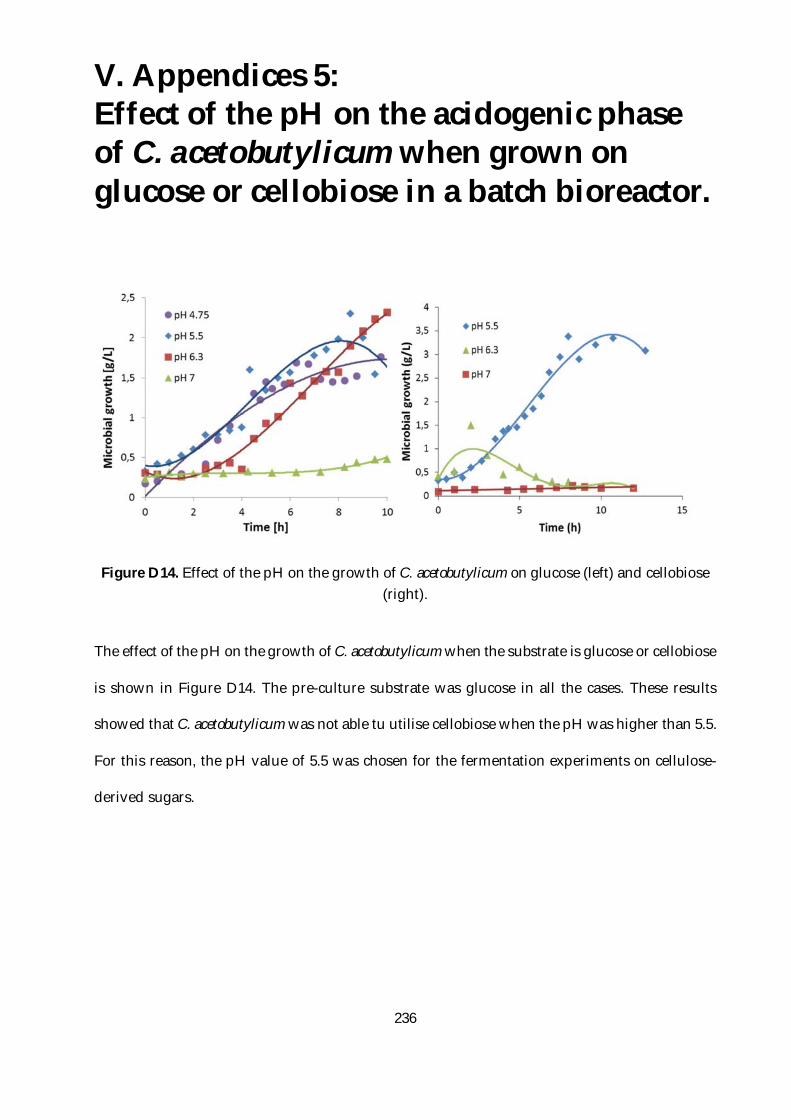
236
V. Appendices 5: Effect of the pH on the acidogenic phase of C. acetobutylicum when grown on glucose or cellobiose in a batch bioreactor.
Figure D14. Effect of the pH on the growth of C. acetobutylicum on glucose (left) and cellobiose (right).
The effect of the pH on the growth of C. acetobutylicum when the substrate is glucose or cellobiose
is shown in Figure D14. The pre-culture substrate was glucose in all the cases. These results
showed that C. acetobutylicum was not able tu utilise cellobiose when the pH was higher than 5.5.
For this reason, the pH value of 5.5 was chosen for the fermentation experiments on cellulose-
derived sugars.

237

238
239
E. RESUME DE LA THESE EN FRANÇAIS
I. Objectif
La demande mondiale de pétrole n'a cessé d'augmenter ces dernières années (OPEC 2016). Cette
ressource fossile est devenue indispensable pour la société. Pour cette raison, trouver un
remplacement durable est un défi important. La biomasse lignocellulosique représente une
alternative intéressante en tant que source de carbone renouvelable respectueuse de
l'environnement. Les principaux composants de la biomasse sont la cellulose (40-45%),
l'hémicellulose (20-25%) et la lignine (25-30%). La cellulose et l'hémicellulose sont des polymères
à base des sucres qui peuvent être dépolymérisés pour être ensuite transformés à travers des
procédés fermentaires pour produire des biocarburants et des synthons qui peuvent remplacer
ceux provenant de l'industrie pétrochimique. Il est nécessaire de réaliser une étape de
fractionnement de la biomasse lignocellulosique afin de séparer ses trois principaux constituants,
la cellulose, les hémicelluloses et la lignine. De cette façon, chaque fraction peut être valorisée
dans les différents procédés d’une bioraffinerie intégrée. La cellulose séparée de la matrice
fibreuse de la biomasse est très récalcitrante pour être valorisée par fermentation directe ; en
raison de son insolubilité, de sa cristallinité et des liaisons d’hydrogène entre les fibres qui
diminuent fortement sa réactivité. Il est donc important de trouver une technique de
dépolymérisation de la cellulose permettant d'améliorer le rendement ultérieur de la
fermentation.
L’objectif de cette thèse est de coupler un procédé de traitement thermique de la cellulose, pour
la dépolymériser, à un procédé de transformation microbienne pour produire des solvants, des
240
acides et des gaz (butanol, éthanol, acétone, acide acétique, acide butyrique, hydrogène) qui
suscitent un fort intérêt dans l’industrie des carburants ou de la chimie verte.
II. Bibliographie
1. De la biomasse aux sucres
La figure R1 montre les principales filières de production de biocarburants en France.
Actuellement, la production de biocarburants (éthanol) à partir de la biomasse lignocellulosique
a besoin d’une ou deux étapes de prétraitement pour déconstruire le réseaux de la matrice
lignocellulosique (Yoo et al. 2011; Bensah and Mensah 2013; C. Liu et al. 2013). Ensuite, la lignine
est séparée par un traitement chimique, normalement à l’aide de l’hydroxyde de sodium et du
sulfure de sodium (procédé Kraft) (Chakar and Ragauskas 2004). Ensuite une étape de
dépolymérisation de la cellulose est nécessaire pour obtenir la plus grande quantité de sucres
fermentescibles possibles en évitant certains coproduits qui peuvent empêcher le développement
des bactéries/levures fermentaires.
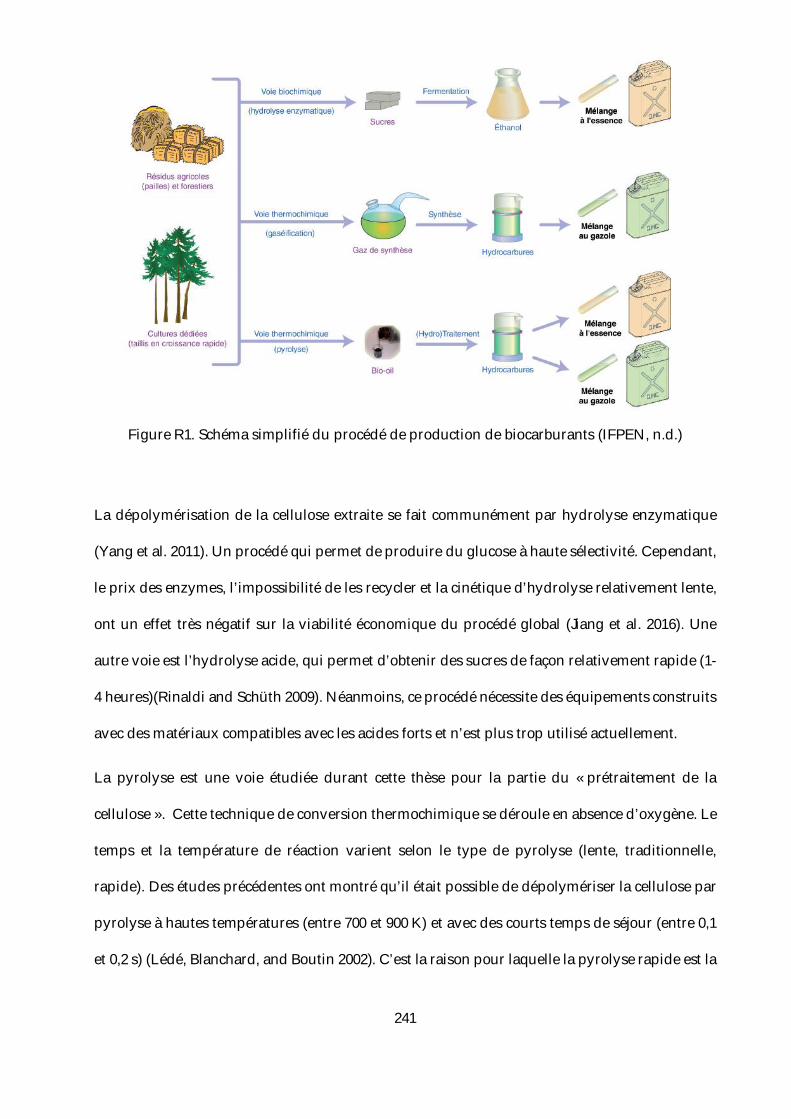
241
Figure R1. Schéma simplifié du procédé de production de biocarburants (IFPEN, n.d.)
La dépolymérisation de la cellulose extraite se fait communément par hydrolyse enzymatique
(Yang et al. 2011). Un procédé qui permet de produire du glucose à haute sélectivité. Cependant,
le prix des enzymes, l’impossibilité de les recycler et la cinétique d’hydrolyse relativement lente,
ont un effet très négatif sur la viabilité économique du procédé global (Jiang et al. 2016). Une
autre voie est l’hydrolyse acide, qui permet d’obtenir des sucres de façon relativement rapide (1-
4 heures)(Rinaldi and Schüth 2009). Néanmoins, ce procédé nécessite des équipements construits
avec des matériaux compatibles avec les acides forts et n’est plus trop utilisé actuellement.
La pyrolyse est une voie étudiée durant cette thèse pour la partie du « prétraitement de la
cellulose ». Cette technique de conversion thermochimique se déroule en absence d’oxygène. Le
temps et la température de réaction varient selon le type de pyrolyse (lente, traditionnelle,
rapide). Des études précédentes ont montré qu’il était possible de dépolymériser la cellulose par
pyrolyse à hautes températures (entre 700 et 900 K) et avec des courts temps de séjour (entre 0,1
et 0,2 s) (Lédé, Blanchard, and Boutin 2002). C’est la raison pour laquelle la pyrolyse rapide est la
242
technique la plus appropriée pour ce travail. Par ailleurs, cette méthode permet d’obtenir des
cello-oligosaccharides solubles (45%) (Piskorz et al. 2000).
Néanmoins, pendant la pyrolyse de la biomasse/cellulose, certains composés inhibiteurs du
métabolisme des microorganismes sont produits. Ces inhibiteurs peuvent être classés en trois
groupes : les acides faibles, les dérivés du furane et les composés phénoliques (Palmqvist and
Hahn-Hägerdal 2000).
L’utilisation de l’eau sous-critique et supercritique a été également étudiée pour la production
des monomères à partir de la cellulose avec des rendements inférieures aux technologies
précédents mais à faible prix et facilité d’utilisation (Yu, Lou, and Wu 2008; D. Liu, Yu, and Wu
2013; Yu, Long, and Wu 2015). L’optimisation de ce type de procédés de saccharification de la
cellulose et la compréhension des mécanismes réactionnels est actuellement l’objet de plusieurs
études, dont ce travail de thèse.
2. La fermentation de dérivés de la cellulose
Une fois que la biomasse est sous la forme de sucres fermentescibles, l’étape suivante est une
fermentation qui permet de fabriquer une grande variété de produits chimiques d’intérêt. Ce
procédé se fait à l’aide de microorganismes du règne des bactéries et des mycètes unicellulaires
tels que les levures. Le métabolisme de ces microorganismes est très sélectif et peut produire une
vaste gamme de produits chimiques valorisables dans plusieurs secteurs. Dans la nature, un
faible pourcentage de microorganismes peut dégrader la cellulose directement (Guedon,
Desvaux, and Petitdemange 2000; Desvaux, Guedon, and Petitdemange 2001), grâce à des
cellulases, mais la lenteur de ce métabolisme est un facteur critique qui affecte sa rentabilité au
niveau des bioprocédés (Gutiérrez-Rojas, Moreno-Sarmiento, and Montoya 2015). Pour cette
243
raison, le choix du substrat et de sa nature est critique pour la valorisation des produits de
fermentation.
Il existe une grande variété de configurations possibles de procédés de fermentation de la
biomasse prétraitée. La valorisation de cette ressource renouvelable par voie fermentaire suscite
de l’intérêt grâce à la vaste gamme de substrats que ces microorganismes sont capables de
consommer : hexoses, pentoses, glycérol, cellulose, amidon, gaz (Tracy et al. 2012). En outre, ces
microorganismes peuvent fabriquer différents types de produits selon les conditions opératoires
de la fermentation.
L’utilisation de Clostridium spp. pour la production d’acétone -butanol-éthanol (ABE) et
d’hydrogène a été largement étudiée (Ezeji, Qureshi, and Blaschek 2007)(Gupta et al. 2014). Il y
a 30 ans, la production industrielle d’acides, de solvants ou de gaz utilisant Clostridium spp. a
connu une forte croissance(Jones and Woods 1986). Actuellement, la plupart de ces molécules est
produite par voie pétrochimique, ayant un effet néfaste pour l’environnement. C’est pourquoi, il
est essentiel d’éliminer les obstacles de la fermentation afin d’augmenter sa productivité et donc
sa compétitivité.
III. Méthodologie développée durant cette
thèse
Le travail de cette thèse se déroule en deux étapes réalisées dans deux équipes du LRGP. La
première étape concerne la conversion thermochimique de la (ligno)cellulose et est effectuée dans
l’équipe GREENER (site ENSIC). La deuxième étape porte sur la transformation des produits
244
issus de la transformation thermochimique par voie fermentaire ; réalisée dans l’équipe
BioProMo (site ENSAIA).
1. Préparation de la matière première
La biomasse lignocellulosique étudiée dans ce travail est le hêtre. Cette biomasse a été choisie dû
à son abondance et son manque de débouché notamment en Lorraine. La cellulose
microcristalline (Avicel PH-101) a été également étudiée pour des raisons de comparaison entre
une cellulose commerciale pure et les maières plus complexes issus du bois de hêtre. Le hêtre a
été délignifié par deux méthodes : organosolv (Pan et al. 2006; Brosse, Sannigrahi, and Ragauskas
2009) et chlorite/acide acétique (SC/AA) (Ahlgren and Goring 1971; Siqueira et al. 2013). Le hêtre
brut et les deux pâtes récupérées des procédés de fractionnement ainsi que la cellulose
microcristalline ont été utilisés pour l’étude de la conversion thermochimique. Dans ce travail,
l’appellation « (ligno)cellulose » désigne l’ensemble de ces matières.
2. Conversion thermochimique de la
(ligno)cellulose
Dans la partie concernant la conversion thermochimique de la (ligno)cellulose deux approches
ont été étudiées afin de produire des sucres fermentescibles : la liquéfaction (en milieu
hydrothermal) et la pyrolyse rapide.
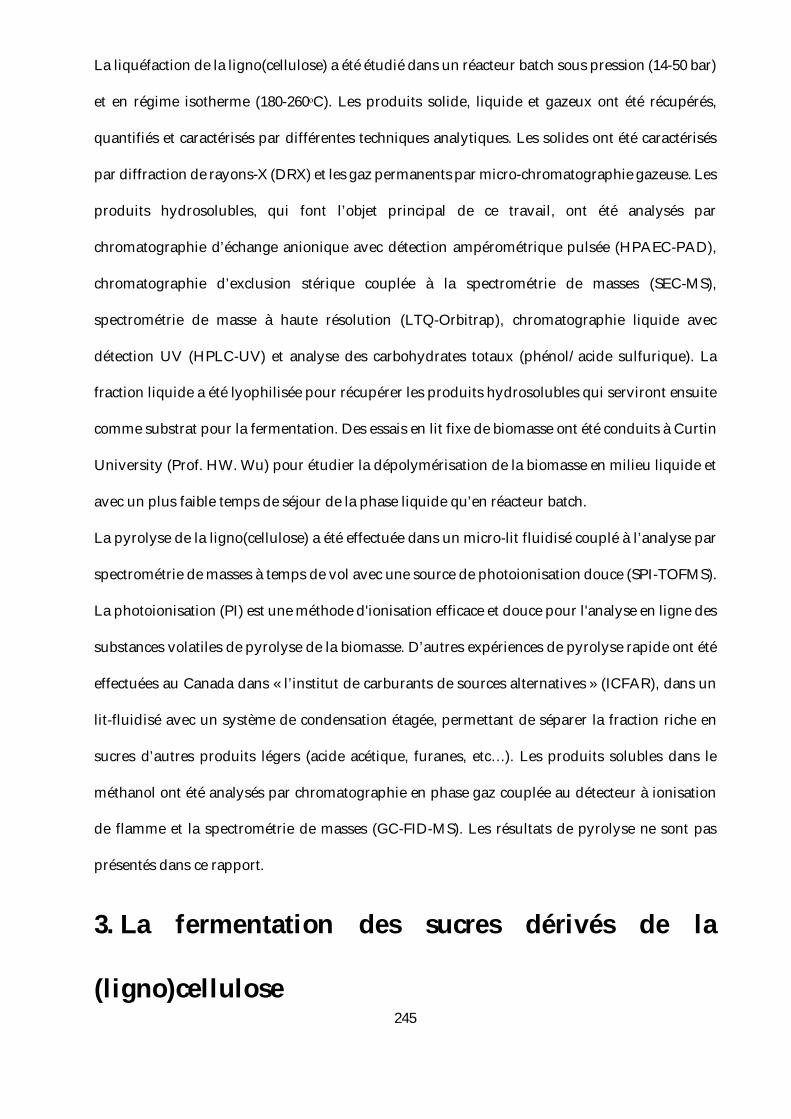
245
La liquéfaction de la ligno(cellulose) a été étudié dans un réacteur batch sous pression (14-50 bar)
et en régime isotherme (180-260ᵒC). Les produits solide, liquide et gazeux ont été récupérés,
quantifiés et caractérisés par différentes techniques analytiques. Les solides ont été caractérisés
par diffraction de rayons-X (DRX) et les gaz permanents par micro-chromatographie gazeuse. Les
produits hydrosolubles, qui font l’objet principal de ce travail, ont été analysés par
chromatographie d’échange anionique avec détection ampérométrique pulsée (HPAEC-PAD),
chromatographie d’exclusion stérique couplée à la spectrométrie de masses (SEC-MS),
spectrométrie de masse à haute résolution (LTQ-Orbitrap), chromatographie liquide avec
détection UV (HPLC-UV) et analyse des carbohydrates totaux (phénol/acide sulfurique). La
fraction liquide a été lyophilisée pour récupérer les produits hydrosolubles qui serviront ensuite
comme substrat pour la fermentation. Des essais en lit fixe de biomasse ont été conduits à Curtin
University (Prof. HW. Wu) pour étudier la dépolymérisation de la biomasse en milieu liquide et
avec un plus faible temps de séjour de la phase liquide qu’en réacteur batch.
La pyrolyse de la ligno(cellulose) a été effectuée dans un micro-lit fluidisé couplé à l’analyse par
spectrométrie de masses à temps de vol avec une source de photoionisation douce (SPI-TOFMS).
La photoionisation (PI) est une méthode d'ionisation efficace et douce pour l'analyse en ligne des
substances volatiles de pyrolyse de la biomasse. D’autres expériences de pyrolyse rapide ont été
effectuées au Canada dans « l’institut de carburants de sources alternatives » (ICFAR), dans un
lit-fluidisé avec un système de condensation étagée, permettant de séparer la fraction riche en
sucres d’autres produits légers (acide acétique, furanes, etc…). Les produits solubles dans le
méthanol ont été analysés par chromatographie en phase gaz couplée au détecteur à ionisation
de flamme et la spectrométrie de masses (GC-FID-MS). Les résultats de pyrolyse ne sont pas
présentés dans ce rapport.
3. La fermentation des sucres dérivés de la
(ligno)cellulose
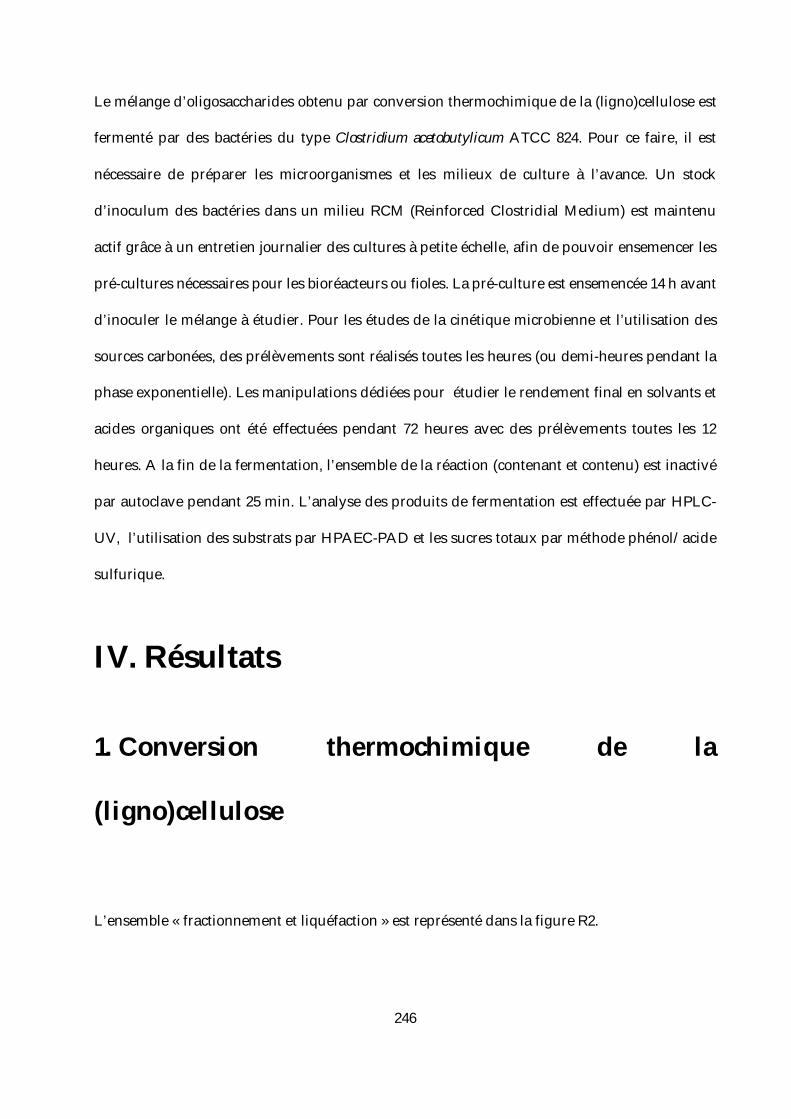
246
Le mélange d’oligosaccharides obtenu par conversion thermochimique de la (ligno)cellulose est
fermenté par des bactéries du type Clostridium acetobutylicum ATCC 824. Pour ce faire, il est
nécessaire de préparer les microorganismes et les milieux de culture à l’avance. Un stock
d’inoculum des bactéries dans un milieu RCM (Reinforced Clostridial Medium) est maintenu
actif grâce à un entretien journalier des cultures à petite échelle, afin de pouvoir ensemencer les
pré-cultures nécessaires pour les bioréacteurs ou fioles. La pré-culture est ensemencée 14 h avant
d’inoculer le mélange à étudier. Pour les études de la cinétique microbienne et l’utilisation des
sources carbonées, des prélèvements sont réalisés toutes les heures (ou demi-heures pendant la
phase exponentielle). Les manipulations dédiées pour étudier le rendement final en solvants et
acides organiques ont été effectuées pendant 72 heures avec des prélèvements toutes les 12
heures. A la fin de la fermentation, l’ensemble de la réaction (contenant et contenu) est inactivé
par autoclave pendant 25 min. L’analyse des produits de fermentation est effectuée par HPLC-
UV, l’utilisation des substrats par HPAEC-PAD et les sucres totaux par méthode phénol/acide
sulfurique.
IV. Résultats
1. Conversion thermochimique de la
(ligno)cellulose
L’ensemble « fractionnement et liquéfaction » est représenté dans la figure R2.
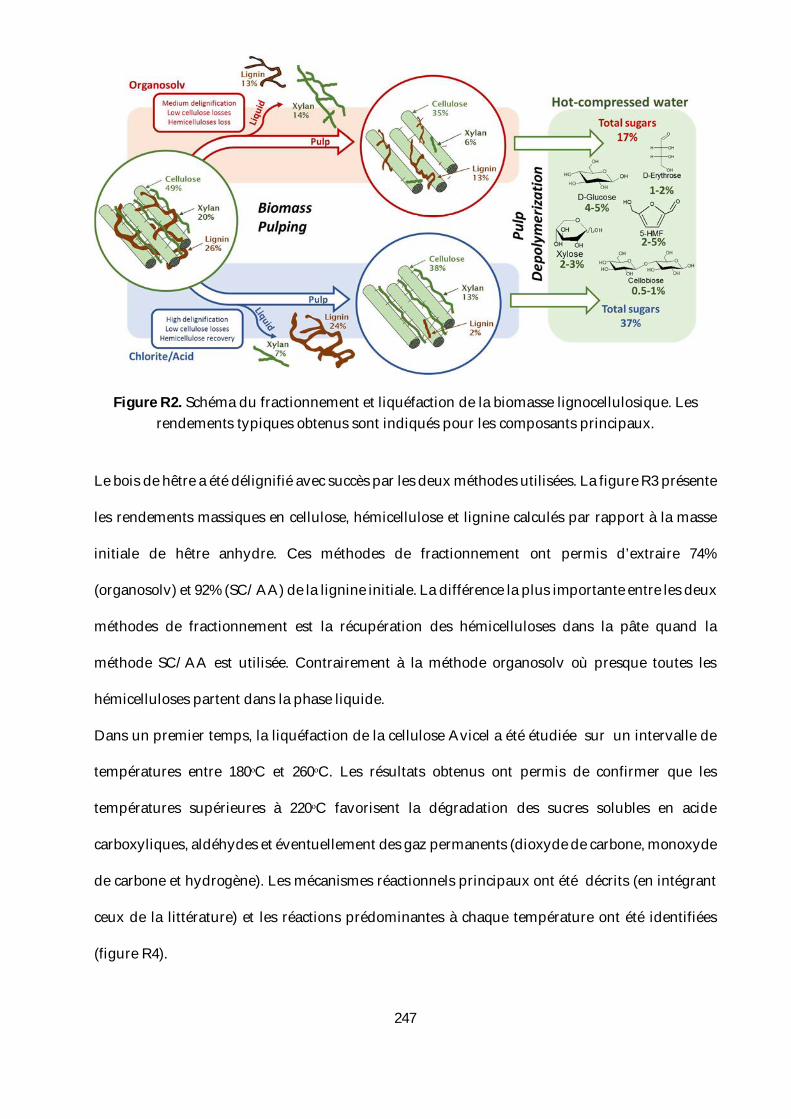
247
Figure R2. Schéma du fractionnement et liquéfaction de la biomasse lignocellulosique. Les rendements typiques obtenus sont indiqués pour les composants principaux.
Le bois de hêtre a été délignifié avec succès par les deux méthodes utilisées. La figure R3 présente
les rendements massiques en cellulose, hémicellulose et lignine calculés par rapport à la masse
initiale de hêtre anhydre. Ces méthodes de fractionnement ont permis d’extraire 74%
(organosolv) et 92% (SC/AA) de la lignine initiale. La différence la plus importante entre les deux
méthodes de fractionnement est la récupération des hémicelluloses dans la pâte quand la
méthode SC/AA est utilisée. Contrairement à la méthode organosolv où presque toutes les
hémicelluloses partent dans la phase liquide.
Dans un premier temps, la liquéfaction de la cellulose Avicel a été étudiée sur un intervalle de
températures entre 180ᵒC et 260ᵒC. Les résultats obtenus ont permis de confirmer que les
températures supérieures à 220ᵒC favorisent la dégradation des sucres solubles en acide
carboxyliques, aldéhydes et éventuellement des gaz permanents (dioxyde de carbone, monoxyde
de carbone et hydrogène). Les mécanismes réactionnels principaux ont été décrits (en intégrant
ceux de la littérature) et les réactions prédominantes à chaque température ont été identifiées
(figure R4).
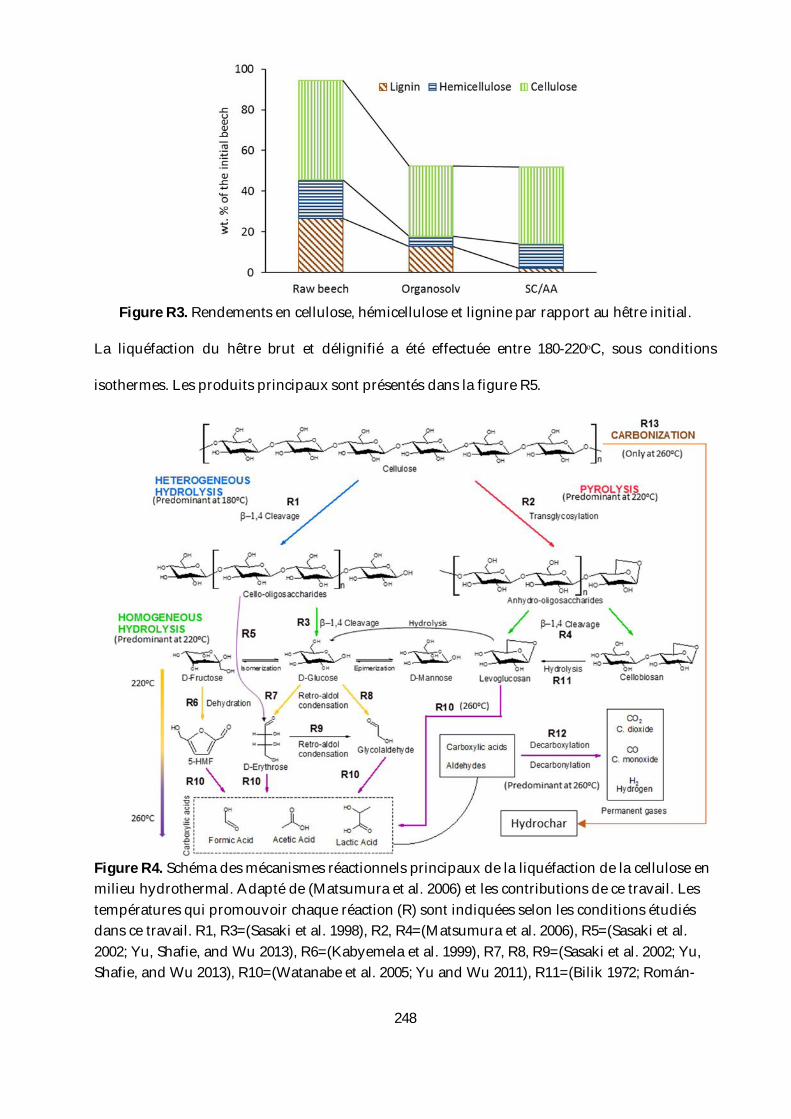
248
Figure R3. Rendements en cellulose, hémicellulose et lignine par rapport au hêtre initial.
La liquéfaction du hêtre brut et délignifié a été effectuée entre 180-220ᵒC, sous conditions
isothermes. Les produits principaux sont présentés dans la figure R5.
Figure R4. Schéma des mécanismes réactionnels principaux de la liquéfaction de la cellulose en milieu hydrothermal. Adapté de (Matsumura et al. 2006) et les contributions de ce travail. Les températures qui promouvoir chaque réaction (R) sont indiquées selon les conditions étudiés dans ce travail. R1, R3=(Sasaki et al. 1998), R2, R4=(Matsumura et al. 2006), R5=(Sasaki et al. 2002; Yu, Shafie, and Wu 2013), R6=(Kabyemela et al. 1999), R7, R8, R9=(Sasaki et al. 2002; Yu, Shafie, and Wu 2013), R10=(Watanabe et al. 2005; Yu and Wu 2011), R11=(Bilik 1972; Román-
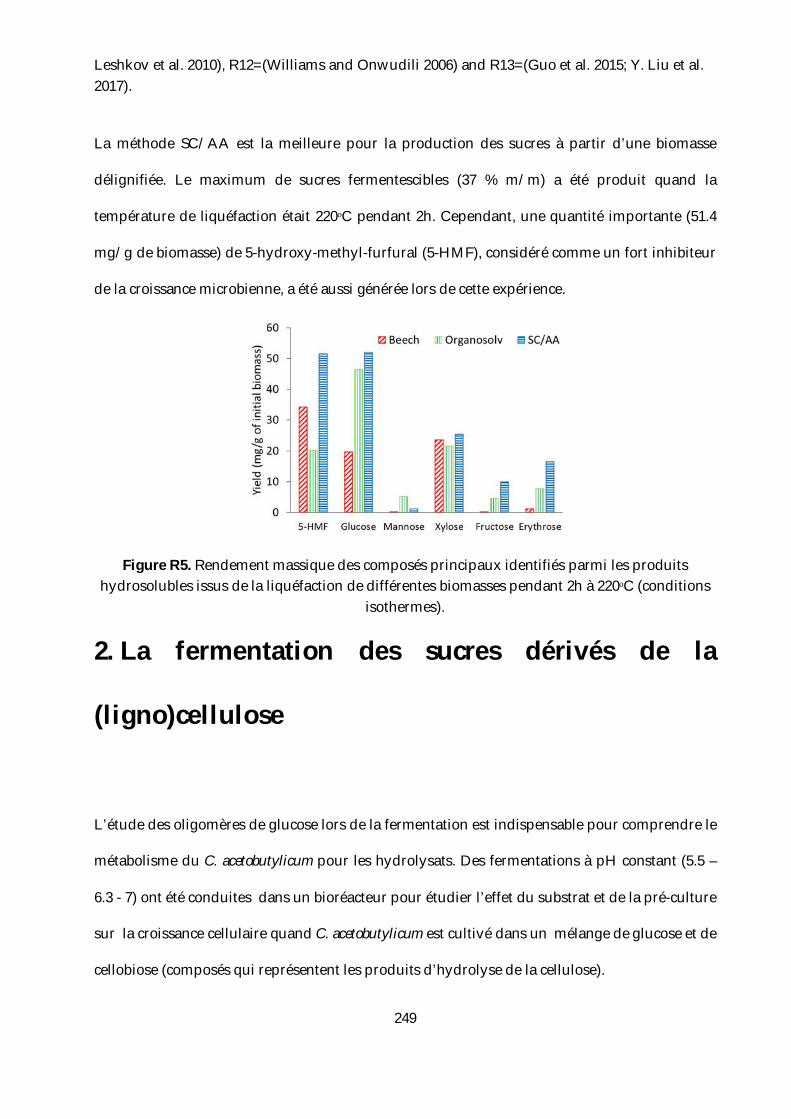
249
Leshkov et al. 2010), R12=(Williams and Onwudili 2006) and R13=(Guo et al. 2015; Y. Liu et al. 2017).
La méthode SC/AA est la meilleure pour la production des sucres à partir d’une biomasse
délignifiée. Le maximum de sucres fermentescibles (37 % m/m) a été produit quand la
température de liquéfaction était 220ᵒC pendant 2h. Cependant, une quantité importante (51.4
mg/g de biomasse) de 5-hydroxy-methyl-furfural (5-HMF), considéré comme un fort inhibiteur
de la croissance microbienne, a été aussi générée lors de cette expérience.
Figure R5. Rendement massique des composés principaux identifiés parmi les produits hydrosolubles issus de la liquéfaction de différentes biomasses pendant 2h à 220ᵒC (conditions
isothermes).
2. La fermentation des sucres dérivés de la
(ligno)cellulose
L’étude des oligomères de glucose lors de la fermentation est indispensable pour comprendre le
métabolisme du C. acetobutylicum pour les hydrolysats. Des fermentations à pH constant (5.5 –
6.3 - 7) ont été conduites dans un bioréacteur pour étudier l’effet du substrat et de la pré-culture
sur la croissance cellulaire quand C. acetobutylicum est cultivé dans un mélange de glucose et de
cellobiose (composés qui représentent les produits d’hydrolyse de la cellulose).
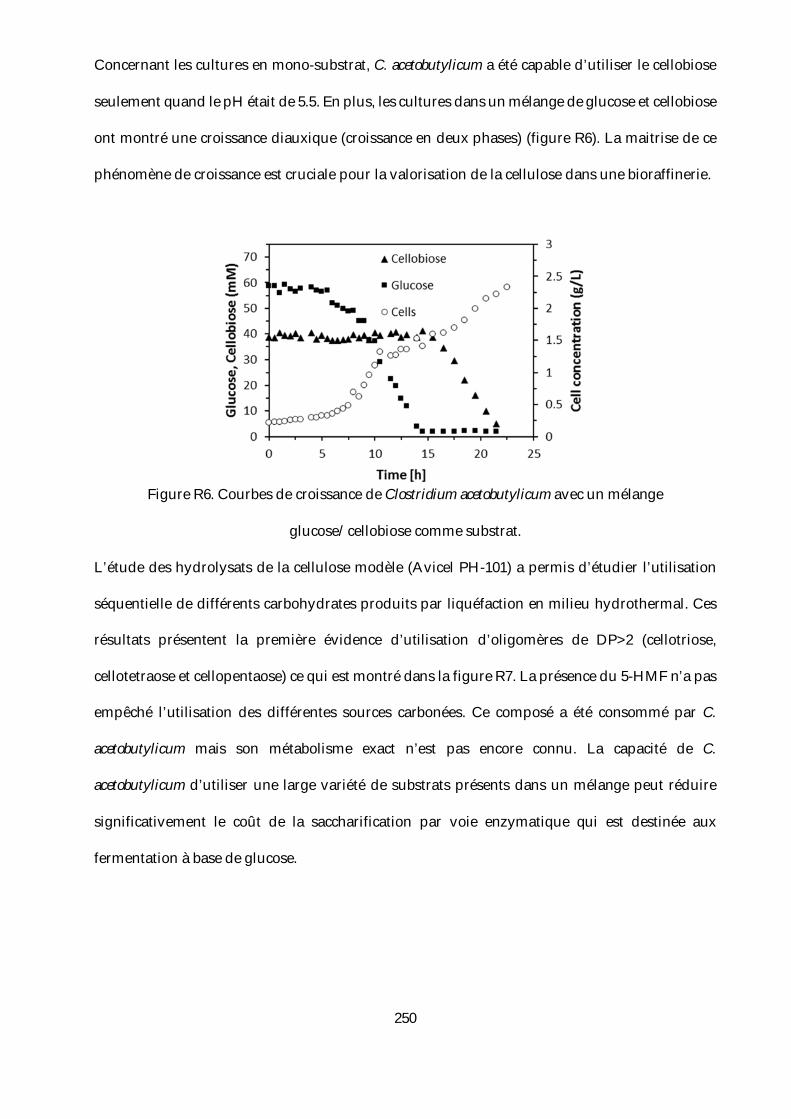
250
Concernant les cultures en mono-substrat, C. acetobutylicum a été capable d’utiliser le cellobiose
seulement quand le pH était de 5.5. En plus, les cultures dans un mélange de glucose et cellobiose
ont montré une croissance diauxique (croissance en deux phases) (figure R6). La maitrise de ce
phénomène de croissance est cruciale pour la valorisation de la cellulose dans une bioraffinerie.
Figure R6. Courbes de croissance de Clostridium acetobutylicum avec un mélange
glucose/cellobiose comme substrat.
L’étude des hydrolysats de la cellulose modèle (Avicel PH-101) a permis d’étudier l’utilisation
séquentielle de différents carbohydrates produits par liquéfaction en milieu hydrothermal. Ces
résultats présentent la première évidence d’utilisation d’oligomères de DP>2 (cellotriose,
cellotetraose et cellopentaose) ce qui est montré dans la figure R7. La présence du 5-HMF n’a pas
empêché l’utilisation des différentes sources carbonées. Ce composé a été consommé par C.
acetobutylicum mais son métabolisme exact n’est pas encore connu. La capacité de C.
acetobutylicum d’utiliser une large variété de substrats présents dans un mélange peut réduire
significativement le coût de la saccharification par voie enzymatique qui est destinée aux
fermentation à base de glucose.
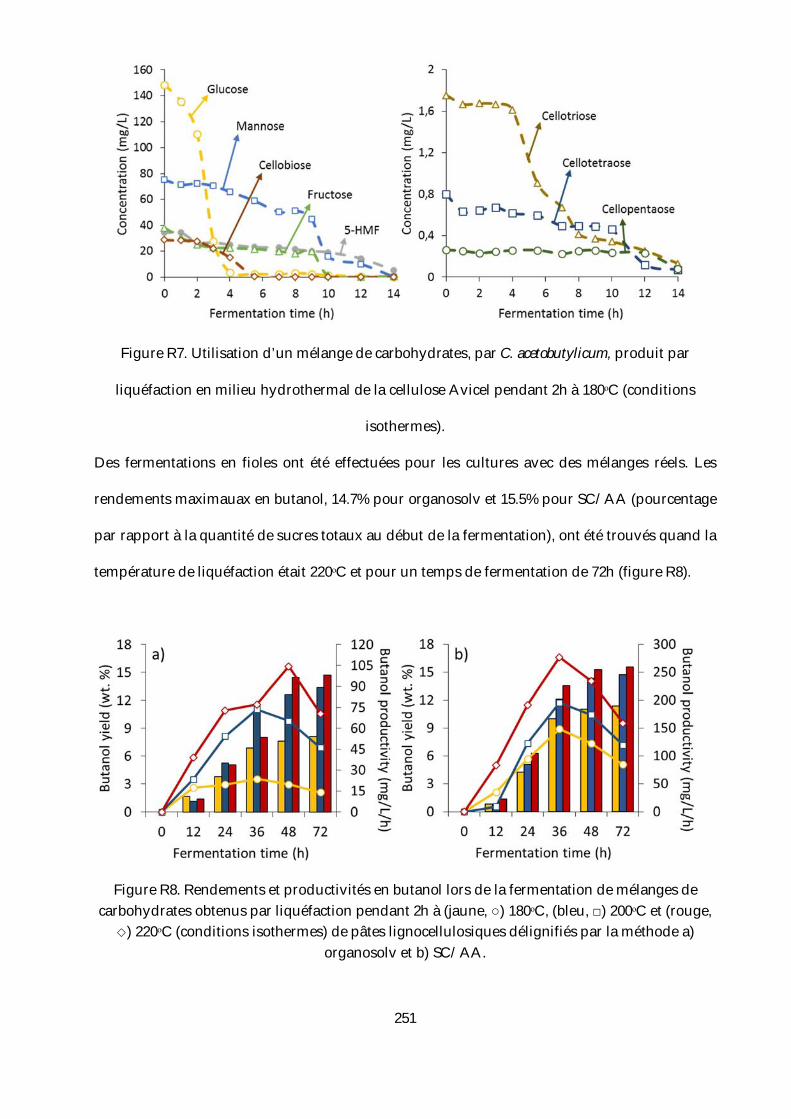
251
Figure R7. Utilisation d’un mélange de carbohydrates, par C. acetobutylicum, produit par
liquéfaction en milieu hydrothermal de la cellulose Avicel pendant 2h à 180ᵒC (conditions
isothermes).
Des fermentations en fioles ont été effectuées pour les cultures avec des mélanges réels. Les
rendements maximauax en butanol, 14.7% pour organosolv et 15.5% pour SC/AA (pourcentage
par rapport à la quantité de sucres totaux au début de la fermentation), ont été trouvés quand la
température de liquéfaction était 220ᵒC et pour un temps de fermentation de 72h (figure R8).
Figure R8. Rendements et productivités en butanol lors de la fermentation de mélanges de carbohydrates obtenus par liquéfaction pendant 2h à (jaune, ○) 180ᵒC, (bleu, □) 200ᵒC et (rouge,
) 220ᵒC (conditions isothermes) de pâtes lignocellulosiques délignifiés par la méthode a) organosolv et b) SC/AA.
252
Dans les mêmes conditions, le rendement ABE (acétone-butanol-éthanol) a été de 19.2% pour la
pâte organosolv et 20.7% pour la pâte SC/AA. D’autres métabolites valorisables ont été produits
en même temps : l’hydrogène, l’acide butyrique et l’acide acétique.
Ces rendements sont comparables à ceux trouvés dans la littérature (Jang et al. 2012; K. Liu et al.
2015; Lee et al. 2016). Néanmoins, l’apport plus significative de ce travail est la méthodologie
simplifiée qui peut augmenter significativement la viabilité économique de ce procédé de
bioraffinerie : une saccharification très rapide de la biomasse par voie thermochimique couplée à
une fermentation avec une souche capable de transformer tous les carbohydrates en produits
d’intérêt industriel.
En plus, un modèle sous le logiciel Aspen Plus a été developé permettant de faire une analyse
energétique de l’ensemble du procédé.
253
CELLULOSE VALORIZATION IN BIOREFINERY: SYNERGIES BETWEEN THERMOCHEMICAL AND BIOLOGICAL PROCESSES Because fossil resources are exhaustible by definition, the carbon needed for energy and materials production could be obtained from lignocellulosic biomass. Fermentation processes are able to provide a wide variety of interesting products that can replace the crude oil based "building blocks". However, the abundance of lignocellulosic biomass in the environment contrasts with its very low bioavailability. Indeed, because of (i) its insoluble nature, (ii) its more or less crystalline structure and (iii) the nature of the bonds between the polymer fibers, cellulose is a carbon substrate difficult to valorize by biochemical/fermentation processes alone. Fast pyrolysis or liquefaction of cellulose are mainly studied to produce a bio-oil, which would be upgraded by catalytic hydrotreatment into fuels or building blocks. In the current state of the art, studies at the interface of these two fields involving a biochemical or microbiological conversion of these bio-oils are still rare. The aim of this thesis is the coupling of a thermochemical conversion process of cellulose, to depolymerize it, to a microbial transformation process to produce solvents, acids and gases (butanol, ethanol, acetone, acetic acid, butyric acid, lactic acid, hydrogen) that are of great interest for the fuel or green chemistry industry. To do this, beech wood was fractionated by organosolv and chlorite / acid (SC / AA) methods in order to recover a cellulose-rich pulp. Hydrothermal liquefaction and fast pyrolysis processes were used to obtain sugars that were transformed into building blocks by fermentation. Many analytical methods have been developed for the characterization of products from each step of the process. Finally, a model of the process using the commercial software Aspen Plus® was developed to establish mass and energy balances of the integrated process including: the fractionation of the wood, then the liquefaction of the cellulosic fraction and the fermentation of bio-oils. Hydrothermal, Biorefinery, Biomass, Biofuels, Pyrolysis, Fermentation, Cellulose VALORISATION DE LA CELLULOSE DANS UNE BIORAFFINERIE: SYNERGIES ENTRE LE PROCEDES THERMOCHIMIQUES ET BIOLOGIQUES Parce que les ressources fossiles sont épuisables par définition, le carbone nécessaire à la production d'énergie et de matériaux pourrait provenir en grande partie de la biomasse lignocellulosique. Les procédés de fermentation sont capables de fournir une grande variété de produits d'intérêts capables de remplacer les synthons d'origine pétrolière. Cependant, en raison (i) de son caractère insoluble, (ii) de sa structure plus ou moins cristalline et (iii) de la nature des liaisons entre les maillons du polymère, la cellulose est un substrat carboné difficile à valoriser par voie biochimique/fermentaire seule. La pyrolyse rapide ou la liquéfaction de la cellulose sont principalement étudiées pour produire une bio-huile, qui serait valorisée par hydrotraitement catalytique en carburant ou en building blocks. Dans l'état de l'art actuel, les travaux à l'interface de ces deux domaines portant sur une conversion biochimique ou microbiologique de ces bio-huiles sont encore rares. L’objectif de cette thèse est de coupler un procédé de conversion thermochimique de la cellulose, pour la dépolymériser, à un procédé de transformation microbienne pour produire des solvants, des acides et des gaz (butanol, éthanol, acétone, acide acétique, acide butyrique, acide lactique, hydrogène) qui suscitent un fort intérêt dans l’industrie des carburants ou de la chimie verte. Pour ce faire, le bois de hêtre a été fractionné par les méthodes organosolv et chlorite/acide (SC/AA) afin de récupérer une pâte riche en cellulose. Des procédés de liquéfaction hydrothermale et de pyrolyse rapide ont été utilisés pour obtenir des sucres qui ont été finalement transformés par fermentation en synthons. De nombreuses méthodes analytiques ont été développées pour la caractérisation des produits issus de chaque étape du procédé. Enfin, un modèle du procédé utilisant le logiciel commercial Aspen Plus® a été développé pour établir les bilans de matière et énergie du procédé intégré : du fractionnement du bois, puis la liquéfaction de la fraction cellulosique et à la fermentation des bio-huiles.
Hydrothermal, Bioraffinerie, Biomasse, Biocarburants, Pyrolyse, Fermentation, Cellulose