liberationtechnology: mobilephonesandpoliticalmobilizationin … · liberationtechnology:...
TRANSCRIPT
Liberation Technology:Mobile Phones and Political Mobilization in
Africa∗
Marco Manacorda† Andrea Tesei‡
This version: January 2016
Can digital information and communication technology foster mass political mo-bilization? We use a novel geo-referenced dataset for the entire African continentbetween 1998 and 2012 on the coverage of mobile phone signal together with geo-referenced data from multiple sources on the occurrence of protests and on individualparticipation in protests to bring this argument to empirical scrutiny. We find thatmobile phones are instrumental to mass mobilization during economic downturns,when reasons for grievance emerge and the cost of participation falls. Estimated ef-fects are if anything larger once we use an instrumental variable approach that relieson differential trends in coverage across areas with different incidence of lightningstrikes. The results are in line with insights from a network model with imperfect in-formation and strategic complementarities in protest provision. Mobile phones makeindividuals more responsive to both changes in economic conditions - a mechanismthat we ascribe to enhanced information - and to their neighbors’ participation - amechanism that we ascribe to enhanced coordination. Empirically both effects are atplay, highlighting the channels through which digital ICT can alleviate the collectiveaction problem.
Keywords: mobile phones, collective action, Africa, geo-referenced data
JEL codes: D70, O55, L96
∗ We are grateful to Antonio Cabrales, Antonio Ciccone, Melissa Dell, Ruben Durante, Ruben Enikolopov, SergeiGuriev, Alan Manning, Guy Michaels, Kaivan Munshi, Luigi Pascali, Maria Petrova, Jacopo Ponticelli, MartaReynal-Querol, Jacob Shapiro, Davide Ticchi, Francesco Trebbi, David Yanagizawa-Drott and to seminarparticipants at LSE, Oxford, UPF, INSEAD, Namur, IMT-Lucca, Oslo and the the UK Department forInternational Development for many useful conversations and comments.
† Queen Mary University of London, CEP (LSE), CEPR & IZA; contact: [email protected].‡ Queen Mary University of London & CEP (LSE); contact: [email protected].

1. Introduction
In this paper we use a variety of geo-referenced data for the whole of Africa over fifteen yearsto investigate whether mobile phone technology has the potential to foster mass political mo-bilization and explore the underlying behavioral channels of impact.The recent spread of digital information and communication technology has fed a wave of
optimism and a large amount of rhetoric about its use as a “liberation technology” capable ofhelping the oppressed and disenfranchised worldwide. According to this argument, popularizedby political sociologists and media scholars (Castells 2011, Diamond 2010, Shirky 2011), mobilephones and Internet, thanks to the opportunity they offer for two-way, multi-way and masscommunication, and their low cost, decentralized, open-access nature have the potential tofoster citizens’ political activism and even lead to mass political mobilization, especially whenreasons for grievance emerge and traditional, civic forms of political participation are de factoor lawfully prevented.1
This argument appears particularly appealing for Africa. Although a certain degree ofoptimism surrounds Africa’s recent development path (Miguel & Easterly 2009), reasons forgrievance abound, with the continent, and in particular Sub-Saharan countries, performing atthe bottom of the world rankings in terms of most indicators of economic, social and demo-cratic development (World Bank 2012). The continent has also experienced the fastest rise inthe spread of mobile phone technology worldwide: while in 1999 an estimated 80 million Africancitizens had access to mobile phones, in 2008 this number was estimated on the order of 477million, around 60 percent of the entire continent population (Aker & Mbiti 2010). The spreadof mobile technology across the continent has taken place against the backdrop of a practicallynon-existent fixed telephone line infrastructure, and because of this, it is claimed to have hadunprecedented economic and social effects on the lives of its citizens, in particular the poorand very poor. The ubiquitous use of mobile phones in the continent has also led to the emer-gence of a number of creative applications and technological developments, such as SMS-basedelection monitoring, health and disaster prevention SMS-based information campaigns, disasterrelief campaigns and mobile banking (Aker et al. 2015, Rheingold 2008). Due to the lack ofa fixed phone line and high-speed Internet cabling, mobile phones are also the most used wayto access the Internet and social media in the continent (Stork et al. 2013), greatly enhancingtheir information and communication potential.Consistent with the liberation technology hypothesis, Africa has witnessed over the last decade
some of the most spectacular episodes of mass mobilization. Food riots swept the continentbetween 2007 and 2008 (Berazneva & Lee 2013), while mass civil unrest (the Arab Spring)exploded in the northern countries between 2010 and 2012 (Campante & Chor 2012b).
1 Already as of 2007 The Economist highlighted the role of mobile phone technology in fostering politicalactivism worldwide, launching the term “mobile activism” (The Economist, 2007). Digital ICT and newmedia, including blogging and twitter, are also claimed to have been instrumental in what appears to be arecent surge of protests worldwide (Ortiz et al. 2013), from the Occupy Wall Street movement in the USAand the indignados in Spain to the “Arab Spring” in North Africa and the Middle-east (Howard et al. 2011).
1
Simple economic reasoning - which we formalize below - suggests that increased informationand communication brought about by mobile phones have the potential to trigger collectiveaction. This technology in particular can help individuals acquire and spread infomation onissues and reasons for grievance.2 Due to its open-source and open-content nature, and henceby granting access to unadulterated information, digital ICT has also the potential to offsetgovernment propaganda, which curbs discontent via misinformation and persuasion, especiallywhen traditional media are under the control of the government or in the hand of powerfulinterests groups (DellaVigna & Gentzkow 2010).These arguments focus on the role of information provision on citizens’ private incentives
to participate, via its effect on the perceived individuals costs and returns. However, whenstrategic complementarities in the provision of protests exist, i.e. when the returns to po-litical activism increase or the cost of participation decrease the larger the number of othersparticipating, mobile phone technology can also foster mass mobilization through its abilityto promote coordination. Knowledge, albeit imperfect, of others’ likelihood of participating inparticular can foster individuals’ willingness to participate and lead to the emergence of protestsin equilibrium, an outcome that would not result in a world where individuals act atomistically.Despite the popularity of the liberation technology argument, there is no lack of reasons
for skepticism and no lack of criticisms even outside economics. First, governments can usethis technology as a control, surveillance or propaganda tool, hence making protests less ratherthan more likely (Morozov 2012). This effect is enhanced by the nature of the technology, thatmakes centralized control possible, an effect that is magnified by the circumstance that physicalinfrastructures as well as market regulation of ICT is, for obvious reasons, often directly in thehands of governments.A second often heard counter-argument against the liberation technology hypothesis is that
digital ICT can discourage social capital accumulation and the establishment of “strong ties”(in favor of “weak ties”) that are thought to be instrumental to mass mobilization (Bond et al.2012, Gladwell 2010), ultimately leading to political apathy rather than mobilization.Perhaps a more subtle argument why digital ICT might not ultimately lead to the emergence
of mass mobilization is that this technology has the potential to increase government account-ability via information spread and greater transparency or to directly improve living standards,in turn detracting from the rationale for mass political mobilization, which is widespread dis-content with the perceived state of the economy and politics.In sum, and despite a great deal of enthusiasm and plenty of anecdotal evidence on the role
played by digital ICT - and in particular mobile phones - in fostering mass political mobilization,there are good reasons to be skeptical about the role effectively played by this technology, andthe evidence remains admittedly scant. The mechanisms of impact are also poorly understood.As far as we are aware there is no systematic study that establishes a convincing relationshipbetween digital ICT and political mobilization and explores the underlying behavioral channels
2 Mass SMS, political and information campaigns are indeed increasingly popular in Africa (Aker et al. 2015,Rheingold 2008).
2

of impact and this paper aims precisely at investigating these questions.We bring the liberation technology argument to empirical scrutiny using several novel and
by and large unexploited datasets for the whole of Africa, respectively on the spread of mobilephone technology and on protest activity. What makes these different datasets particularlyappealing is their level of geographical detail, which allows us to examine the spread of protestsand mobile phone technology over time across small areas within countries.Data on local mobile phone coverage come from the Global System for Mobile Communica-
tions Association (GMSA) which collects this information for the purpose of creating roamingmaps for use by customers and providers worldwide. These data provide information on theavailability of signal for the whole of Africa (with the only exception of Somalia) between 1998and 2012 at a level of geographical precision of between 1 and approximately 20 km2 on theground, depending on the country. GSM technology accounts for around 80 percent of mobiletechnology worldwide and almost 100 percent in Africa.In order to measure the incidence of protests, we use two datasets on individual protest events,
both coming largely from compilation of newswires. First, we use data from a very large, open-source dataset, which relies on automated textual analysis of news sources, the Global Databaseon Events, Location and Tone (GDELT, Leetaru & Schrodt 2013) (http://gdeltproject.org/).As this is a largely yet unutilized dataset and since we have no control on the algorithm used tocollect the data or the news sources effectively utilized, we complement this information withanother widely utilized, but much smaller, manually compiled dataset on unrest in Africa, theArmed Conflict Location Events Database (ACLED, Raleigh et al. 2010).We combine these data with data from a variety of sources about, among others, population,
nature and use of land, infant mortality, natural resources, distance to cities, to the border andto the coast, kilometers of road, average rain and temperature etc. for approximately 10,500(55 X 55 km) cells which compose the continent, which are ultimately the units of observationin the analysis.This very detailed level of geographical disaggregation allows us to compare changes in the
incidence of protests in areas within the same country that experienced differential changesin the coverage of mobile technology. By focusing on within, rather than between, countriesvariation in the incidence of protests and the spread of ICT, we hope to alleviate the obviousconcern - and the ensuing bias in the estimates of impact - that ICT adoption and the incidenceof protests are correlated due to country-specific trends or shocks in unobservable variables,such as the state of the economic cycle.In the empirical analysis we start by showing that the two datasets on protests convey similar
information offering some reassurance on their information content. We also show that protestsare strongly counter-cyclical, i.e. more likely to occur during recessions. Once we turn to ourregression estimates we find that, on average, in our sample of countries and years, while mobilephones do not appear to affect the incidence of protests, they act in magnifying the effect ofrecessions. Our estimates suggest that a fall in GDP growth of 4 p.p. (approximately one
3
standard deviation) leads to a differential increase in protests per capita between an area withfull mobile phone coverage compared to an area with no coverage of around 10 percent. In orderto control for the possibility that local economic shocks or other determinants of ICT adoptionand protests might drive our results, we show that our estimates are robust to very flexiblespecifications that condition for differential linear time trends across areas with the same largearray of baseline characteristics.Although, by including in the regressions interactions of a large array of cross-sectional cell
characteristics with linear time trends, we attempt to control at best for the joint determinantsof protests and mobile phone technology across areas, a concern remains that even conditionalon these variables, mobile technology adoption remains correlated with unobserved trends inprotests. To address this concern, we use an instrumental variable strategy that exploits theslower adoption of mobile technology in areas subject to high incidence of lightning strikes.Frequent electrostatic discharges during storms damage mobile phone infrastructures and nega-tively affect connectivity, acting on both the demand (as the risk of intermittent communicationsdiscourages adoption) and the supply (as power surge protection is costly and poor connectivitymakes the investment less profitable). Based on NASA satellite-generated data on the incidenceof lightning for the entire Africa, we show that areas with higher average incidence of lightningdisplay slower adoption of mobile phone technology. A one standard deviation increase in flashintensity leads to a lower penetration rate of mobile phone technology of approximately 0.43p.p. per year. The IV estimates - although typically less significant than the OLS - confirmthat mobile phones on average do not have an effect of protests, although they appear to be in-strumental to mass mobilization during bad economic times, which act as a trigger for protests.2SLS estimates show even larger effects of economic downturns on the incidence of protestsin high coverage relative to low coverage areas, with effects as large as three times the onesfound based on the OLS. As robustness checks, we show that our results hold true if we restrictto the pre-Internet period or if we exclude observations during the Arab Spring. In addition,we also show that the effects are particularly pronounced under authoritarian regimes or whentraditional media are captured.Using data on night lights (Henderson et al. 2012), we show that the instrument does not
directly affect local economic development, which might itself affect the incidence of protestswhile being correlated with mobile phone penetration. This evidence reinforces our claim thatthe instrument is exogenous to the dependent variable. Possibly more importantly, we find nocorrelation between the instrument and the outcome variable in periods when mobile phonetechnology was unavailable, which acts as a test for the validity of the exclusion restriction.A remaining empirical concern is that mobile phones also increase the probability that an
event is reported in the news, and hence observed in our data. In this case our estimates wouldsuffer from a margin of endogenous selection: at the extreme these might simply be capturingincreased reporting rather than increased mobilization. To address this issue we use micro-datafrom the Afrobarometer (for 27 countries out of the 48 countries in the analysis) between 2005
4

and 2012 to show that self-reported individual participation in protests (as opposed to news-reported measures of protest occurrence) follows a similar pattern, with participation increasingmore during periods of economic downturns in covered relative to uncovered areas.A major advantage of using micro-data on protest participation is also that they allow us
to identify the precise mechanisms through which mobile phones affect political mobilization.In order to investigate these mechanisms we borrow from and extend Jackson & Yariv (2007)network model with imperfect information. In its barest form, the model assumes that agentsmaximize the payoff from taking a certain action (in the present case, protesting), which dependspositively on the number of connections taking that action through strategic complementari-ties, and negatively on the cost of participation. The latter in turn depends positively oneconomic conditions, as worse economic conditions reduce the opportunity cost of participatingin a protest or increase reasons for grievance. Individuals in society differ in the number ofconnections and in their cost of protesting. Although individuals do not know what actionstheir connections will take, they can make educated guesses based on the distribution of con-nectedness in the population, which is publicly known. This is key for the determination of the(stable) equilibrium level of protests.In equilibrium, the level of protests is higher the lower GDP growth. There are two mecha-
nisms at work. For one, since worse economic conditions reduce the individual cost of partic-ipation then the provision of protests will mechanically increase. This is a first-round effect.If strategic complementarities are at work, though, this mechanism is enhanced, as individu-als iterate over their neighbors’ best responses knowing that, when the economy does poorly,their neighbors will be more likely to participate, leading to a second-round increase in protestprovision in equilibrium.These effects are true irrespective of the extent of connectedness in society. However, if indi-
viduals with more connections are more likely to participate when the economy deteriorates -an effect that we ascribe to increased information - or if they are more responsive to changes intheir neighbors’ propensity to participate - an effect that we ascribe to enhanced coordination- then worse economic conditions unambiguously lead to a greater increase in protest partici-pation in areas with higher connectedness. This is true because the magnitude of either of themechanical first-round effect or of the second-round spillover effect - or of both - are enhanced.The model is particularly appealing in our setting. Access to mobile phones can be thought
as of increasing connectedness. If mobile phones warrant access to unadulterated information,meaning that those with mobile phones are better informed about the true state of the econ-omy, and hence are more likely to respond to changes in economic conditions (something forwhich we provide direct evidence below), or if mobile phones improve coordination throughgreater communication - or both - then the protest differential between areas with high mobilephone coverage relative to areas with low coverage is deemed to increase when the economydeteriorates.Regressions estimates based on aggregate data from GDELT and ACLED subsume potentially
5

both mechanisms: increased information as well as increased coordination. We show howeverthat one can use micro-data from the Afrobarometer to separately identify these two effects.Importantly, we exploit the circumstance that the Afrobarometer also provides an individualmeasure of mobile phone use. Intuitively, one can tell these two effects apart by examining thedifferential response between individuals with and without mobile phones to changes in economicconditions and in the fraction of others participating, effectively a spillover effect. Although thefraction of others participating is clearly an endogenous variable, due to a classical reflexivityproblem (Manski 1993), one can identify the spillover effect through variations in the fractionof others connected in society, i.e. mobile phone coverage. If conditional on one’s mobile phoneownership and the state of the economy, an individual in an area with greater coverage is morelikely to respond to changes in economic conditions, then this effect must work through strategiccomplementarities.Consistent with this model, we find that individuals are more likely to participate during
bad economic times. We also find that individuals are more likely to participate the higher isthe fraction of others participating in society, even in areas with no coverage. Our estimatesimply that a 10 percent increase in the fraction of fellow citizens participating increases eachindividual’s probability of participation by around 8 percent. This is strong evidence of strategiccomplementarities in the provision of protests. Taken together, these findings imply that worseeconomic conditions lead to an increase in protest through both a direct compositional effectand a spillover effect.Mobile phones, though, enhance both these effects. Those with mobile phones are more
likely to respond to changes in both economic conditions and in the fraction of fellow citizensparticipating. Empirically, both effects are at work, implying that the mechanism throughwhich mobile phones foster political mobilization during recessions is both through enhancedcitizens’ information and enhanced coordination in protests participation.Our paper borrows from and contributes to different strands of the literature. A small but
established body of evidence shows that individual participation in mass political movementsis negatively correlated with economic conditions, as worse economic conditions are associatedwith lower private opportunity costs of participation and provide a rationale for widespreadgrievance (Campante & Chor 2012a,b, DiPasquale & Glaeser 1998, Ponticelli & Voth 2011).3
Our paper is also closely related to studies focusing on the role of both traditional andnew media on political participation. A number of studies for the USA show that media andnewspapers foster political participation, most likely through information provision (Gentzkowet al. 2011, Gerber et al. 2009). These studies focus on traditional media and on civic forms ofparticipation in advanced democracies and it is unclear whether these findings extend to ICT
3 This parallels findings that worse economic conditions are typically associated with greater incidence or riskof conflict and insurgency (see Blattman & Miguel 2010, Collier et al. 2000, Harari & La Ferrara 2013, Miguelet al. 2004), although there is also an argument that economic growth can foster rather than discourage unrestthrough a rapacity effect (Dube & Vargas 2013). A related literature also emphasizes the role of protests andrevolution threats during bad economic times as triggers for political changes and democratization (Acemoglu& Robinson 2001, 2006, Brückner & Ciccone 2011).
6
and to spontaneous, less codified and perhaps less civic forms of political participation in lowincome countries and in less mature democracies or in autocracies. There is also evidence thoughthat Internet and new media can lead to greater political disaffection (Falck et al. 2014).4
Alongside, a small but growing body of literature emphasizes the role of traditional media onvoters’ political alignment through propaganda and persuasion, especially when these are in thehands of government or are politically aligned (DellaVigna & Kaplan 2007, Durante et al. 2015,Yanagizawa-Drott 2014), although independent media can counteract these effects (Enikolopovet al. 2011). Free media can also discipline politicians and increase accountability (Besley &Burgess 2002, Reinikka & Svensson 2011, Snyder Jr & Strömberg 2010, Strömberg 2004) andsocial media have the potential to reduce corruption and favoritism towards firms connected tothe political elite (Acemoglu et al. 2014).A different stream of studies focuses on the role of strategic complementarities in affecting
collective action. Particularly relevant in our setting is Yanagizawa-Drott (2014) who studies therole of government propaganda during the Rwandan genocide. Using a global games approach,the paper argues that greater local radio coverage fostered participation in mass killing not onlythrough a direct information channel, that the government was unwilling to punish perpetrators,but also through the spread of common knowledge, i.e. the knowledge that others also knew (andknew that others knew), in turn solving the coordination problem that plagues collective action.Somewhat in a similar vein, recent work by Madestam et al. (2013) shows that participation inrallies during the Tax day in the USA was lower in rainy locations. Probably, this is not onlybecause individuals have greater private costs of participating but also because rain knowinglymakes others less likely to participate, hence reducing each individual’s private incentive toparticipate. Consistent with this, DiPasquale & Glaeser (1998) show that riots in the USAare more likely to occur in cities than in rural areas, an effect that they ascribe precisely toenhanced coordination when communication costs are lower.The rest of the paper is organized as follows. Section 2 presents the data. Section 3 presents
descriptive statistics. Section 4 builds on the theoretical model, which is discussed in detail inAppendix B, to lay out the empirical strategy. Section 5 presents the empirical results. Section6 finally concludes.
2. Data
In this section we present the main sources of data used in the rest of the analysis. We start byfocusing on geo-referenced data on mobile phone coverage and we then document the availablegeo-referenced data on protests. Further details on the data are reported in Appendix A. Mostof our data cover the entire continent (with the exception of Somalia for which we have no
4 These results echo findings for the USA on the negative effect of television on voters’ turnout (Gentzkow 2006)and results for Indonesia that radio leads to reduced levels of trust and social capital (Olken 2009).
7
information on mobile phone coverage) over 15 years, from 1998 to 2012.5
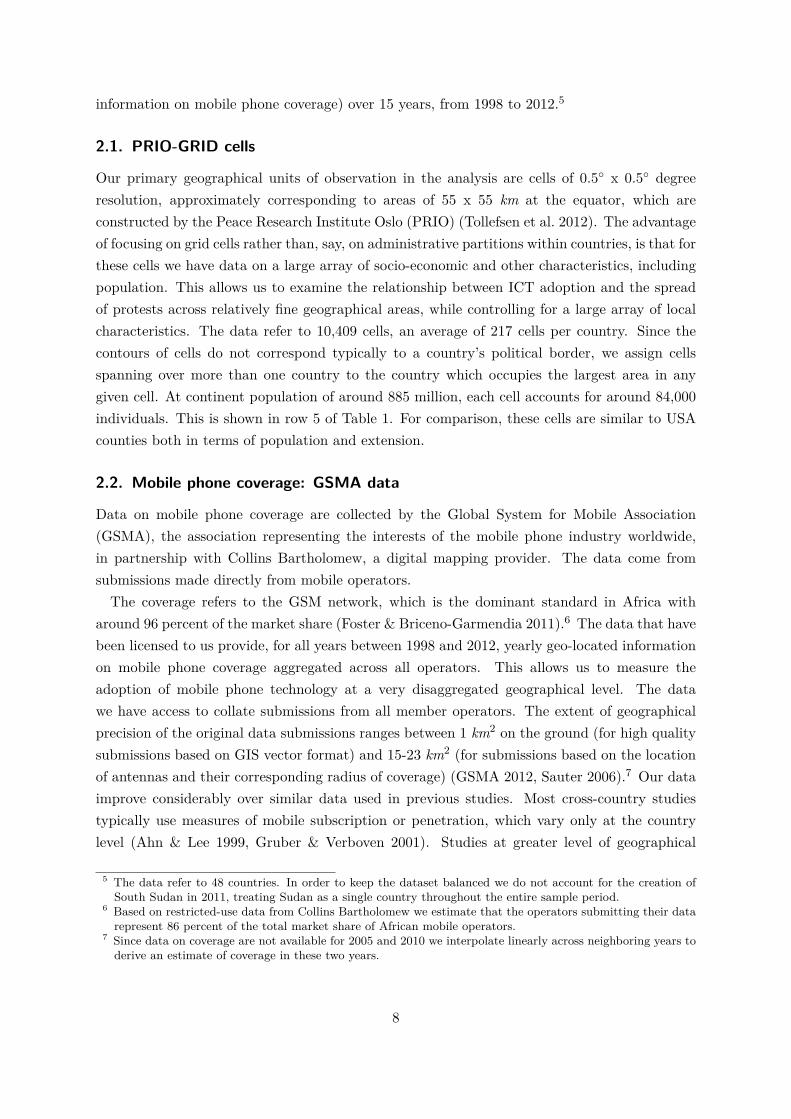
2.1. PRIO-GRID cells
Our primary geographical units of observation in the analysis are cells of 0.5 x 0.5 degreeresolution, approximately corresponding to areas of 55 x 55 km at the equator, which areconstructed by the Peace Research Institute Oslo (PRIO) (Tollefsen et al. 2012). The advantageof focusing on grid cells rather than, say, on administrative partitions within countries, is that forthese cells we have data on a large array of socio-economic and other characteristics, includingpopulation. This allows us to examine the relationship between ICT adoption and the spreadof protests across relatively fine geographical areas, while controlling for a large array of localcharacteristics. The data refer to 10,409 cells, an average of 217 cells per country. Since thecontours of cells do not correspond typically to a country’s political border, we assign cellsspanning over more than one country to the country which occupies the largest area in anygiven cell. At continent population of around 885 million, each cell accounts for around 84,000individuals. This is shown in row 5 of Table 1. For comparison, these cells are similar to USAcounties both in terms of population and extension.
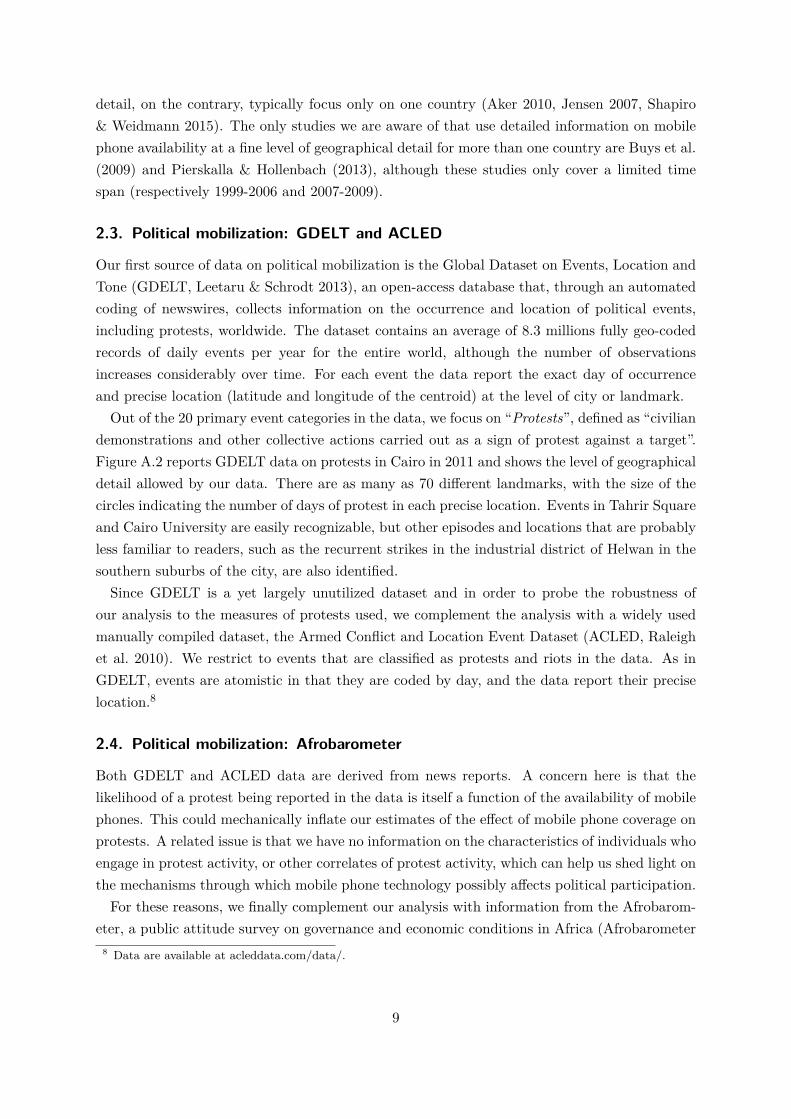
2.2. Mobile phone coverage: GSMA data
Data on mobile phone coverage are collected by the Global System for Mobile Association(GSMA), the association representing the interests of the mobile phone industry worldwide,in partnership with Collins Bartholomew, a digital mapping provider. The data come fromsubmissions made directly from mobile operators.The coverage refers to the GSM network, which is the dominant standard in Africa with
around 96 percent of the market share (Foster & Briceno-Garmendia 2011).6 The data that havebeen licensed to us provide, for all years between 1998 and 2012, yearly geo-located informationon mobile phone coverage aggregated across all operators. This allows us to measure theadoption of mobile phone technology at a very disaggregated geographical level. The datawe have access to collate submissions from all member operators. The extent of geographicalprecision of the original data submissions ranges between 1 km2 on the ground (for high qualitysubmissions based on GIS vector format) and 15-23 km2 (for submissions based on the locationof antennas and their corresponding radius of coverage) (GSMA 2012, Sauter 2006).7 Our dataimprove considerably over similar data used in previous studies. Most cross-country studiestypically use measures of mobile subscription or penetration, which vary only at the countrylevel (Ahn & Lee 1999, Gruber & Verboven 2001). Studies at greater level of geographical
5 The data refer to 48 countries. In order to keep the dataset balanced we do not account for the creation ofSouth Sudan in 2011, treating Sudan as a single country throughout the entire sample period.
6 Based on restricted-use data from Collins Bartholomew we estimate that the operators submitting their datarepresent 86 percent of the total market share of African mobile operators.
7 Since data on coverage are not available for 2005 and 2010 we interpolate linearly across neighboring years toderive an estimate of coverage in these two years.
8
detail, on the contrary, typically focus only on one country (Aker 2010, Jensen 2007, Shapiro& Weidmann 2015). The only studies we are aware of that use detailed information on mobilephone availability at a fine level of geographical detail for more than one country are Buys et al.(2009) and Pierskalla & Hollenbach (2013), although these studies only cover a limited timespan (respectively 1999-2006 and 2007-2009).
2.3. Political mobilization: GDELT and ACLED
Our first source of data on political mobilization is the Global Dataset on Events, Location andTone (GDELT, Leetaru & Schrodt 2013), an open-access database that, through an automatedcoding of newswires, collects information on the occurrence and location of political events,including protests, worldwide. The dataset contains an average of 8.3 millions fully geo-codedrecords of daily events per year for the entire world, although the number of observationsincreases considerably over time. For each event the data report the exact day of occurrenceand precise location (latitude and longitude of the centroid) at the level of city or landmark.Out of the 20 primary event categories in the data, we focus on “Protests”, defined as “civilian
demonstrations and other collective actions carried out as a sign of protest against a target”.Figure A.2 reports GDELT data on protests in Cairo in 2011 and shows the level of geographicaldetail allowed by our data. There are as many as 70 different landmarks, with the size of thecircles indicating the number of days of protest in each precise location. Events in Tahrir Squareand Cairo University are easily recognizable, but other episodes and locations that are probablyless familiar to readers, such as the recurrent strikes in the industrial district of Helwan in thesouthern suburbs of the city, are also identified.Since GDELT is a yet largely unutilized dataset and in order to probe the robustness of
our analysis to the measures of protests used, we complement the analysis with a widely usedmanually compiled dataset, the Armed Conflict and Location Event Dataset (ACLED, Raleighet al. 2010). We restrict to events that are classified as protests and riots in the data. As inGDELT, events are atomistic in that they are coded by day, and the data report their preciselocation.8
2.4. Political mobilization: Afrobarometer
Both GDELT and ACLED data are derived from news reports. A concern here is that thelikelihood of a protest being reported in the data is itself a function of the availability of mobilephones. This could mechanically inflate our estimates of the effect of mobile phone coverage onprotests. A related issue is that we have no information on the characteristics of individuals whoengage in protest activity, or other correlates of protest activity, which can help us shed light onthe mechanisms through which mobile phone technology possibly affects political participation.For these reasons, we finally complement our analysis with information from the Afrobarom-
eter, a public attitude survey on governance and economic conditions in Africa (Afrobarometer8 Data are available at acleddata.com/data/.
9
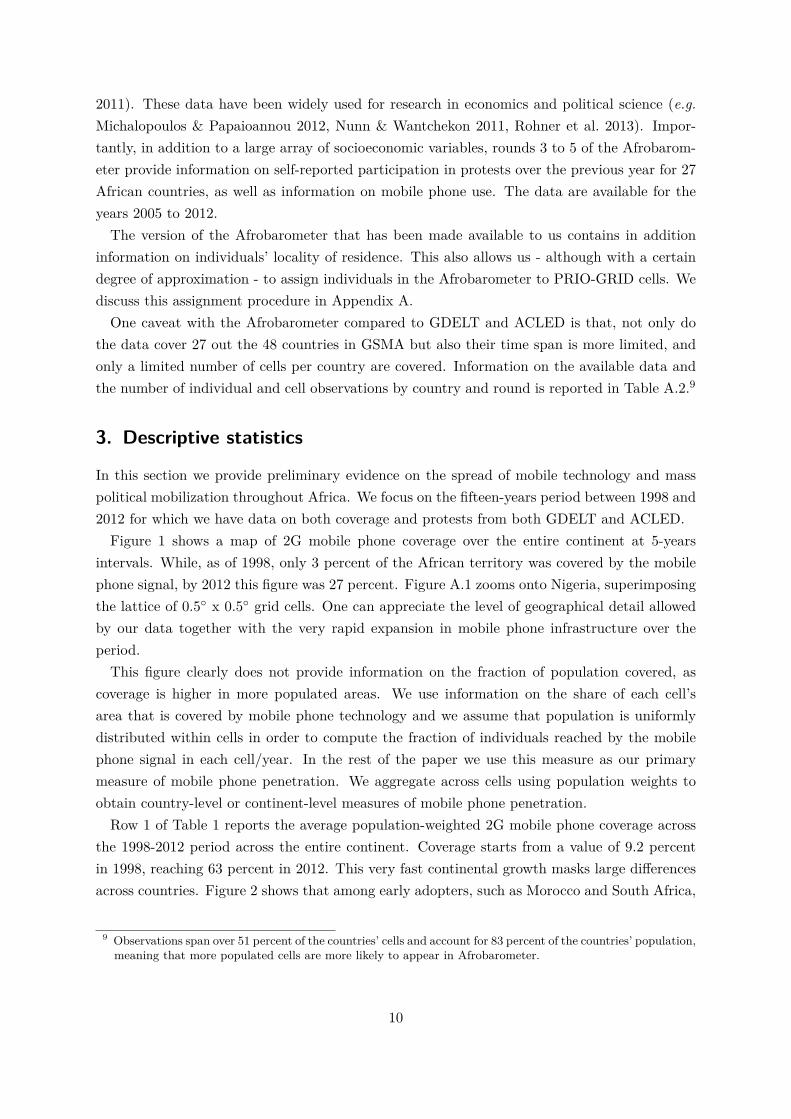
2011). These data have been widely used for research in economics and political science (e.g.Michalopoulos & Papaioannou 2012, Nunn & Wantchekon 2011, Rohner et al. 2013). Impor-tantly, in addition to a large array of socioeconomic variables, rounds 3 to 5 of the Afrobarom-eter provide information on self-reported participation in protests over the previous year for 27African countries, as well as information on mobile phone use. The data are available for theyears 2005 to 2012.The version of the Afrobarometer that has been made available to us contains in addition
information on individuals’ locality of residence. This also allows us - although with a certaindegree of approximation - to assign individuals in the Afrobarometer to PRIO-GRID cells. Wediscuss this assignment procedure in Appendix A.One caveat with the Afrobarometer compared to GDELT and ACLED is that, not only do
the data cover 27 out the 48 countries in GSMA but also their time span is more limited, andonly a limited number of cells per country are covered. Information on the available data andthe number of individual and cell observations by country and round is reported in Table A.2.9
3. Descriptive statistics
In this section we provide preliminary evidence on the spread of mobile technology and masspolitical mobilization throughout Africa. We focus on the fifteen-years period between 1998 and2012 for which we have data on both coverage and protests from both GDELT and ACLED.Figure 1 shows a map of 2G mobile phone coverage over the entire continent at 5-years
intervals. While, as of 1998, only 3 percent of the African territory was covered by the mobilephone signal, by 2012 this figure was 27 percent. Figure A.1 zooms onto Nigeria, superimposingthe lattice of 0.5 x 0.5 grid cells. One can appreciate the level of geographical detail allowedby our data together with the very rapid expansion in mobile phone infrastructure over theperiod.This figure clearly does not provide information on the fraction of population covered, as
coverage is higher in more populated areas. We use information on the share of each cell’sarea that is covered by mobile phone technology and we assume that population is uniformlydistributed within cells in order to compute the fraction of individuals reached by the mobilephone signal in each cell/year. In the rest of the paper we use this measure as our primarymeasure of mobile phone penetration. We aggregate across cells using population weights toobtain country-level or continent-level measures of mobile phone penetration.Row 1 of Table 1 reports the average population-weighted 2G mobile phone coverage across
the 1998-2012 period across the entire continent. Coverage starts from a value of 9.2 percentin 1998, reaching 63 percent in 2012. This very fast continental growth masks large differencesacross countries. Figure 2 shows that among early adopters, such as Morocco and South Africa,
9 Observations span over 51 percent of the countries’ cells and account for 83 percent of the countries’ population,meaning that more populated cells are more likely to appear in Afrobarometer.
10

coverage was virtually ubiquitous by the end of the period. This is in contrast with countrieslike Ethiopia and Mali where, as of 2012, still less than 10 percent of the population was covered.In order to combine information on protests with information on coverage of mobile phone
technology, we compute the total number of events falling within each cell in each year andwe standardize this number to each cell’s population (in 100,000). On average, over the entirecontinent, GDELT records 1.24 yearly protests per 100,000 population.Trends in protests across the continent can be appreciated in Figure 3 that reports the
evolution of protests per capita over the entire continent. One can see a pronounced positivetrend in the incidence of protests, with an overall increase of around 200 log points over theperiod. One can also notice a temporary increase in 2008-09, when the food riots exploded anda very pronounced increase in 2010-12 when the Arab Spring swept part of the continent.10
Alongside trends in log protests per capita, Figure 3 reports average GDP growth (the dottedline) across the continent over this period.11 A remarkable feature of the data is that protests arestrongly counter-cyclical, consistent with the literature cited in the introduction that protestsare more likely to occur when reasons for grievance abound and when the opportunity cost ofparticipation falls, both of which are more likely to occur during recessions.12 We revert to theeffect of economic conditions on the incidence of protests later on in the paper when we presentour regression analysis.13
Data from ACLED provide an estimate of the incidence of protests per 100,000 individuals onthe order of 0.08, i.e. around one fifteenth of what found in GDELT (see rows 2 and 3 of Table1). One possible reason why the number of protests in GDELT is much larger than in ACLEDis that GDELT data are less likely to suffer from type-1 error, whereby truly occurring protestsfail to be reported or are misclassified. In particular small mobilization events might fail tobe recorded in ACLED.14 On the other hand, given the automated coding, it is possible thatGDELT suffers from a higher rate of type-2 error compared to ACLED, whereby events thatare not genuine protests are incorrectly classified as such. A related problem is that, although
10 Figure A.3 reports the evolution in log protests per capita (plus one to account for zeros) measured inGDELT separately by country. As the range of variation of this variable is very different across countries,we standardize these series to their value in 1998. One can observe an increase in protests around 2008 incountries like Mauritania, Madagascar and Guinea that experienced food riots. The variation in the data is- in all cases - dwarfed by the very rapid surge in protests at the beginning of the current decade, with clearspikes in countries like Algeria, Egypt, Libya, Morocco and Tunisia, where the Arab Spring took place.
11 This is a weighted average of countries’ GDP growth using cell population as weights. GDP growth is fromthe World Development Indicators (World Bank 2012). It represents the annual percentage growth rate ofGDP at market prices based on constant local currency. Aggregates are based on constant 2005 U.S. dollars.
12 The same correlation is found using ACLED data (results not reported but available upon request).13 Figure A.4 reports the cross-sectional correlation between mobile phone coverage and protests per capita in
GDELT (again expressed in logs of protests per capita plus one) across all countries. Data are averages acrossthe period for each country weighted by population weights. The data illustrate a clear positive correlationbetween these two series, with countries with full coverage, such as South Africa, showing rates of protestsper capita around 50 log points higher than countries with virtually no coverage, such as Ethiopia. Results,not reported, are similar when using ACLED.
14 Indeed, compared to manually complied datasets, machine coded datasets have typically low rates of falsenegatives (Schrodt 2012) and an independent appraisal of GDELT suggests that this performs particularlywell in this respect even compared to other automated coded datasets (Ward et al. 2013).
11

in GDELT every attempt is made to collapse multiple reports of a unique event into a singlerecord, the algorithm might fail to do so if the variables that uniquely identify an event differacross articles and newswires. We revert to this issue below.We have investigated at length the correlation between GDELT and ACLED. Despite the
marked difference in the number of reported protests, we find evidence that the incidence ofprotests across countries and over time, as well as within countries, is very highly correlatedacross the two datasets. This is discussed in Appendix A.Turning to the micro-data from Afrobarometer, on average 12 percent of individuals report
having participated in at least one protest during the past year (Table A.3). Reassuringly, wefind a positive and significant within-cell correlation between self-reported protest participationin Afrobarometer and the incidence of protests in both GDELT and ACLED. This is alsodiscussed in Appendix A.
4. Econometric model
As said, protests respond to the state of the economic cycle, increasing during recessions andfalling during booms. Worsening economic conditions can increase the incidence of protestsbecause they provide reasons for grievance and because they reduce the opportunity cost ofparticipating in mass mobilization. In this section we use regression analysis to investigatewhether, alongside the state of the economic cycle, mobile phone diffusion has an effect on theincidence of protests and whether possibly this effect varies as a function of the economic cycle.In the rest, we start by modeling how overall protest occurrence in cell varies as a function
of local coverage and the state of the economy and the interaction of the two. Information oncoverage and protest activity by cell is available consistently for the entire continent for fifteenyears (based on data from GSMA and GDELT or ACLED respectively).In section 4.3 we turn to the micro-founded model that underlies this aggregate model. We
show how one can use data on protest participation and mobile phone use at the individual levelwhich are both available from the Afrobarometer - although for a limited number of cells/years- not only to validate results based on aggregate data but also to disentangle and quantify thedifferent mechanisms of impact.
4.1. Aggregate outcomes: OLS
In this section we start by modeling the occurrence of protests in a cell as a function of aggre-gate economic conditions and mobile phone availability. We also allow for the effect of changesin economic conditions to vary as a function of mobile phone coverage. With this latter termwe intend to capture the potential complementarity between economic downturns and mobilephones in protest provision. While it seems unlikely that mobile phones will affect mass mo-bilization during good economic times, it seems plausible that their effect will manifest - ifanything - when reasons for grievance emerge.
12
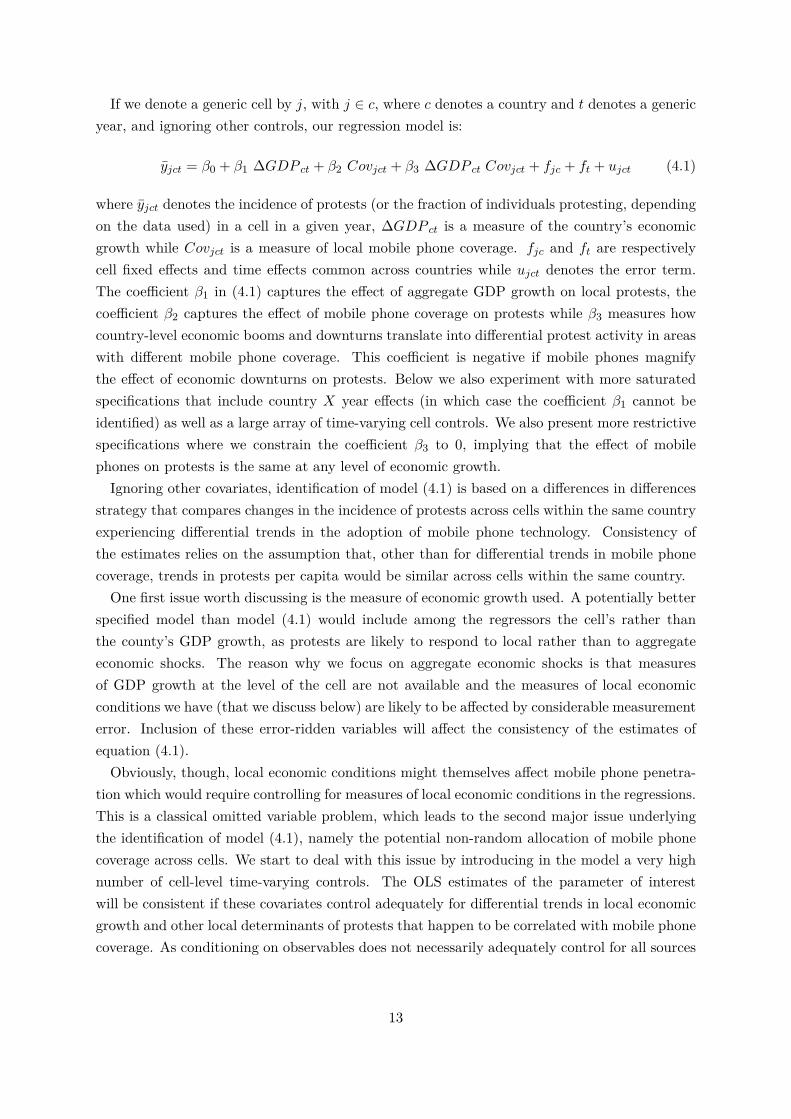
If we denote a generic cell by j, with j ∈ c, where c denotes a country and t denotes a genericyear, and ignoring other controls, our regression model is:
yjct = β0 + β1 ∆GDP ct + β2 Covjct + β3 ∆GDP ct Covjct + fjc + ft + ujct (4.1)
where yjct denotes the incidence of protests (or the fraction of individuals protesting, dependingon the data used) in a cell in a given year, ∆GDP ct is a measure of the country’s economicgrowth while Covjct is a measure of local mobile phone coverage. fjc and ft are respectivelycell fixed effects and time effects common across countries while ujct denotes the error term.The coefficient β1 in (4.1) captures the effect of aggregate GDP growth on local protests, thecoefficient β2 captures the effect of mobile phone coverage on protests while β3 measures howcountry-level economic booms and downturns translate into differential protest activity in areaswith different mobile phone coverage. This coefficient is negative if mobile phones magnifythe effect of economic downturns on protests. Below we also experiment with more saturatedspecifications that include country X year effects (in which case the coefficient β1 cannot beidentified) as well as a large array of time-varying cell controls. We also present more restrictivespecifications where we constrain the coefficient β3 to 0, implying that the effect of mobilephones on protests is the same at any level of economic growth.Ignoring other covariates, identification of model (4.1) is based on a differences in differences
strategy that compares changes in the incidence of protests across cells within the same countryexperiencing differential trends in the adoption of mobile phone technology. Consistency ofthe estimates relies on the assumption that, other than for differential trends in mobile phonecoverage, trends in protests per capita would be similar across cells within the same country.One first issue worth discussing is the measure of economic growth used. A potentially better
specified model than model (4.1) would include among the regressors the cell’s rather thanthe county’s GDP growth, as protests are likely to respond to local rather than to aggregateeconomic shocks. The reason why we focus on aggregate economic shocks is that measuresof GDP growth at the level of the cell are not available and the measures of local economicconditions we have (that we discuss below) are likely to be affected by considerable measurementerror. Inclusion of these error-ridden variables will affect the consistency of the estimates ofequation (4.1).Obviously, though, local economic conditions might themselves affect mobile phone penetra-
tion which would require controlling for measures of local economic conditions in the regressions.This is a classical omitted variable problem, which leads to the second major issue underlyingthe identification of model (4.1), namely the potential non-random allocation of mobile phonecoverage across cells. We start to deal with this issue by introducing in the model a very highnumber of cell-level time-varying controls. The OLS estimates of the parameter of interestwill be consistent if these covariates control adequately for differential trends in local economicgrowth and other local determinants of protests that happen to be correlated with mobile phonecoverage. As conditioning on observables does not necessarily adequately control for all sources
13
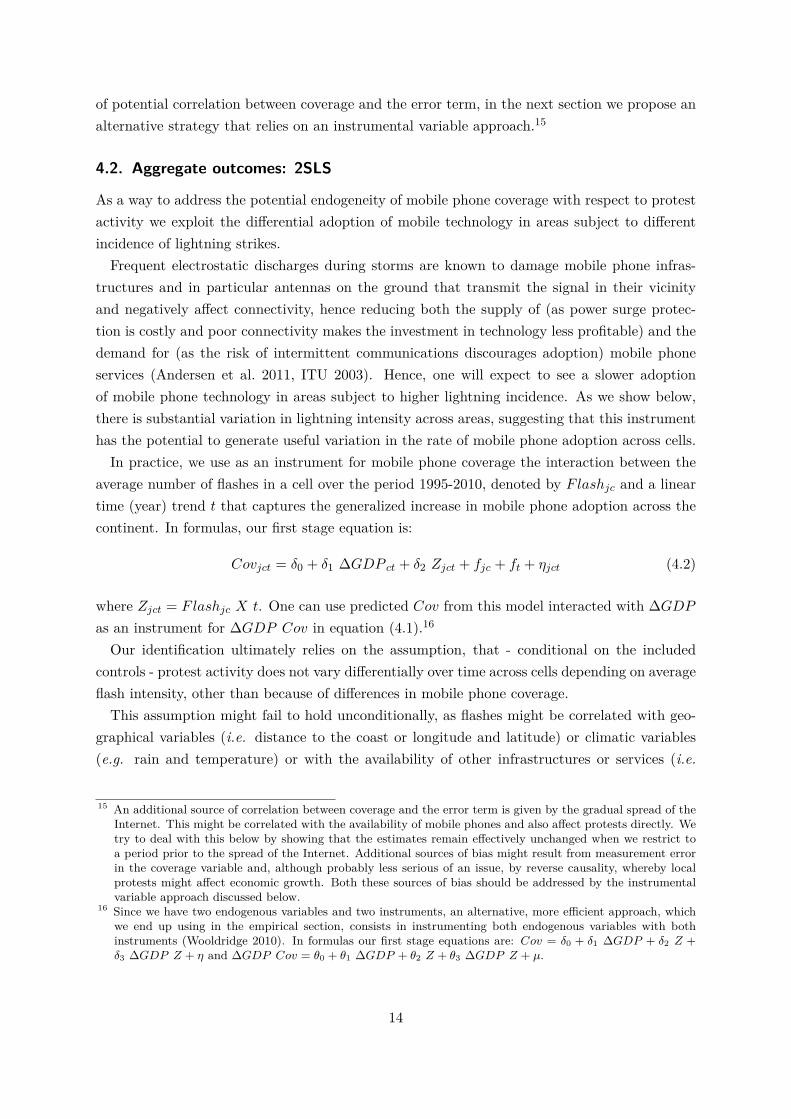
of potential correlation between coverage and the error term, in the next section we propose analternative strategy that relies on an instrumental variable approach.15
4.2. Aggregate outcomes: 2SLS
As a way to address the potential endogeneity of mobile phone coverage with respect to protestactivity we exploit the differential adoption of mobile technology in areas subject to differentincidence of lightning strikes.Frequent electrostatic discharges during storms are known to damage mobile phone infras-
tructures and in particular antennas on the ground that transmit the signal in their vicinityand negatively affect connectivity, hence reducing both the supply of (as power surge protec-tion is costly and poor connectivity makes the investment in technology less profitable) and thedemand for (as the risk of intermittent communications discourages adoption) mobile phoneservices (Andersen et al. 2011, ITU 2003). Hence, one will expect to see a slower adoptionof mobile phone technology in areas subject to higher lightning incidence. As we show below,there is substantial variation in lightning intensity across areas, suggesting that this instrumenthas the potential to generate useful variation in the rate of mobile phone adoption across cells.In practice, we use as an instrument for mobile phone coverage the interaction between the
average number of flashes in a cell over the period 1995-2010, denoted by Flashjc and a lineartime (year) trend t that captures the generalized increase in mobile phone adoption across thecontinent. In formulas, our first stage equation is:
Covjct = δ0 + δ1 ∆GDP ct + δ2 Zjct + fjc + ft + ηjct (4.2)
where Zjct = Flashjc X t. One can use predicted Cov from this model interacted with ∆GDPas an instrument for ∆GDP Cov in equation (4.1).16
Our identification ultimately relies on the assumption, that - conditional on the includedcontrols - protest activity does not vary differentially over time across cells depending on averageflash intensity, other than because of differences in mobile phone coverage.This assumption might fail to hold unconditionally, as flashes might be correlated with geo-
graphical variables (i.e. distance to the coast or longitude and latitude) or climatic variables(e.g. rain and temperature) or with the availability of other infrastructures or services (i.e.
15 An additional source of correlation between coverage and the error term is given by the gradual spread of theInternet. This might be correlated with the availability of mobile phones and also affect protests directly. Wetry to deal with this below by showing that the estimates remain effectively unchanged when we restrict toa period prior to the spread of the Internet. Additional sources of bias might result from measurement errorin the coverage variable and, although probably less serious of an issue, by reverse causality, whereby localprotests might affect economic growth. Both these sources of bias should be addressed by the instrumentalvariable approach discussed below.
16 Since we have two endogenous variables and two instruments, an alternative, more efficient approach, whichwe end up using in the empirical section, consists in instrumenting both endogenous variables with bothinstruments (Wooldridge 2010). In formulas our first stage equations are: Cov = δ0 + δ1 ∆GDP + δ2 Z +δ3 ∆GDP Z + η and ∆GDP Cov = θ0 + θ1 ∆GDP + θ2 Z + θ3 ∆GDP Z + µ.
14

electricity) that are known to matter for economic development and that might have an inde-pendent effect on protests. As said, we temper these concerns by including a large number ofcell-level controls (e.g., rain and temperature, electricity grid, distance to the coast, latitudeand longitude etc.). More importantly, later on in the paper we bring direct evidence in favorof our identification assumption using data on protests for a period previous to the availabilityof mobile phone technology. If lightning strikes and their interaction with GDP growth affectprotests only through their effect on mobile phone coverage, then one will expect no correlationbetween the outcome variable and these variables in periods in which mobile phone technologywas not available. We use data from the early 1990s to test this hypothesis.As an additional check, we also present regressions of measures of local economic develop-
ment on the instrument. For the exclusion restriction to hold, one will expect local economicconditions to be unaffected by the instrument and its interaction with GDP growth.
4.3. A micro-founded model: mechanisms of impact
In this section we introduce a micro-founded model of protest participation that is consistentwith the aggregate model in section 4.1. Compared to the aggregate model, the advantageof this model is that it allows us to specify and empirically identify the behavioral channelsthrough which mobile phones affect protest participation.The theoretical model is described in detail in Appendix B. In the model, the private cost
of participation in a protest falls when the economy deteriorates, and the individual utilityfrom participation increases with the fraction of connected individuals participating. Individ-uals make educated guesses about the probability of participation of their connections giventhe degree of connectedness in society, which is publicly known. The best guess estimate ofthe probability of participation of each individual’s connections is the same for all individu-als, irrespective of their degree of connectedness, and this also turns out to be the fractionof individuals participating in equilibrium. Worse economic conditions increase participationthrough two channels. First, they increase everybody’s willingness to participate, a mechanicalor purely compositional effect that we attribute to individuals’ information about the stateof the economy; second, via a spillover effect that results from strategic complementarities inprotest provision, an effect that we attribute to coordination among individuals.We argue that mobile phones have the potential to affect both margins of response, namely
make individuals more responsive to variations in economic conditions - an effect that we labelenhanced information - and to changes in others’ willingness to participate - an effect that welabel enhanced coordination.The micro-founded empirical model of behavior that underlies model (4.1), postulates in
particular that individual i’s protest participation yijct will depend on the state of the economy∆GDPct and on the average protest participation in the economy yjct. Mobile phone use(denoted by di) can potentially affect both the intercept and the slope coefficients. In formulas:
15
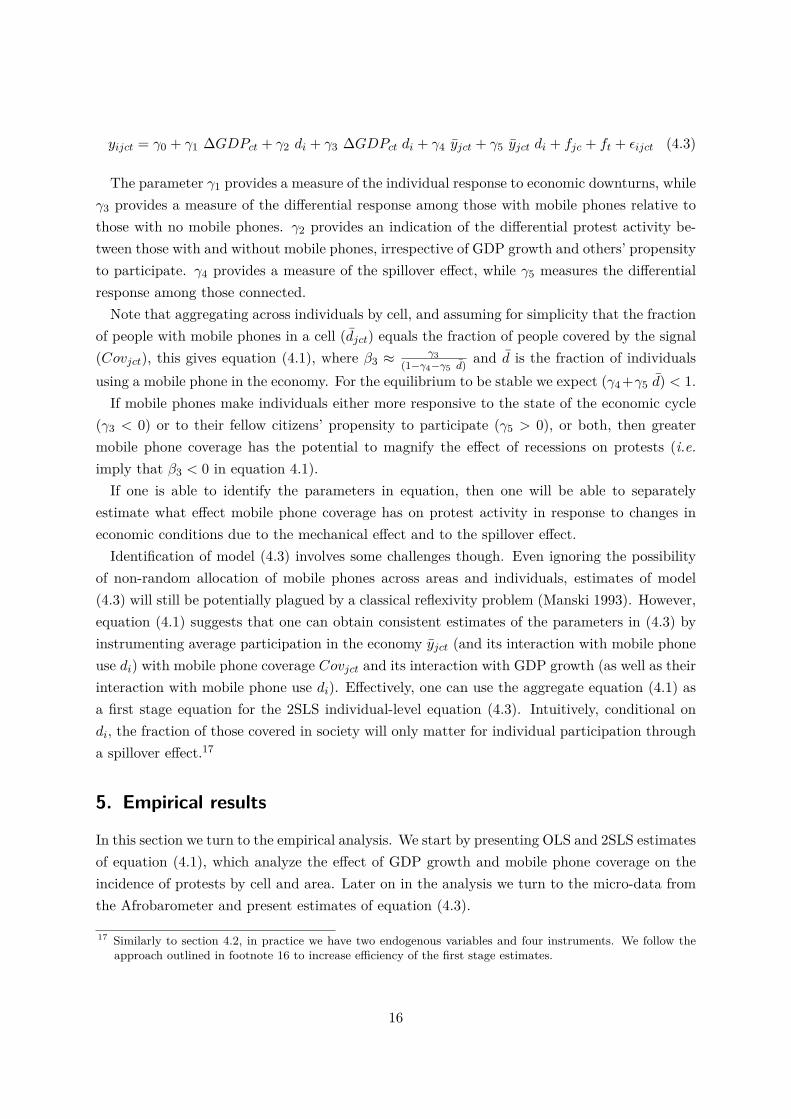
yijct = γ0 + γ1 ∆GDPct + γ2 di + γ3 ∆GDPct di + γ4 yjct + γ5 yjct di + fjc + ft + εijct (4.3)
The parameter γ1 provides a measure of the individual response to economic downturns, whileγ3 provides a measure of the differential response among those with mobile phones relative tothose with no mobile phones. γ2 provides an indication of the differential protest activity be-tween those with and without mobile phones, irrespective of GDP growth and others’ propensityto participate. γ4 provides a measure of the spillover effect, while γ5 measures the differentialresponse among those connected.Note that aggregating across individuals by cell, and assuming for simplicity that the fraction
of people with mobile phones in a cell (djct) equals the fraction of people covered by the signal(Covjct), this gives equation (4.1), where β3 ≈ γ3
(1−γ4−γ5 d) and d is the fraction of individualsusing a mobile phone in the economy. For the equilibrium to be stable we expect (γ4 +γ5 d) < 1.If mobile phones make individuals either more responsive to the state of the economic cycle
(γ3 < 0) or to their fellow citizens’ propensity to participate (γ5 > 0), or both, then greatermobile phone coverage has the potential to magnify the effect of recessions on protests (i.e.imply that β3 < 0 in equation 4.1).If one is able to identify the parameters in equation, then one will be able to separately
estimate what effect mobile phone coverage has on protest activity in response to changes ineconomic conditions due to the mechanical effect and to the spillover effect.Identification of model (4.3) involves some challenges though. Even ignoring the possibility
of non-random allocation of mobile phones across areas and individuals, estimates of model(4.3) will still be potentially plagued by a classical reflexivity problem (Manski 1993). However,equation (4.1) suggests that one can obtain consistent estimates of the parameters in (4.3) byinstrumenting average participation in the economy yjct (and its interaction with mobile phoneuse di) with mobile phone coverage Covjct and its interaction with GDP growth (as well as theirinteraction with mobile phone use di). Effectively, one can use the aggregate equation (4.1) asa first stage equation for the 2SLS individual-level equation (4.3). Intuitively, conditional ondi, the fraction of those covered in society will only matter for individual participation througha spillover effect.17
5. Empirical results
In this section we turn to the empirical analysis. We start by presenting OLS and 2SLS estimatesof equation (4.1), which analyze the effect of GDP growth and mobile phone coverage on theincidence of protests by cell and area. Later on in the analysis we turn to the micro-data fromthe Afrobarometer and present estimates of equation (4.3).
17 Similarly to section 4.2, in practice we have two endogenous variables and four instruments. We follow theapproach outlined in footnote 16 to increase efficiency of the first stage estimates.
16
5.1. Aggregate outcomes: OLS
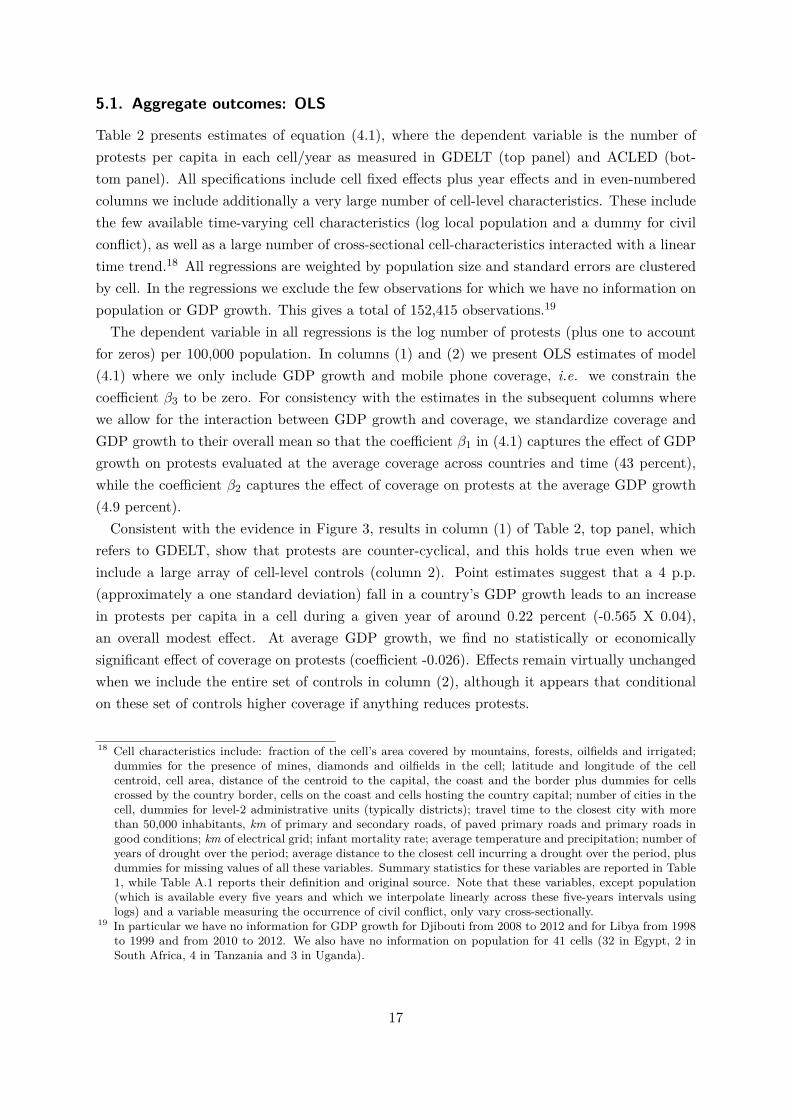
Table 2 presents estimates of equation (4.1), where the dependent variable is the number ofprotests per capita in each cell/year as measured in GDELT (top panel) and ACLED (bot-tom panel). All specifications include cell fixed effects plus year effects and in even-numberedcolumns we include additionally a very large number of cell-level characteristics. These includethe few available time-varying cell characteristics (log local population and a dummy for civilconflict), as well as a large number of cross-sectional cell-characteristics interacted with a lineartime trend.18 All regressions are weighted by population size and standard errors are clusteredby cell. In the regressions we exclude the few observations for which we have no information onpopulation or GDP growth. This gives a total of 152,415 observations.19
The dependent variable in all regressions is the log number of protests (plus one to accountfor zeros) per 100,000 population. In columns (1) and (2) we present OLS estimates of model(4.1) where we only include GDP growth and mobile phone coverage, i.e. we constrain thecoefficient β3 to be zero. For consistency with the estimates in the subsequent columns wherewe allow for the interaction between GDP growth and coverage, we standardize coverage andGDP growth to their overall mean so that the coefficient β1 in (4.1) captures the effect of GDPgrowth on protests evaluated at the average coverage across countries and time (43 percent),while the coefficient β2 captures the effect of coverage on protests at the average GDP growth(4.9 percent).Consistent with the evidence in Figure 3, results in column (1) of Table 2, top panel, which
refers to GDELT, show that protests are counter-cyclical, and this holds true even when weinclude a large array of cell-level controls (column 2). Point estimates suggest that a 4 p.p.(approximately a one standard deviation) fall in a country’s GDP growth leads to an increasein protests per capita in a cell during a given year of around 0.22 percent (-0.565 X 0.04),an overall modest effect. At average GDP growth, we find no statistically or economicallysignificant effect of coverage on protests (coefficient -0.026). Effects remain virtually unchangedwhen we include the entire set of controls in column (2), although it appears that conditionalon these set of controls higher coverage if anything reduces protests.
18 Cell characteristics include: fraction of the cell’s area covered by mountains, forests, oilfields and irrigated;dummies for the presence of mines, diamonds and oilfields in the cell; latitude and longitude of the cellcentroid, cell area, distance of the centroid to the capital, the coast and the border plus dummies for cellscrossed by the country border, cells on the coast and cells hosting the country capital; number of cities in thecell, dummies for level-2 administrative units (typically districts); travel time to the closest city with morethan 50,000 inhabitants, km of primary and secondary roads, of paved primary roads and primary roads ingood conditions; km of electrical grid; infant mortality rate; average temperature and precipitation; number ofyears of drought over the period; average distance to the closest cell incurring a drought over the period, plusdummies for missing values of all these variables. Summary statistics for these variables are reported in Table1, while Table A.1 reports their definition and original source. Note that these variables, except population(which is available every five years and which we interpolate linearly across these five-years intervals usinglogs) and a variable measuring the occurrence of civil conflict, only vary cross-sectionally.
19 In particular we have no information for GDP growth for Djibouti from 2008 to 2012 and for Libya from 1998to 1999 and from 2010 to 2012. We also have no information on population for 41 cells (32 in Egypt, 2 inSouth Africa, 4 in Tanzania and 3 in Uganda).
17

In column (3) of Table 2 we additionally control for the interaction between mobile phonecoverage and GDP growth. Once more, estimates show that at average coverage protests arecounter-cyclical (coefficient -1.016). At average coverage, a 4 percent increase in GDP growthleads to a reduction in protests of around 4 percent. At average GDP growth, higher coveragedoes not appear to affect protests (coefficient -0.011 not statistically significant at conventionallevels). Differences in protest activity between areas with different rates of coverage, though,increase during recessions. A one s.d. fall in GDP growth is associated for example to anincrease in the protest activity differential between areas with full and with no coverage on theorder of 10 percent (-2.380 X 0.04). Results are once more virtually unaffected by the inclusionof additional controls (column 4).In columns (5) to (8) of Table 2 we focus on specifications with the inclusion of country X
year effects. Although this comes at the cost of us not being able to identify the coefficient onGDP growth β1 in (4.1), this specification allows us to compare changes in areas with differentbaseline characteristics within the same country allowing for unrestricted time varying countrydeterminants in the incidence of protests. Results are very similar to those in columns (1) to(4). We find no effect of coverage on protests on average although we still find clear evidenceof coverage magnifying the effect of recessions on protests. Estimates on the interaction termimply that a one s.d. fall in a country’s GDP growth leads to an increase in protests per capitabetween covered and uncovered areas of around 7.5 p.p. (-1.873 X 0.04).Estimates based on ACLED are reported in the bottom panel of Table 2. Patterns of estimates
are very similar to those found in GDELT. If one focuses on the most saturated specificationsin columns (4) and (8), results show once more that protests are counter-cyclical (coefficient onGDP growth -0.191 in column 4) and that the coefficient on the interaction term between GDPgrowth and coverage is negative (-0.566 in column 4 and -0.393 in column 8), implying that a4 p.p. fall in GDP growth is associated to an increase in the differential in the yearly incidenceof protests between an area with full coverage and an area without coverage of between 1.6and 2.2 percent, around one fifth of the effect found in GDELT. Similarly to GDELT, once wecondition on country X year fixed effects (column 8) we find no statistically significant effect ofcoverage on protests (coefficient -0.001, insignificant at conventional levels).In sum, although point estimates based on ACLED are typically smaller in magnitude than
those found based on GDELT, as well as typically less precise - which is reasonable giventhe much smaller number of observations - remarkably results based on the two datasets arequalitatively similar. In both cases we conclude that while greater coverage on average doesnot lead to greater protest incidence, this magnifies the positive effect of recessions on protestoccurrence, with an effect that is both statistically and economically significant.
5.2. Aggregate outcomes: 2SLS
In order to deal with the potential endogeneity of coverage with respect to protests, in thissection we turn to the 2SLS estimates which exploit the differential trends in mobile phone
18
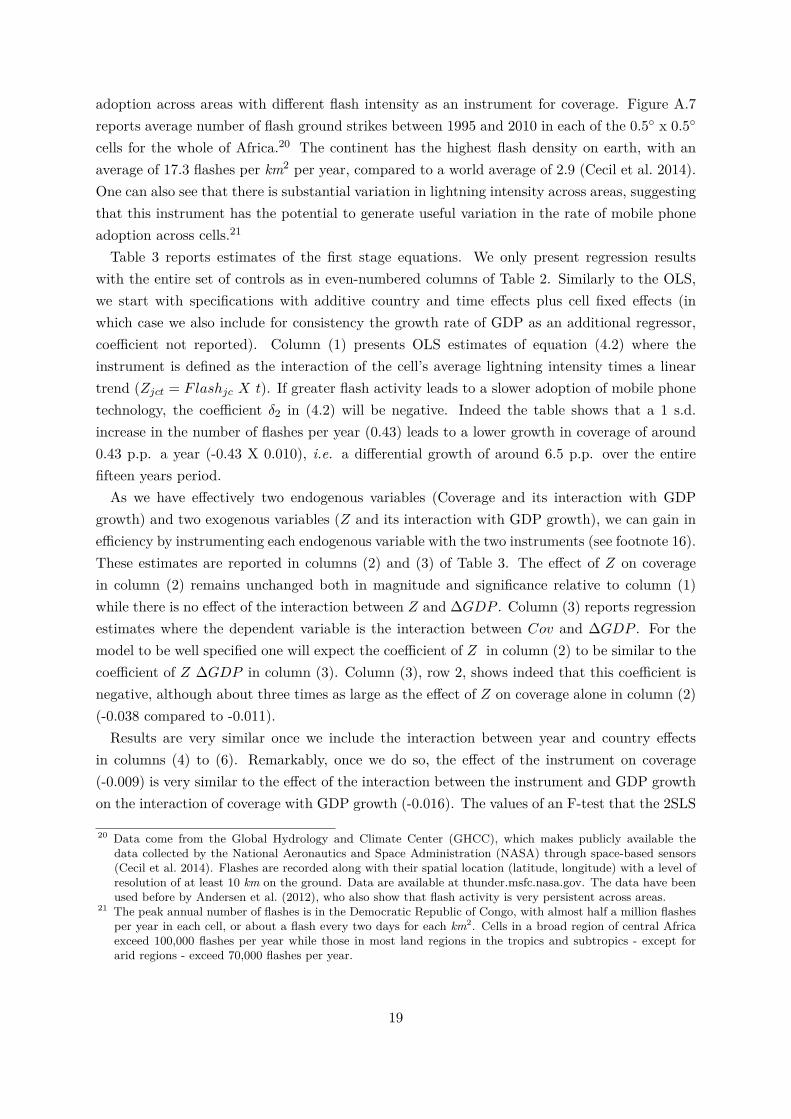
adoption across areas with different flash intensity as an instrument for coverage. Figure A.7reports average number of flash ground strikes between 1995 and 2010 in each of the 0.5 x 0.5
cells for the whole of Africa.20 The continent has the highest flash density on earth, with anaverage of 17.3 flashes per km2 per year, compared to a world average of 2.9 (Cecil et al. 2014).One can also see that there is substantial variation in lightning intensity across areas, suggestingthat this instrument has the potential to generate useful variation in the rate of mobile phoneadoption across cells.21
Table 3 reports estimates of the first stage equations. We only present regression resultswith the entire set of controls as in even-numbered columns of Table 2. Similarly to the OLS,we start with specifications with additive country and time effects plus cell fixed effects (inwhich case we also include for consistency the growth rate of GDP as an additional regressor,coefficient not reported). Column (1) presents OLS estimates of equation (4.2) where theinstrument is defined as the interaction of the cell’s average lightning intensity times a lineartrend (Zjct = Flashjc X t). If greater flash activity leads to a slower adoption of mobile phonetechnology, the coefficient δ2 in (4.2) will be negative. Indeed the table shows that a 1 s.d.increase in the number of flashes per year (0.43) leads to a lower growth in coverage of around0.43 p.p. a year (-0.43 X 0.010), i.e. a differential growth of around 6.5 p.p. over the entirefifteen years period.As we have effectively two endogenous variables (Coverage and its interaction with GDP
growth) and two exogenous variables (Z and its interaction with GDP growth), we can gain inefficiency by instrumenting each endogenous variable with the two instruments (see footnote 16).These estimates are reported in columns (2) and (3) of Table 3. The effect of Z on coveragein column (2) remains unchanged both in magnitude and significance relative to column (1)while there is no effect of the interaction between Z and ∆GDP . Column (3) reports regressionestimates where the dependent variable is the interaction between Cov and ∆GDP . For themodel to be well specified one will expect the coefficient of Z in column (2) to be similar to thecoefficient of Z ∆GDP in column (3). Column (3), row 2, shows indeed that this coefficient isnegative, although about three times as large as the effect of Z on coverage alone in column (2)(-0.038 compared to -0.011).Results are very similar once we include the interaction between year and country effects
in columns (4) to (6). Remarkably, once we do so, the effect of the instrument on coverage(-0.009) is very similar to the effect of the interaction between the instrument and GDP growthon the interaction of coverage with GDP growth (-0.016). The values of an F-test that the 2SLS
20 Data come from the Global Hydrology and Climate Center (GHCC), which makes publicly available thedata collected by the National Aeronautics and Space Administration (NASA) through space-based sensors(Cecil et al. 2014). Flashes are recorded along with their spatial location (latitude, longitude) with a level ofresolution of at least 10 km on the ground. Data are available at thunder.msfc.nasa.gov. The data have beenused before by Andersen et al. (2012), who also show that flash activity is very persistent across areas.
21 The peak annual number of flashes is in the Democratic Republic of Congo, with almost half a million flashesper year in each cell, or about a flash every two days for each km2. Cells in a broad region of central Africaexceed 100,000 flashes per year while those in most land regions in the tropics and subtropics - except forarid regions - exceed 70,000 flashes per year.
19
estimates are biased towards the OLS due to a weak instruments problem are reported at thebottom of the table and one can see that the null is systematically rejected.22
Before presenting the 2SLS estimates and in order to add transparency to the identificationstrategy, in the following we present graphical evidence on the raw correlation between protestsand the instrument, i.e. on the reduced-form equation:
yjct = ρ0 + ρ1 ∆GDP ct + ρ2 Zjct + ρ3 ∆GDP ct Zjct + fjc + ft + ζjct (5.1)
where ρk = βkδ2, k = 2, 3.For protests to respond negatively to the state of the economic cycle when coverage increases
(β3 < 0 in equation 4.1) and given that coverage varies negatively with the instrument (δ2 < 0in equation 4.2) one will expect the protests differential between areas with high and low flashintensity (hence with low and high coverage) to be positively correlated with GDP growth (i.e.ρ3 > 0).23 Figure A.4 reports the within-country change in the differential in log protests(measured in GDELT) between high (in the top quartile of the continent distribution) and low(in the bottom quartile) flash intensity areas in each year, alongside average growth in GDP.24
Indeed, one can notice a very strong positive correlation between the two series: in particular,the temporary increase in GDP growth in the mid 2000s is associated to a sizeable temporaryincrease in the protest differential between high and low flash intensity areas.25
We now turn to the 2SLS estimates in Table 4. The first four columns of Table 4 refer toGDELT while the subsequent four columns refer to ACLED and in odd- and even- numberedcolumns we present respectively results without and with the inclusion of country X year effects.As for the first stage, we only report results with the entire set of controls. Results are qualita-tively very similar to the OLS. We still find that, on average, protests are counter-cyclical, witha one s.d. fall in GDP growth (4 p.p.) leading to between 0.4 (-0.093 X 0.04) and 1.8 percent(-0.442 X 0.04) more protests per capita, depending on the dataset used, and that the effect ismagnified by the availability of mobile phones. Point estimates suggest that a one s.d. fall inGDP growth leads to an increase in the per capita protest differential between areas with fulland with no coverage of between 7 (-1.425 X 0.04) and 25 percent (-6.264 X 0.04), with theestimates being larger in GDELT compared to ACLED. Across both datasets, we find no effectof coverage on protests at average GDP growth. Results in even-numbered columns where we
22 We report the value of the Angrist-Pischke test for the case of multiple endogenous variables (Angrist &Pischke 2008).
23 Note that ρ2 = 0, since, as shown below, the 2SLS estimates of β2 are close to zero. For this reason we donot investigate the correlation between protest differentials and Z per se.
24 These are weighted averages across countries with weights equal to the country’s population. Note that GDPgrowth in this figure is slightly different from what reported in Figure 3 that refers to all countries in thesample, rather than only to those with sufficient within-country variation in flash intensity.
25 A regression coefficient of the protest differential on GDP growth with weights equal to population delivers acoefficient of 2.518, (s.e. 1.056, significant at 10 percent level). More subtly, as the coefficient ρ3 captures theinteraction between flashes, a linear trend and GDP growth, one will expect this correlation to change overtime and in particular to show an upward trend. Indeed three separate regressions by sub-periods (1998-2002,2003-2007, 2008-2012) deliver the following three coefficients: -1.367 (s.e. 4.535), 3.927 (s.e. 4.198) and 4.711(s.e. 7.414). Although not individually significant these coefficients follow precisely the expected pattern.
20
include the interaction of country X year effects are virtually unchanged.26
The bottom row of Table 4 reports the p-value for an endogeneity test for coverage andits interaction with GDP growth. We are able to reject the hypothesis that coverage andits interaction with GDP growth are simultaneously exogenous to the dependent variable inGDELT (p-value 0.055), but we cannot reject exogeneity based on ACLED data (p-value 0.223)Although first stage estimates and the evidence in Figure A.4 show that the rank condition
is satisfied, clearly this is not informative about the validity of the exclusion restriction. Asdiscussed above, for this restriction to hold, one will expect, conditional on the included controls,the effect of the instrument and its interaction with GDP growth on protests to act only throughthe availability of mobile phone technology. As said, for the exclusion restriction to hold, onewould expect the coefficient ρ3, i.e. the protest differential between high and low flash intensityareas to be equal to zero in a period when there was no mobile phone technology. We test forthis using data on protests from GDELT since 1990, i.e. before the spread of mobile phonetechnology in Africa (note instead that ACLED data are only available starting in 1997).Figure 5, top panel reports average mobile phone coverage across the continent between 1990
and 2012.27 Coverage is zero in 1990 and it grows starting from 1996. Growth after that isbasically linear, with a slight slowdown starting in the mid 2000s. The bottom panel of Figure5 presents OLS estimates of ρ3 in (5.1), separately by sub-periods, using the most saturatedspecification as in column (8) of Table 2, i.e. with the inclusion of cell fixed effects, countryX year effects and cell-level time-varying controls. One can see that there is no effect of theinstrument interacted with GDP growth on protests in the early period, i.e. up to effectivelythe late 1990s. Point estimates are small and not statistically significant at conventional levels.Positive effects tend to manifest since the early 2000s, when coverage starts to increase, andsimilar to the spread of coverage these effects follow an upward trend, with the gradient oncemore flattening towards the end of the period.28,29
As an additional check for the exogeneity of the instrument we present OLS estimates of thereduced-form equation (5.1) and 2SLS estimates of equation (4.1) where now the dependentvariable is a measure of local economic development. For this, we use light density measured bysatellites at night, a widely used measure in the literature (Henderson et al. 2012, Michalopou-
26 Results are also very similar if we use flash density per km2 as instrument, although F-stats are marginallylower. We also use the interaction of the continent-wide trend in coverage (as opposed to a parametric lineartrend) with flash rates (flashes per km2) finding overall very similar results.
27 To obtain this series we have used information on coverage from GSMA (available since 1998). We also exploitthe circumstance the 2G technology was not introduced in Africa until 1995 and for each cell we derive apredicted measure of coverage by linear interpolation between 1995 and 1998. The series plots the populationweighted average coverage across the continent in each year.
28 In Figure A.8 we also report the reduced-form coefficient of protests on the instrument ρ2. We do not findany evidence of the instrument affecting directly protests per capita throughout the period, consistent withthe 2SLS estimates of coefficient β2 in equation (4.1) not being different from zero.
29 Note that in these regressions we allow the coefficients on the interaction between the cross-sectional charac-teristics and the linear time trend to vary between the pre-1998 and post-1998 period. We do so to make surethat this specification is consistent with the reduced-form specification associated to our main estimates forthe 1998-2012 period.
21
los & Papaioannou 2012), which has been shown to proxy well for local economic activity.30
Importantly we find that local economic activity seems not to vary with the instrument andits interaction with GDP growth (see Table A.4). Consistent with this, we find that the 2SLSestimates for nightlights are not statistically significant. These result suggest that the effect offlash rates on the speed of mobile phone adoption across areas is not attributable to differen-tial patterns of local economic growth, lending further credibility to the exclusion restrictionunderlying the consistency of the 2SLS estimates.We have also performed a number of robustness checks on equation (4.1). 2SLS estimates
from these alternative regressions using the entire set of controls as in columns (4) and (8) ofTable 4 are reported in Table A.5 and we briefly discuss them here. In particular, we haveclustered standard errors at the country rather than the cell level: this should take into accountany spatial correlation in the error term across cells within a country (column 1). We havealso attempted to control more flexibly for unobserved determinants of protests that might becorrelated with the instrument by interacting all cell-level cross-sectional characteristics withcountry-specific (as opposed to continent-wide) linear trends (column 2). As said, one concernis that GDELT might fail to successfully de-duplicate protests in the data when reported indifferent articles or outlets, hence increasing the rate of false positives. We address this issueby constructing an alternative measure of protests, i.e. a variable that takes a value one if atleast one protest event is recorded in a certain location in a certain day, treating events in thesame location but classified as different in the data as a single event (column 3). Finally wehave run regressions where instead of using the logarithm of protests per capita plus a constant(one) in order to account for zeros, we use the square root of protests per capita (column 4).We do so because of the concern that our results in Table 4 are sensitive to the value of theconstant used. Clearly point estimates from these last regressions need not to be the same asthose from our main regressions, although their sign has to be the same.31 All these checksmake no substantial difference to our results.As an additional check, we also report results where we interact coverage with a dummy for
positive GDP growth rather than a continuous linear function of GDP growth. We do so toinvestigate more directly whether effects are different during booms and recessions. Estimatesin column (5) show that greater coverage tends to lead to greater protests during recessions (i.e.for negative economic growth, coefficient 1.178, significant at 5 percent level). The differentialeffect in periods of positive growth is almost identical but of the opposite sign, meaning thatgreater coverage does not affect the incidence of protests other than in periods of recessions.In Table A.6 we have investigated whether our 2SLS results are driven by specific samples
or periods.32 Estimates of the coefficient on the interaction term β3 are consistently negative
30 Following Lowe (2014) and Henderson et al. (2012), we calculate the mean luminosity for each cell/yearexcluding cells with persistent lighting due to gas flares. Results are similar if these observations are notremoved from the sample.
31 Note in fact that dY 0.5
dX≈ 1
2Y0.5 dlnY
dX.
32 In order to obtain more precise 2SLS estimates, we constrain the first stage estimates to be the ones from thepooled sample in Table 3. We compute standard errors manually, in the spirit of a split-sample IV technique
22
across samples, although not always individually significant. In most cases, it also appears hardto reject the hypothesis that the coefficients are the same across subsamples. If anything, itappears that the effects are larger in large relative to small cities and in Sub-Saharan Africacompared to northern Africa. We also restrict to the pre-2011 period out of a concern that ourresults are driven by the Arab spring, something for which we find no evidence (see columns 5and 6). We also do not find evidence that our results are driven by either the availability of theInternet, or of 3G technology (columns 7 to 10).33 It appears, however, that effects are largerunder autocratic regimes and in particular when the media are captured (columns 11 to 14).34
In sum, we have exploited the differential penetration of mobile phone coverage across areaswith different flash intensity to identify the causal effect of mobile phones on protests. A numberof tests lend strong support to our hypothesis that the instrument is excludable. 2SLS estimatesof model (4.1) confirm that at average growth, mobile phones have no independent effect onprotests, although they tend to amplify the positive effect of recessions on the incidence ofprotests. Although 2SLS estimates are larger in absolute value compared to the OLS estimates,we also show that, once we control for a very large number of cell-level characteristics, it is hardto tell these estimates apart, at least in ACLED.
5.3. Individual participation in protests: channels of impact
In this section we turn to individual data from the Afrobarometer to further investigate theeffect of coverage and its interaction with GDP growth on participation in protests. Micro-data from the Afrobarometer have two major advantages. First, they allow us to validateresults from GDELT and ACLED, and in particular to rule out that these results are drivenby systematic reporting error. Second and more important they allow us to investigate thepotential mechanisms of impact.In addition to information on individual participation in protests, Afrobarometer data also
provide information on individual mobile phone use. This variable though is only available forround 5 of the survey. We use this piece of information and a regression model to predict, foreach individual in the sample, the probability of using a mobile phone at least once a day asa function of individual characteristics and a measure of cell-level coverage from GSMA. Theexact procedure is discussed in Appendix A.In the rest of this section we ignore the non-random allocation of coverage across areas,
i.e. we revert to the OLS estimates in section 4.1. The reason for this is that data from the
(Angrist & Krueger 1995). In particular estimates of the variance covariance matrix of the 2SLS estimates canbe obtained using the following formula: (Z′Ω−1X)−1(
∑cZcΩ−1
c ûcû′cΩ−1c Z′c)(X ′Ω−1Z)−1, where Z denotes
the matrix of the instruments (including a constant), X the matrix of the endogenous variables (also includinga constant), Ω is the matrix of weights and û are the 2SLS residuals. Variables denoted by the subscript crefer to sub-matrices and sub-vectors for each cell c.
33 Internet availability is defined for penetration greater or equal to 3 percent of the population, based on datafrom the World Development Indicators. 3G mobile phone technology is calculated for each cell, based onGMSA data.
34 Autocracy is defined for a score of the Polity2 indicator less or equal to 0. Media are considered captured iftheir score falls below the world median in the Reporters Without Borders World Press Freedom Index.
23
Afrobarometer only span over a limited number of cells/years and in addition these are con-centrated towards the end of the period, when one can show that the instrument has relativelylittle bite on the endogenous variable. Indeed, first stage estimates of equation (4.2) for thesample of cells/years covered by the Afrobarometer data are systematically insignificant. Weare reassured though by our findings in the previous sections that 2SLS provide - if anything -conservative estimates of the effect of interest and by the observation above (that unsurprisinglyalso holds for the Afrobarometer) that one cannot typically reject exogeneity of coverage andits interaction with GDP with respect to protests.As preliminary evidence, Table 5 reports regressions of a number of dependent variables that
reflect individuals’ knowledge and perception of economic and political conditions. The pointof this table is to shed light on how individuals respond to changes in economic conditionsdepending on access to mobile phones. This paves the way to the subsequent analysis of theeffect of mobile phones on protest activity. All specifications include a dummy for mobilephone ownership and its interaction with GDP growth. Regressions also include cell fixedeffects, country X year fixed effects and all cell-level controls plus an array of individual levelcovariates.35 The dependent variable in column (1) is a dummy for the respondent’s self-reported economic status, as proxied by non-employment. Dependent variables in columns (2)and (3) are, respectively, dummies if the respondent’s self-reported perceptions of his own andthe country’s economic conditions are worse or much worse compared to twelve months before.The dependent variable in column (4) is a dummy if the respondent reports not trusting thecountry’s president while the dependent variable in column (5) is a dummy if the individualdisapproves the actions of the president. As the model includes country X year effects, thecoefficient on GDP growth is not identified and is not reported in the table. Regressions areweighted by sampling weights and standard errors are once more clustered by cell.There are several findings that emerge from Table 5. We focus on the interaction between
GDP growth and mobile phone use. First, there is no evidence that individuals with mobilephones are more vulnerable to economic conditions than those without mobile phones (seecolumns 1 and 2). However they appear to be more likely to report than the economy is doingpoorly when this is in fact happening compared to those with no mobile phones (column 3).Consistent with plenty of evidence from elsewhere in the literature (e.g. Wolfers 2002) thatvoters blame the government for poor economic performance, those with mobile phones are alsomore likely to distrust and disapprove the president when the economy does poorly (columns4 and 5). In sum, Table 5 provides suggestive evidence that mobile phones make individualsmore informed about the state of the economy. It does not seem though that mobile phonesdirectly affect the opportunity cost of participation.With this preliminary evidence at hand, we now turn to the effect of mobile phones on
protests. Table 6, columns (1) and (2), reports OLS estimates of aggregate equation (4.1)based on data from the Afrobarometer. Here the dependent variable is a dummy for protest35 These are: age and age squared, a gender dummy, educational dummies, a dummy for urban residence,
number of adults in the household.
24
participation. We regress this variable on the fraction of individuals using a mobile phone (asopposed to coverage in Table 2) in each cell X year and its interaction with GDP growth.36
We also experiment below with regressions where we use as regressor mobile phone coverage asopposed to the fraction of individuals using a mobile phone (as in Table 2). As in Tables 3 and4 all specifications include cell fixed effects plus country X year effects. Column (2) additionallycontrols for the same cell-level covariates as in even-numbered columns of Tables 3 and 4, aswell as for individual level covariates available in the Afrobarometer. Regressions are weightedby the sum of sampling weights in each cell. Standard errors are again clustered at the levelof the cell.37 Similar to the results in columns (4) and (8) of Table 2, we find that at averageGDP growth self-reported protest participation is not significantly affected by the fraction ofindividuals using a mobile phone in society although, the larger this fraction, the larger theeffect of recessions on protests. Point estimates in row 2 suggest that a one s.d. fall in GDPgrowth is associated to an increase of around 4 p.p. in the protest differential between areas withfull and zero coverage (-0.931 X 0.04). At a baseline protest participation of around 12 p.p. thisis equivalent to an increase or around 33 percent. This is a sizeable effect, not much differentfrom the effect found on GDELT and ACLED for the same sample, or on Afrobarometer whenusing coverage instead of fraction of people using a mobile phone (see Table A.8). Importantlyresults form the Afrobarometer are qualitatively in line with those from GDELT and ACLED,suggesting that systematic misreporting is not driving our estimates in section 5.1.With this evidence in mind we finally turn to the individual determinants of protest par-
ticipation. Columns (3) and (4) of Table 6 report estimates of a regression of a dummy forindividual protest participation on a dummy for mobile phone use, the fraction of individualsin society using a mobile phone, GDP growth and the interaction of these last two variableswith the dummy for mobile phone use. This is equation (4.3) in the text. As explained, we usean instrumental variable approach in order to obtain consistent estimates of the model. Firststage estimates, which are very similar to those reported in columns 1 and 2 of Table 6, arereported in Table A.9. There are several important findings that emerge. First, individualswith mobile phones are marginally less likely to protest conditional on others’ participation andthe state of the economy (γ2 < 0).38 Second, conditional on others’ participation, individualswith mobile phones are more likely to respond to changes in economic conditions than thosewithout mobile phones (γ3 < 0). A one s.d. fall in GDP growth leads to a differential increasein protest participation among those with mobile phone compared to those without of around
36 Note that because the right-hand side variables only vary by cell/year this is equivalent to a weighted regressionwhere the dependent variable is the fraction of individuals participating in a protest (as opposed to log numberof protests in Table 2).
37 It is worth remarking that OLS estimates of model (4.1) based on GDELT and ACLED on the sample ofcells/years available in the Afrobarometer are qualitatively similar to the ones based over the entire sample(compare Tables 2 and A.8). If anything, point estimates of the parameter of interest β3 are, larger in thisrestricted sample than in the entire sample.
38 Note that mobile phones use is obtained as a prediction from an ordered probit model that includes the samevariables as in the model. Identification of this variable is simply based on functional form, so one should becautious in attaching an interpretation to this variable
25

1 p.p. (this is -0.239 X 0.04). This is consistent with evidence in Table 5 that individuals withmobile phones are better informed about the state of the economy and hence more likely toreact to changes in aggregate economic conditions. Third, there is very clear evidence of positivespillovers in the provision of protests (γ4 > 0). We estimate that a 10 p.p. increase in averageprotest participation in society leads to an increase in protest participation among those withno mobile phones on the order of 8 p.p. (0.800 x 0.10). Fourth, there is evidence that those withmobile phones are more responsive to an increase in others’ protest participation than thosewith no mobile phones (γ5 > 0). This seems to suggest that mobile phones are complementaryto others’ participation in the decision to join a protest. We find an additional increase in theprobability of participation among those with mobile phones of around 20 p.p.39 In sum, resultsin Table 6 suggest that both enhanced coordination (γ5 > 0) and enhanced information (γ3 < 0)contribute to explain why mobile phones tend to amplify the effect of economic downturns onprotests.With the estimates of model (4.3) at hand, we can also attempt to quantify the contribution
of these two different mechanisms, Our estimates suggest that between 46 and 79 percent of theoverall effect is ascribable to increased coordination with the residual attributable to increasedinformation. 40
6. Conclusions
In this paper we provide novel systematic evidence on the impact of mobile phone technologyon mass political mobilization. Using detailed geo-referenced data for Africa from three dif-ferent sources on protest incidence and self-reported protest participation we find strong androbust evidence in support of a nuanced and qualified version of the “liberation technology”argument. Mobile phones are indeed instrumental to political mobilization but this happensduring periods of economic downturn, when reasons for grievance emerge or the opportunitycost of participation falls.Using a combination of theory and micro-data we are able shed light on the behavioral
channels behind this empirical result. We show that mobile phones play two roles in fosteringpolitical participation during economic downturns: on the one hand, they appear to makeindividuals more informed about the state of the economy; on the other, they also appear tomake people more responsive to changes in others’ participation, which is key in determiningthe equilibrium level of protests via strategic complementarities. Empirically, we find that botheffects are at play.39 Recall that for the equilibrium to be stable, we expect (γ4 + γ5 d) < 1. As the overall fraction of individuals
using a mobile phone is 0.67, this condition holds in the data.40 See Appendix for details of the calculation. To operationalize this we use estimates of γ3, γ4 and γ5 from
Table 6, columns (3) and (4). We derive estimates of gamma1 from an estimate of equation (B.15) equationwhere we do not include year X country dummies and we also include ∆GDP . Estimates of γ1 vary between-0.130 and -0.052 depending on whether we exclude or we include controls (respectively as in columns 3 and4 of Table 6. The role of enhanced information varies between 46 and 79 percent depending on whether weuse parameter estimates form the model without or with controls.
26
While our results refer largely a period when the only technology available was 2G, theincreasingly ubiquitous availability of 3G and 4G technology and the associated advent of socialmedia - both of which seem to further facilitate coordination among citizens - lead us to believethat the potential for digital ICT to foster mass political movements will - if anything- increase inthe future. This argument squares well with evidence - discussed in the paper - that participationin social movements and mass political mobilization have been globally on the rise, and this hashappened against the backdrop of impending economic slowdown or outright recessions.Results in the paper also indicate that mobile phones seem to be particularly effective in
fostering mobilization in autocratic regimes and where traditional media are captured, suggest-ing that these technologies may play a key role in fostering political freedom. Whether digitalICT can effectively promote democracy and even lead to regime changes remains a first orderquestion and one that is worth investigating but clearly beyond the scope of this paper.
27
References
Acemoglu, D., Hassan, T. A. & Tahoun, A. (2014), ‘The Power of the Street: Evidence fromEgypt’s Arab Spring’, NBER Working Paper (No. 20665).
Acemoglu, D. & Robinson, J. A. (2001), ‘A Theory of Political Transitions’, American EconomicReview 91(4), 938–963.
Acemoglu, D. & Robinson, J. A. (2006), Economic Origins of Dictatorship and Democracy,Cambridge University Press.
Afrobarometer (2011), Afrobarometer Round 5 Survey Manual, http://www.afrobarometer.org.
Ahn, H. & Lee, M.-H. (1999), ‘An Econometric Analysis of the Demand for Access to MobileTelephone Networks’, Information Economics and Policy 11(3), 297–305.
Aker, J. C. (2010), ‘Information from Markets Near and Far: Mobile Phones and AgriculturalMarkets in Niger’, American Economic Journal: Applied Economics 2(3), 46–59.
Aker, J. C., Collier, P. & Vicente, P. C. (2015), ‘Is Information Power? Using Mobile Phonesand Free Newspapers during an Election in Mozambique’, CGD Working Paper (No. 328).
Aker, J. C. & Mbiti, I. M. (2010), ‘Mobile Phones and Economic Development in Africa’,Journal of Economic Perspectives 24(3), 207–232.
Andersen, T. B., Bentzen, J., Dalgaard, C.-J. & Selaya, P. (2011), ‘Does the Internet ReduceCorruption? Evidence from US States and across Countries’, World Bank Economic Review25(3), 387–417.
Andersen, T. B., Bentzen, J., Dalgaard, C.-J. & Selaya, P. (2012), ‘Lightning, IT Diffusion, andEconomic Growth across US States’, Review of Economics and Statistics 94(4), 903–924.
Angrist, J. D. & Krueger, A. B. (1995), ‘Split-Sample Instrumental Variables Estimates of theReturn to Schooling’, Journal of Business & Economic Statistics 13(2), 225–235.
Angrist, J. D. & Pischke, J.-S. (2008), Mostly harmless econometrics: An empiricist’s compan-ion, Princeton university press.
Berazneva, J. & Lee, D. R. (2013), ‘Explaining the African Food Riots of 2007-2008: AnEmpirical Analysis’, Food Policy 39, 28–39.
Besley, T. & Burgess, R. (2002), ‘The Political Economy of Government Responsiveness: Theoryand Evidence from India’, Quarterly Journal of Economics 117(4), 1415–1451.
Blattman, C. & Miguel, E. (2010), ‘Civil War’, Journal of Economic Literature 48(1), 3–57.
28
Bond, R. M., Fariss, C. J., Jones, J. J., Kramer, A. D., Marlow, C., Settle, J. E. & Fowler,J. H. (2012), ‘A 61-Million-Person Experiment in Social Influence and Political Mobilization’,Nature 489(7415), 295–298.
Brückner, M. & Ciccone, A. (2011), ‘Rain and the Democratic Window of Opportunity’, Econo-metrica 79(3), 923–947.
Buys, P., Dasgupta, S., Thomas, T. S. & Wheeler, D. (2009), ‘Determinants of a Digital Dividein Sub-Saharan Africa: A Spatial Econometric Analysis of Cell Phone Coverage’, WorldDevelopment 37(9), 1494–1505.
Campante, F. R. & Chor, D. (2012a), ‘Schooling, Political Participation, and the Economy’,Review of Economics and Statistics 94(4), 841–859.
Campante, F. R. & Chor, D. (2012b), ‘Why Was the Arab World Poised for Revolution?Schooling, Economic Opportunities, and the Arab Spring’, Journal of Economic Perspectives26(2), 167–187.
Castells, M. (2011), The Rise of the Network Society: The Information Age: Economy, Society,and Culture, Vol. 1, John Wiley & Sons.
Cecil, D. J., Buechler, D. E. & Blakeslee, R. J. (2014), ‘Gridded Lightning Climatology fromTRMM-LIS and OTD: Dataset Description’, Atmospheric Research 135, 404–414.
Chwe, M. S.-Y. (1999), ‘Structure and Strategy in Collective Action’, American Journal ofSociology 105(1), 128–156.
Collier, P. et al. (2000), Economic Causes of Civil Conflict and Their Implications for Policy,World Bank Washington, DC.
DellaVigna, S. & Gentzkow, M. (2010), ‘Persuasion: Empirical Evidence’, Annual Review ofEconomics 2(1), 643–669.
DellaVigna, S. & Kaplan, E. (2007), ‘The Fox News Effect: Media Bias and Voting’, QuarterlyJournal of Economics 122(3), 1187–1234.
Diamond, L. (2010), ‘Liberation Technology’, Journal of Democracy 21(3), 69–83.
DiPasquale, D. & Glaeser, E. L. (1998), ‘The Los Angeles Riot and the Economics of UrbanUnrest’, Journal of Urban Economics 43(1), 52–78.
Dube, O. & Vargas, J. F. (2013), ‘Commodity Price Shocks and Civil Conflict: Evidence fromColombia’, The Review of Economic Studies 80(4), 1384–1421.
Durante, R., Pinotti, P. & Tesei, A. (2015), ‘The Political Legacy of Entertainment Tv’, CEPRDiscussion Paper (No. 10738).
29
Enikolopov, R., Petrova, M. & Zhuravskaya, E. (2011), ‘Media and Political Persuasion: Evi-dence from Russia’, American Economic Review 101(7), 3253–3285.
Falck, O., Gold, R. & Heblich, S. (2014), ‘E-lections: Voting Behavior and the Internet’, Amer-ican Economic Review 104(7), 2238–2265.
Foster, V. & Briceno-Garmendia, C. (2011), Africa’s ICT Infrastructure: Building on the MobileRevolution, World Bank Publications.
Gentzkow, M. (2006), ‘Television and Voter Turnout’, Quarterly Journal of Economics121(3), 931–972.
Gentzkow, M., Shapiro, J. M. & Sinkinson, M. (2011), ‘The Effect of Newspaper Entry andExit on Electoral Politics’, American Economic Review 101(7), 2980–3018.
Gerber, A. S., Karlan, D. & Bergan, D. (2009), ‘Does the Media Matter? A Field ExperimentMeasuring the Effect of Newspapers on Voting Behavior and Political Opinions’, AmericanEconomic Journal: Applied Economics 1(2), 35–52.
Gladwell, M. (2010), ‘Small Change’, The New Yorker 4(2010), 42–49.
Granovetter, M. (1978), ‘Threshold Models of Collective Behavior’, American Journal of Soci-ology 84(6), 1420–1443.
Gruber, H. & Verboven, F. (2001), ‘The Diffusion of Mobile Telecommunications Services inthe European Union’, European Economic Review 45(3), 577–588.
GSMA (2012), ‘GSMA Network Coverage Maps - Submission Guide January 2012’, London:GSMA.
Gwilliam, K., Foster, V., Archondo-Callao, R., Briceño-Garmendia, C., Nogales, A. & Sethi,K. (2008), ‘The Burden of Maintenance: Roads in Sub-Saharan Africa’, AICD BackgroundPaper (No. 14).
Harari, M. & La Ferrara, E. (2013), ‘Conflict, Climate and Cells: A Disaggregated Analysis’,CEPR Discussion Paper (No. 9277).
Henderson, J. V., Storeygard, A. & Weil, D. N. (2012), ‘Measuring economic growth from outerspace’, The American Economic Review 102(2), 994.
Howard, P. N., Duffy, A., Freelon, D., Hussain, M., Mari, W. & Mazaid, M. (2011), ‘OpeningClosed Regimes: What Was the Role of Social Media during the Arab Spring?’, PITPIWorking Paper .
ITU (2003), ‘K.60 - Series K: Protection Against Interference-Emission Limits and Test Meth-ods for Telecommunication Networks’, ICT Data and Statistics, Division TelecommunicationDevelopment Bureau, International Telecommunication Union .
30

ITU (2015), ‘The World in 2014: ICT Facts and Figures’, ICT Data and Statistics, DivisionTelecommunication Development Bureau, International Telecommunication Union .
Jackson, M. O. & Yariv, L. (2006), ‘Diffusion on Social Networks’, Economie Publique/PublicEconomics 16, 3–16.
Jackson, M. O. & Yariv, L. (2007), ‘Diffusion of Behavior and Equilibrium Properties in NetworkGames’, American Economic Review 97(2), 92–98.
Jensen, R. (2007), ‘The Digital Provide: Information (Technology), Market Performance, andWelfare in the South Indian Fisheries Sector’, Quarterly Journal of Economics 122(3), 879–924.
Leetaru, K. & Schrodt, P. A. (2013), ‘GDELT: Global Data on Events, Location, and Tone,1979-2012’, International Studies Association Annual Conference .
Lowe, M. (2014), ‘Night Lights and ArcGIS: A Brief Guide’, MIT University Working Paper .
Madestam, A., Shoag, D., Veuger, S. & Yanagizawa-Drott, D. (2013), ‘Do Political ProtestsMatter? Evidence from the Tea Party Movement’, Quarterly Journal of Economics128(4), 1633–1685.
Manski, C. F. (1993), ‘Identification of Endogenous Social Effects: The Reflection Problem’,The Review of Economic Studies 60(3), 531–542.
Michalopoulos, S. & Papaioannou, E. (2012), ‘National Institutions and Subnational Develop-ment in Africa’, Quarterly Journal of Economics 129(1), 151–213.
Michalopoulos, S. & Papaioannou, E. (2015), ‘The Long-run Effects of the Scramble for Africa’,American Economic Review . (forthcoming).
Miguel, E. & Easterly, W. R. (2009), Africa’s Turn?, MIT Press.
Miguel, E., Satyanath, S. & Sergenti, E. (2004), ‘Economic Shocks and Civil Conflict: AnInstrumental Variables Approach’, Journal of Political Economy 112(4), 725–753.
Morozov, E. (2012), The Net Delusion: The Dark Side of Internet Freedom, PublicAffairs.
Nunn, N. & Wantchekon, L. (2011), ‘The Slave Trade and the Origins of Mistrust in Africa’,American Economic Review 101(7), 3221–3252.
Olken, B. A. (2009), ‘Do Television and Radio Destroy Social Capital? Evidence from Indone-sian Villages’, American Economic Journal: Applied Economics 1(4), 1–33.
Ortiz, I., Burke, S. L., Berrada, M. & Cortés, H. (2013), ‘World Protests 2006-2013’, Initiativefor Policy Dialogue and Friedrich-Ebert-Stiftung New York Working Paper .
31

Pierskalla, J. H. & Hollenbach, F. M. (2013), ‘Technology and Collective Action: The Effectof Cell Phone Coverage on Political Violence in Africa’, American Political Science Review107(2), 207–224.
Ponticelli, J. & Voth, H.-J. (2011), ‘Austerity and Anarchy: Budget Cuts and Social Unrest inEurope, 1919-2008’, CEPR Discussion Paper (No. 8513).
Raleigh, C., Linke, A., Hegre, H. & Karlsen, J. (2010), ‘Introducing ACLED - Armed ConflictLocation and Event Data’, Journal of Peace Research 47(5), 651–660.
Reinikka, R. & Svensson, J. (2011), ‘The Power of Information in Public Services: Evidencefrom Education in Uganda’, Journal of Public Economics 95(7), 956–966.
Rheingold, H. (2008), Mobile Media and Political Collective Action, in ‘Handbook of MobileCommunication Studies’, The MIT Press, chapter 17, p. 225.
Rohner, D., Thoenig, M. & Zilibotti, F. (2013), ‘Seeds of Distrust: Conflict in Uganda’, Journalof Economic Growth 18(3), 217–252.
Sauter, M. (2006), Communication Systems for the Mobile Information Society, John Wiley &Sons.
Schrodt, P. A. (2012), ‘Precedents, Progress, and Prospects in Political Event Data’, Interna-tional Interactions 38(4), 546–569.
Shapiro, J. N. & Weidmann, N. B. (2015), ‘Is the Phone Mightier Than the Sword? Cellphonesand Insurgent Violence in Iraq’, International Organization 69(2), 247–274.
Shirky, C. (2011), ‘The Political Power of Social Media’, Foreign Affairs 90(1), 28–41.
Snyder Jr, J. M. & Strömberg, D. (2010), ‘Press Coverage and Political Accountability’, Journalof Political Economy 118(2), 355–408.
Stork, C., Calandro, E. & Gillwald, A. (2013), ‘Internet Going Mobile: Internet Access andUsage in Eleven African Countries’, Info 13(5), 34–51.
Strömberg, D. (2004), ‘Radio’s impact on Public Spending’, Quarterly Journal of Economics119(1), 189–221.
Tollefsen, A. F., Strand, H. & Buhaug, H. (2012), ‘PRIO-GRID: A Unified Spatial Data Struc-ture’, Journal of Peace Research 49(2), 363–374.
Ward, M. D., Beger, A., Cutler, J., Dickenson, M., Dorff, C. & Radford, B. (2013), ‘ComparingGDELT and ICEWS Event Data’, Analysis 21, 267–297.
Wolfers, J. (2002), ‘Are Voters Rational? Evidence from Gubernatorial Elections’, GraduateSchool of Business, Stanford University Working Paper .
32
Wooldridge, J. M. (2010), Econometric Analysis of Cross Section and Panel Data, MIT press.
World Bank (2012), World Development Indicators 2012, World Bank Publications.
Yanagizawa-Drott, D. (2014), ‘Propaganda and Conflict: Evidence from the Rwandan Geno-cide’, Quarterly Journal of Economics 129(4), 1947–1994.
33
A. Data appendix
A.1. GSMA
GSMA data are collected for the purpose of constructing a roaming coverage map service usedby network operators and users. The data that have been licensed to us provide separate infor-mation on the availability of 2G, 3G and 4G technology. 2G technology improved over previoustechnology by digital encryption of the signal, which allows for SMS, picture sharing and basicInternet access. 3G and 4G technologies allow for broadband access. These technologies areincremental in the data - 3G (4G) coverage is available only if 2G (3G) coverage was previouslyavailable in a certain area. Only 2 percent of the continent population was in reach of the 3Gsignal over the period, with this figure reaching a maximum of 6.3 percent in 2012. There wasvirtually no 4G technology available in Africa over the period of observation. Our measureof coverage is the fraction of population that lives within range of a mobile network signal,regardless of whether they actually subscribe to the service or use it. In order to gauge anunderstanding of what this implies in terms of mobile subscriptions, we compare our measureof mobile phone penetration with data on the number of subscribers by country and year fromITU (2015). Average coverage rate for the sample of country/year observations for which ITUdata are available is 49 percent versus 43 percent for the entire set of countries/years for whichGSMA data are available. The fraction of subscribers over population for this sample is 30percent. A regressions of the fraction of log subscribers over total population (plus one to allowfor zeros) on the log fraction of individuals covered by the 2G signal (plus 0.0001 to allow forzeros), controlling for country and year fixed effects leads to an estimated coefficients of 0.30(s.e. 0.02), implying that a 10 percent increase in coverage is associated with an increase inmobile phone subscriptions of 3 percent.
A.2. GDELT and ACLED
Data in GDELT refer broadly speaking to political events in the area of verbal and physicalmediation and conflict (Make a public statement, Consult, Threaten, Disapprove, etc.), in-cluding protests but excluding events that make part of the routine political process, such asthose pertaining to elections, the legislative debate and government actions that do not fall intothe categories of mediation or conflict. The data are available at www.gdeltproject.org/data(data downloaded on 30/01/2014). Events in GDELT come from both digitalized newspapersand news agencies (Africa News, Agence France Presse, Associated Press Online, Xinhua, BBCMonitoring, The Washington Post, New York Times...) as well as from web-based news aggrega-tors such as GoogleNews, which gathers around 4,000 media outlets (Leetaru & Schrodt 2013).The data are extracted using an open-source coding algorithm, TABARI, or Textual Analysisby Augmented Replacement Instructions, that sifts through news articles in search of actionsand actors available in CAMEO, the Conflict and Mediation Event Observation, a widely usedcoding system in the field of political science that provides a list of around 15,000 actions and
34
60,000 political actors. A precise location at the level of city or landmark is assigned to theevent using the GeoNames gazetteer, which includes over 10 million toponyms for 9 millionplaces with 5.5 million alternate names in up to 200 languages (www.geonames.org). The dataalso report information on the number of sources and articles across sources that refer to thesame event as well as on the actors involved - both the source and the target - although thislast information is missing for a large fraction of events. Importantly, the data do not provideany information on the issue, the number of participants, the original news sources or the issueat stake. In a comprehensive study of protests worldwide Ortiz et al. (2013) list, in order, thefollowing reasons for protests which occurred between 2006 and 2013: Economic justice andAnti-austerity, Failure of political representation, Global justice, People’s rights. Most protestsare against national governments.Since GDELT is a largely yet unutilized dataset and since we have no control on the algorithm
used to collect the data or the news sources effectively utilized, we compare information fromGDELT with another widely utilized, but much smaller, manually compiled dataset on unrestin Africa, the ACLED. The dataset provides information on political violence during civil warsor episodes of instability and state failure between 1997 and 2013, and as such it has beenused widely in the literature on civil conflict (e.g. Harari & La Ferrara 2013, Michalopoulos &Papaioannou 2015, Pierskalla & Hollenbach 2013). However, events that are potential precursorsor critical junctures of conflict, like protests and riots during peaceful times, are also recorded.We focus on these events, which represent around 20 percent of the total number of recordsin ACLED. Events are manually compiled from local, regional, national and continental mediaand are supplemented by NGO reports. The number of different sources used in ACLED hasincreased from 72 in 1998 to 232 in 2012 (ACLED, 2012). Like in GDELT, no information isavailable on the issue and the number of participants (although the data report the originalnews source). Figure A.5 reports the evolution in protests per capita measured in GDELTand ACLED, separately by country. As the scale of the different series varies across countries,we report the residuals from regressions of log protests per capita (plus one, to account forzeros) on country dummies and year dummies. In practice these series report the evolution ofprotests within countries from different sources net of continent-wide trends and differences incountry-levels protest incidence that might also capture differences in reporting probabilitiesand time-invariant differences in country-protest incidence. Despite the difference in scale (notethat the ranges of variation on the left and right-hand axes are different), one can appreciatea very strong positive correlation between the two series in most countries. In countries likeBurkina Faso, Cape Verde and the Central African Republic to name a few, one can see thatthe series line up remarkably well. This is less true in other countries such as Algeria, Beninor Lesotho. Note that the series in Figure A.5 refer to average protests per capita in eachcountry/year. As ultimately our analysis focuses on cells within countries, we also explore thecorrelation between protests per capita from the different sources across these cells. Figure A.6reports on the vertical axis the intensity of protests per capita measured in GDELT and on the
35
horizontal axis the intensity of protests from ACLED. Both series are obtained as residuals oflogs of the relevant variables (plus one to account for zeros) on cell and country fixed effects,separately for each country. Regressions are weighted by population size. We superimposeto the data an estimated regression line, separately for each country. The pooled regressioncoefficient across all countries alongside the associated standard error clustered at the level ofcell is reported at the bottom of the figure. One can clearly see that, even within countries, thereis a very clear positive correlation between the two series. This is true in almost all countries,and the pooled regression coefficient of protests from GDELT on protests from ACLED is 1.844(s.e. 0.138). Taken together these figures suggest that, despite some unavoidable measurementerror, the two series convey very similar information.
A.3. Afrobarometer
In the analysis we use data from Afrobarometer, rounds 3 to 5, spanning from 2005 to 2013(information on available data by country and round is reported in Table A.2). As a first step,we have assigned individuals in Afrobarometer to the PRIO-GRID cells. The Afrobarometerprovides information on individuals’ country, district and town/village of residence. The qualityof information varies across rounds and countries.We match observations in the Afrobarometer to data from Geonames, which are available for
public download at http://www.geonames.org. Geonames is a dataset of placenames aroundthe world with information on the latitude and longitude of each place centroids. We restrictto populated places in Geonames (i.e. we exclude for example mountains or lakes), defined astowns, villages or other places where people live and work. Geonames also provides alternatenames for each place, which are typically other names by which the place is known or the namein the local language. We assign each populated place in a country to a PRIO-GRID cell basedon its coordinates. This gives a list of places with the associated PRIO-GRID cell.Importantly, even within a country, the same placename in Geonames can be shared by more
than one populated place, meaning that we cannot always uniquely assign a placename to acell. When two places share the same name and hence potentially belong to more than one cell,we expand the dataset and we assign that place to each of these multiple cells. We construct anadjustment factor for each observation in this dataset so that a placename X PRIO-GRID cellhas an associated weight equal to the relative population of a cell expressed as a fraction of thetotal population among all cells to which that given place can potentially belong to. Clearly,for cells that are univocally assigned to a cell this population weight is equal to one.We start by matching observations in Afrobarometer based on their (country and) district
of residence to those in this newly created dataset using the first placename in Geonames. Ifan observation does not match, we match sequentially on the first, second and third alternateplacename in Geonames. For unmatched observations, we proceed sequentially replicating thesame procedure but matching on town/village of residence in the Afrobarometer.The resulting dataset has a number of observations larger than the original Afrobarometer,
36
as individuals whose place of residence can potentially belong to different cells will have asmany observations in the data as the potential cells of residence. Afrobarometer data includesampling weights. We rescale sampling weights by the population weights described above. Thisis equivalent to assuming that these individuals have been sampled at random among all thoseliving in all the potential cells of residence and guarantees that the sum of weights in this newdataset is the same as in the original Afrobarometer dataset.In total we are able to assign 78,167 individuals in Afrobarometer to at least one PRIO-GRID
cell, or 81 percent of total respondents. Unmatched observations are those in the Afrobarometerfor which the district, town or village of residence cannot be found among the (main and first,second and third alternate) list of populated placenames in Geonames. This can be eitherbecause that place is genuinely missing in Geonames or because of differences in spelling acrossdatasets. In total 49 percent of matched individuals have a unique cell identifier, while the restare assigned to at least two cells.Column (1) of Table A.7 investigates the individual correlates of protest participation. Protest
participation increases and then decreases with age, peaking at age 36, increases with educationand is higher for males than for females.We have also studied the within-cell correlation between self-reported protest participation
in Afrobarometer and the incidence of protests in both GDELT and ACLED. In order to doso, we have computed the fraction of individuals reporting having participated in at least oneprotest in each cell and year. We regress this fraction on a dummy equal to one if at least oneprotest occurred in that cell/year plus the number of protests (separately from GDELT andACLED). The coefficient on the first variable captures the increase in participation associatedto the first protest occurring, while the coefficient on the second variable captures the marginalincrease in participation for each additional protest. If everybody who participates in oneprotest also participates in all other protests, the coefficient on the second variable will be zero.Regressions include cell fixed effects plus the interaction between year and country dummies andare weighted by the sum of Afrobarometer sampling weights in each cell/year. Standard errorsare clustered by cell. Point estimates on a dummy for positive number of protest are 0.012 (i.e.0.008) and 0.015 (se. 0.008) when using GDELT and ACLED respectively. We find small andstatistically insignificant effects on the variable "number of protests" in both datasets. Takentogether, these results imply that indeed protest incidence as measured in both GDELT andACLED is associated to an increase in protest participation in Afrobarometer (of between 1.2and 1.5 p.p.) and that protest participation is concentered among a set of politically engagedcitizens.A further issue with the data is that we only have information on mobile phone use for
rounds 4 and 5. In addition, the phrasing of the question across rounds is different. In order tocharacterize the determinants of mobile phone use in Afrobarometer we run an ordered probitmodel of frequency of mobile phone use (5 categories, ranging from never to several times a day)in round 5, based on a number of socio-economic characteristics, country plus year fixed effects,
37
and the fraction of the population in reach of signal in their cell from GSMA. Marginal effectsfrom these regressions are reported in column 2 of Table A.7. Mobile phone use increases andthen decreases with age, peaking at age 38, increases with education and is higher for malescompared to females. Importantly, it is also strongly positively correlated with mobile phonecoverage from GSMA. We use estimates from this model to predict mobile phones usage for allindividuals in the Afrobarometer, including in rounds 3 and 4. We assign to each individuala dummy equal to 1 if the estimated probability of using a mobile phone at least once a dayexceeds 50 percent. Based on this procedure, 67 percent of the individuals are predicted to usea mobile phone.
B. Theory appendix
B.1. Setup
We consider a network of individuals characterized by the distribution P (d) (d = 0, 1, . . . , D)of the number d of neighbors, or degree, where
∑Dd=0 P (d) = 1. We think of mobile phones as
increasing the number of neighbors and - as a result - increasing the density of the network. Werevert to a more formal definition below.Each agent i has the choice between taking action 0, which can be thought of as the status
quo (in the present case, not protesting), or action 1 (in the present case, protesting).We denote the utility of an agent of degree di from taking action 1 relative to action 0 when
he expects his neighbors to choose action 1 with probability y−i by vi = v(di, y−i). We followothers in the literature (Chwe 1999, Granovetter 1978, Jackson & Yariv 2007) by assuming thatagents’ decisions are characterized by strategic complementarities, i.e. that the utility of agenti from taking action 1 is non decreasing in y−i:41
∂vi∂y−i
≥ 0 (B.1)
Each agent i has a cost of taking action 1, which we denote by ci. We follow others in theliterature by assuming that the opportunity cost of participating is higher when the economyimproves.42 With no loss of generality, we depart from Jackson & Yariv (2007) and assumethat costs can also vary as a function of an individual’s degree di. In formulas, we assume thatci = c(di,∆GDP ) + εi, where εi is an error term that we assume independent of di and with
41 Jackson & Yariv (2007) assume that at given probability of participation among neighbors, individuals with agreater number of connections draw no less utility from participating than individuals with fewer connections,i.e. in formulas ∂vi
∂di≥ 0. We ignore this assumption as this is not key to our results.
42 An alternative interpretation for this assumption is that reasons for grievance increase during bad economictimes.
38
c.d.f. H(.) and:43
∂ci∂∆GDP ≥ 0 (B.2)
We follow Jackson & Yariv (2006) and assume for simplicity that ε is uniformly distributed.From the above, it follows that the probability yi that an agent i of degree di decides to join aprotest given that his neighbors protest with probability y−i is:
yi = H(vi − ci) (B.3)
B.2. Equilibrium
We assume that each agent has limited information over the structure of the network: he onlyknows his own degree di and cost ci and the overall distribution of degrees in the populationP (d). The play is symmetric, in the sense that every agent perceives the distribution of playof each of his neighbors to be independent and to correspond to the population distribution ofplays.Individuals iterate over neighbors’ best responses given the probability distribution of the
neighbors’ degrees. Under the above hypotheses an equilibrium for the game exists. In partic-ular, at the equilibrium the fraction of individuals participating, y, is defined by the solution tothe following equation:
y = φ(y) :=D∑d=0
P (d)H(v(d, y)− c(d,∆GDP )) (B.4)
where P (d) = P (d) dE[d] denotes the probability that a random neighbor is of degree d. The
equilibrium condition effectively states that individuals’ best responses are mutually consistent.Although both stable and unstable equilibrium are possible in this game, we focus on the
stable equilibrium. Again following Jackson & Yariv (2007), at the stable equilibrium it mustbe true that:
∂φ(.)∂y
< 1 (B.5)
B.3. Participation and the state of the economy
We start by performing comparative statics on the equilibrium of the model in response tochanges in the state of the economy ∆GDP .From the definition of yi, note that, conditional on the state of the economy and the agent’s
degree, around the equilibrium individuals will be more likely to participate the higher is the
43 As in the case of v we remain agnostic of the sign of the partial derivative of c with respect to d as this is notkey to our results.
39
fraction of other individuals participating:
∂yi∂y |di,∆GDP
≥ 0 (B.6)
In addition, each individual’s probability of participation will increase (decrease) as the stateof the economy deteriorates (improves):
∂yi∂∆GDP |di,y
≤ 0 (B.7)
Note that equation (B.7) refers to an individual’s propensity to participate in response tochanges in the state of the economy conditional on the individuals’ degree and the overallfraction of individuals participating, where the latter is itself a variable affected by economicconditions. In particular one can show that this fraction increases (decreases) as the state ofthe economy deteriorates (improves). From (B.4):
dy
d∆GDP =
∂φ(.)∂∆GDP1− ∂φ(.)
∂y
=
∑Dd=1 P (d) ∂H(.)
∂∆GDP1−
∑Dd=1 P (d)∂H(.)
∂y
≤ 0 (B.8)
where the last inequality follows from the fact that at the equilibrium the numerator in (B.8)is negative (from equation B.7), while the denominator is positive (from equation B.5).The intuition for this result is straightforward. Worse economic conditions mechanically
raise each individual’s propensity to protest (equation B.7). This raises protest participationand hence increases the fraction of those participating (this is the numerator of equation B.8).Strategic complementarities generate an additional effect as individuals iterate over their neigh-bors’ best responses, knowing that everybody else will be more likely to participate and to knowthat everybody else will know, etc. (this is the denominator of equation B.8). This mechanismfurther enhances the positive effect of recessions on the incidence of protests.
B.4. Differential responses based on the density of the network
We extend our analysis to study how economic conditions have a different impact on the prob-ability of protesting depending on individuals’ degree and the “density” of the network, i.e. thedistribution of degrees.In order to examine how the response of the equilibrium level of protests to changes in
∆GDP differs between denser and less dense networks we make the following two additional
40
assumptions:44
∂2ci∂∆GDP ∂di
≥ 0 (B.9)
∂2vi∂y−i ∂di
≥ 0 (B.10)
Equation (B.9) states that the opportunity cost of participating responds more to the state ofthe economic cycle the higher an agent’s degree. We take this assumption to reflect the circum-stance that, compared to individuals with no mobile phones, those with mobile phones (i.e.,those with higher degree) experience greater decreases (increases) in the cost of participationwhen the economy deteriorates (improves). One explanation for this is that individuals withmobile phones are more likely to correctly perceive the actual state of the economy due to theunadulterated nature of the information they are able to access. We label this mechanism “en-hanced information”. An alternative explanation is that mobile phones are complementary toaggregate economic growth in determining one’s productivity so the opportunity cost of protestsvaries differentially for those with and without mobile phones along the cycle. We investigateempirically these different explanations in Table 5.Equation (B.10) states that the increase in utility from participation in response to a given in-
crease in the fraction of neighbors participating is higher for those with mobile phones comparedto those with no mobile phones. One way to rationalize this assumption is that mobile phonescan help better coordinate with other protesters, which results in a higher increase in utilityin response to an increase in the fraction of neighbors participating. We label this mechanism“enhanced coordination”.The implications of these assumptions for individual behavior can be easily derived. Under
(B.9) and (B.10):
∂2yi∂∆GDP ∂di |y
≤ 0 (B.11)
This means that individual i’s probability of participation increases more in response to adeterioration in economic conditions the higher this individual’s number of connections. And:
∂2yi∂y ∂di |∆GPD
≥ 0 (B.12)
Equation (B.12) states that the effect of changes in the fraction of individuals participatingon each individual’s probability of participation increases with his number of connections.45
44 We ignore the effect of changes in density of the network on the emergence of protest at given GDP growth.This effect is discussed in Jackson & Yariv (2007) who show that, if ∂vi
∂di≥ 0 (and ∂ci
∂di= 0), an increase in
density unequivocally raises protests. We remain agnostic on this effect not least because we find no supportfor this prediction in the data, although a way to rationalize our empirical result is that ∂vi
∂di≥ 0 and ∂ci
∂di≥ 0.
45 If the assumption that ε is uniform does not hold, conditions (B.9) and (B.10) are replaced by the followingconditions: ∂yi
∂∆GDP ∂di |y−i≤ 0 and ∂2yi
∂y−i ∂di |∆GPD≥ 0.
41
To understand how the density of the network affects the overall fraction of individualsparticipating, we define density in terms of first order stochastic dominance (FOSD).46 Giventwo networks P and Q , we say that Q is denser than P if Q(d) FOSD P (d), i.e. if:
D∑d=0
Q(d)f(d) ≥D∑d=0
P (d)f(d) for any non-decreasing function f of d. (B.13)
We think of increasing mobile phone coverage precisely as leading to a FOSD shift in P .From (B.8), (B.9) and (B.10) it follows that a deterioration in economic conditions leads to
a larger increase in the fraction of people protesting in denser (Q) compared to less dense (P )networks. In formulas:
− dyQ
d∆GDP ≥ −dyP
d∆GDP (B.14)
To see this note that from equation (B.8), − dyd∆GDP =
−∑D
d=1 P (d)∂H(.)∂∆GDP
1−∑D
d=1 P (d)∂H(.)∂y
. Under assump-
tions (B.9) and (B.10), as the density of the network increases, the numerator increases, whilethe denominator decreases, so that (B.14) holds. Note that conditions (B.9) and (B.10) aresufficient although not necessary for equation (B.14) to hold.The intuition for this result has to do with the larger share of more connected agents in denser
networks. If individuals with more connections are more likely to increase their participationwhen the economy deteriorates (equation B.9), then worse economic conditions will directlylead to greater protest participation in denser networks. This is a compositional effect.In this setting though every individual will know that each individual’s propensity to partic-
ipate has increased - and that others know that - and this effect is greater in denser networks.Once more, this effect works through strategic complementarities and further magnifies theeffect of recessions on protest participation in denser networks. This second effect is at playprovided that those with lower connections are not disproportionately more likely to respond togreater protest participation of their neighbors, compared to those with more connections (i.e.if equation B.10 holds).
B.5. From theory to the empirical model
The previous model provides testable implications that can be brought to the data. Let usdenote by di a dummy equal to one if an individual uses a mobile phone and let d denote thefraction of individuals with mobile phones in the population.Linearizing equations (B.6), (B.7), (B.11) and (B.12) one can derive the following expression
46 The concept of FOSD captures the idea that one distribution is obtained by shifting mass from another oneto place it to higher values, so that the new distribution reflects an unambiguous increase in connectivitycompared to the old one.
42

for individual i participation:
yi = γ0 + γ1 ∆GDP + γ2 di + γ3 ∆GDP di + γ4 y + γ5 y di + εi (B.15)
were yi is a dummy for individual i participating in a protest and ε is an error term. Ifassumptions (B.1), (B.2), (B.9) and (B.10) hold, we expect γ1, γ3 ≤ 0 and γ4, γ5 ≥ 0.Assuming for simplicity that the fraction of individuals using a mobile phone (d) is identical
to the fraction of people in reach of the signal (Cov), and solving for y, it follows that:
y = β0 + β1 ∆GDP + β2 Cov + β3 ∆GDP Cov + ε (B.16)
where βk ≈ γk1−γ4−γ5d
, k = 0, 1, 2, 3 and for the equilibrium to be stable we expect γ4 + γ5d < 1(this is effectively equation (B.5)).
47
Model (B.16) refers to aggregate outcomes. It says that the fraction of individuals protestingin the economy is a negative function of GDP growth, a positive function of the share of mobilephone coverage and a negative function of the interaction between these two variables. Thismodel can be estimated using GDELT and ACLED data on the occurrence of protests by cell,or using individual data (or cell means) on protest participation from the Afrobarometer.Although an advantage of model (B.16) is that it can be estimated directly on aggregate
data by cell, which are available consistently for the entire continent through a long periodof time, estimates of this model are unable to provide guidance on the micro foundations ofthe phenomenon under study. As said, the role of greater connectivity in enhancing protestsduring bad economic times hinges on either greater responsiveness of those more connected toeconomic conditions, or on their greater responsiveness to their peers’ participation comparedto those less connected. These two effects though cannot be told apart in an aggregate equationlike (B.16).One however can make some progress using micro-data. If one is able to consistently estimate
the parameters of equation (B.15), then one will be able to say whether and to what extentthe differential effect of mobile phone coverage in response to a recession on protests is dueto either higher sensitivity to changes in economic conditions (γ3 < 0) or greater strategiccomplementarities (γ5 > 0) among those connected, or both.Identification of model (B.15) involves some challenges though. Even ignoring the possibility
of non-random allocation of mobile phones across areas and individuals, estimates of model(B.15) will still be potentially plagued by a classical reflexivity problem (Manski 1993). However,equation (B.16) suggests that one can obtain consistent estimates of the parameters in (B.15)by instrumenting average participation in the economy y (and its interaction with mobile phoneuse di) with mobile phone coverage d and its interaction with GDP growth (as well as theirinteraction with mobile phone use di). Intuitively, and conditional on di, the fraction of those
47 Alternatively, let d = κ0 + κ1 Cov + τ. In this case, β1 ≈ γ1+γ3κ01−γ4−γ5d
and βk ≈ γkκ11−γ4−γ5d
for k=2, 3.
43
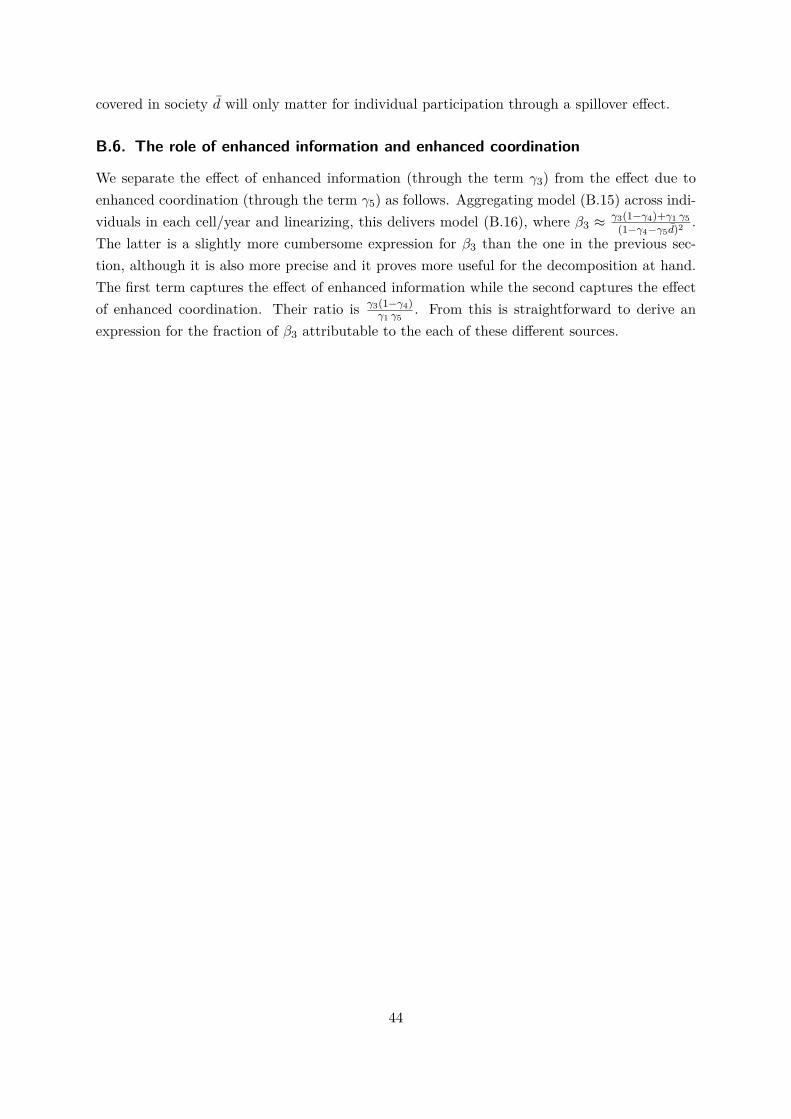
covered in society d will only matter for individual participation through a spillover effect.
B.6. The role of enhanced information and enhanced coordination
We separate the effect of enhanced information (through the term γ3) from the effect due toenhanced coordination (through the term γ5) as follows. Aggregating model (B.15) across indi-viduals in each cell/year and linearizing, this delivers model (B.16), where β3 ≈ γ3(1−γ4)+γ1 γ5
(1−γ4−γ5d)2 .The latter is a slightly more cumbersome expression for β3 than the one in the previous sec-tion, although it is also more precise and it proves more useful for the decomposition at hand.The first term captures the effect of enhanced information while the second captures the effectof enhanced coordination. Their ratio is γ3(1−γ4)
γ1 γ5. From this is straightforward to derive an
expression for the fraction of β3 attributable to the each of these different sources.
44
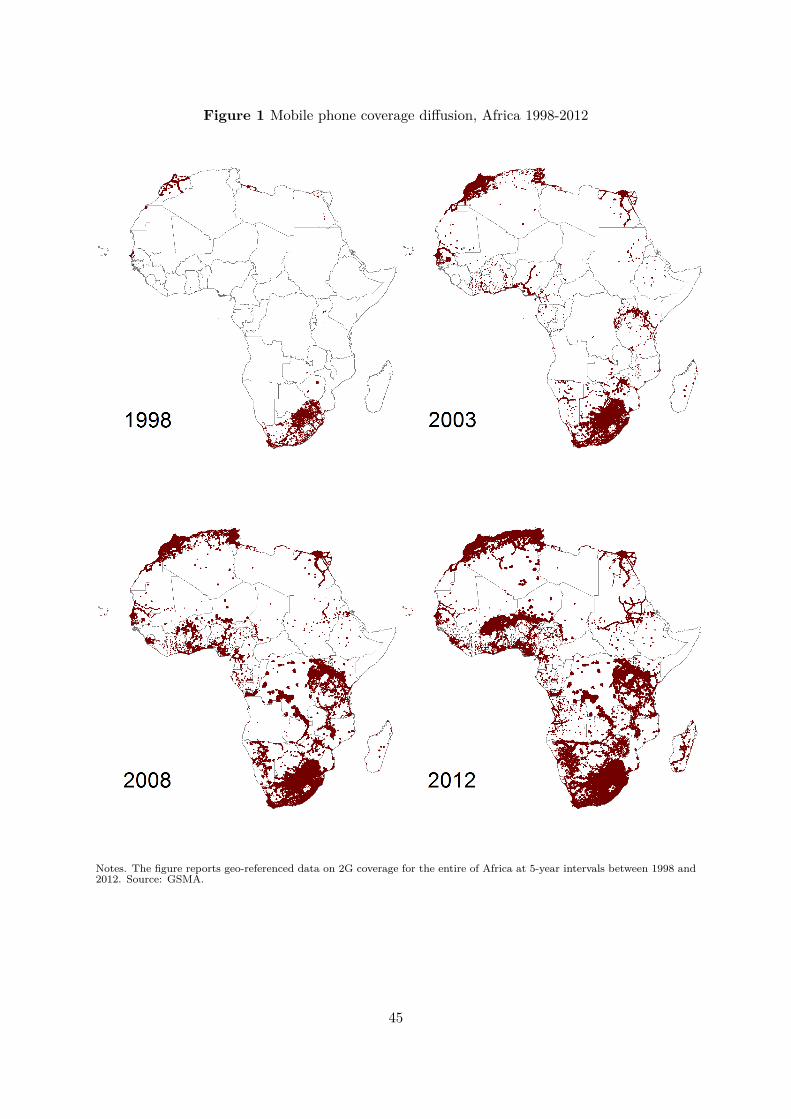
Figure 1 Mobile phone coverage diffusion, Africa 1998-2012
Notes. The figure reports geo-referenced data on 2G coverage for the entire of Africa at 5-year intervals between 1998 and2012. Source: GSMA.
45
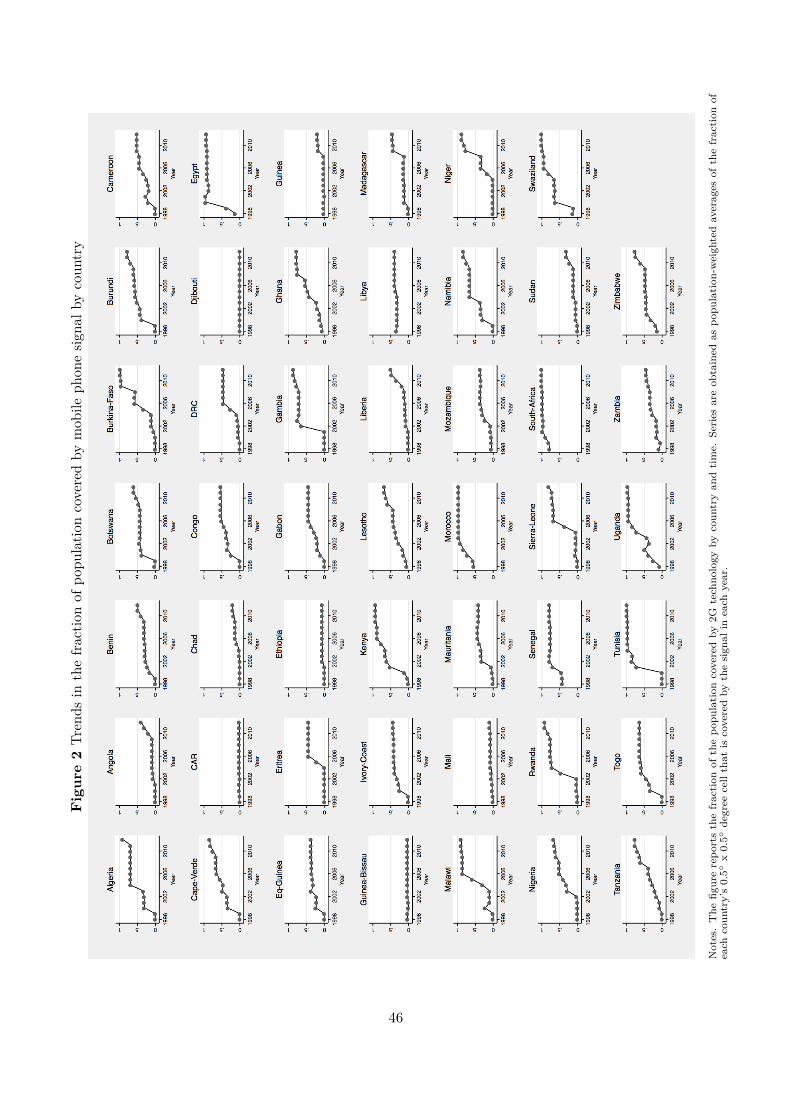
Fig
ure
2Tr
ends
inthefractio
nof
popu
latio
ncoveredby
mob
ileph
onesig
nalb
ycoun
try
Notes.The
figurerepo
rtsthefraction
ofthepo
pulation
coveredby
2Gtechno
logy
bycoun
tryan
dtime.
Series
areob
tained
aspo
pulation
-weigh
tedaverages
ofthefraction
ofeach
coun
try’s
0.5
x0.
5degree
cellthat
iscoveredby
thesign
alin
each
year.
46

Figure 3 The evolution of GDP Growth and protests over time - Africa
Notes. The figure reports continent-wide log protests per 100,000 people (dashed line) and the rate of GDPgrowth (dotted line) as a function of time. Continent-wide GDP growth is obtained as a population-weightedaverage of GDP growth in each country.
47

Figure 4 Protests differential between high and low flash intensity areas and GDP growth
Notes. The figure reports the within-country trend in the log protest differential between high and low flash intensityareas (dashed line) and the continent-wide rate of GDP growth (dotted line). Series are population-weighted averagesacross countries. Observations only refer to countries-years for which there is sufficient variation in flash intensityacross areas (see also text for details).
48

Figure 5 Placebo test
Panel A: Mobile phone coverage by sub-periods
Panel B: Reduced-form coefficients of Z ∆GDP by sub-periods
Notes. Panel A reports the continental trend in 2G mobile phone coverage by 3-years sub-periods. Coverage is set at 0 for all cells before 1995 (the year in which 2G technology wasfirst introduced in Africa) and is linearly interpolated at the cell-level between 1995 and 1998(the first year in our data). Panel B reports the estimated coefficients from the reduced-formregression of log protests per 100,000 people (plus one to account for zeros) on the variableZ X ∆GDP (parameter ρ3 in equation 5.1) by 3-years sub-periods and the corresponding 90percent confidence intervals.
49
Table 1 Descriptive statistics: cell characteristics
Avg. Std. Dev. Min. Max.
Mobile Phone Coverage (percent) 0.43 0.42 0 1
Protests per 100, 000 pop.−GDELT 1.24 17.29 0 3,000,000Protests per 100, 000 pop.−ACLED 0.08 0.688 0 1,146.13
Country GDP growth 0.049 0.041 -0.33 0.63
Population (1000s) 84.32 266.78 0 12,860Cities (number) 2.36 3.94 0 36Border Distance (100 km) 1.73 1.47 0 10.54Capital Distance (100 km) 3.57 3.35 0.04 19.48Coast(dummy) 0.15 0.36 0 1Primary Roads (100 km) 0.87 0.99 0 5.22Primary Roads Paved (100 km) 0.49 0.72 0 4.66Primary Roads Good Conditions (100 km) 0.26 0.49 0 3.80Secondary Roads (100 km) 1.42 1.10 0 6.40Electricity Network (100 km) 0.86 1.18 0 7.55Travel T ime nearest city pop. ≥ 50K(hours) 4.21 3.69 0 102.2Infant Mortality Rate (h) 8.91 3.71 1 20.31Mountain (percent) 0.23 0.32 0 1Forest (percent) 0.23 0.25 0 1Irrigated (percent) 0.08 0.17 0 0.87Diamonds (dummy) 0.03 0.18 0 1Minerals (dummy) 0.22 0.42 0 1Oil (percent) 0.13 0.33 0 1Conflict (dummy) 0.19 0.39 0 1Temperature (Celsius degrees) 23.12 4.25 4.06 31.41Precipitation (mm.) 876.2 487.5 69.39 3,296.4Drought (n. of years) 1.44 1.25 0 11Avg. distance from drought (100 km) 1.74 0.56 0 4.56Flashrate (100, 000 per cell per year) 0.513 0.426 0 5.046
Notes. The table reports descriptive statistics for each of the 10,409 cells of 0.5 x 0.5 degreeresolution that compose Africa (excluding Somalia). All data, except population in row 5, areweighted by cell population. Row 1 reports the fraction of the population in reach of 2G mobilesignal. Rows 2 and 3 report the average number of protests in a year per 100,000 people, fromGDELT and ACLED respectively. Row 4 reports the country’s yearly growth in GDP per capita.The residuals rows report cross-sectional physical, climatic, geographical and socio-economic char-acteristics of each cell. Table A.1 reports the definition as well as the source of each of thesevariables.
50
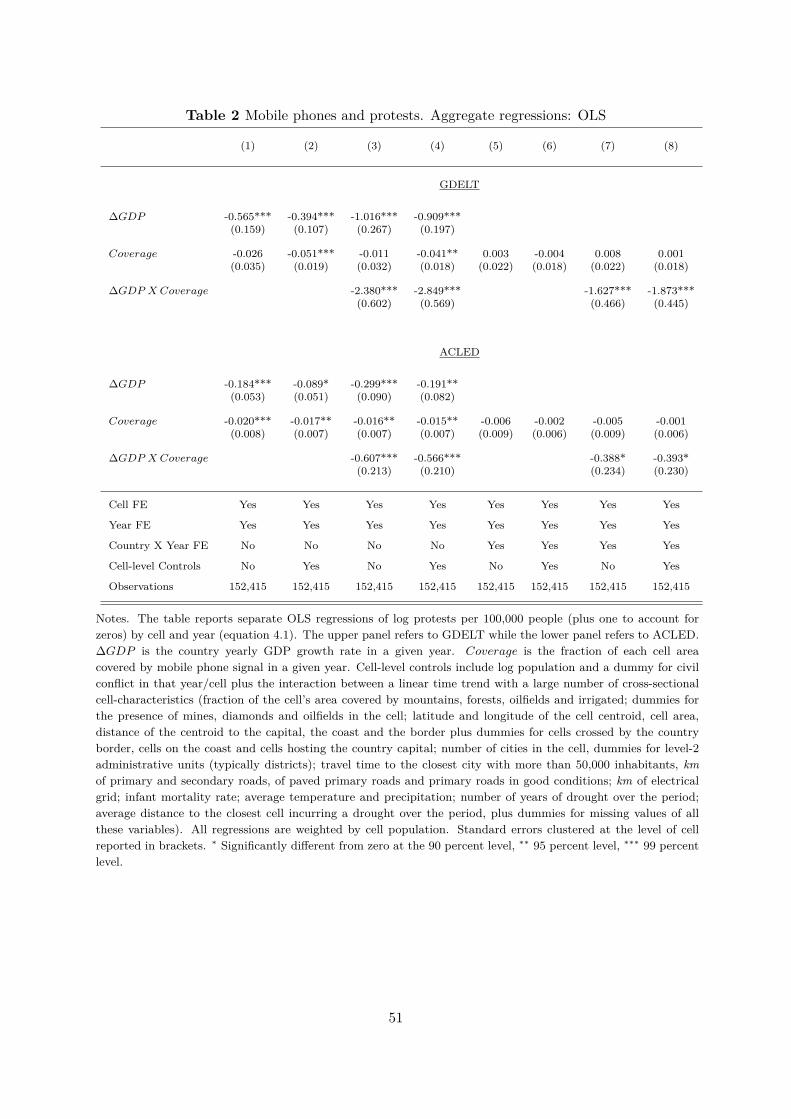
Table 2 Mobile phones and protests. Aggregate regressions: OLS
(1) (2) (3) (4) (5) (6) (7) (8)
GDELT
∆GDP -0.565*** -0.394*** -1.016*** -0.909***(0.159) (0.107) (0.267) (0.197)
Coverage -0.026 -0.051*** -0.011 -0.041** 0.003 -0.004 0.008 0.001(0.035) (0.019) (0.032) (0.018) (0.022) (0.018) (0.022) (0.018)
∆GDP X Coverage -2.380*** -2.849*** -1.627*** -1.873***(0.602) (0.569) (0.466) (0.445)
ACLED
∆GDP -0.184*** -0.089* -0.299*** -0.191**(0.053) (0.051) (0.090) (0.082)
Coverage -0.020*** -0.017** -0.016** -0.015** -0.006 -0.002 -0.005 -0.001(0.008) (0.007) (0.007) (0.007) (0.009) (0.006) (0.009) (0.006)
∆GDP X Coverage -0.607*** -0.566*** -0.388* -0.393*(0.213) (0.210) (0.234) (0.230)
Cell FE Yes Yes Yes Yes Yes Yes Yes Yes
Year FE Yes Yes Yes Yes Yes Yes Yes Yes
Country X Year FE No No No No Yes Yes Yes Yes
Cell-level Controls No Yes No Yes No Yes No Yes
Observations 152,415 152,415 152,415 152,415 152,415 152,415 152,415 152,415
Notes. The table reports separate OLS regressions of log protests per 100,000 people (plus one to account forzeros) by cell and year (equation 4.1). The upper panel refers to GDELT while the lower panel refers to ACLED.∆GDP is the country yearly GDP growth rate in a given year. Coverage is the fraction of each cell areacovered by mobile phone signal in a given year. Cell-level controls include log population and a dummy for civilconflict in that year/cell plus the interaction between a linear time trend with a large number of cross-sectionalcell-characteristics (fraction of the cell’s area covered by mountains, forests, oilfields and irrigated; dummies forthe presence of mines, diamonds and oilfields in the cell; latitude and longitude of the cell centroid, cell area,distance of the centroid to the capital, the coast and the border plus dummies for cells crossed by the countryborder, cells on the coast and cells hosting the country capital; number of cities in the cell, dummies for level-2administrative units (typically districts); travel time to the closest city with more than 50,000 inhabitants, kmof primary and secondary roads, of paved primary roads and primary roads in good conditions; km of electricalgrid; infant mortality rate; average temperature and precipitation; number of years of drought over the period;average distance to the closest cell incurring a drought over the period, plus dummies for missing values of allthese variables). All regressions are weighted by cell population. Standard errors clustered at the level of cellreported in brackets. ∗ Significantly different from zero at the 90 percent level, ∗∗ 95 percent level, ∗∗∗ 99 percentlevel.
51
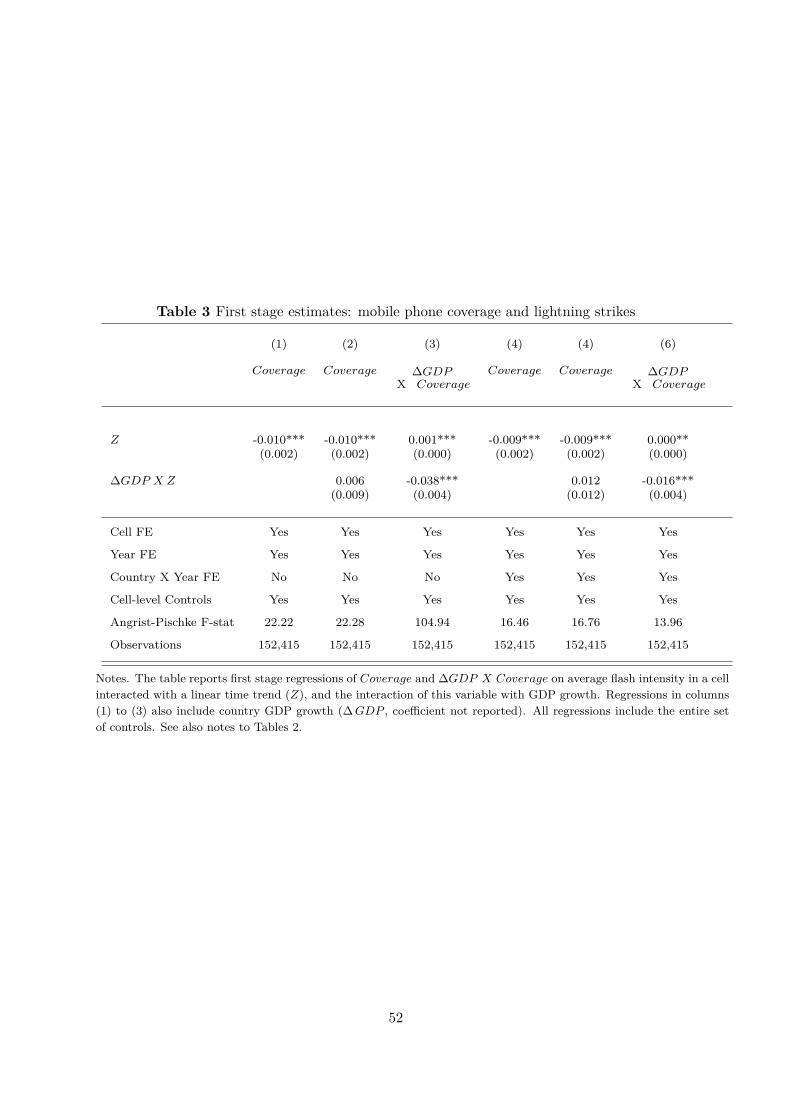
Table 3 First stage estimates: mobile phone coverage and lightning strikes
(1) (2) (3) (4) (4) (6)
Coverage Coverage ∆GDPX Coverage
Coverage Coverage ∆GDPX Coverage
Z -0.010*** -0.010*** 0.001*** -0.009*** -0.009*** 0.000**(0.002) (0.002) (0.000) (0.002) (0.002) (0.000)
∆GDP X Z 0.006 -0.038*** 0.012 -0.016***(0.009) (0.004) (0.012) (0.004)
Cell FE Yes Yes Yes Yes Yes Yes
Year FE Yes Yes Yes Yes Yes Yes
Country X Year FE No No No Yes Yes Yes
Cell-level Controls Yes Yes Yes Yes Yes Yes
Angrist-Pischke F-stat 22.22 22.28 104.94 16.46 16.76 13.96
Observations 152,415 152,415 152,415 152,415 152,415 152,415
Notes. The table reports first stage regressions of Coverage and ∆GDP X Coverage on average flash intensity in a cellinteracted with a linear time trend (Z), and the interaction of this variable with GDP growth. Regressions in columns(1) to (3) also include country GDP growth (∆GDP , coefficient not reported). All regressions include the entire setof controls. See also notes to Tables 2.
52
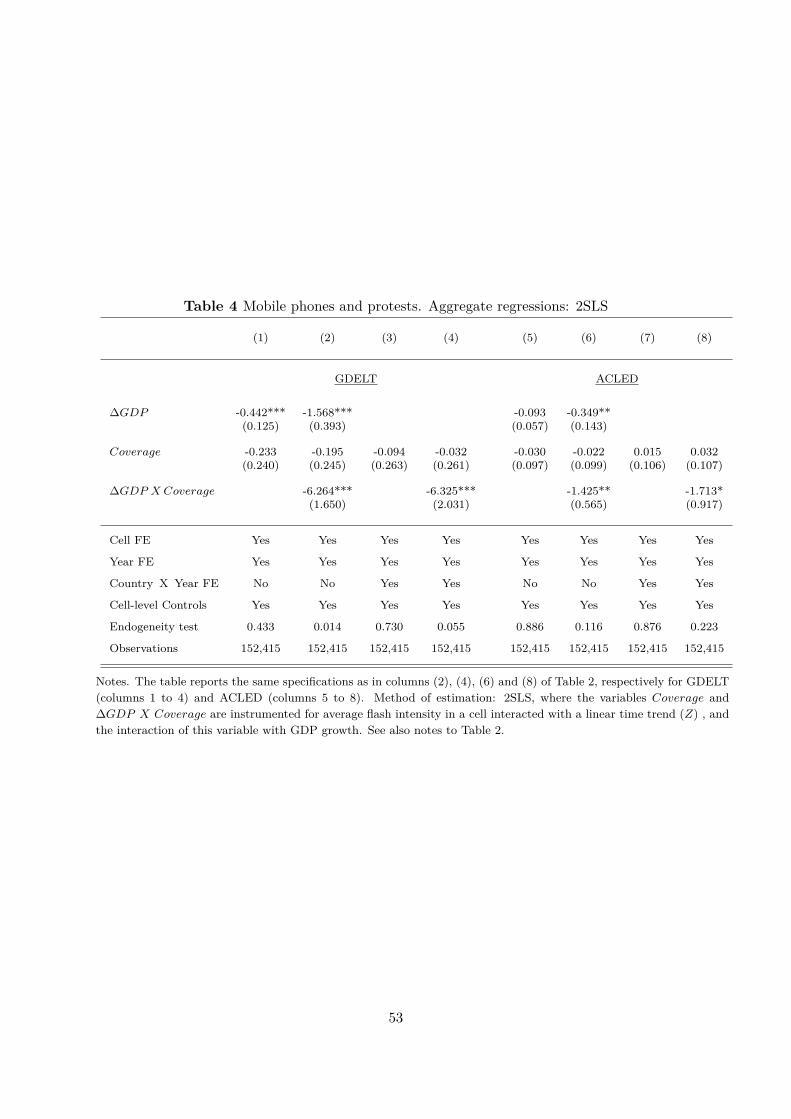
Table 4 Mobile phones and protests. Aggregate regressions: 2SLS
(1) (2) (3) (4) (5) (6) (7) (8)
GDELT ACLED
∆GDP -0.442*** -1.568*** -0.093 -0.349**(0.125) (0.393) (0.057) (0.143)
Coverage -0.233 -0.195 -0.094 -0.032 -0.030 -0.022 0.015 0.032(0.240) (0.245) (0.263) (0.261) (0.097) (0.099) (0.106) (0.107)
∆GDP X Coverage -6.264*** -6.325*** -1.425** -1.713*(1.650) (2.031) (0.565) (0.917)
Cell FE Yes Yes Yes Yes Yes Yes Yes Yes
Year FE Yes Yes Yes Yes Yes Yes Yes Yes
Country X Year FE No No Yes Yes No No Yes Yes
Cell-level Controls Yes Yes Yes Yes Yes Yes Yes Yes
Endogeneity test 0.433 0.014 0.730 0.055 0.886 0.116 0.876 0.223
Observations 152,415 152,415 152,415 152,415 152,415 152,415 152,415 152,415
Notes. The table reports the same specifications as in columns (2), (4), (6) and (8) of Table 2, respectively for GDELT(columns 1 to 4) and ACLED (columns 5 to 8). Method of estimation: 2SLS, where the variables Coverage and∆GDP X Coverage are instrumented for average flash intensity in a cell interacted with a linear time trend (Z) , andthe interaction of this variable with GDP growth. See also notes to Table 2.
53
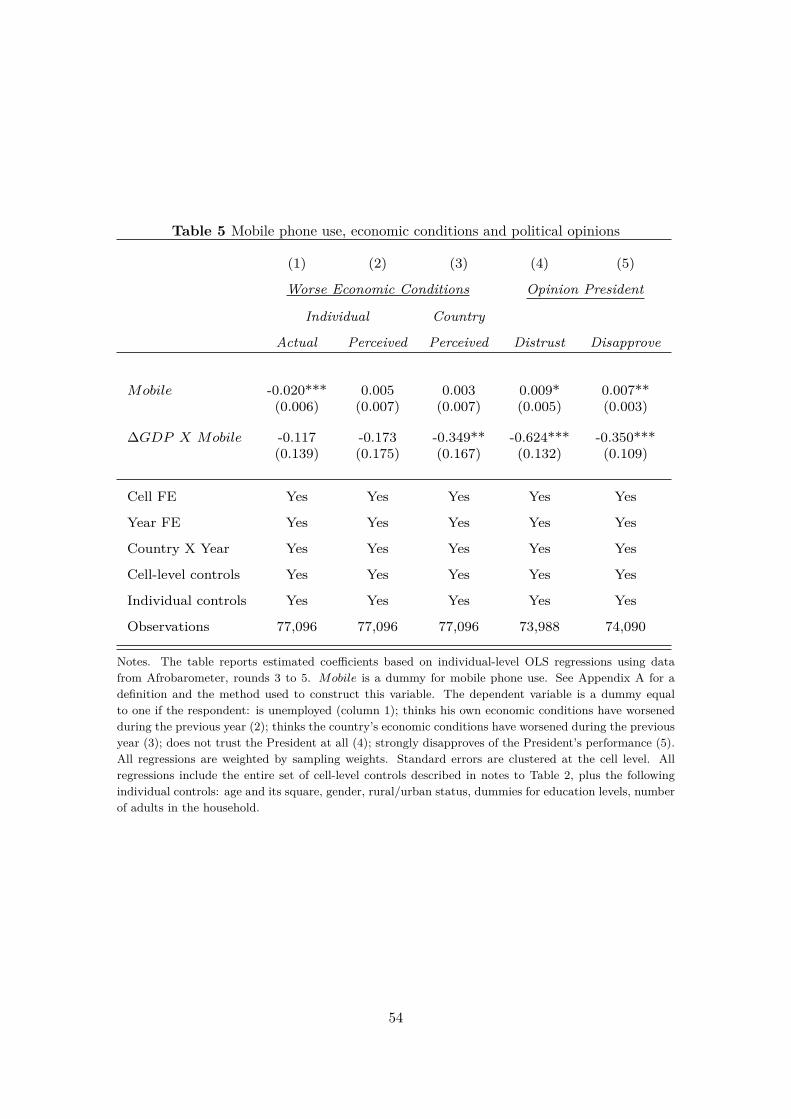
Table 5 Mobile phone use, economic conditions and political opinions
(1) (2) (3) (4) (5)
Worse Economic Conditions Opinion President
Individual Country
Actual Perceived Perceived Distrust Disapprove
Mobile -0.020*** 0.005 0.003 0.009* 0.007**(0.006) (0.007) (0.007) (0.005) (0.003)
∆GDP X Mobile -0.117 -0.173 -0.349** -0.624*** -0.350***(0.139) (0.175) (0.167) (0.132) (0.109)
Cell FE Yes Yes Yes Yes Yes
Year FE Yes Yes Yes Yes Yes
Country X Year Yes Yes Yes Yes Yes
Cell-level controls Yes Yes Yes Yes Yes
Individual controls Yes Yes Yes Yes Yes
Observations 77,096 77,096 77,096 73,988 74,090
Notes. The table reports estimated coefficients based on individual-level OLS regressions using datafrom Afrobarometer, rounds 3 to 5. Mobile is a dummy for mobile phone use. See Appendix A for adefinition and the method used to construct this variable. The dependent variable is a dummy equalto one if the respondent: is unemployed (column 1); thinks his own economic conditions have worsenedduring the previous year (2); thinks the country’s economic conditions have worsened during the previousyear (3); does not trust the President at all (4); strongly disapproves of the President’s performance (5).All regressions are weighted by sampling weights. Standard errors are clustered at the cell level. Allregressions include the entire set of cell-level controls described in notes to Table 2, plus the followingindividual controls: age and its square, gender, rural/urban status, dummies for education levels, numberof adults in the household.
54
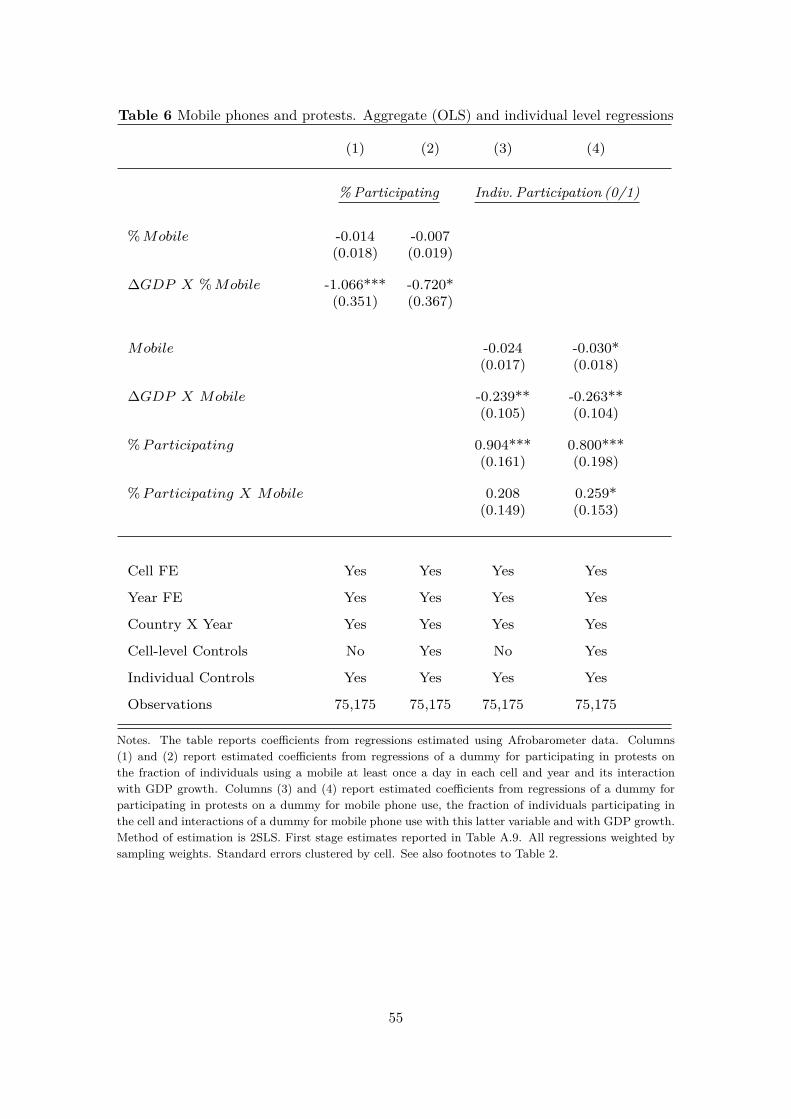
Table 6 Mobile phones and protests. Aggregate (OLS) and individual level regressions
(1) (2) (3) (4)
% Participating Indiv. Participation (0/1)
%Mobile -0.014 -0.007(0.018) (0.019)
∆GDP X %Mobile -1.066*** -0.720*(0.351) (0.367)
Mobile -0.024 -0.030*(0.017) (0.018)
∆GDP X Mobile -0.239** -0.263**(0.105) (0.104)
%Participating 0.904*** 0.800***(0.161) (0.198)
%Participating X Mobile 0.208 0.259*(0.149) (0.153)
Cell FE Yes Yes Yes Yes
Year FE Yes Yes Yes Yes
Country X Year Yes Yes Yes Yes
Cell-level Controls No Yes No Yes
Individual Controls Yes Yes Yes Yes
Observations 75,175 75,175 75,175 75,175
Notes. The table reports coefficients from regressions estimated using Afrobarometer data. Columns(1) and (2) report estimated coefficients from regressions of a dummy for participating in protests onthe fraction of individuals using a mobile at least once a day in each cell and year and its interactionwith GDP growth. Columns (3) and (4) report estimated coefficients from regressions of a dummy forparticipating in protests on a dummy for mobile phone use, the fraction of individuals participating inthe cell and interactions of a dummy for mobile phone use with this latter variable and with GDP growth.Method of estimation is 2SLS. First stage estimates reported in Table A.9. All regressions weighted bysampling weights. Standard errors clustered by cell. See also footnotes to Table 2.
55

A. Appendix figures and tables
Figure A.1 Mobile phone diffusion, Nigeria 1998-2012
Notes. The figure reports the spread of 2G coverage in Nigeria between 1998 and 2012 at 5-years intervals. Source: GSMA.
56

Figure A.2 Geo-located protest events, Cairo 2011
Notes. The figure reports the occurrence of protests in Cairo in 2011 by location. Larger dots correspond to more days ofprotests in a certain location. Source: GDELT.
57
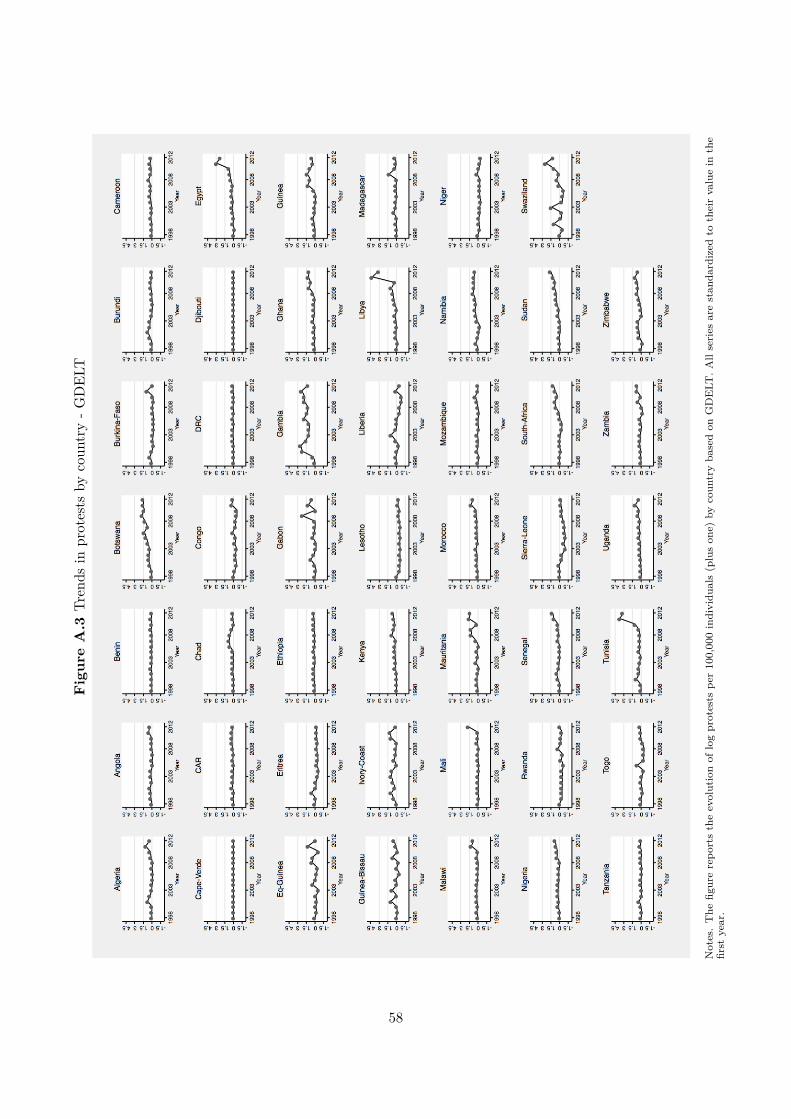
Fig
ure
A.3
Tren
dsin
protests
bycoun
try-G
DEL
T
Notes.The
figurerepo
rtstheevolutionof
logprotests
per100,000individu
als(pluson
e)by
coun
tryba
sedon
GDELT
.Allseries
arestan
dardized
totheirvaluein
the
first
year.
58
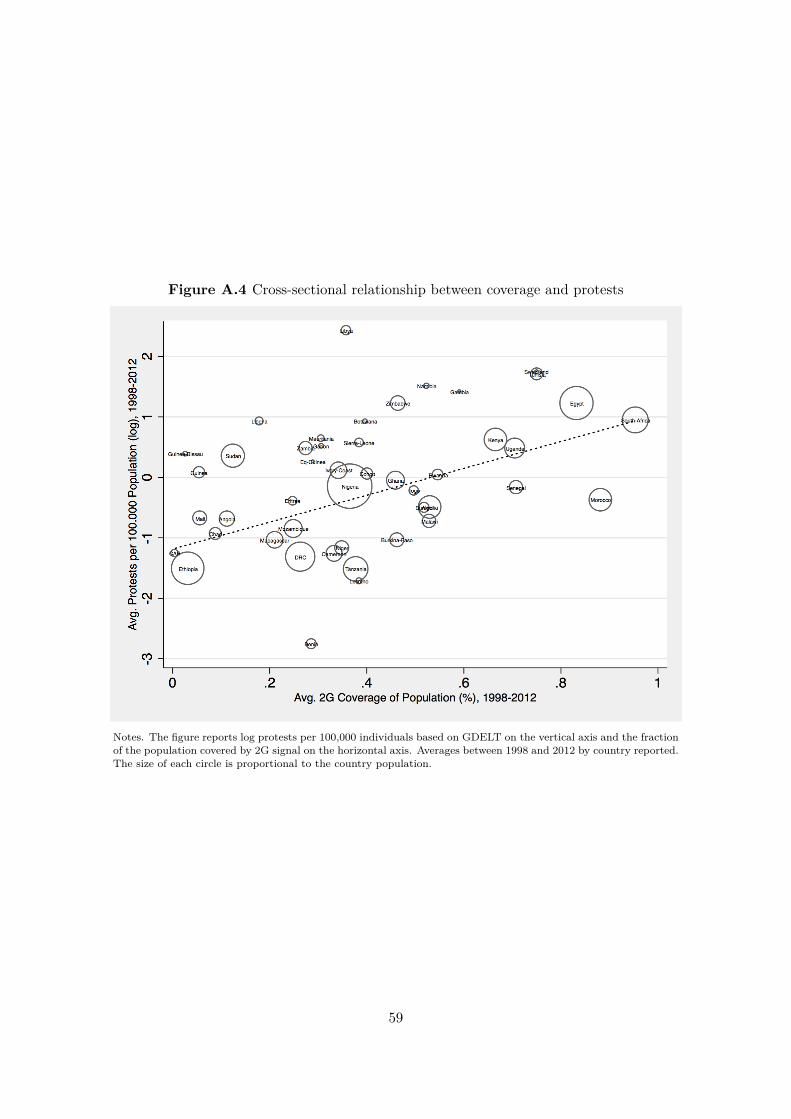
Figure A.4 Cross-sectional relationship between coverage and protests
Notes. The figure reports log protests per 100,000 individuals based on GDELT on the vertical axis and the fractionof the population covered by 2G signal on the horizontal axis. Averages between 1998 and 2012 by country reported.The size of each circle is proportional to the country population.
59

Fig
ure
A.5
Correlatio
nbe
tweenrepo
rted
protests
inGDEL
Tan
dACLE
Dacross
coun
tries
Notes.The
figurerepo
rtslogprotests
per100,00
0individu
alsin
GDELT
(solid
line)
andACLE
D(sho
rt-dashedlin
e)by
coun
tryan
dyear.Residua
lsfrom
regression
son
coun
tryan
dyear
fixed
effects
repo
rted
.
60
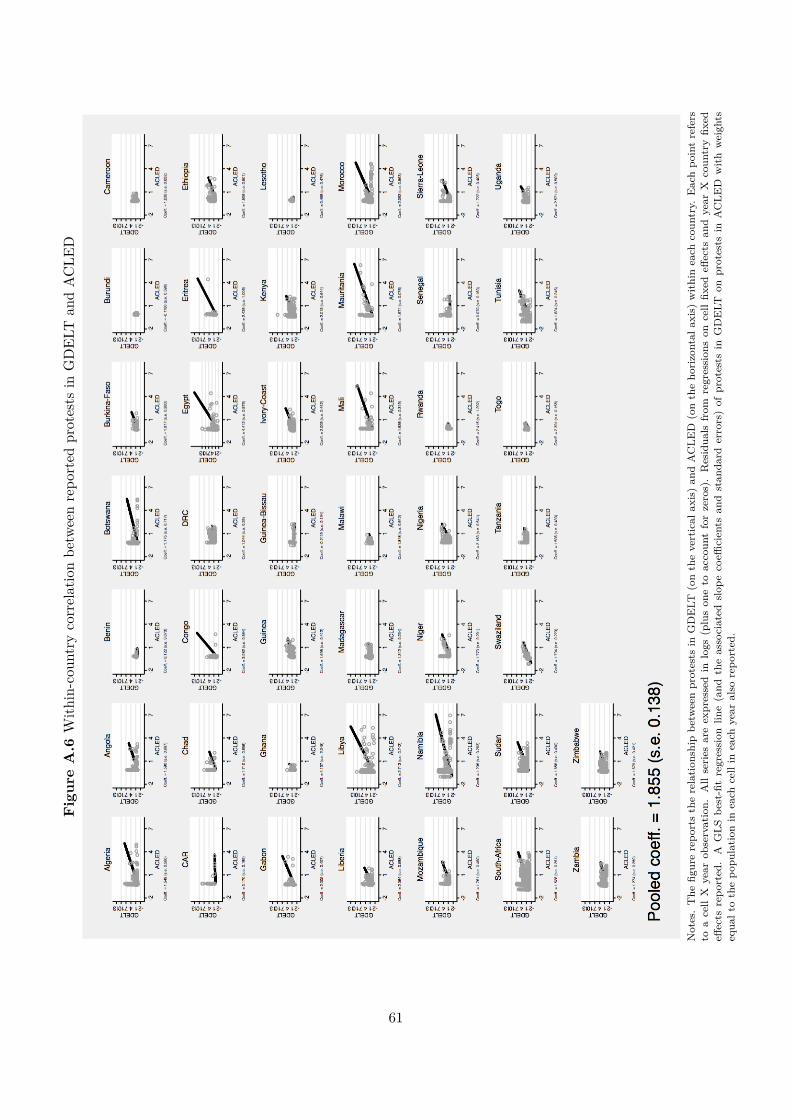
Fig
ure
A.6
With
in-cou
ntry
correlationbe
tweenrepo
rted
protests
inGDEL
Tan
dACLE
D
Notes.The
figurerepo
rtstherelation
ship
betw
eenprotests
inGDELT
(onthevertical
axis)an
dACLE
D(ontheho
rizontal
axis)withineach
coun
try.
Eachpo
intrefers
toacellX
year
observation.
Allseries
areexpressedin
logs
(pluson
eto
accoun
tforzeros).Residua
lsfrom
regression
son
cellfix
edeff
ects
andyear
Xcoun
tryfix
edeff
ects
repo
rted.A
GLS
best-fitregression
line(and
theassociated
slop
ecoeffi
cients
andstan
dard
errors)of
protests
inGDELT
onprotests
inACLE
Dwithweigh
tsequa
ltothepo
pulation
ineach
cellin
each
year
also
repo
rted.
61
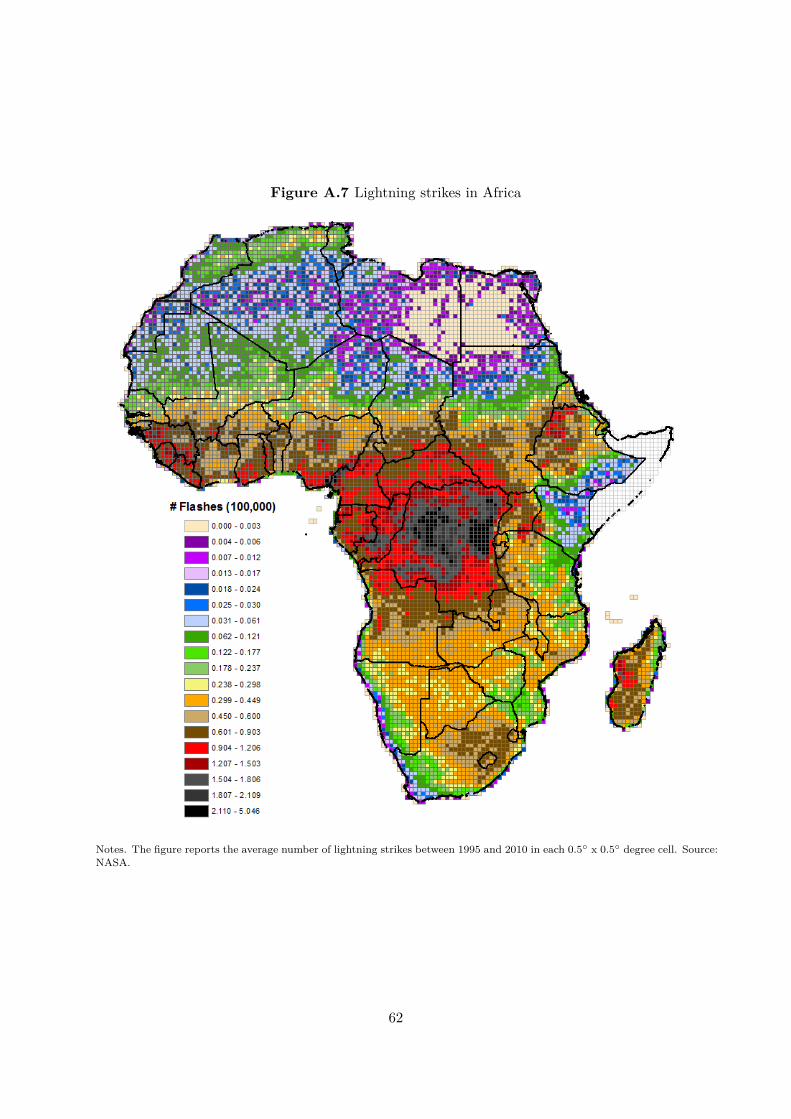
Figure A.7 Lightning strikes in Africa
Notes. The figure reports the average number of lightning strikes between 1995 and 2010 in each 0.5 x 0.5 degree cell. Source:NASA.
62
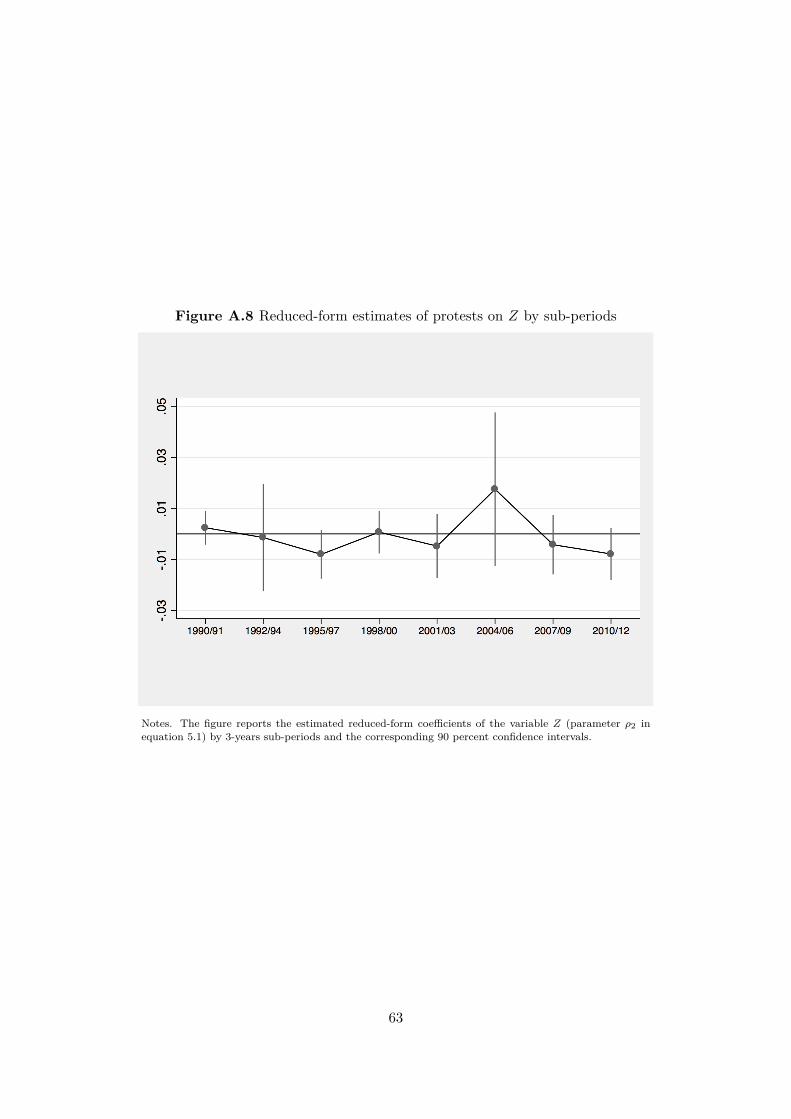
Figure A.8 Reduced-form estimates of protests on Z by sub-periods
Notes. The figure reports the estimated reduced-form coefficients of the variable Z (parameter ρ2 inequation 5.1) by 3-years sub-periods and the corresponding 90 percent confidence intervals.
63

Table A.1 Cell-level covariates
Variable Source Short Description
Population PRIO-GRIDPopulation size for each cell, extracted from the Gridded Population of the World,v.3 (CIESIN 2005). Data are available for 1990, 1995, 2000, and 2005. We obtainthe remaining years by linear interpolation.
Cities (number) GRUMPNumber of cities in the cell at year 2000, calculated in GIS from the Global Rural-Urban Mapping Project, v.1
Border Distance (100 km)Capital Distance (100 km)Coast (dummy)
PRIO-GRID
Border distance calculated from the cell centroid to the border of the nearest neigh-boring country, regardless of whether this is located across international waters.Capital distance calculated from the cell centroid to the national capital city. Ge-ographical coordinates for the capital cities capture changes over time whereverrelevant. Coast is a dummy for the cell being coastal.
Primary Roads (100 km)− Total− Paved− Good conditions
Secondary Roads (100 km)
Africa InfrastructureCountry diagnostic
(ADB)
Geo-referenced roads files are downloaded separately for each country. Data usuallyrefer to network in 2007, and are discussed in Gwilliam et al. (2008). For each cellwe calculate the road network in GIS. Country-specific files are not available forNorth-African countries. In this case, data are obtained from the Roads of Africadataset, but lack information on roads conditions.
Electricity (100 km)
Africa InfrastructureCountry diagnostic
(ADB)
Geo-referenced electricity files are available from the ADB dataset for all countries,except Egypt, Libya and Morocco. For these countries, data are obtained from theOpenstreetmap project. Data usually refer to the network in 2007. For each cellwe calculate the electricity network in GIS.
Travel T ime nearest city :pop. ≥ 50K (hours)
PRIO-GRID
Estimated cell-average travel time (in hours) by land transportation from the cellcentroid to the nearest major city with more than 50,000 inhabitants. The valuesare extracted from a global high-resolution raster map of accessibility, where timereflects the average pixel value within each cell.
Infant Mortality Rate (h) PRIO-GRID
The cell-specific infant mortality rate is based on raster data from the SEDACGlobal Poverty Mapping project. The variable is the average pixel value inside thegrid cell. The unit is the number of children per 10,000 that die before reachingtheir first birthday. The indicator is available for the year 2000.
Mountain (%)Forest (%)Irrigated (%)
PRIO-GRID
Mountain is the share of mountainous terrain within each cell. This indicator isbased on high-resolution mountain raster data from the UNEP’s Mountain WatchReport 2002. Forest is the share of forest cover in a cell extracted from the Globcover2009 dataset. Irrigation is the share of area equipped for irrigation within each cellfrom the FAO Aquastat irrigation raster.
Conflict (dummy) PRIO-GRIDThe dummy indicates whether the grid cell is located in a conflict zone in each givenyear, from the Conflict Site coding, v.3 (Dittrich Hallberg 2012). The indicatorcontains time-varying values for the period 1998-2008.
Diamonds (dummy)Diamond dataset
PRIOThe variable includes any site with known activity, meaning production or confirmeddiscovery. For each cell we calculate the presence of a diamond mine in GIS.
Oil (%)Petroleum dataset
PRIOThe petroleum dataset groups oil fields in polygons within a buffer distance of 30km For each cell we calculate the percentage that is covered by an oil-field in GIS.
Mineral (dummy)U.S. Geological
SurveyFor each site it is reported the exact location and type of mineral, as well as themagnitude of production. For each cell we calculate the presence of a mine in GIS.
Temperature (Celsius)Precipitation (mm.)Drought (number of years)Avg. Distance from drought (100 km)
PRIO-GRID
Temperature and precipitation are the yearly mean temperature and total amountof precipitation in the cell, from the University of Delaware (NOAA 2011). Wecalculate the average for the period 1946-2008. Drought is number of years during1998-2012 in which the cell is subject to drought, measured as within-year deviationsfrom average. The measure is coded 1 if at least three consecutive months weremore than 1 standard deviation away from the average monthly values. Distancefrom drought is the average distance over the period 1998-2012 to the nearest cellincurring a drought.
Flashrate (per km2 per year) GHCC/NASA
Data refer to lightning activity calculated from the Optical Transient Detector(OTD) and the Lightning Imaging Sensor (LIS). Each flash is recorded along withits spatial location (latitude, longitude) with a level of resolution of 5-10 km on theground. The GHCC calculates the average flash density in 0.5 x 0.5 grid cellsover the period 1995-2010.
64
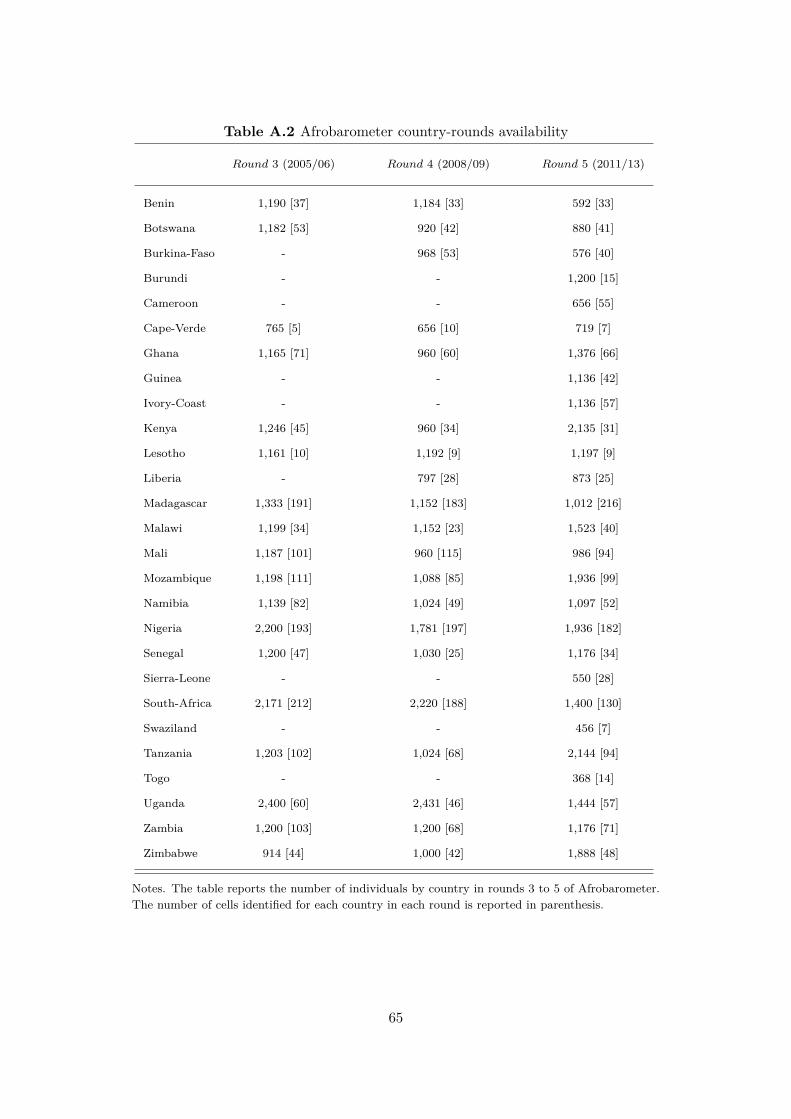
Table A.2 Afrobarometer country-rounds availability
Round 3 (2005/06) Round 4 (2008/09) Round 5 (2011/13)
Benin 1,190 [37] 1,184 [33] 592 [33]
Botswana 1,182 [53] 920 [42] 880 [41]
Burkina-Faso - 968 [53] 576 [40]
Burundi - - 1,200 [15]
Cameroon - - 656 [55]
Cape-Verde 765 [5] 656 [10] 719 [7]
Ghana 1,165 [71] 960 [60] 1,376 [66]
Guinea - - 1,136 [42]
Ivory-Coast - - 1,136 [57]
Kenya 1,246 [45] 960 [34] 2,135 [31]
Lesotho 1,161 [10] 1,192 [9] 1,197 [9]
Liberia - 797 [28] 873 [25]
Madagascar 1,333 [191] 1,152 [183] 1,012 [216]
Malawi 1,199 [34] 1,152 [23] 1,523 [40]
Mali 1,187 [101] 960 [115] 986 [94]
Mozambique 1,198 [111] 1,088 [85] 1,936 [99]
Namibia 1,139 [82] 1,024 [49] 1,097 [52]
Nigeria 2,200 [193] 1,781 [197] 1,936 [182]
Senegal 1,200 [47] 1,030 [25] 1,176 [34]
Sierra-Leone - - 550 [28]
South-Africa 2,171 [212] 2,220 [188] 1,400 [130]
Swaziland - - 456 [7]
Tanzania 1,203 [102] 1,024 [68] 2,144 [94]
Togo - - 368 [14]
Uganda 2,400 [60] 2,431 [46] 1,444 [57]
Zambia 1,200 [103] 1,200 [68] 1,176 [71]
Zimbabwe 914 [44] 1,000 [42] 1,888 [48]
Notes. The table reports the number of individuals by country in rounds 3 to 5 of Afrobarometer.The number of cells identified for each country in each round is reported in parenthesis.
65
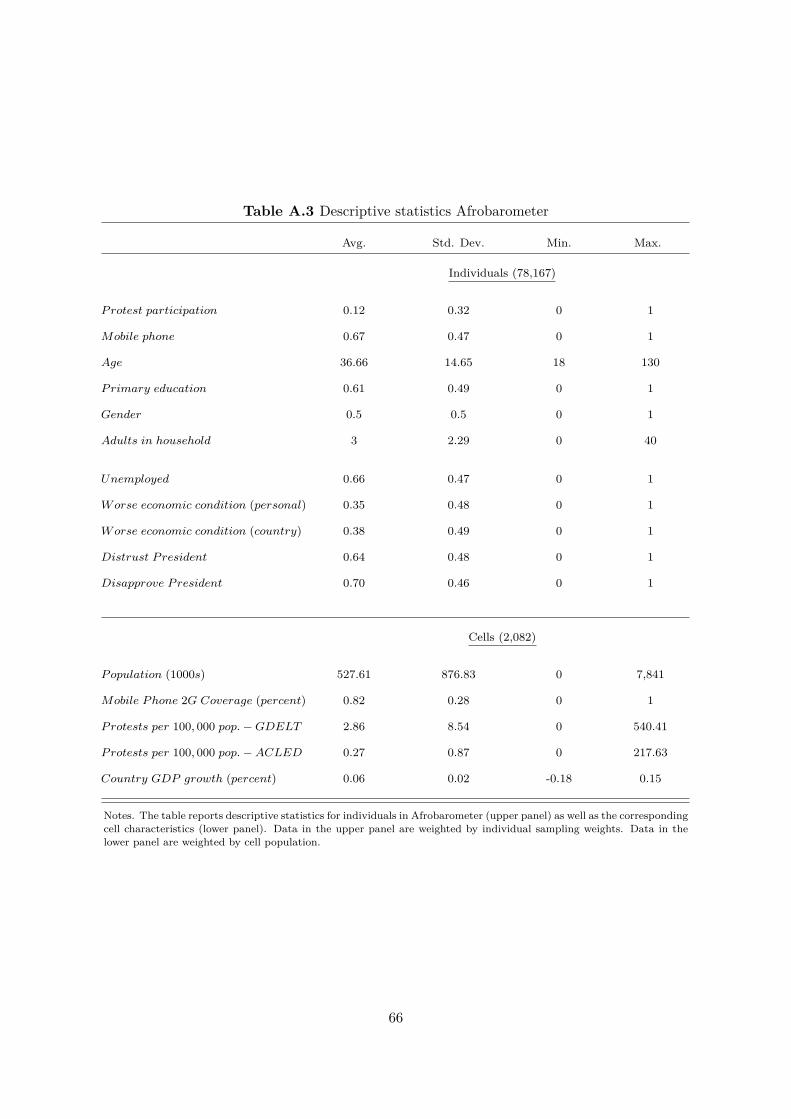
Table A.3 Descriptive statistics Afrobarometer
Avg. Std. Dev. Min. Max.
Individuals (78,167)
Protest participation 0.12 0.32 0 1
Mobile phone 0.67 0.47 0 1
Age 36.66 14.65 18 130
Primary education 0.61 0.49 0 1
Gender 0.5 0.5 0 1
Adults in household 3 2.29 0 40
Unemployed 0.66 0.47 0 1
Worse economic condition (personal) 0.35 0.48 0 1
Worse economic condition (country) 0.38 0.49 0 1
Distrust President 0.64 0.48 0 1
Disapprove President 0.70 0.46 0 1
Cells (2,082)
Population (1000s) 527.61 876.83 0 7,841
Mobile Phone 2G Coverage (percent) 0.82 0.28 0 1
Protests per 100, 000 pop.−GDELT 2.86 8.54 0 540.41
Protests per 100, 000 pop.−ACLED 0.27 0.87 0 217.63
Country GDP growth (percent) 0.06 0.02 -0.18 0.15
Notes. The table reports descriptive statistics for individuals in Afrobarometer (upper panel) as well as the correspondingcell characteristics (lower panel). Data in the upper panel are weighted by individual sampling weights. Data in thelower panel are weighted by cell population.
66
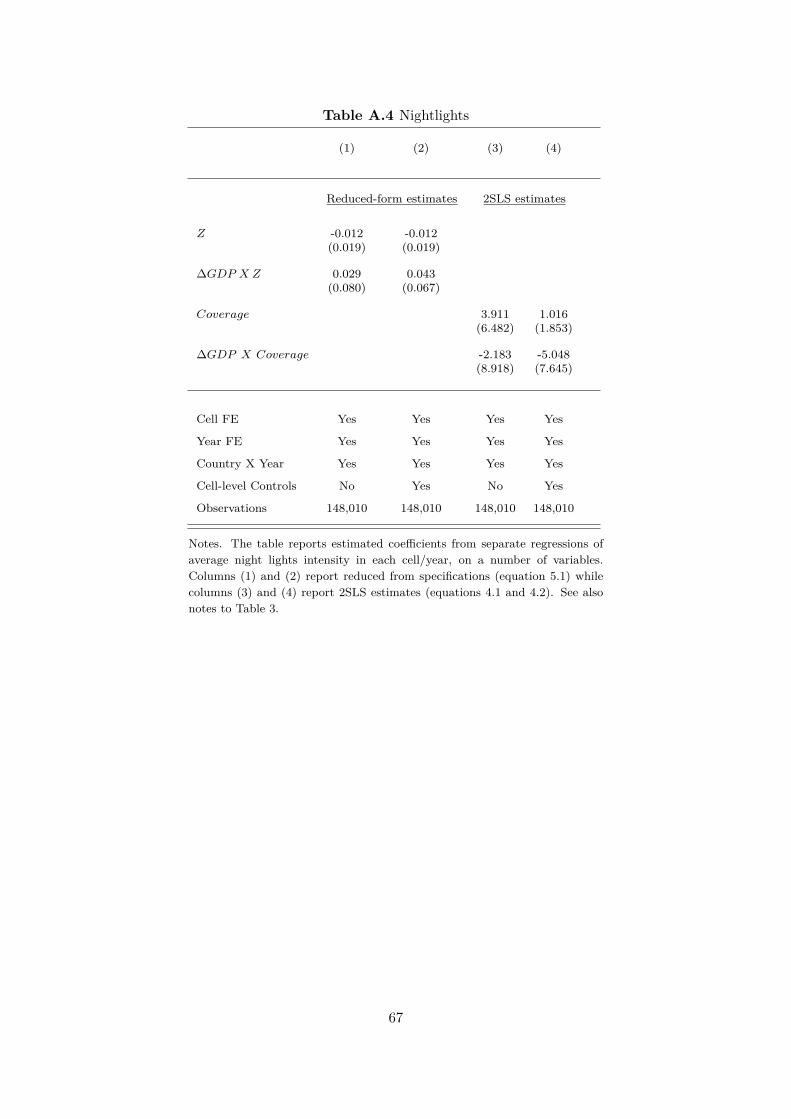
Table A.4 Nightlights
(1) (2) (3) (4)
Reduced-form estimates 2SLS estimates
Z -0.012 -0.012(0.019) (0.019)
∆GDP X Z 0.029 0.043(0.080) (0.067)
Coverage 3.911 1.016(6.482) (1.853)
∆GDP X Coverage -2.183 -5.048(8.918) (7.645)
Cell FE Yes Yes Yes Yes
Year FE Yes Yes Yes Yes
Country X Year Yes Yes Yes Yes
Cell-level Controls No Yes No Yes
Observations 148,010 148,010 148,010 148,010
Notes. The table reports estimated coefficients from separate regressions ofaverage night lights intensity in each cell/year, on a number of variables.Columns (1) and (2) report reduced from specifications (equation 5.1) whilecolumns (3) and (4) report 2SLS estimates (equations 4.1 and 4.2). See alsonotes to Table 3.
67

Table A.5 Robustness checks: 2SLS
(1) (2) (3) (4) (5)
S.e. clustered Country One protest Square root I(∆GDP > 0)at country level trends per day protest
GDELT
Coverage -0.032 -1.078 -0.065 -0.001 1.178**(0.284) (1.315) (0.204) (0.001) (0.478)
∆GDP X Coverage -6.325** -8.963*** -5.317*** -0.040***(2.850) (3.216) (1.600) (0.012)
I(∆GDP > 0) X Coverage -1.185***(0.346)
ACLED
Coverage 0.032 0.214 0.009 0.000 0.110(0.154) (0.308) (0.103) (0.000) (0.221)
∆GDP X Coverage -1.713** -1.635 -1.782** -0.007*(0.760) (1.029) (0.855) (0.004)
I(∆GDP > 0) X Coverage -0.089(0.179)
Cell FE Yes Yes Yes Yes Yes
Year FE Yes Yes Yes Yes Yes
Country X Year FE Yes Yes Yes Yes Yes
Cell-level Controls Yes Yes Yes Yes Yes
Observations 152,415 152,415 152,415 152,415 152,415
Notes. The table reports the same specification as in columns (4) and (8) of Table 4. The upper panel refers toGDELT while the lower panel refers to ACLED. Column (1) reports standard errors clustered at the country level.Column (2) controls for cell-specific cross-sectional characteristics interacted with country-specific linear trends. Incolumn (3) the dependent variable is defined as number of days of protests in a given cell/year. In column (4) thedependent variable is the square root of the number of protests per capita. In column (5) Coverage is interactedwith a dummy for positive GDP growth. See also notes to Table 4.
68
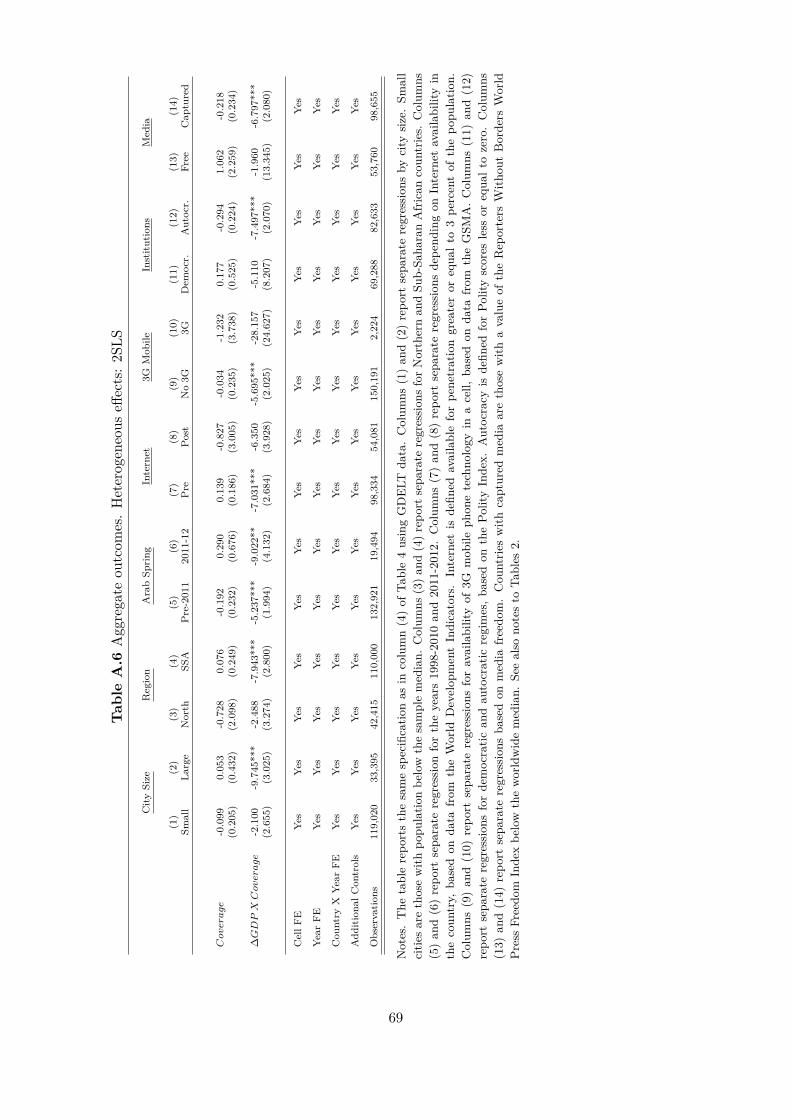
Tab
leA
.6Agg
rega
teou
tcom
es.Heterog
eneous
effects:2S
LS
City
Size
Region
ArabSp
ring
Internet
3GMob
ileInstitutions
Media
(1)
(2)
(3)
(4)
(5)
(6)
(7)
(8)
(9)
(10)
(11)
(12)
(13)
(14)
Small
Large
North
SSA
Pre-201
120
11-12
Pre
Post
No3G
3GDem
ocr.
Autocr.
Free
Cap
tured
Coverage
-0.099
0.05
3-0.728
0.07
6-0.192
0.29
00.139
-0.827
-0.034
-1.232
0.17
7-0.294
1.06
2-0.218
(0.205
)(0.432
)(2.098
)(0.249
)(0.232
)(0.676
)(0.186
)(3.005
)(0.235
)(3.738
)(0.525
)(0.224
)(2.259
)(0.234
)
∆GDPXCoverage
-2.100
-9.745
***
-2.488
-7.943
***
-5.237
***
-9.022
**-7.031
***
-6.350
-5.695
***
-28.15
7-5.110
-7.497
***
-1.960
-6.797
***
(2.655
)(3.025
)(3.274
)(2.800
)(1.994
)(4.132
)(2.684
)(3.928
)(2.025
)(24.62
7)(8.207)
(2.070
)(13.34
5)(2.080
)
CellF
EYes
Yes
Yes
Yes
Yes
Yes
Yes
Yes
Yes
Yes
Yes
Yes
Yes
Yes
YearFE
Yes
Yes
Yes
Yes
Yes
Yes
Yes
Yes
Yes
Yes
Yes
Yes
Yes
Yes
Cou
ntry
XYearFE
Yes
Yes
Yes
Yes
Yes
Yes
Yes
Yes
Yes
Yes
Yes
Yes
Yes
Yes
Add
itiona
lCon
trols
Yes
Yes
Yes
Yes
Yes
Yes
Yes
Yes
Yes
Yes
Yes
Yes
Yes
Yes
Observation
s11
9,02
033
,395
42,415
110,00
013
2,92
119
,494
98,334
54,081
150,19
12,22
469
,288
82,633
53,760
98,655
Notes.The
tablerepo
rtsthesamespecificatio
nas
incolumn(4)of
Table4usingGDELT
data.Colum
ns(1)an
d(2)repo
rtsepa
rate
regression
sby
city
size.Sm
all
citie
sarethosewith
popu
latio
nbe
low
thesamplemed
ian.
Colum
ns(3)an
d(4)repo
rtsepa
rate
regression
sforNorthernan
dSu
b-Sa
haranAfrican
coun
tries.
Colum
ns(5)an
d(6)repo
rtsepa
rate
regression
fortheyears1998-2010an
d2011-2012.
Colum
ns(7)an
d(8)repo
rtsepa
rate
regression
sdepe
ndingon
Internet
availabilityin
thecoun
try,
basedon
data
from
theWorld
Develop
mentIndicators.Internet
isde
fined
availableforpe
netrationgreateror
equa
lto
3pe
rcentof
thepo
pulatio
n.Colum
ns(9)an
d(10)
repo
rtsepa
rate
regression
sforavailabilityof
3Gmob
ileph
onetechno
logy
inacell,
basedon
data
from
theGSM
A.Colum
ns(11)
and(12)
repo
rtsepa
rate
regression
sforde
mocratic
andau
tocratic
regimes,b
ased
onthePo
lityInde
x.Autocracy
isde
fined
forPo
lityscores
less
orequa
ltozero.Colum
ns(13)
and(14)
repo
rtsepa
rate
regression
sba
sedon
med
iafreedo
m.Cou
ntrie
swith
captured
med
iaarethosewith
avalueof
theRep
orters
With
outBorde
rsWorld
Press
Freedo
mInde
xbe
low
theworldwidemed
ian.
Seealso
notesto
Tables
2.
69

Table A.7 Individual correlates of protest participation and mobile phone use
(1) (2)
Protest Participation Mobile phone use
Age/100 0.193*** 2.580***(0.043) (0.244)
Age/100 sq. -0.270*** -3.410***(0.045) (0.283)
Female -0.035*** -0.221***(0.003) (0.013)
City 0.005 0.433***(0.004) (0.028)
Adults in household 0.004*** 0.022***(0.001) (0.003)
Informal ed. -0.003 0.393***(0.007) (0.046)
Incomplete primary 0.009* 0.432***(0.005) (0.027)
Completed primary 0.017*** 0.789***(0.005) (0.029)
Incomplete sec. 0.041*** 0.989***(0.006) (0.030)
Completed sec. 0.033*** 1.267***(0.006) (0.033)
Some tertiary (not college) 0.048*** 1.531***(0.007) (0.051)
Some College 0.133*** 1.525***(0.013) (0.068)
Completed college 0.076*** 1.682***(0.010) (0.057)
Post− graduate 0.116*** 1.813***(0.027) (0.142)
Coverage 0.378***(0.060)
Cell FE Yes No
Country FE Yes Yes
Year FE Yes Yes
Country X Year FE Yes No
Cell-level Controls Yes No
Observations 75,175 30,465
Notes. The table reports individual-level regressions based on Afrobarometerdata. The dependent variable in column (1) is a dummy variable equal to 1 ifthe respondent attended a demonstration or protest during the previous year; incolumn (2) is an ordered variable for frequency of mobile phone use (from 0 or“never” to 4 or “several times a day”). This latter variable is only available forRound 5. Method of estimation in column (1): OLS; in column (2): Ordered Pro-bit (marginal coefficients reported). Regressions weighted by individual samplingweights. Standard errors clustered by cell.
70
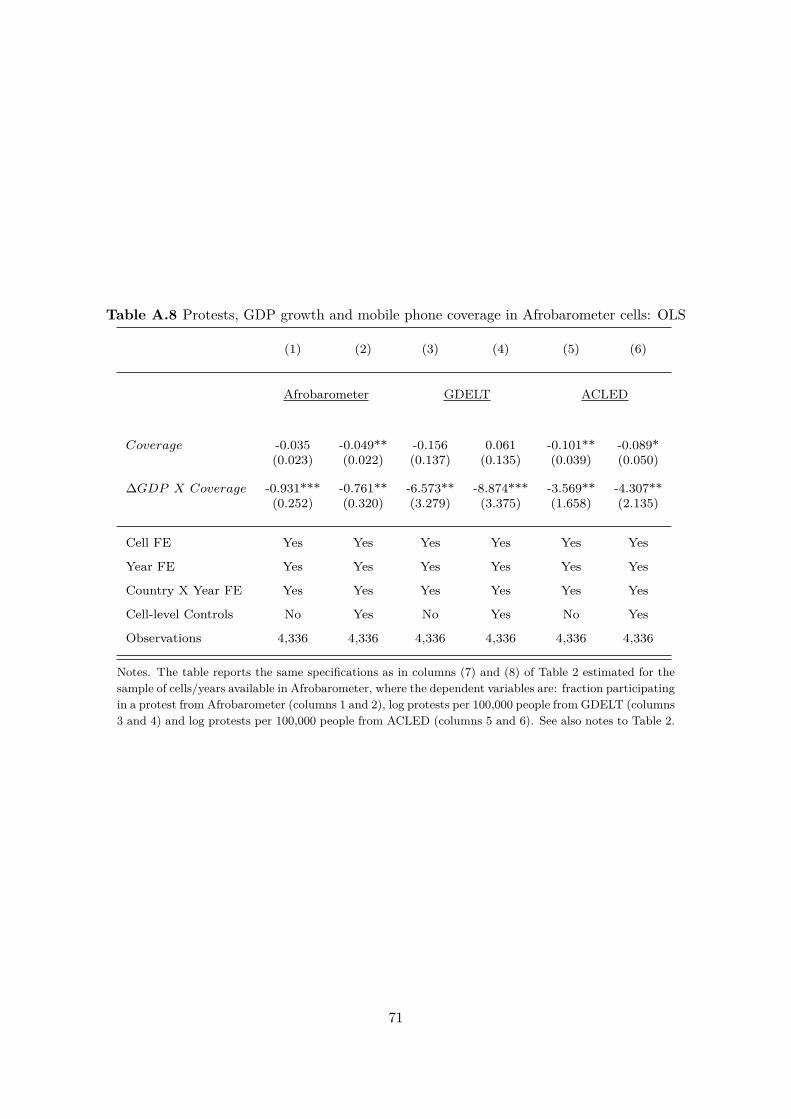
Table A.8 Protests, GDP growth and mobile phone coverage in Afrobarometer cells: OLS
(1) (2) (3) (4) (5) (6)
Afrobarometer GDELT ACLED
Coverage -0.035 -0.049** -0.156 0.061 -0.101** -0.089*(0.023) (0.022) (0.137) (0.135) (0.039) (0.050)
∆GDP X Coverage -0.931*** -0.761** -6.573** -8.874*** -3.569** -4.307**(0.252) (0.320) (3.279) (3.375) (1.658) (2.135)
Cell FE Yes Yes Yes Yes Yes Yes
Year FE Yes Yes Yes Yes Yes Yes
Country X Year FE Yes Yes Yes Yes Yes Yes
Cell-level Controls No Yes No Yes No Yes
Observations 4,336 4,336 4,336 4,336 4,336 4,336
Notes. The table reports the same specifications as in columns (7) and (8) of Table 2 estimated for thesample of cells/years available in Afrobarometer, where the dependent variables are: fraction participatingin a protest from Afrobarometer (columns 1 and 2), log protests per 100,000 people from GDELT (columns3 and 4) and log protests per 100,000 people from ACLED (columns 5 and 6). See also notes to Table 2.
71
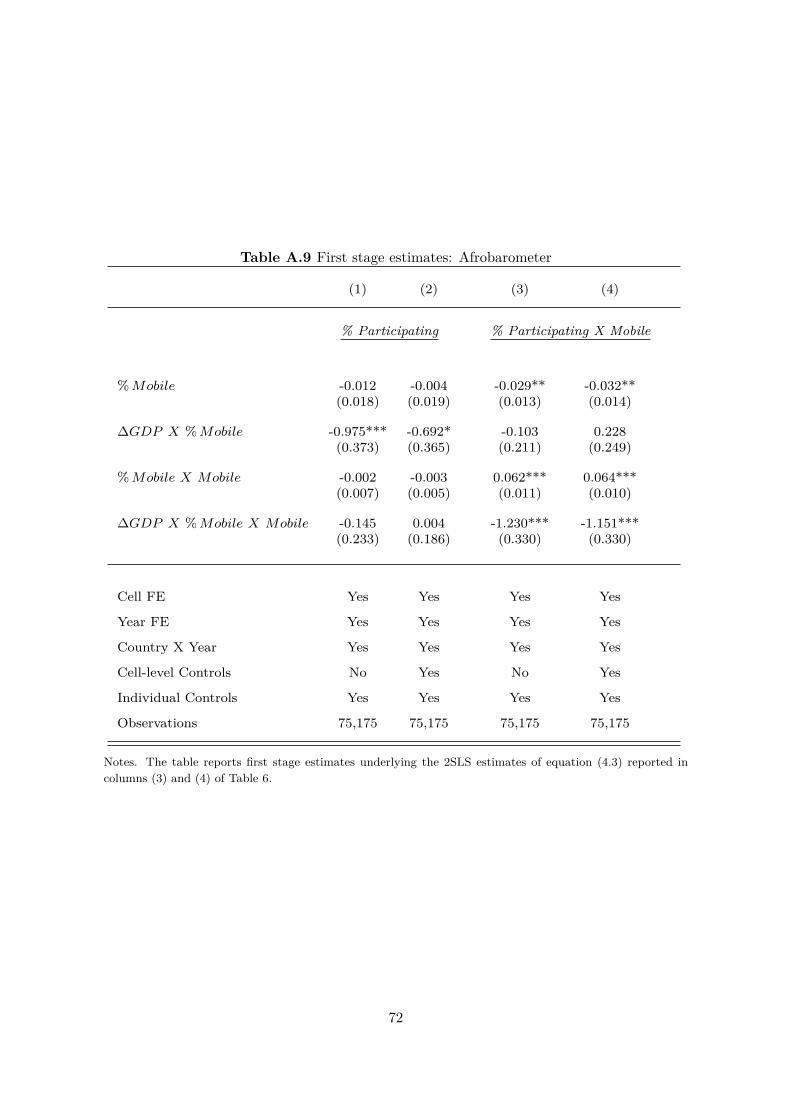
Table A.9 First stage estimates: Afrobarometer
(1) (2) (3) (4)
% Participating % Participating X Mobile
%Mobile -0.012 -0.004 -0.029** -0.032**(0.018) (0.019) (0.013) (0.014)
∆GDP X %Mobile -0.975*** -0.692* -0.103 0.228(0.373) (0.365) (0.211) (0.249)
%Mobile X Mobile -0.002 -0.003 0.062*** 0.064***(0.007) (0.005) (0.011) (0.010)
∆GDP X %Mobile X Mobile -0.145 0.004 -1.230*** -1.151***(0.233) (0.186) (0.330) (0.330)
Cell FE Yes Yes Yes Yes
Year FE Yes Yes Yes Yes
Country X Year Yes Yes Yes Yes
Cell-level Controls No Yes No Yes
Individual Controls Yes Yes Yes Yes
Observations 75,175 75,175 75,175 75,175
Notes. The table reports first stage estimates underlying the 2SLS estimates of equation (4.3) reported incolumns (3) and (4) of Table 6.
72