lesson 9: hot, hotter, hottest extreme weather’s impact on
TRANSCRIPT
LESSON 9: HOT, HOTTER, HOTTEST Extreme Weather’s Impact on Our Resources
GRADE LEVEL
Grades 5-8
TIME TO COMPLETE
1 hour 45 min to 2.5 hours
To be split as it meets your class needs
PREREQUISITE KNOWLEDGE
Analyzing maps
Working definition for climate
change/global warming-found in the
introduction to NAAEES’s Guidelines for
K-12 Climate Change Education
LEARNING OUTCOMES
Analyze drought maps to understand the
effects associated with drought.
Make connections between drought and
local and state communities.
TEACHER BACKGROUND
Overview:
Scientists project global warming will bring more uncertainty,
potentially causing both more extremely dry periods and more
heavy rainfall events. These extreme weather events will
exacerbate the problems we face with water management and
protection in the U.S.
Global warming is shifting precipitation patterns and also
increasing evaporation rates. These trends will create persistently
drier conditions in some places, including the American
Southwest. At the same time, they will intensify the periodic
droughts that affect other regions of the country. These longer
and drier droughts will have major consequences for water
supply, agriculture and wildlife. Although the American Southeast
is typically thought of as having abundant water supplies, recent
droughts have served as a wakeup call for the region.
It is important to relay to students that Global warming is making
hot days hotter, rainfall and flooding heavier, hurricanes stronger
and droughts more severe. Do your best to relate these extreme
weather events to your local region. This intensification of
weather and climate extremes will be the most visible impact of
global warming in our everyday lives. People who have the least
ability to cope with these changes--the poor, very old, very young,
or sick--are the most vulnerable.
Preparation:
Make copies of maps needed for lesson.
If you have not done so please read NAAEE’s Guidelines
for K-12 Climate Change Education found under Best
Practices or at
http://www.naeeuk.plus.com/NAAEE%20on%20Climate%
20Change%20Education.pdf
Helpful Hints:
If you are not current on climate change knowledge please read
National Wildlife’s position: http://www.nwf.org/Global-
Warming/What-is-Global-Warming.aspx
Lesson 9: Hot, Hotter, Hottest Extreme Weather’s Impact on our Resources
2
ENGAGE
Student Grouping-whole class, Time: 10-15 min. pair, individual Essential Questions: A. How have you noticed weather patterns
change over time? Directions: 1. Have a discussion with students about
noticeable weather changes they have observed, whether they be changes in temperature and/or precipitation. This will give you a baseline as to their current observations regarding extreme weather events.
2. Think-Pair-Share: a. Think: Have students write 3 general
observations in their science notebook regarding the US Drought Monitor Map.
b. Pair: Turn to nearest partner and share general observations.
c. Share: Have a short class discussion where a number of students share their general observations with the entire class. *NOTE* Be sure students denote the difference between “S” and “L” on the US Drought Monitor Map.
EXPLORE
Student Grouping-whole group, Time: 15 min. pairs, individual Essential Questions: B. What can people expect as the result of long
term drought conditions? C. Which region of the US is suffering the greatest
based on the evidence found in the PHDI? D. Has the drought effected you or your family
personally? (most may say no, but many food item prices have significantly increased)
Continued on next page…
STUDENT OBJECTIVES
Students will-
Analyze US drought maps
Examine effects of drought on resources
Relate drought to personal experience
Understand a discrepant event
associated with the Standard
Precipitation Index maps.
MATERIALS
US Drought Monitor Map- Ideal: Each
student has a color copy to input in their
science notebook otherwise print class
set.
Palmer Hydrological Drought Index-
Ideal: Each student has a color copy to
input in their science notebook otherwise
print class set.
ACADEMIC VOCABULARY
Weather, climate, climate change,
agriculture, ecology, scarcity, ecosystems,
long-term (> 6 months), short-term (< 6
months), drought, hydrological (having to do
with water or water cycle)
LESSON LINKS can be found under Web
References at the end of this lesson.
US Drought Map – found on page 5
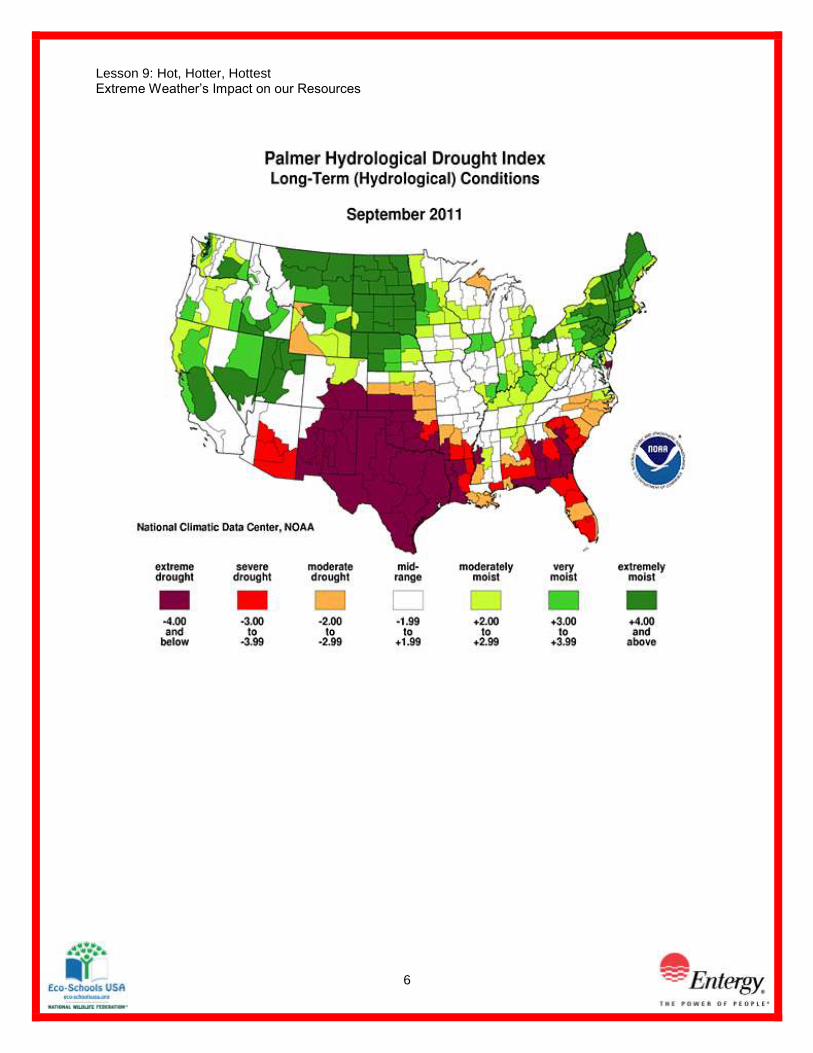
Palmer HDI – found on page 6
Current information regarding climate
change
NAAEE Guidelines for grade appropriate
discussion using climate change
education

Lesson 9: Hot, Hotter, Hottest Extreme Weather’s Impact on our Resources
3
EXPLORE Continued
Directions: 1. Homework: Read-Southern US Report-State of the Climate: Drought *NOTE* may be a
difficult reading for 5th and some 6
th graders to fully comprehend. In this case you may choose
to highlight certain pieces of information to share with your students. 2. Students will focus on the effects seen under different drought conditions using the Palmer
Hydrologic Drought Index, PHDI. Using insight from the US Drought Monitor Map students will predict effects associated with the 2011 drought. Hand out the PHDI and talk with students about what it shows. Note that this index depicts “long term hydrological conditions”.
3. Allow students again to Think/Pair/Share. Using there science notebook students need to answer Essential Questions A-C.
EXPLAIN
Student Groupings-whole group/individual Time: 30-60 min Will depend on how much class/homework time you choose Essential Questions: E. What is a limitation of the PHDI? (no unit of measure, full effects cannot be seen from the index) F. Are there connections between the articles? Explain. G. Now that you have some background regarding the drought and its effect on our resources go
back to Essential Question D, can you add or revise this question based new understanding? How has the drought impacted you and/or your family? Explain by giving specific examples.
H. In your opinion what is causing changes to our weather patterns? What sources helped you come to this conclusion?
I. What are some local/regional concerns that could affect you where you live due to changes in weather patterns?
Directions: 1. Talk through Essential Question E. 2. Do one of the following-
a. Let each student pick a topic to read and print the article for them. b. Set aside computer lab for student to read article of choice. c. Let each student pick a topic to read and ask them to do so for homework. Agriculture: US Drought Costs Exceed $10B http://tucsoncitizen.com/usa-today-news/2011/11/10/usas-drought-costs-exceed-10b/ Grasslands: Drought Endangers Quail http://www.timesrecordnews.com/news/2011/nov/11/drought-endangers-quail/ Water: Water Supply Low in Areas http://www.gosanangelo.com/news/2011/nov/02/water-supply-low-in-areas/ Ecology: Texas Trees: Can Love Overcome Hurricanes, Drought, and Wildfires? http://www.dailykos.com/story/2011/11/04/1032949/-Texas-Trees:-Can-Love-Overcome-Hurricanes,-Drought-and-Wildfires-Part-II:-Drought?via=siderecent
3. Have students answer Essential Questions F-H either during independent work or for homework.
4. The following day allow for a whole class discussion-refer to Helpful Hints for information regarding global warming.
Lesson 9: Hot, Hotter, Hottest Extreme Weather’s Impact on our Resources
4
ELABORATE
Student Grouping-Individual Time: 30-40 min Essential Questions J. Why is there a steady increase in drought conditions from one month to twelve months and then
a significant change in drought conditions for 24 months. Why might this have occurred? (Over the 24 month cycle from 2009-2011, there must have been enough precipitation to offset the extremeness of the drought conditions in 2010-2011.)
K. Could these maps be used to predict negative effects associated with drought? Explain. Directions: 1. Use the Standardized Precipitation Index maps for this lesson. There are six. The maps
need to be printed in color-please make the best decision on printing-suggestion: 1 set of maps per group of 4-6 students.
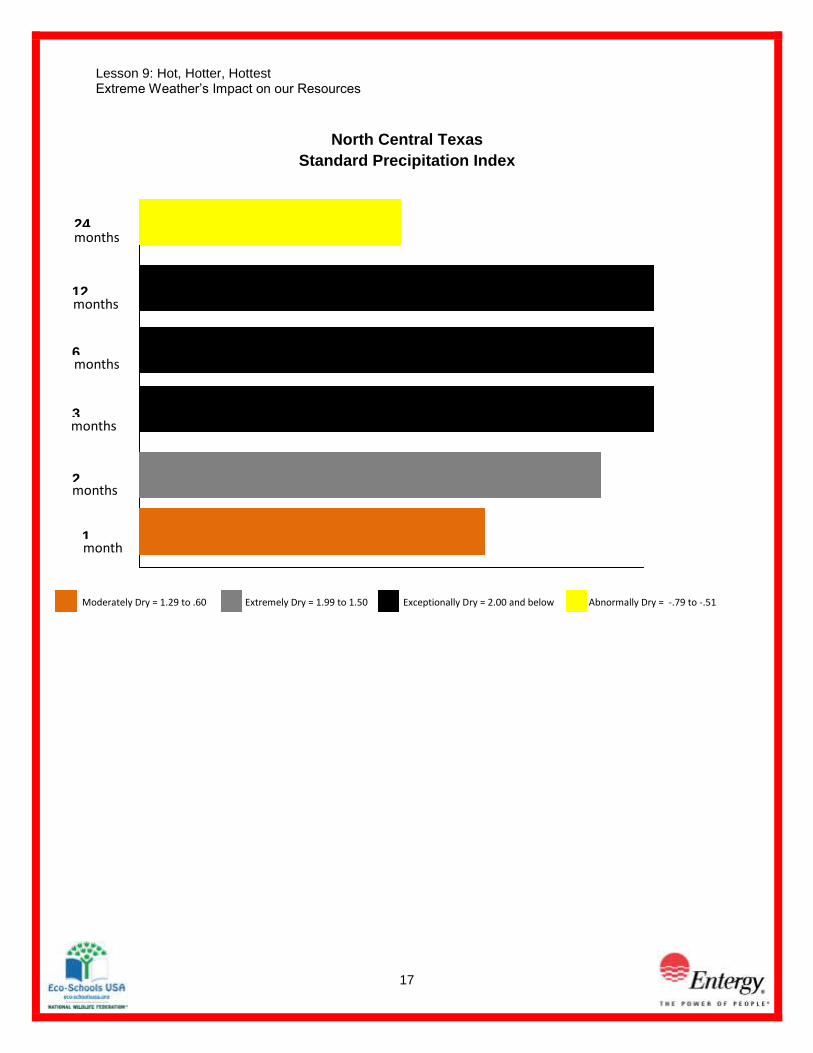
2. Have students create a bar graph depicting precipitation levels for each of the six maps. a. Students will have to decide how the bar graph needs to be designed and data input. b. Graph can be designed using technology or by hand. c. Students need to identify their approximate location on the national map as their point
of data collection. d. Students should use the same colors found in the maps for their graph bars. e. Here is an example if students are having a difficult time beginning.
3. Answer Essential Questions.
EVALUATE
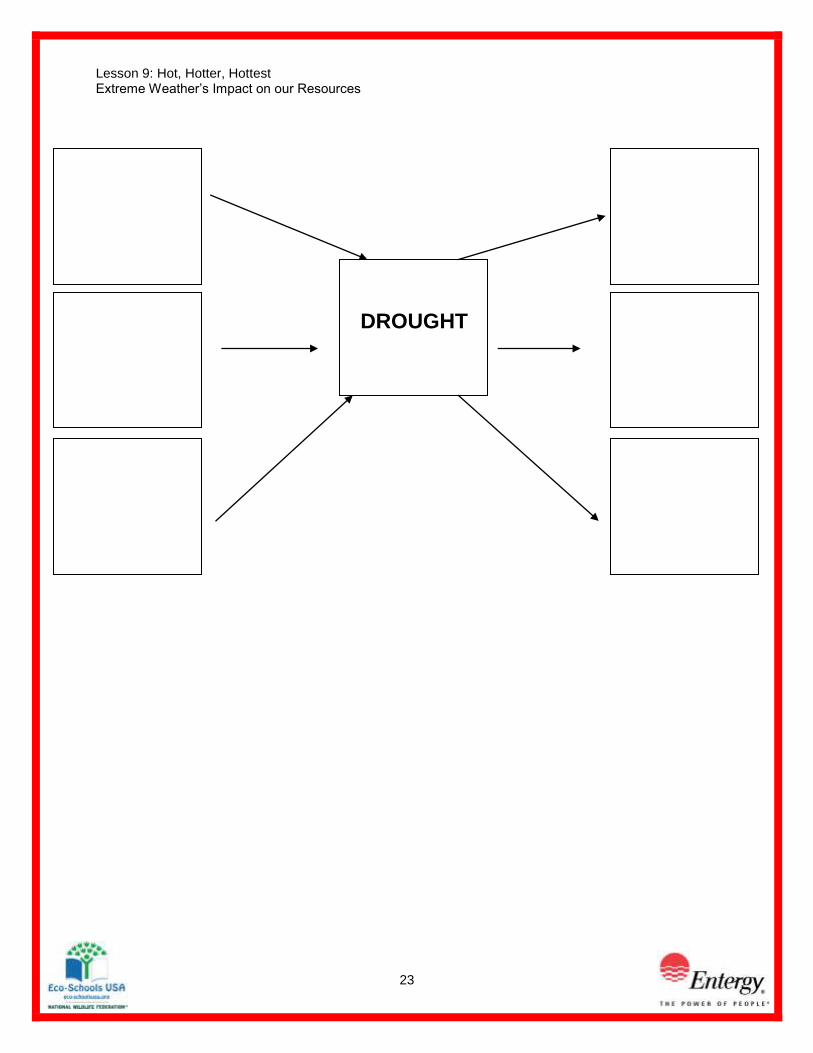
Student Grouping-Individual Time: 20 min Directions: For the following assessment pieces you may choose what best fits your student’s needs or you may allow your students to choose their assessment. 1. Concept Quiz – found on pages 19-21 2. Essay – found on page 22 3. Cause and Effect Thinking Map® - found on pages 23 and 24
Web References
Full Report: September 2011 State of Climate-Drought
http://www.ncdc.noaa.gov/sotc/drought/2011/9
Climate Change
http://www.nwf.org/Global-Warming/What-is-Global-Warming.aspx
NAAEE Guidelines
http://www.naeeuk.plus.com/NAAEE%20on%20Climate%20Change%20Education.pdf

Lesson 9: Hot, Hotter, Hottest Extreme Weather’s Impact on our Resources
5
Lesson 9: Hot, Hotter, Hottest Extreme Weather’s Impact on our Resources
6
Lesson 9: Hot, Hotter, Hottest Extreme Weather’s Impact on our Resources
7
Lesson 9: Hot, Hotter, Hottest Extreme Weather’s Impact on our Resources
8
Lesson 9: Hot, Hotter, Hottest Extreme Weather’s Impact on our Resources
9
Lesson 9: Hot, Hotter, Hottest Extreme Weather’s Impact on our Resources
10
Lesson 9: Hot, Hotter, Hottest Extreme Weather’s Impact on our Resources
11
Lesson 9: Hot, Hotter, Hottest Extreme Weather’s Impact on our Resources
12

Lesson 9: Hot, Hotter, Hottest Extreme Weather’s Impact on our Resources
13
Southern Report: September 2011-State of the Climate-Drought
A product of NOAA
National Drought Overview
Based on the Palmer Drought Index, severe to extreme drought affected about 24 percent of the contiguous United States as of the end of September 2011, a decrease of about 3 percent from last month. About 24 percent of the contiguous U.S. fell in the severely to extremely wet categories.
About 28 percent of the contiguous U.S. fell in the moderate to extreme drought categories (based on the Palmer Drought Index) at the end of September.
On a broad scale, the 1980s and 1990s were characterized by unusual wetness with short periods of extensive droughts, whereas the 1930s and 1950s were characterized by prolonged periods of extensive droughts with little wetness (moderate to extreme drought graphic, severe to extreme drought graphic).
According to the weekly U.S. Drought Monitor, about 29 percent of the contiguous U.S. (about 24 percent of the U.S. including Alaska, Hawaii, and Puerto Rico) was classified as experiencing moderate to exceptional (D1-D4) drought at the end of September.
September 2011 was a warm month with near-average precipitation (eleventh warmest
and 50th driest, based on data back to 1895) when weather conditions were averaged
across the country.
Heavy rain from Tropical Storm Lee early in the month cut a swath from the Central Gulf
Coast to the Northeast, severing the Southeast drought area from the Southern
Plains drought area and
improving conditions along the
edge of the rain shield
The percent area in moderate to
exceptional drought has
decreased from August-
September about 13% points.
Little change occurred in the
extreme to exceptional drought
categories.
Nationally, the moderate-to-
exceptional drought footprint
covered about a fourth of the
country, but about a tenth of the
U.S. remained in the worst
category, exceptional drought.

Lesson 9: Hot, Hotter, Hottest Extreme Weather’s Impact on our Resources
14
Two areas of the southern U.S. experienced the most severe drought in the 1900-
present record, according to the Palmer Hydrological Drought Index (PHDI). The two
regions having the most severe PHDI on record are eastern New Mexico into western
Texas and southwest Oklahoma, and northwestern Louisiana into adjacent eastern
Texas.
The Palmer Drought Index
The Palmer drought indices measure the balance between moisture demand and moisture
supply (precipitation).
Compared with the August 2011 PHDI
map, the September PHDI map
indicates that drought conditions-
intensified in the Southern
Plains
improved in the Mid-Gulf Coast
to the Northeast and parts of
the Midwest to western Great
Lakes
For the Southern Plains and the
Northeast – it rained where it was
already wet and was drier than normal
over the existing drought areas.
Lesson 9: Hot, Hotter, Hottest Extreme Weather’s Impact on our Resources
15
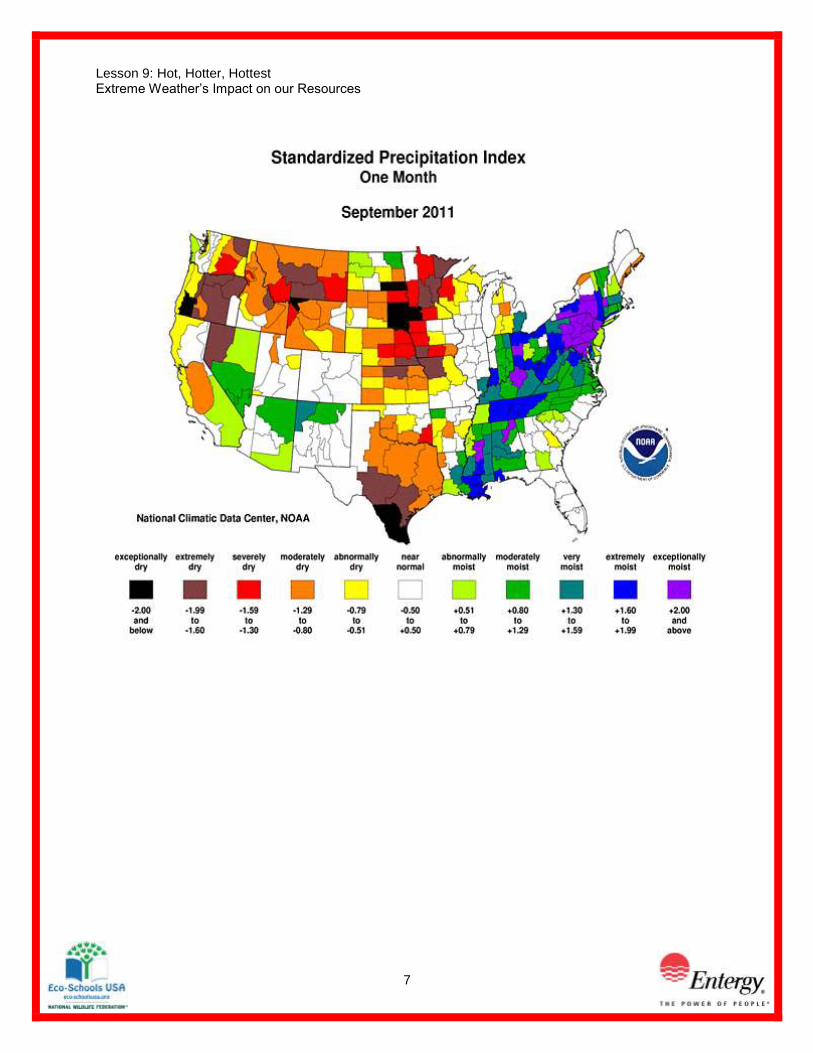
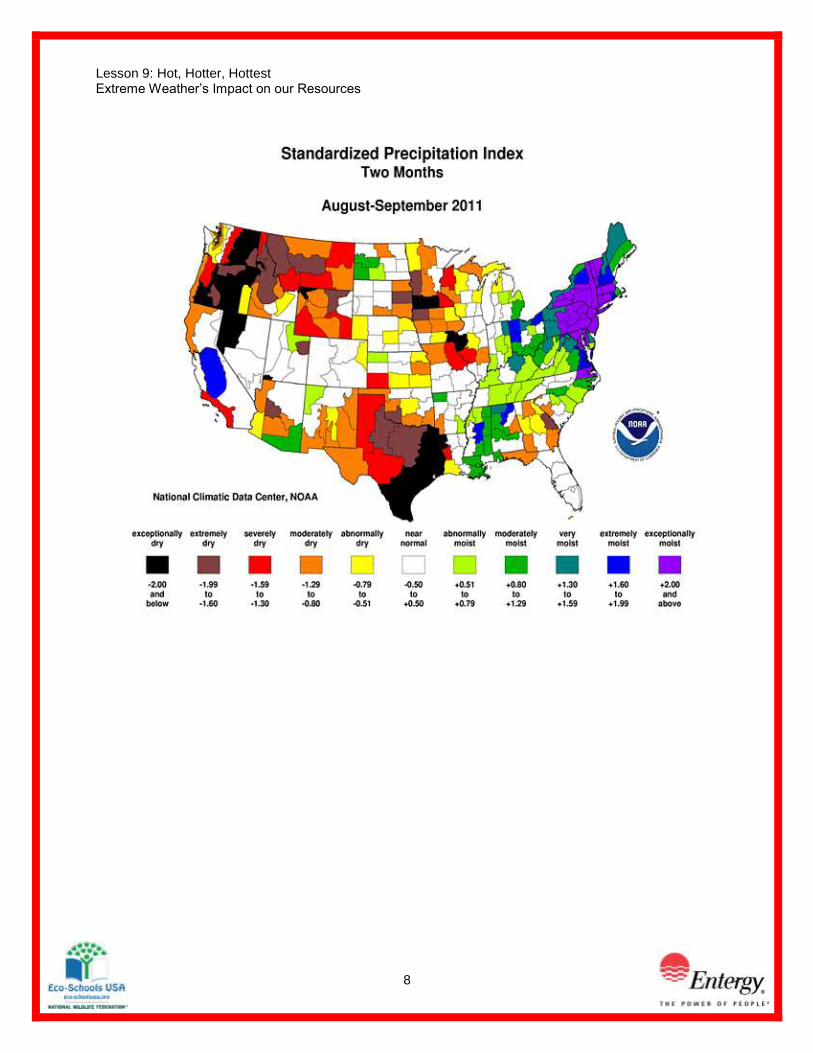
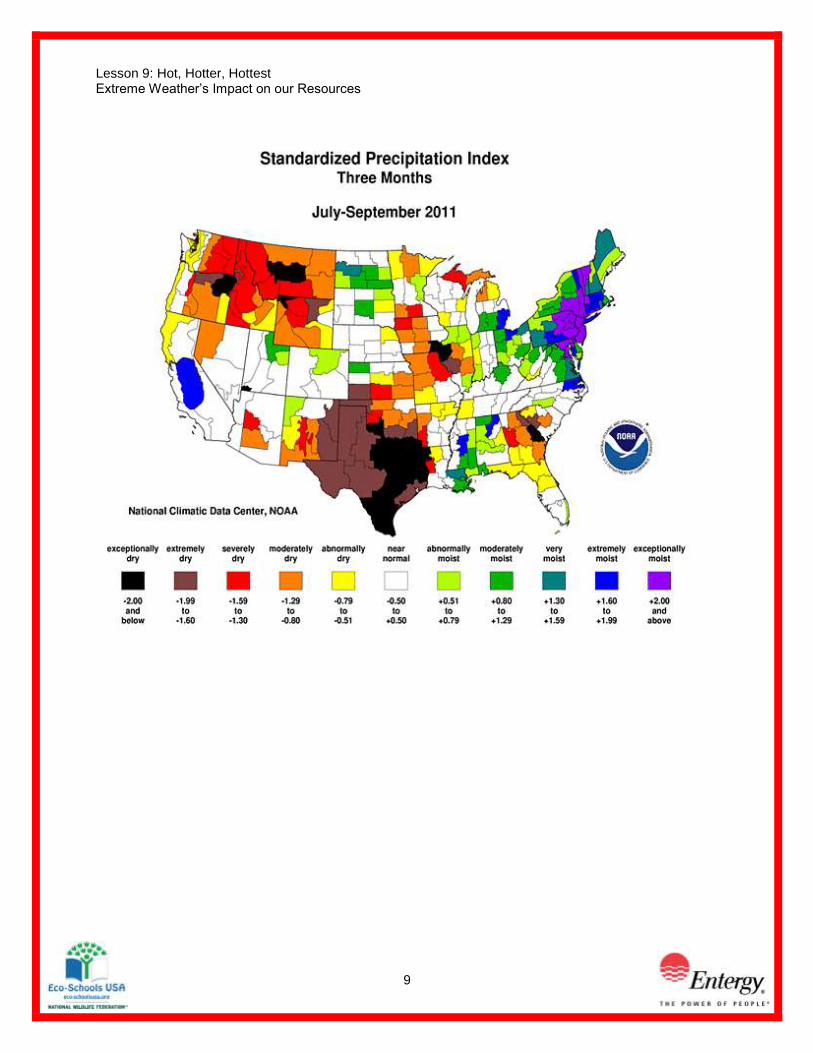
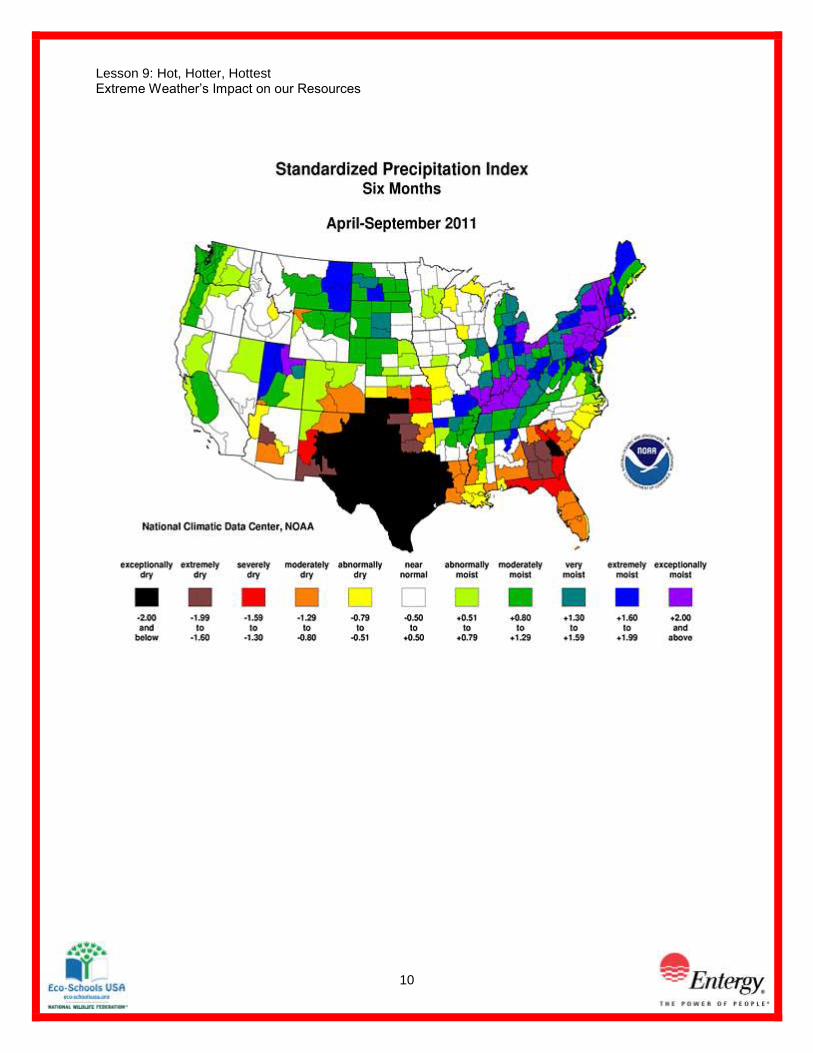
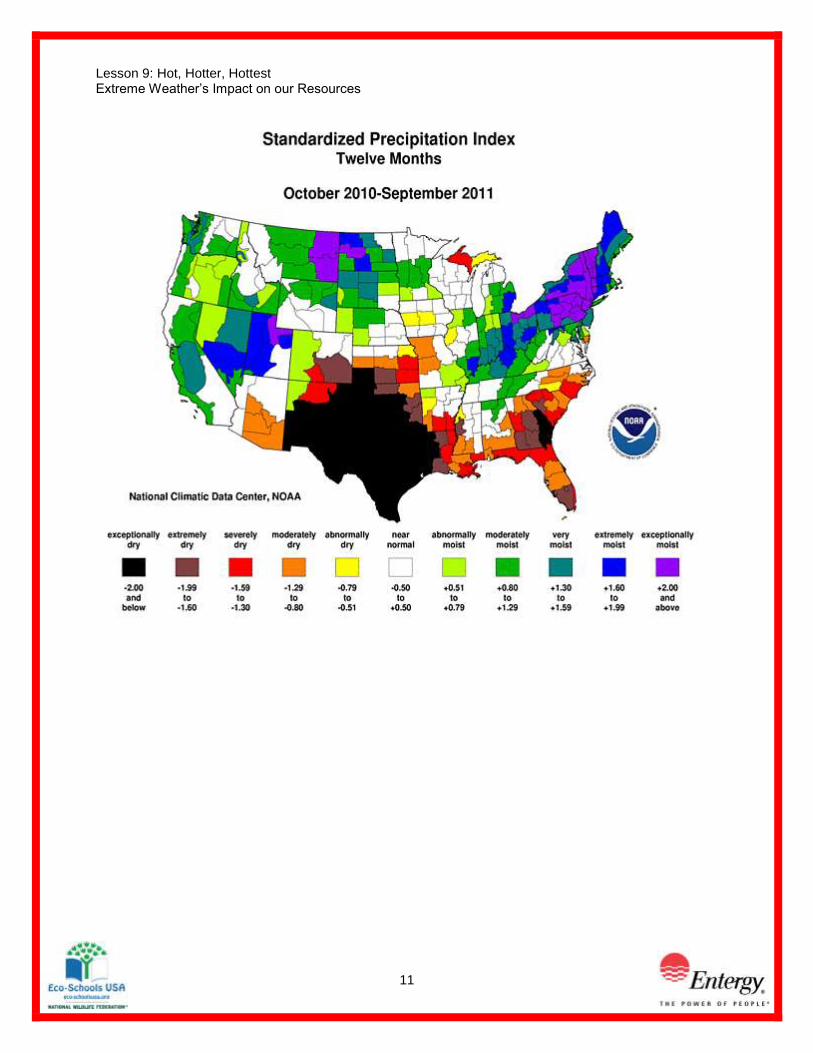
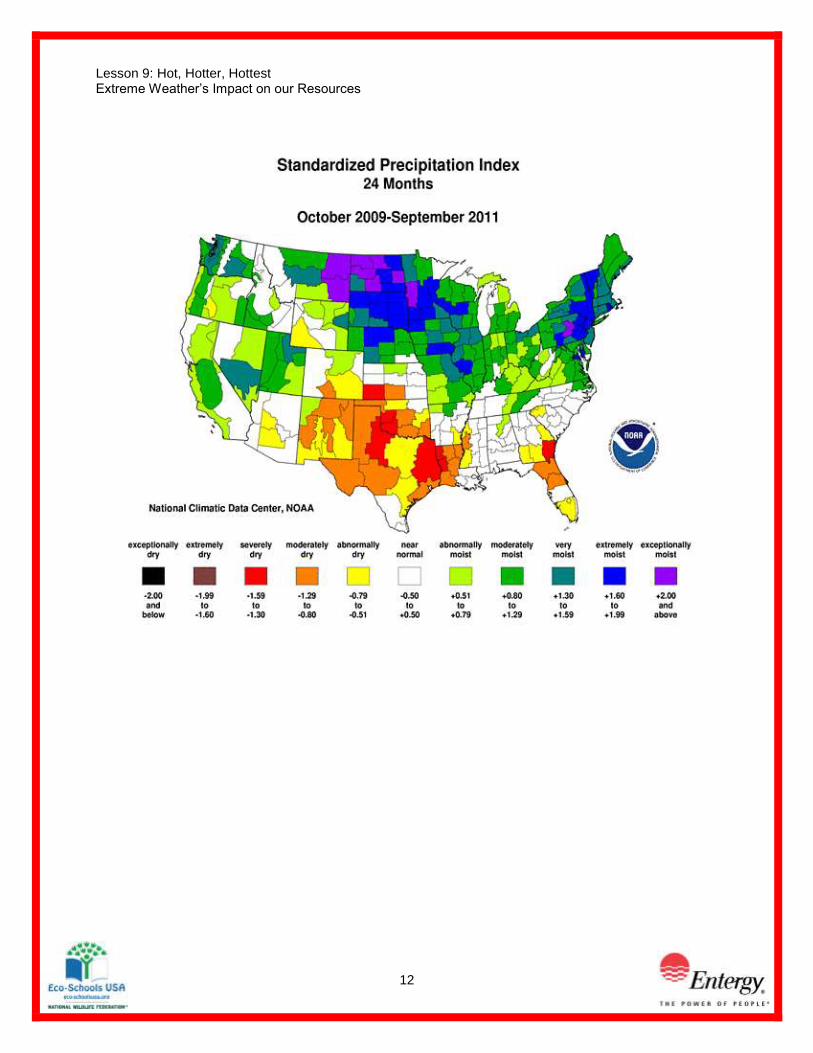
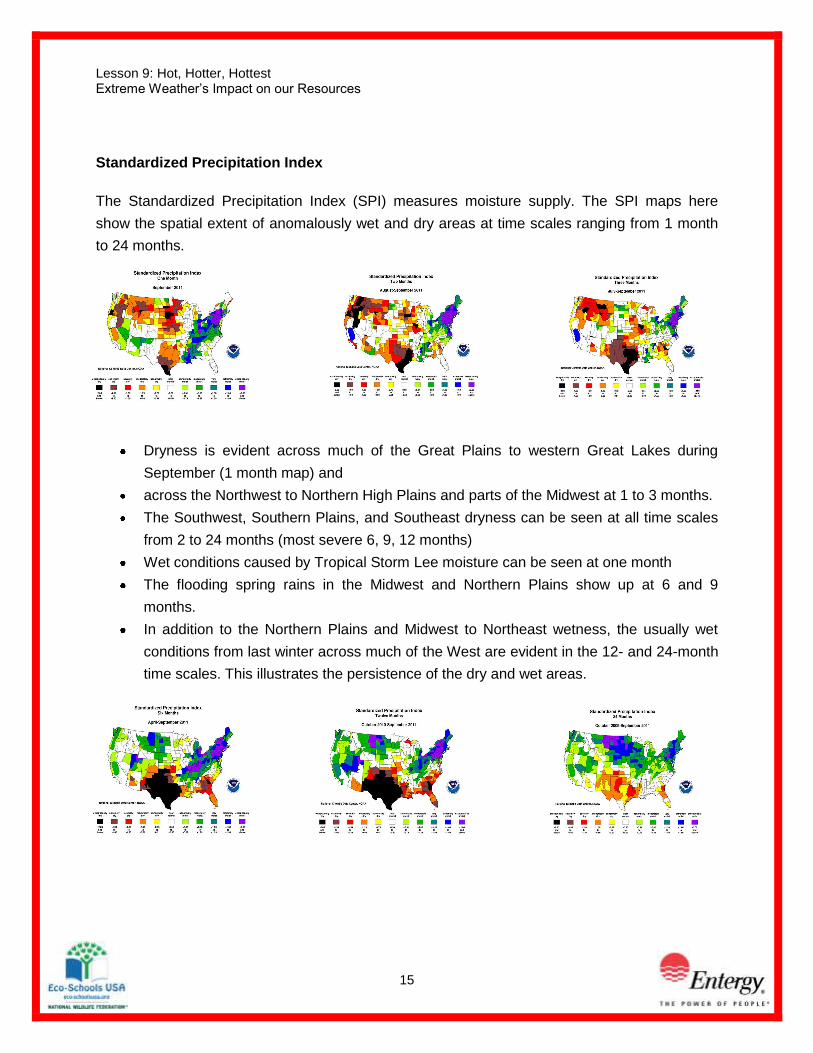
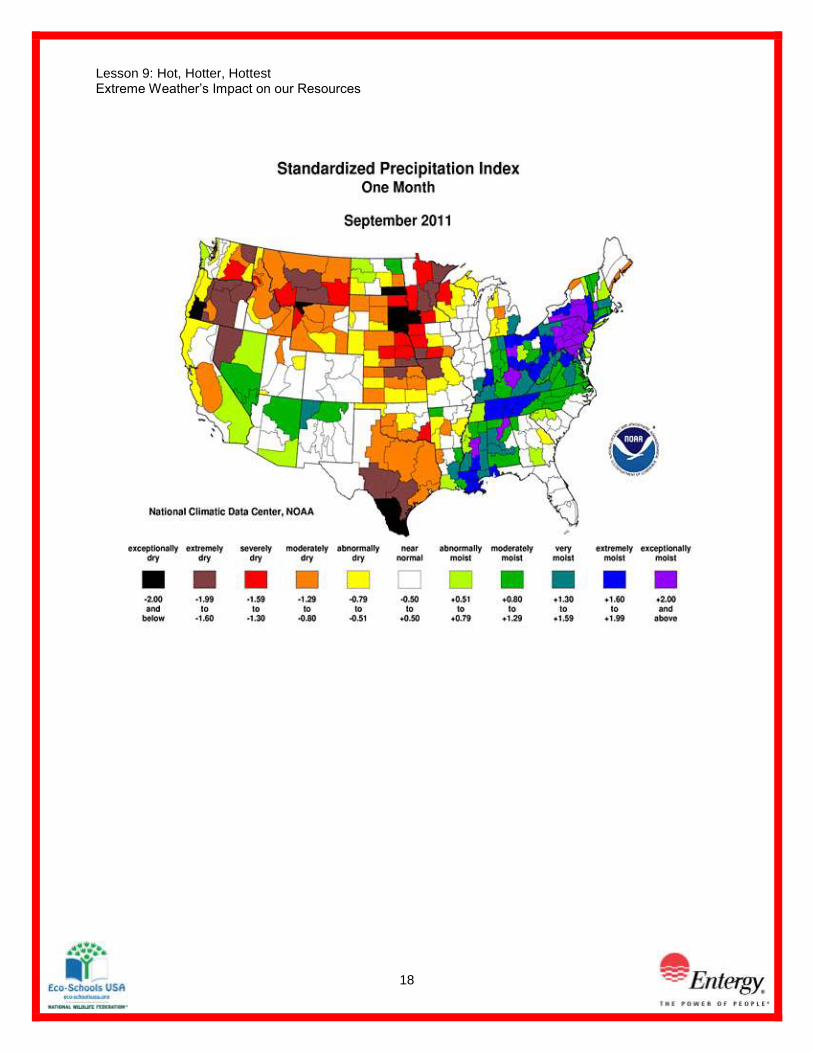
Standardized Precipitation Index
The Standardized Precipitation Index (SPI) measures moisture supply. The SPI maps here
show the spatial extent of anomalously wet and dry areas at time scales ranging from 1 month
to 24 months.
Dryness is evident across much of the Great Plains to western Great Lakes during
September (1 month map) and
across the Northwest to Northern High Plains and parts of the Midwest at 1 to 3 months.
The Southwest, Southern Plains, and Southeast dryness can be seen at all time scales
from 2 to 24 months (most severe 6, 9, 12 months)
Wet conditions caused by Tropical Storm Lee moisture can be seen at one month
The flooding spring rains in the Midwest and Northern Plains show up at 6 and 9
months.
In addition to the Northern Plains and Midwest to Northeast wetness, the usually wet
conditions from last winter across much of the West are evident in the 12- and 24-month
time scales. This illustrates the persistence of the dry and wet areas.

Lesson 9: Hot, Hotter, Hottest Extreme Weather’s Impact on our Resources
16
As explained by the Southern Regional Climate Center, September precipitation totals in the
Southern region varied dramatically from west to east. Conditions were quite dry in Texas,
Oklahoma and Arkansas, with most [weather] stations reporting only between 5 to 50 percent of
normal. By contrast, conditions were quite wet in Tennessee, Mississippi, and Louisiana, with a
bulk of [weather] stations reporting between 150 to 200 percent of normal precipitation. This
was primarily due to Tropical Storm Lee, which stalled off the Gulf Coast in the early part of the
month and eventually made its way inland across the eastern half of the Southern region. The
storm dumped tremendous amounts of rainfall. Areas within the Florida parishes of Louisiana
reported up to 10 inches (254.00 mm) of rainfall, however, most of the values reported in the
Southern region varied from 3 to 7 inches (76.20 to 177.80 mm). By month's end, Louisiana
recorded a state average precipitation value of 6.93 inches (176.60 mm). This equates to the
tenth wettest September for the state on record (1895-2011). Both Mississippi and Tennessee
reported their seventh wettest September on record (1895-2011). Mississippi averaged 7.67
inches (194.82 mm) for the month, while Tennessee averaged 6.73 inches (170.94 mm) for the
month. Drought ridden Texas remained dry for the month. The state averaged 1.08 inches
(27.43 mm), which is the first time since May that the state averaged more than an inch of
precipitation. However, it was still the seventh driest September on record (1895-2011) for the
state. For Oklahoma, it was the twentieth driest September on record (1895-2011) with a state
average precipitation value of 1.72 inches (43.69 mm). Arkansas experienced its 37th driest
September on record (1895-2011) with a state average precipitation value of 2.63 inches (66.81
mm). With the exception of Texas, fall in the Southern region began as a contrast to the past
several months, in that most of the region experienced cooler than normal temperatures.
Due to dry conditions in Arkansas, Oklahoma and Texas, drought conditions changed very little
over the western half of the Southern region in the past month. Approximately 53 percent of the
region remained in exceptional drought, most of which was Texas and western and central
Oklahoma. Exceptional drought also persisted in northwestern Louisiana. Drought conditions
did, however, improve in Tennessee, Mississippi and southern/southeastern Louisiana, with the
latter (Mississippi and southern/southeastern Louisiana) drought-free at the end of September.
In Tennessee, a small area of moderate drought remained in the northwestern corner of the
state. According to the Star-Telegram, drought has had a big impact on tree health in northern
Texas. It was reported that many trees in Trinity Park, were losing leaves and turning brown. It
was further reported that in Houston, approximately ten percent of the trees were expected to
die. A high mortality rate was also being seen in Hill County.
Lesson 9: Hot, Hotter, Hottest Extreme Weather’s Impact on our Resources
17
North Central Texas
Standard Precipitation Index
1
mont
h
2
month
s
3
month
s
months
6
month
s
12
month
s
24
month
s
Moderately Dry = 1.29 to .60 Extremely Dry = 1.99 to 1.50 Exceptionally Dry = 2.00 and below Abnormally Dry = -.79 to -.51
months
months
months
months
months
month
Lesson 9: Hot, Hotter, Hottest Extreme Weather’s Impact on our Resources
18
Lesson 9: Hot, Hotter, Hottest Extreme Weather’s Impact on our Resources
19
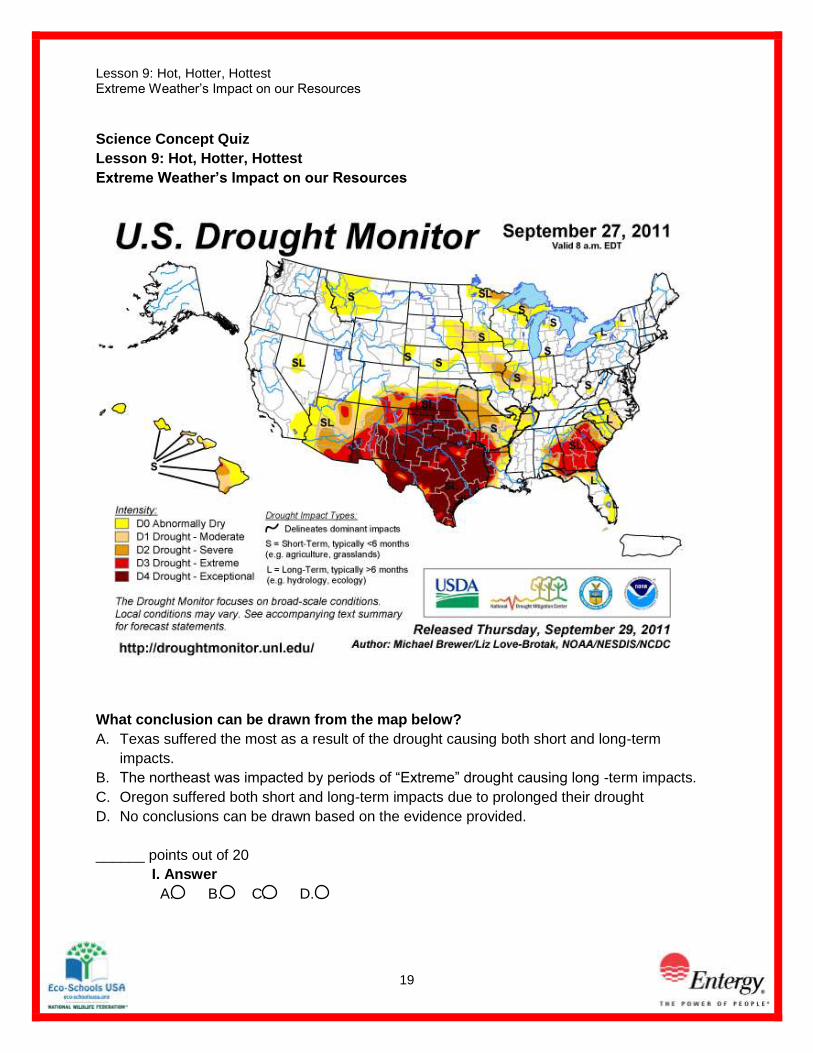
Science Concept Quiz
Lesson 9: Hot, Hotter, Hottest
Extreme Weather’s Impact on our Resources
What conclusion can be drawn from the map below?
A. Texas suffered the most as a result of the drought causing both short and long-term
impacts.
B. The northeast was impacted by periods of “Extreme” drought causing long -term impacts.
C. Oregon suffered both short and long-term impacts due to prolonged their drought
D. No conclusions can be drawn based on the evidence provided.
______ points out of 20
I. Answer
A. B. C. D.
Lesson 9: Hot, Hotter, Hottest Extreme Weather’s Impact on our Resources
20
______ points out of 15
II. What is the main concept behind the question?
1. Making Predictions
2. Biomes
3. Drawing conclusions
4. Vocabulary
_____ points out of 25
III. Provide the reasoning for choosing your answer in part II.
_____points out of 40
IV. Why are the other responses in part I not the best answer choice?
1.
2.
3.
4.
Lesson 9: Hot, Hotter, Hottest Extreme Weather’s Impact on our Resources
21
TEACHER ANSWER KEY
1. A
2. 3
3. Answers will vary. Drawing conclusions is the correct response because the it specific
asks what conclusion can be drawn from the map.
4. Answers will vary.
A. This is the correct response. The evidence contained in the map supports this claim.
B. Some long-term impacts were felt in the Northeast but the region did not suffer from
periods of “Extreme” drought.
C. This statement is false as the state did not suffer from short or long-term impact
because there was no evidence of a drought.
D. Many conclusions can be drawn from the map.
Lesson 9: Hot, Hotter, Hottest Extreme Weather’s Impact on our Resources
22
Student Name
Teacher/Class
Date
Lesson 9: Hot, Hotter, Hottest
Extreme Weather’s Impact on our Resources
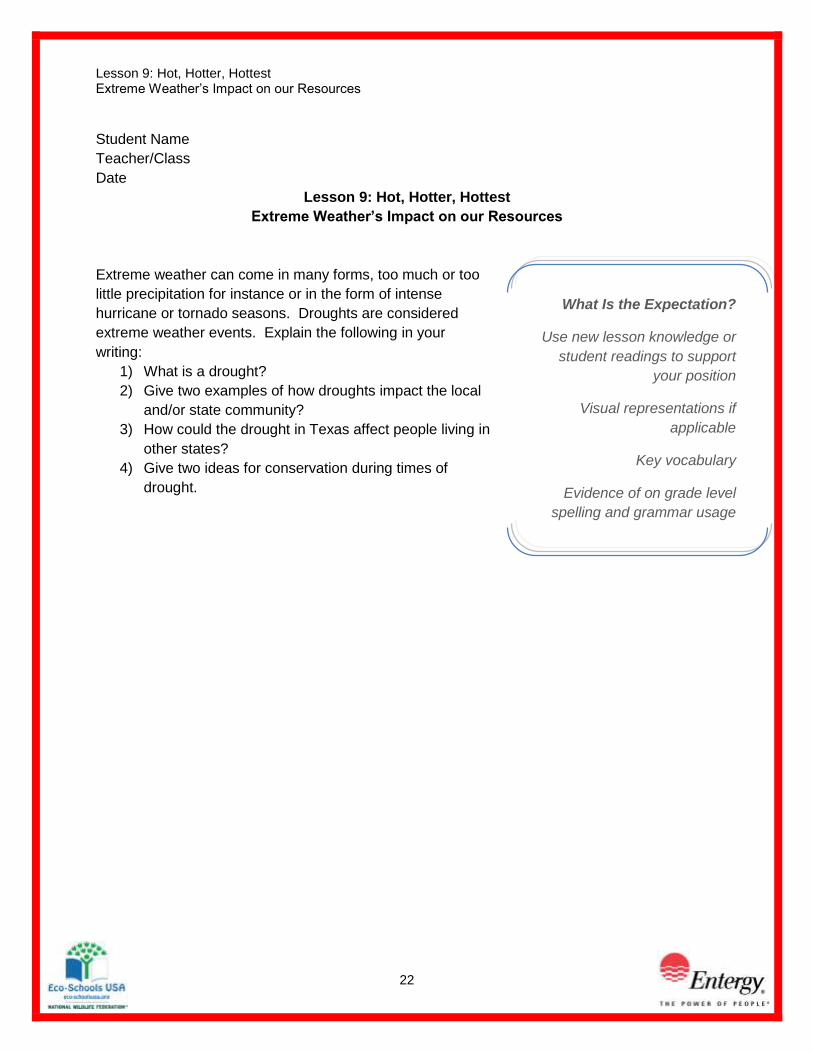
Extreme weather can come in many forms, too much or too
little precipitation for instance or in the form of intense
hurricane or tornado seasons. Droughts are considered
extreme weather events. Explain the following in your
writing:
1) What is a drought?
2) Give two examples of how droughts impact the local
and/or state community?
3) How could the drought in Texas affect people living in
other states?
4) Give two ideas for conservation during times of
drought.
What Is the Expectation?
Use new lesson knowledge or
student readings to support
your position
Visual representations if
applicable
Key vocabulary
Evidence of on grade level
spelling and grammar usage
Lesson 9: Hot, Hotter, Hottest Extreme Weather’s Impact on our Resources
23
DROUG
HT
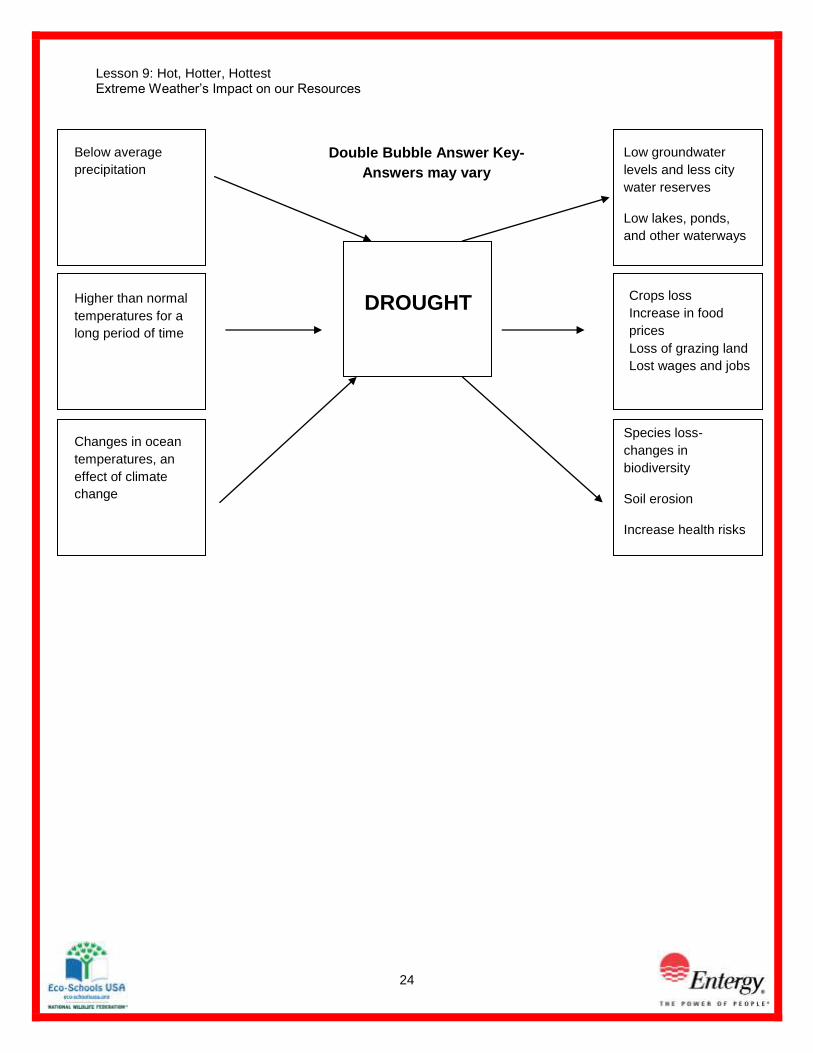
DROUGHT
Lesson 9: Hot, Hotter, Hottest Extreme Weather’s Impact on our Resources
24
DROUG
HT
DROUGHT
Below average
precipitation
Higher than normal
temperatures for a
long period of time
Changes in ocean
temperatures, an
effect of climate
change
Low groundwater
levels and less city
water reserves
Low lakes, ponds,
and other waterways
Crops loss
Increase in food
prices
Loss of grazing land
Lost wages and jobs
Species loss-
changes in
biodiversity
Soil erosion
Increase health risks
Double Bubble Answer Key-
Answers may vary