lemons: quality uncertainty and the market...
TRANSCRIPT
The Market for “Lemons:”Quality Uncertainty and the Market Mechanism
Presented by Team DebreuJustaina Adamanti, Liz Malm, Yuqing Hu, Krish Ray
Background
Akerlof explains his motivation for writing “The Market for Lemons”1 byarguing that microeconomic theory models in the 1960s were characterizedby their generic nature–they dealt with perfect competition and generalequilibrium. Situational and specific considerations were left out (such asinformation asymmetries). By the 1990s more specific theory models be-came important. Now, economic models are custom, describing importantfeatures of observed situations. Since “Lemons” exemplified this new style,it was an integral part in the transformation of how theory was presentedand discussed.
Akerlof notes that investigations of the car market were driven by his inter-est in macroeconmic issues such as the business cycle and unemployment.He wanted to know what caused the business cycle–noting that at the timethis was related to the significant variation in new automobile sales. Hewondered why this fluctuation existed for new cars, and attempted to un-derstand why people bought new cars, rather than renting or buying usedones. Akerlof noticed that the presence of information asymmetries servedas an explanation “as to why people preferred to purchase new cars ratherthan used cars” noting ‘’their suspicion of the motives of the sellers of usedcars.”
Extensions of this paper can be made to virtually any situation in whichasymmetric information exists. This can happen in any market where thetrue quality of goods is difficult to perceive. This paper uses the automobilemarket as an explanatory example. But the explanatory capacity of theLemon Principle are enormous.
Ironically, this theory was rejected on multiple accounts. According toAkerlof himself: “By June of 1967 the paper was ready and I sent it tothe American Economic Review for publication...Fairly shortly...I receivedmy first rejection letter from the American Economic Review. The editorexplained that the Review did not publish papers on subjects of such triv-iality....Michael Farrell, an editor of the Review of Economic Studies,...hadurged me to submit Lemons to the Review, but he had also been quite ex-
1George Akerlof, “Writing the ‘The Market for Lemons’: A Personal and InterpretiveEssay, published 14 November 2003.
1
plicit in giving no guarantees. I submitted Lemons there, which was againrejected on the grounds that the Review did not publish papers on topics ofsuch triviality. The next rejection was more interesting. I sent Lemons tothe Journal of Political Economy, which sent me two referee reports, care-fully argued as to why I was incorrect. After all, eggs of different gradeswere sorted and sold (I do not believe that this is just my memory confus-ing it with my original perception of the egg-grader model), as were otheragricultural commodities. If this paper was correct, then no goods could betraded (an exaggeration of the claims of the paper). Besides - and this wasthe killer - if this paper was correct, economics would be different.”
Variables & Notation
q proportion of good cars produced (probability of purchasing good car)(1− q) proportion of bad cars produced (probability of purchasing bad car)Qd quantity of used cars demandedQs quantity of used cars suppliedp price of used carµ average quality of used cars in the marketU1 utility of group oneU2 utility of group twoM consumption (and total expenditure) of all goods other than used carsn number of used cars consumed by an individualxi quality of the ith used car (consumed by the individual)N number of cars intially possessed by group 1Y1 income of group 1Y2 income of group 2D1 group 1 demand for used carsD2 group 2 demand for used carsS1 group 1 supply of used carsS2 group 2 supply of used carsD market demandS market supply
Model
Assume the used car market has two quality “types”– good and bad, butthe quality is undistinguishable to the buyer at time of purchase. Buyersonly know the proportion of good and bad used cars in the market, so theycan ascertain the probability that they will purchase a good or bad car. qrepresents the proportion of good cars in the market and (1− q) representsthe proportion of bad cars in the market.
2

Quantity of used automobiles demanded (Qd) is a function of price p andaverage quality of used cars in the market µ:
Qd = D(p, µ). (1)
This demand is the sum of the demand of two separate groups of individ-uals in the market (group 1 and group 2, which will be defined subsequently).
Quantity of used automobiles supplied (Qs) is a function of price p:
Qs = S(p) (2)
Average quality µ of used cars on the market is a function of price p:
µ = µ(p) (3)
Quantity demanded and quantity supplied must be equal in equilibrium:
Qd = Qs
D(p, µ(p)) = S(p) (4)
Assume the market is divided into two different groups of people. Group 1’sutility function is given by:
U1 = M +n∑
i=0
xi. (5a)
Group 2‘s utility function is given by
U2 = M +
n∑i=0
3
2xi. (5b)
In both (5a) and (5b), M is the consumption of all goods other than usedcars in the economy. It can also be viewed as the total expenditure on goodsother than used cars, because here we assume that the price of M , pM , isequal to one. n is the number of cars consumed by the individual and xi isthe quality of the ith car.
Assume that (5a) and (5b) are von Neumann-Morgenstern utility functions(i.e. they possess the expected utility property; traders maximize expectedutility). Assume that group 1 has N used cars and group 2 has zero. TheN cars possessed by group 1 have uniformly distributed quality x, where0 ≤ x ≤ 2.
Let Y1 denote the income of group 1 and Y2 deonte the income of group2. Note that group 1’s income is derived from selling both used cars (since
3
they have N cars) and other things. Group 2‘s income is only derived from“other” things since they have zero cars initially.
Note that marginal utility of additional cars also reflects the price thatseller/ buyer is willing to sell/ buy cars.
Things to note about the utility functions: (1) they’re linear, (2) usinglinear utilty functions allows a focus on only the effects of asymmetric in-formation, and (3) the utility funtions are “odd”because the addition of thesecond (or even kth car adds the same amount of utility as the first carconsumed.
Summary of important assumptions: (1) traders maximize expected util-ity (untily functions are VNM), (2) group 1 has N cars and group 2 hasnone, (3) price of M , pM , is one, and (4) goods are divisible.
Symmetric Information
In the symmetric information case, both seller and buyer know the qualityof the cars. Since quality is uniformly distributed on [0, 2], their averagequality of car is 1. Group 1 is willing to sell their car if their reservationvalues for their cars are lower than the price. Group 2 has reservation price32x for a car that has quality x. Since the quality is observable, selling pricewill be in between x and 3
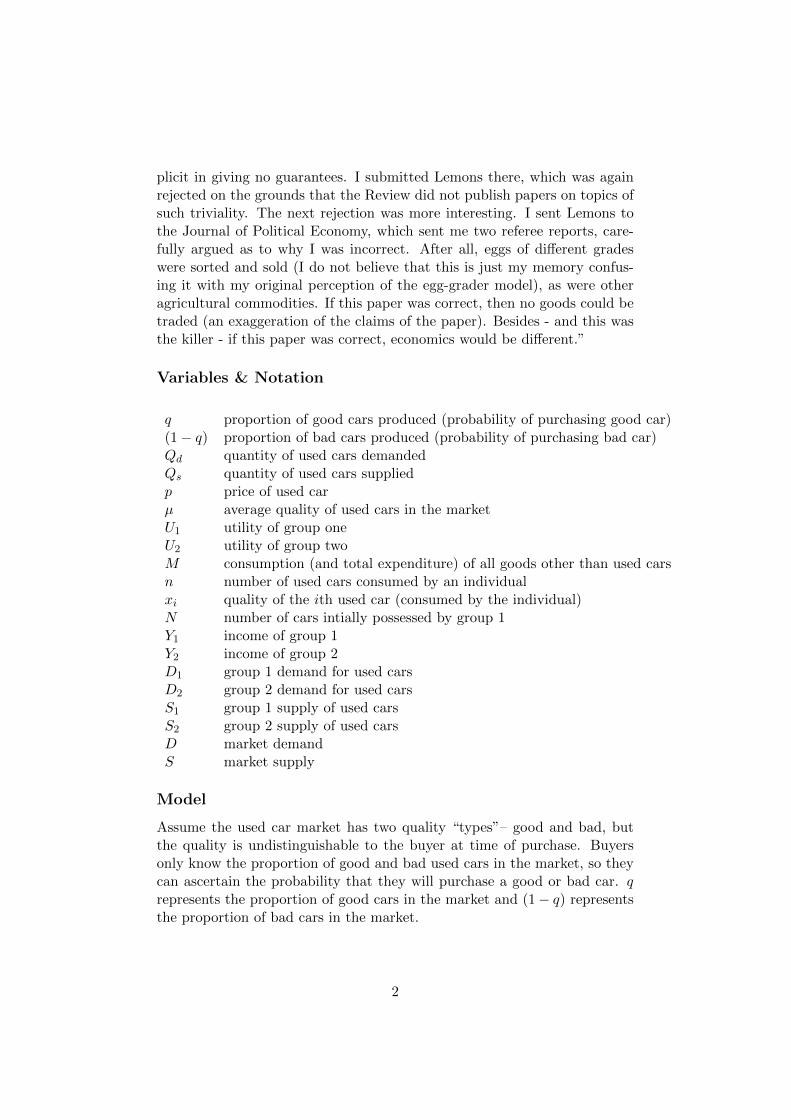
2x. We know that the average quality is 1 (x = 1),it is equivalent to say that the selling price is between 1 and 3/2 . However,the unknown value of N causes equilibrium has to be assessed in every rangeof price. Figure 12 and Table 2 show the detailed demand and supply forevery range of price.
Table 2: Demand and Supply in Symmetric Case
PriceDemand
Supply EquilibriumGroup 1 Group 2
p > 3/2 0 0 N -
p = 3/2 0 Y2p N N = Y2
p =⇒ N < 2Y23
1 < p < 3/2 0 Y2p N N ∈
(Y2
p=3/2 ,Y2p=1
)=⇒ 2Y2
3 < p < Y2
p = 1 Y1p
Y2p N N = Y1+Y2
p =⇒ Y2 < N < Y1 + Y2
p < 1 Y1p
Y2p 0 -
2This figure was borrowed from last year’presentation of this paper
4
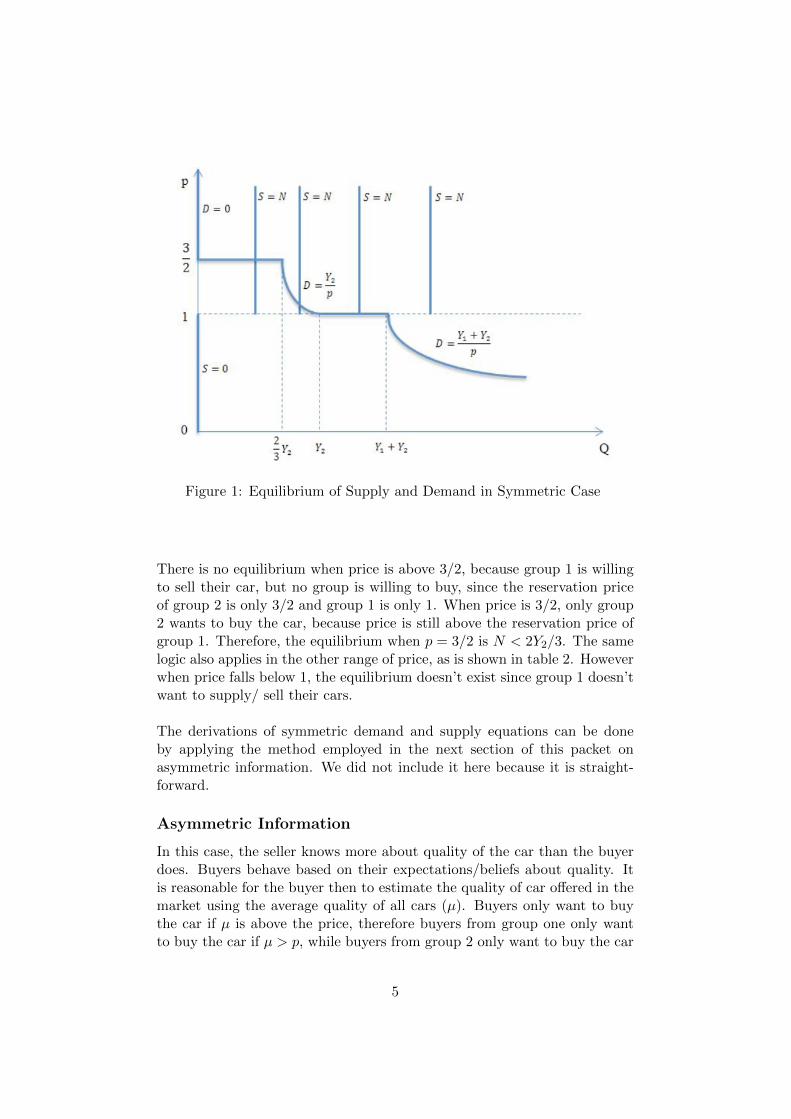
Figure 1: Equilibrium of Supply and Demand in Symmetric Case
There is no equilibrium when price is above 3/2, because group 1 is willingto sell their car, but no group is willing to buy, since the reservation priceof group 2 is only 3/2 and group 1 is only 1. When price is 3/2, only group2 wants to buy the car, because price is still above the reservation price ofgroup 1. Therefore, the equilibrium when p = 3/2 is N < 2Y2/3. The samelogic also applies in the other range of price, as is shown in table 2. Howeverwhen price falls below 1, the equilibrium doesn’t exist since group 1 doesn’twant to supply/ sell their cars.
The derivations of symmetric demand and supply equations can be doneby applying the method employed in the next section of this packet onasymmetric information. We did not include it here because it is straight-forward.
Asymmetric Information
In this case, the seller knows more about quality of the car than the buyerdoes. Buyers behave based on their expectations/beliefs about quality. Itis reasonable for the buyer then to estimate the quality of car offered in themarket using the average quality of all cars (µ). Buyers only want to buythe car if µ is above the price, therefore buyers from group one only wantto buy the car if µ > p, while buyers from group 2 only want to buy the car
5

if 3/2µ > p.
Assume that the initial average quality of cars in the market is µ, and theprice in market is p (where p > 0), and sellers/buyers have the reservationvalue for their cars measured by v(µ) = p. In this case, only sellers whosecars with quality lower than µ are willing to sell, and sellers whose carswith quality higher than µ leave the market. Under the assumption thatthe quality has uniform distribution, N/2 sellers leave the market, so thesupply becomes (N/2) ∗ p = p
2N . In this case,
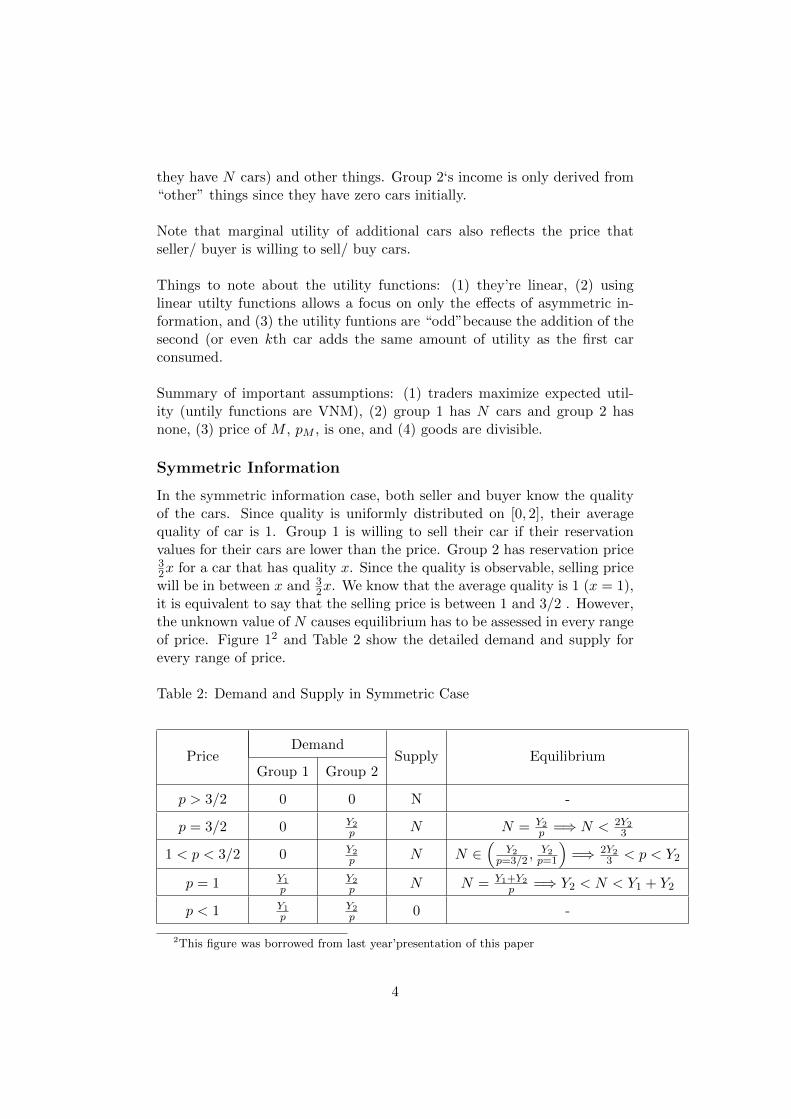
Figure 2: Demand Curve for Asymmetric Case
This contrasts asymmetric information–this causes the buyer to uncertainabout the quality of cars. They estimate that the average quality of cars isonly a half of the offering price. Based on the buyer’s estimation, group 1only wants to pay at p/2, while group 2 only wants to pay at 3/4p, thereforeno cars will be sold at price p. As a result, the price would go down, whichfurther drives some sellers out of the market and further lowers down theaverage quality of cars, leading to the shrinking of the market. To conclude,there will be no equilibrium outcome where asymmetric information exists.
Figure 23 shows the demand curve of cars at price range based on aver-age price and Figure 34 show the supply curve of cars. Table 3 shows thedemand and supply in the symmetric case. Recall that group 1 only wants
3Again borrowed from last year’s Lemons presentation.4See previous note.
6

to buy cars if p < µ and group 2 only wants to buy cars if p < 3/2µ.
Figure 3: Supply Curve for Asymmetric Case
Table 3 Demand and Supply in Asymmetric Case
Price and Average QualityDemand
Supply EquilibriumGroup 1 Group 2
p < µ Y1p
Y2p
pN2 -
µ < p < 32µ 0 Y2
ppN2 -
p > 32µ 0 0 N -
Below are the derivations of the asymmetric group 1 demand and supply,group 2 demand and supply, and market demand and supply.
Group 1 Demand
Consider group 1. Since (5a) is a linear utility function, we cannot im-plement the usual Lagrangian multiplier method, because we must accountfor corner solutions (recall that the only unique solutions that exist in thecase of linear utility and a linear budget constraint are corner solutions).Consider Figure 1:
7
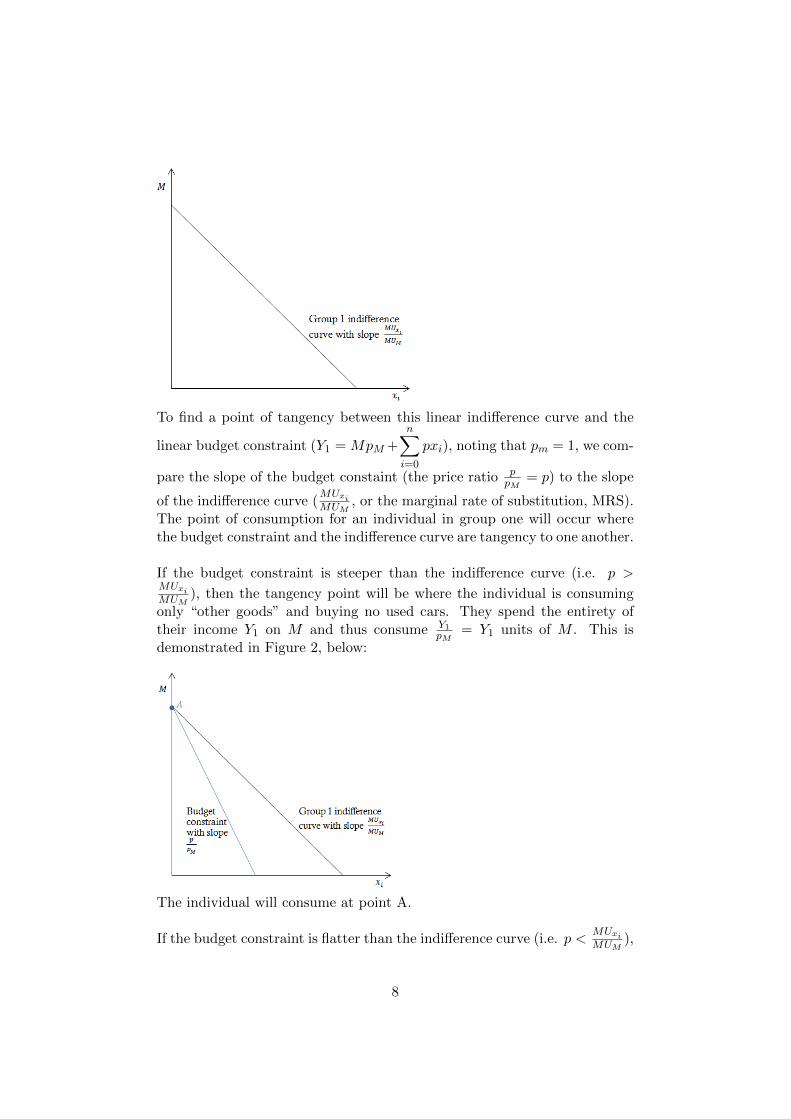
To find a point of tangency between this linear indifference curve and the
linear budget constraint (Y1 = MpM +n∑
i=0
pxi), noting that pm = 1, we com-
pare the slope of the budget constaint (the price ratio ppM
= p) to the slope
of the indifference curve (MUxiMUM
, or the marginal rate of substitution, MRS).The point of consumption for an individual in group one will occur wherethe budget constraint and the indifference curve are tangency to one another.
If the budget constraint is steeper than the indifference curve (i.e. p >MUxiMUM
), then the tangency point will be where the individual is consumingonly “other goods” and buying no used cars. They spend the entirety oftheir income Y1 on M and thus consume Y1
pM= Y1 units of M . This is
demonstrated in Figure 2, below:
The individual will consume at point A.
If the budget constraint is flatter than the indifference curve (i.e. p <MUxiMUM
),
8

then the tangency point will be where the individual is consumping only usedcars and buying no “other goods”. They spend the entirety of their incomeY1 on x and thus consume Y1
p cars. This is demonstarted in Figure 2, below:
The individual will consume at point B.
How do we derive what price group 1 consumers are willing to pay for aused car? Since they cannot pay a car’s true value because they cannotobserve the true quality, the consumer will use average quality of used carsin the market (µ) as a statistic of value. They will compare the price of carsp to the average quality of cars µ. µ can be thought of as the price theyare willing to pay. If µ < p, then no used cars will be demanded. If µ > p,then only used cars will be demanded. The reservation price (the highestpossible price a group 1 consumer will pay for the car) is a price equal tothe average quality of a car on the market. If the consumer were only tobuy used cars, he or she would only get utility from consuming cars. Anindividual car of quality level x would give him or her x utility. Thus, if thebuyer can only estimate a car’s quality as µ, buying that car will give theconsumer µ additional utility–he expects to obtain additional utility equalto µ from purchasing a car in the market. If the car costs p = µ, the personis indifferent between buying or not buying the car.
Thus, group 1’s demand for used cars (D1) is
D1 =Y1p, µ > p
D1 = 0, µ < p (6)
Average Quality
9

Although quality of cars x initially possessed by group 1 are uniformly dis-tributed on [0, 2], not all N of these cars will be traded in the marketplace.Only cars with a price less than a seller‘s value will be traded (this is theonly time a seller will be willing to give up his or her car). Thus, the carstraded on the market are uniformly distributed on [0, p]. The expected valueof a uniform distribution is equal to 1
2(a + b), where a is the lower bound(here, 0) and b is the upper bound (here, p). The average quality µ is then
µ =1
2(0 + p) =
p
2. (7)
Group 1 Supply
The range of possible prices that can be charged is between 0 and 2. Again,if we use quality x as a statistic for how much an individual values a car,no cars will sell for more than 2 since no individual values a car that much.Only the sellers who value their cars less than the market price p will bewilling to give up their cars. They will only give up their car if its qualityx is less than the average quality in the market µ. To find the proportionof cars that are less than the average market quality, we use the cumulativedistribution function (CDF) of the uniform distribution. Recall that a CDFof a randomly distributed variable (in our case x) gives the probability thatan x will be less than or equal to a given value. We want to know thatprobability that quality is less than or equal to the average quality on themarket (i.e. x ≤ µ). Note that a seller will be indifferent between selling hiscar or keeping it when p = µ. The CDF of a uniform distribution is givenby:
0, x ≤ ax− ab− a
, a ≤ x ≤ b (8)
1, x ≤ b
where a is the lower bound of the region, b is the upper bound of the region,and x is the given value for which we are interested–the CDF will tell us theprobability that we will find an x that is less than or equal to this given x.
10
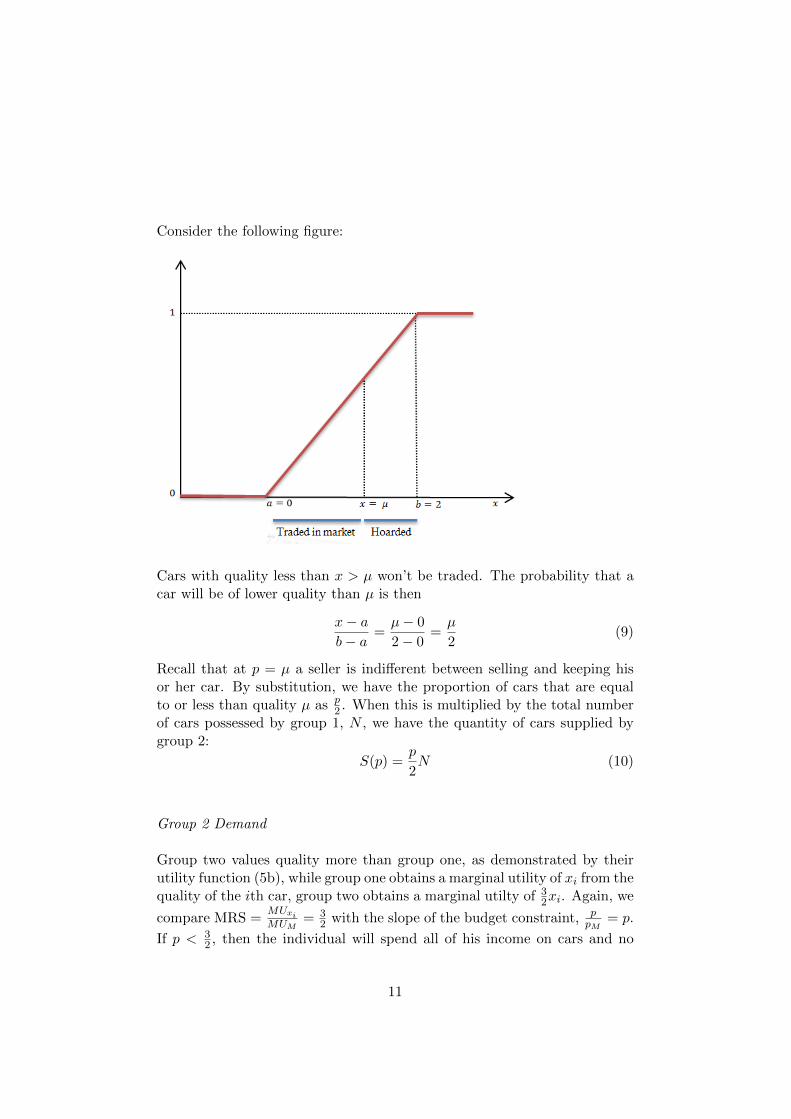
Consider the following figure:
Cars with quality less than x > µ won’t be traded. The probability that acar will be of lower quality than µ is then
x− ab− a
=µ− 0
2− 0=µ
2(9)
Recall that at p = µ a seller is indifferent between selling and keeping hisor her car. By substitution, we have the proportion of cars that are equalto or less than quality µ as p
2 . When this is multiplied by the total numberof cars possessed by group 1, N , we have the quantity of cars supplied bygroup 2:
S(p) =p
2N (10)
Group 2 Demand
Group two values quality more than group one, as demonstrated by theirutility function (5b), while group one obtains a marginal utility of xi from thequality of the ith car, group two obtains a marginal utilty of 3
2xi. Again, we
compare MRS =MUxiMUM
= 32 with the slope of the budget constraint, p
pM= p.
If p < 32 , then the individual will spend all of his income on cars and no
11

units of M (and consume Y2p units of xi. Conversely, if p > 3
2 , then the indi-vidual consumers zero cars and spends income only on M . When decidingwhether or not to buy a car, the individual compares the marginal utility hewould obtain from purchasing the car (32x=frac32µ for the average car inthe market) with the price of cars. Thus, group demand can be summarizedas:
D2 =Y2p,
3
2µ > p
D2 = 0,3
2µ < p (11)
Group 2 Supply
Group two initially has zero cars, so group two supply is given by:
S2 = 0 (12)
Total Supply and Demand
Aggregate demand is the total demand when group one demand and grouptwo demand is combined. From p = 0 to p = µ, both groups will purchasecars. From p = µ to p = 3
2µ, only group two will purchase cars. At pricesabove 3
2µ, neither group one or two will purchase cars.
D(p, µ) =Y1 + Y2
p, p < µ
D(p, µ) =Y2p, µ < p <
3
2µ (13)
D(p, µ) = 0, p >3
2µ
Recall that the average quality of cars in the market is µ = p2 . Comparing
this with market price p, we can see that the third line of equation (13) iscorrect–price is higher than 3
2µ, so no cars will be purchased by either group,even though there are sellers willing to sell (in group one) and buyers willingto buy (group 2).
Applications
Health Insurance
In this paper, Akerlof treats the health insurance market as a lemons mar-ket. The lemons in this story are those elderly people (65 and older) who
12

know more about their health and are more likely to become ill. Theseindividuals often have trouble purchasing medical insurance. This is be-cause (1) age is a common indication of weakness and its associated highmedical expenditure; and (2) in the competitive market, the prevailing in-surance rate is lower than expected medical care cost for these people, soinsurance providers have no incentive to include the elderly in their targetmarket. Thus, insurances companies do not raise their prices to attract thisdemographic. To understand why we can examine the case when insurancecompanies open the market to these people and increase prices.
The above flow chart depicts how shrinking insurance markets occur as a re-sult of adverse selection. Under information asymmetry, insurance providerscannot discern between types of applicants (the healthy vs. the unhealthy,namely, the low risk and high risk, respectively). Those who know that theywill need insurance are willing to pay a much higher price, but the relativehealthier groups are not. The rising price will still attract the former type(riskier individuals), but dis-incentivize the latter type, leading to higherlevel of risk in the market (higher likelihood of becoming sick). Thus, it ismore reasonable to exclude those people from the market and not offer theminsurance.
Recall that this idea is consistent with the ideas in “Credit Rationing inMarkets with Imperfect Information,”in which Stigliz and Weiss prove thatborrowers in the credit market change their behavior in response to an inter-est rate change, and higher interest rates attract riskier projects. Anotherrelated point is the possible solution to this problem–in another paper fromthis course (Rothschild and Stigliz, 1976), two equilibriums in the insurancemarket are compared: the separating equilibrium and the pooling equilib-rium.
The result of this is that adverse selection can lead to three types of in-efficiencies: (1) prices to participants do not reflect marginal costs, hence ona benefit-cost basis individuals select the wrong health plans; (2) desirablerisk spreading is lost; and (3) health plans manipulate their offerings to de-ter the sick and attract the healthy.
Possible solutions could include group insurance, because “adequate healthis a precondition for employment.”
13

The definition of adverse selection in the insurance market can be extendedin two ways. (1) the key assumption in this example is that insuranceproviders can only set one common price, but in reality multiple insuranceplans could be offered: a general plan and a more moderate plan. Individ-uals who expect high health care costs prefer more generous and expensiveinsurance plans; those who expect low costs choose more moderate plans.This is also an adverse selection, and the corresponding result is separatingequilibrium. (2) If most insurance companies begin to utilize group insur-ance, then this means that insurance is not available to those individualsthat exhbit a greater need for it.
Minority Employment
Employers might not hire certain minorities in some cases simply becausethey are exhibiting profit maximizing behavior. Akerlof suggests that ‘’racemay serve as a good statistic for the applicant’s social background, quality ofschooling, and general job capabilities.” Kenneth Arrow first discussed thetheory of statistical discrimination,5 which argues that despite the fact thatagents behave rationally and also do not exhibit prejudices, demographicgroups still are “unequal”when compared to other demographic groups. Thefact that some demographic groups are preferred to others is because em-ployers make judgments about the average behavior of an observable groupof people. If an employer cannot know an applicant’s true productive capac-ity or skills, he or she will hire based on the qualities about the applicantthat he or she can observe. This could potentially be a stereotype about thedemographic group to which the person belongs. This is similar to Spence’sdiscussion of job market signaling.
Quality schooling may be a substitute for this statistic. Workers with highability have lower costs of pursuing attainment of education at higher lev-els, which can act as a signal of their productive capacity. Workers withoutschooling could have innate talent, however “these talents must be certifiedby [a credible] educational establishment before a company can afford to usethem”.
Dishonesty Costs
In the used car market example, there was a utility cost of units per carin the market with asymmetric vs symmetric information, and it was de-termined that eventually the number of cars N that would be available forsale eventually approached 0. As a result it is conceivable that the losses
5Kenneth Arrow, “The Theory of Discrimination,” in Discrimination in Labor Markets,ed. by Ashenfelter and Rees, New Jersey: Princeton University Press (1973).
14

incurred due to dishonest trades under asymmetric information are quan-tifiable under certain circumstances.
In the example for the used car market there is an incentive for the sell-ers to offer lemons at the market price. This lowers the expected qualityof a good from the perspective of consumers; this drives legitimate goodsout of business. This dishonesty (selling known lemons at prices above theiractual value) as a result drives the whole market out of business, so the costsassociated with dishonesty are not only with the amount lost by chargingconsumers more for lemons, but also the cost incurred from losing the entiremarket.
Empirical evidence suggests that developing countries are subject to muchgreater variations in quality. In such a market it would be possible to cap-italize on the difference between the buying prices of two traders (causedby asymmetry) the merchant (an entity that capitalizes on such differences)could then act as screening agent.
Credit Markets in Underdeveloped Countries
Credit Markets in developing countries often show indications of sufferingfrom asymmetric information. The problem from asymmetry arises foremostwhen considering entry to the market. The paper considers as an examplethe almost extortionate interest rates that local moneylenders charge theirclients in India. Consider the already existing local moneylender. The lenderis typically a member of the community with close personal ties to his clients.As a result he is able gain more insight into the character of his clientan im-portant factor in determining the riskiness of a loan. In order to combatthe growing landlessness of the poorer classes, as a result of failing to repaysecured loans, the government attempted to displace the local lenders in the“Cooperative Movement.”
Consider two lenders: Lender A, a local lender with existing ties to thecommunity and Lender B a new lender entering the market. Suppose aLender B has just joined the market. The Lender A was originally chargingmonopoly rates because they are the only players in the market. When aLender B joins they may have to adjust rates to competehowever they havemore information about their clients than the new entrant. Lender B isunable to observe the riskiness of the borrowers to the same extent as theexisting lender. So, similar to the market for lemons, the Lender B can onlyoffer rates using assumed average qualities to determine the riskiness of theborrower. As a result individuals who would have gotten poorer rates atthe Lender A would now flock to the new lender. However, the reason theyreceived worse rates at the local lender was because the local lender was able
15
to determine that they were risky borrowers. The good borrowers would staywith the Lender A because the A would be able to offer them better ratesthan B because B would not know that they were good borrowers. As a re-sult, Lender A would retain all the borrowers below a threshold of riskiness,and Lender B would find itself strapped with all the higher risk borrowers, orin this case “lemons”. The result would be that Lender A would face manymore defaulted loans and could presumably be driven out of business (Theexample makes more sense if you consider unsecured loansas in the Cooper-ative Movement where the goal was to keep peasants from losing their land).
Knowing this as an outcome would prevent Lenders of type B from enter-ing the market at all, or after multiple periods of competition would resultin Lender A being the only competitor remaining in the market, allowingthem to then readjust and charge monopoly rates. The paper also notes SirMalcolm Darling’s interpretation of the village moneylender’s power (page499), who are thus able to maintain an informational advantage, as well asbe a preferable avenue for acquiring a loan, due to sheer convenience.
The above example with Lender A and B also applies if a third party at-tempts to arbitrage between the lower city lending rates and the local rates.He would attract all the lemons. A difference from the example with themarket for used cars is that in this case the pressures from Asymmetric infor-mation don’t drive the whole market out of business, rather it creates a bar-rier for entry in the market. Another example that indicates the existenceinformation asymmetry at work in developing countries is the concept of“Managing Agencies”in South Asia. Promoters of a venture seeking invest-ment take their proposal to a Managing Agency. If the Agency green-lightsthe venture, then it is able to attract investment, simply by way of beingcertified by said agency. This works because the Agency would have estab-lished a reputation of credibility, can effectively act as a “screening”agent,much like Stigltz and Weiss (1981).
The prevalence of these types of institutions suggests information asym-metry. Why? If there were symmetric information, investors would imme-diately know whether or not a venture was worth investing in, and therewould be no need for additional spending on a managing agency to draw inmore investment.
These managing agencies are necessary especially in the markets where in-vestors are unable to determine whether a deal will be legitimate or not.The Managing Agencies are either able to maintain their status by either(1) building up a reputation of honest dealings, or (2) the “outside” in-vestment is limited to contributions from communal groups which leveragesocial structure to encourage honest dealings.
16

Pickup Truck Market
Bond tested whether bad products drive out good products in the marketfor used pickups, a similar market to the used car market. If this modelis accurately reflected by empirical data, we would see a high number oflemons in the market, as compared to high quality trucks. The amount ofmaintenance required on a truck is used as a measure of truck quality. If atruck requires more maintenance than the average, it is considered a lemon.He uses two approaches for testing the model: (1) evaluation of statisticaldata; and (2) estimation of a logit model representing the relationship be-tween mileage and required maintenance (for both used and new trucks) andthen hypothesis testing both the constant and slope parameter estimates tosee if they were statistically different. First, Bond examines the frequencyof truck maintenance on both used and new trucks by looking at the 1977”Truck Inventory and Use”survey. He found that both new and used pickupsneed similar engine maintenance–thus a used pickup cannot be classified asa lemon. He also finds that only a small number of used pickups are in theinferior category, some of that in the superior category (at a 10% level ofsignificance test). From the second means of testing, Bond finds that neitherthe slope or constant terms significantly differ at the 5% level between usedand new pickups. This further disproves the lemons model.
Bond doesn’t find numerous lemons in the used truck market. However,the lack of numerous lemons in the market is consistent with the fact thatowners sell vehicles when maintenance becomes too expensive. One poten-tial reason is people who have high maintenance costs for pickups sell theirgods to those who can maintenance them by themselves (have lower maine-nance costs). This could be why not much data exists on used pickup truckmaintenance.
Solutions to Information Asymmetry
Guarantees
Guarantees of a good’s average quality helps reduce buyer uncertainty re-garding quality. This shifts risk-bearing from they buyer to the seller.
Brand names
Brand names serve as an indicator of quality and allow for consumer retalia-tion (i.e., no longer purchasing that brand) in the case that the true qualityof a good fails to reflect the expected quality of the good.
17

Chains
Similar to brand names, these allow nonlocal consumers who are unfamiliarwith a geographic area and the things it offers to be able to expect a levelof quality from a certain type of good, such as restaurant food or hotelaccommodations. These people don’t want to take the risk of getting a“low”quality product (something that doesn’t meet their expectations).
Licensing
Licensing for skilled workers signal to market participants that those pos-sessing licenses have reached a certain level of education, training or skill.
18