making lemonade lemons out of lemons
TRANSCRIPT

Elliott D. Pollack & Company
Making Lemonade
Lemons out of Lemons
By:
Elliott D. Pollack
CEO, Elliott D. Pollack & Company
Elliott D. Pollack & Company
Rating Decline
AAA
AA+
“The Emperor Has No Clothes”
–S&P and the Financial Markets.
Elliott D. Pollack & Company
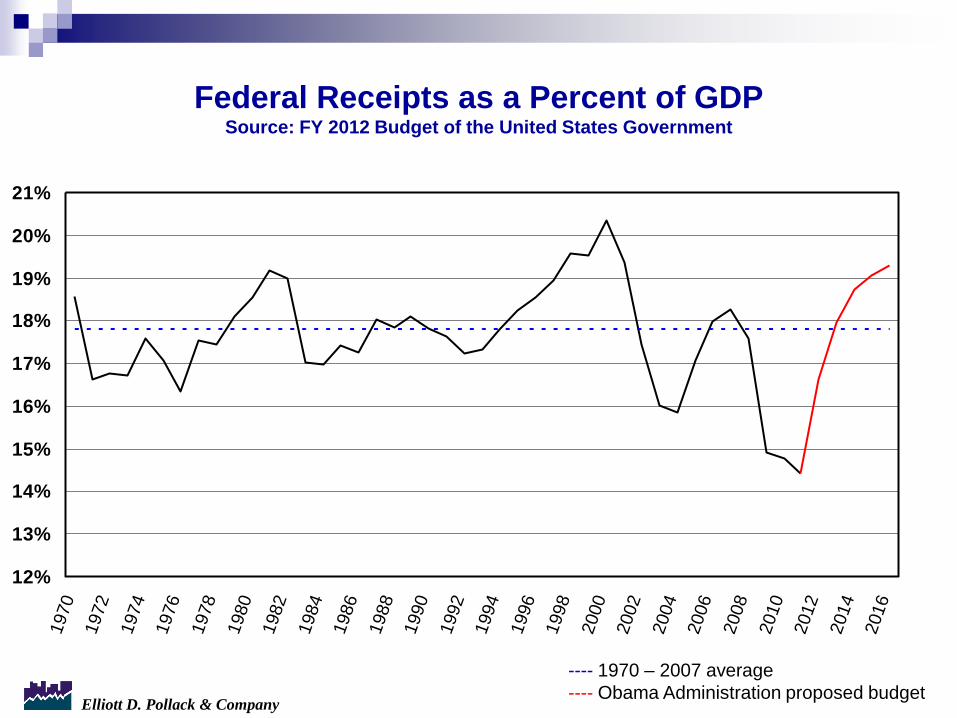
Federal Receipts as a Percent of GDPSource: FY 2012 Budget of the United States Government
12%
13%
14%
15%
16%
17%
18%
19%
20%
21%
1970
1972
1974
1976
1978
1980
1982
1984
1986
1988
1990
1992
1994
1996
1998
2000
2002
2004
2006
2008
2010
2012
2014
2016
---- 1970 – 2007 average
---- Obama Administration proposed budget
Elliott D. Pollack & Company
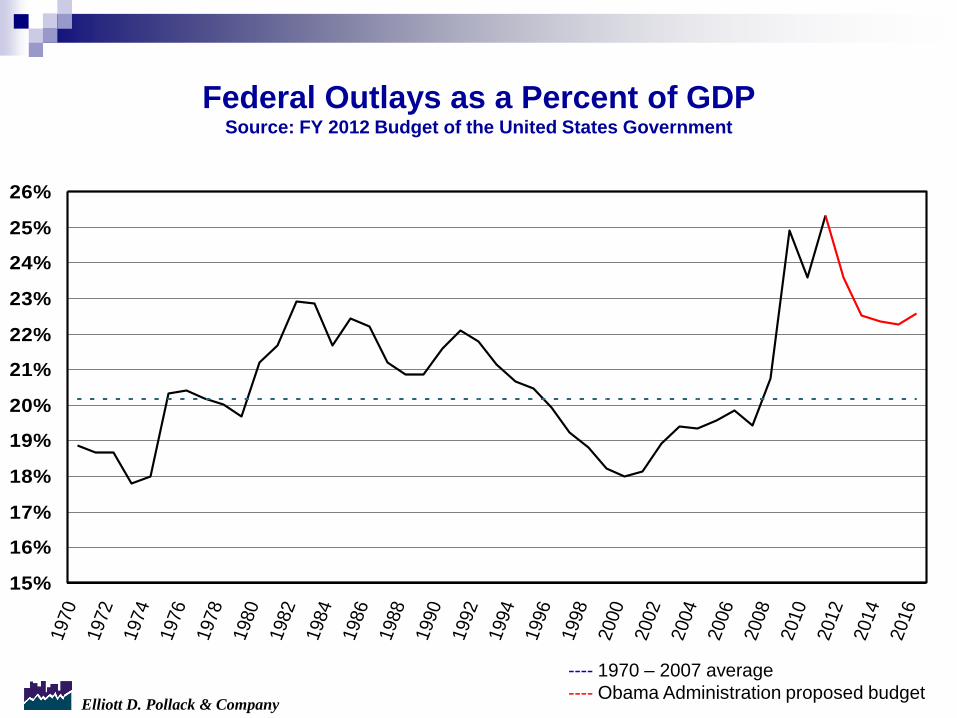
Federal Outlays as a Percent of GDPSource: FY 2012 Budget of the United States Government
15%
16%
17%
18%
19%
20%
21%
22%
23%
24%
25%
26%
1970
1972
1974
1976
1978
1980
1982
1984
1986
1988
1990
1992
1994
1996
1998
2000
2002
2004
2006
2008
2010
2012
2014
2016
---- 1970 – 2007 average
---- Obama Administration proposed budget
Elliott D. Pollack & Company
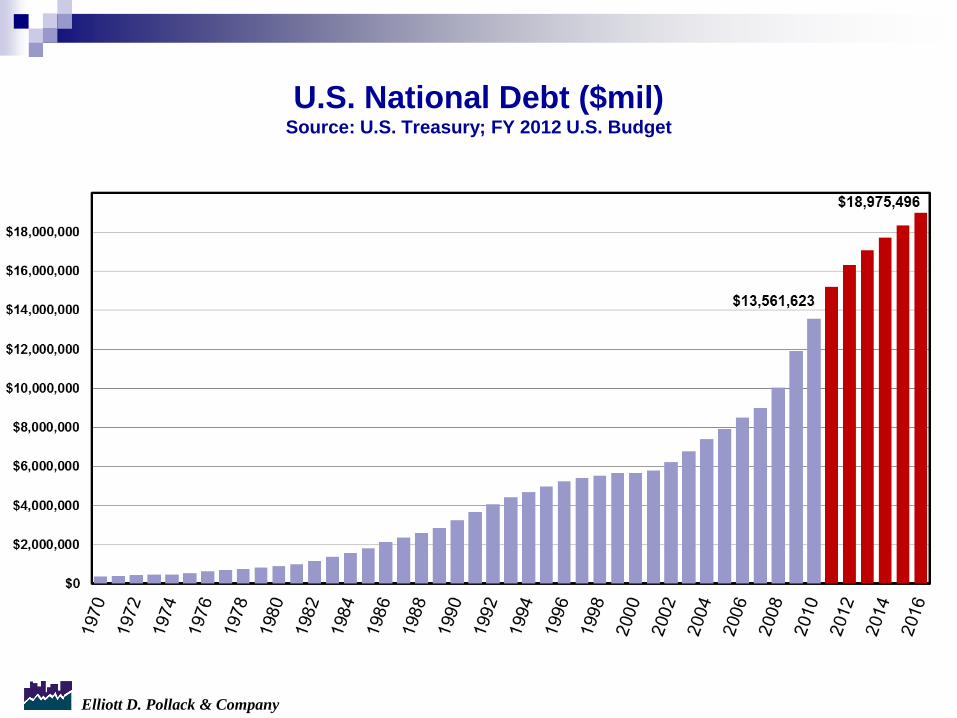
U.S. National Debt ($mil)Source: U.S. Treasury; FY 2012 U.S. Budget
Elliott D. Pollack & Company
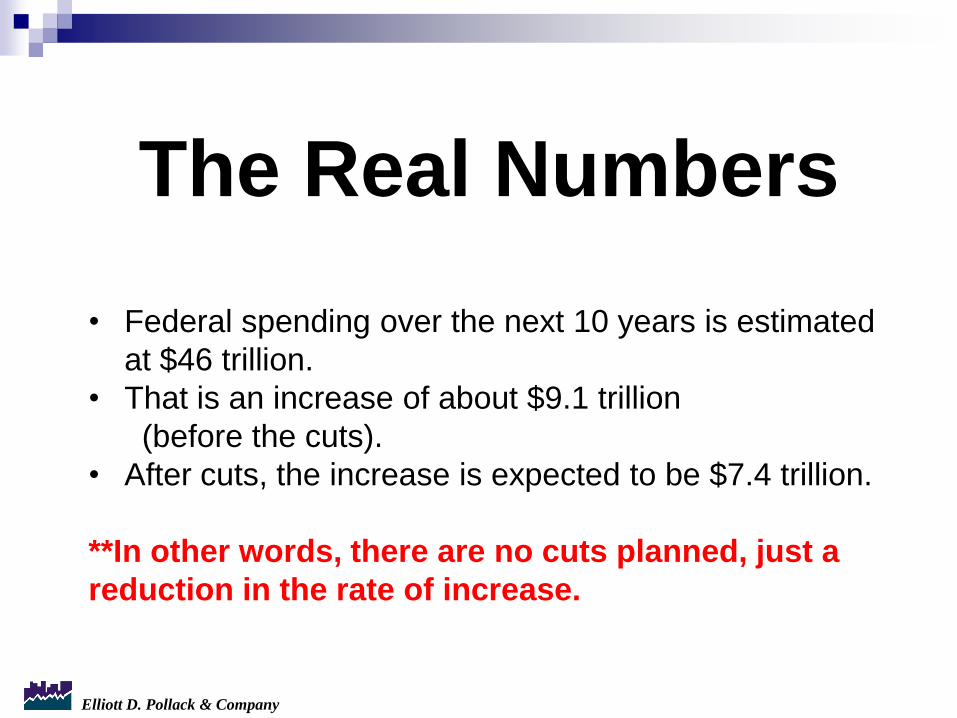
The Real Numbers
• Federal spending over the next 10 years is estimated
at $46 trillion.
• That is an increase of about $9.1 trillion
(before the cuts).
• After cuts, the increase is expected to be $7.4 trillion.
**In other words, there are no cuts planned, just a
reduction in the rate of increase.

Elliott D. Pollack & Company
For Perspective
• Ma & Pa Kettle spend $38,200 per year
• But their income is $21,700.
• They have to put $16,500 on credit card each year.
After the long, hard talk… they cut $190 in year one
and $385 in year two.
Elliott D. Pollack & Company
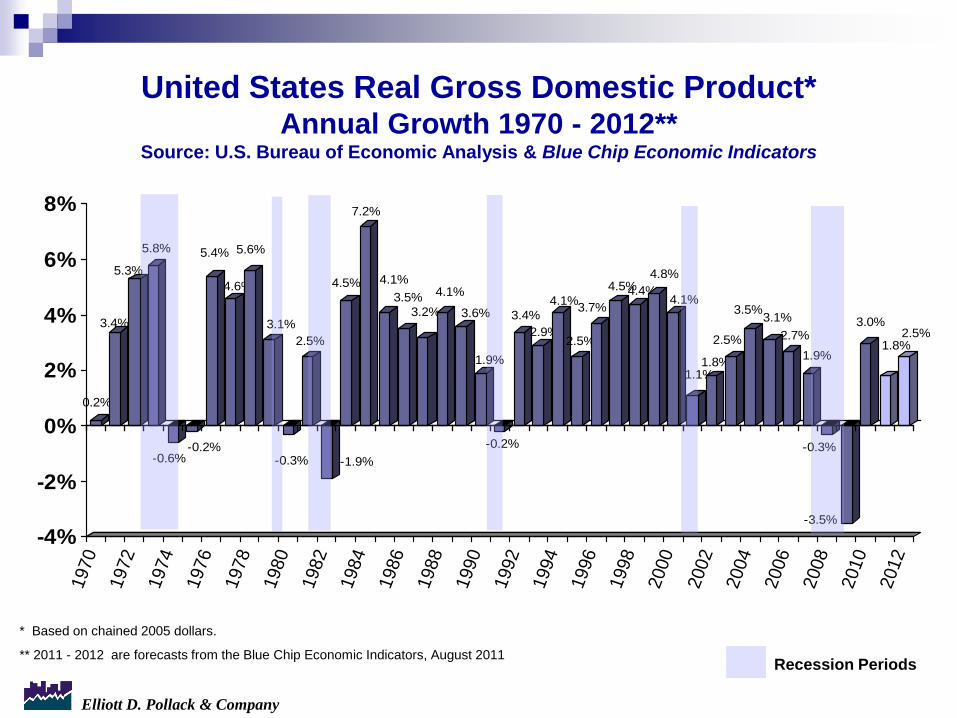
United States Real Gross Domestic Product*Annual Growth 1970 - 2012**
Source: U.S. Bureau of Economic Analysis & Blue Chip Economic Indicators
0.2%
3.4%
5.3%
5.8%
-0.6%-0.2%
5.4%
4.6%
5.6%
3.1%
-0.3%
2.5%
-1.9%
4.5%
7.2%
4.1%
3.5%
3.2%
4.1%
3.6%
1.9%
-0.2%
3.4%
2.9%
4.1%
2.5%
3.7%
4.5%4.4%
4.8%
4.1%
1.1%1.8%
2.5%
3.5%3.1%
2.7%
1.9%
-0.3%
-3.5%
3.0%
1.8%2.5%
-4%
-2%
0%
2%
4%
6%
8%
1970
1972
1974
1976
1978
1980
1982
1984
1986
1988
1990
1992
1994
1996
1998
2000
2002
2004
2006
2008
2010
2012
* Based on chained 2005 dollars.
** 2011 - 2012 are forecasts from the Blue Chip Economic Indicators, August 2011Recession Periods
Elliott D. Pollack & Company
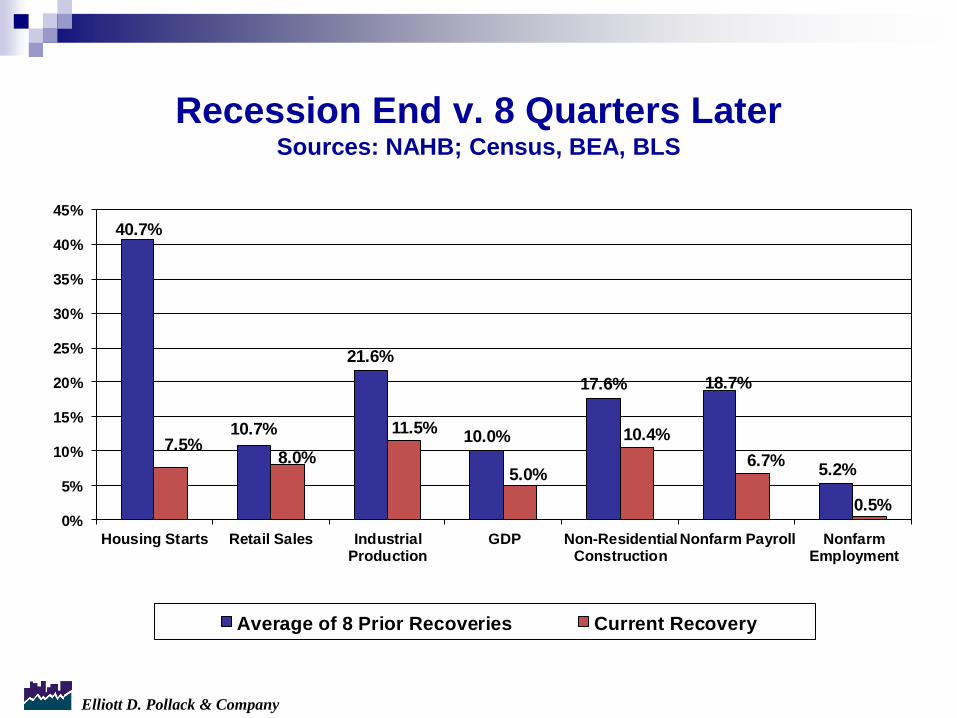
Recession End v. 8 Quarters LaterSources: NAHB; Census, BEA, BLS
40.7%
10.7%
21.6%
10.0%
17.6% 18.7%
5.2%
7.5%8.0%
11.5%
5.0%
10.4%
6.7%
0.5%0%
5%
10%
15%
20%
25%
30%
35%
40%
45%
Housing Starts Retail Sales IndustrialProduction
GDP Non-ResidentialConstruction
Nonfarm Payroll NonfarmEmployment
Average of 8 Prior Recoveries Current Recovery
Elliott D. Pollack & Company
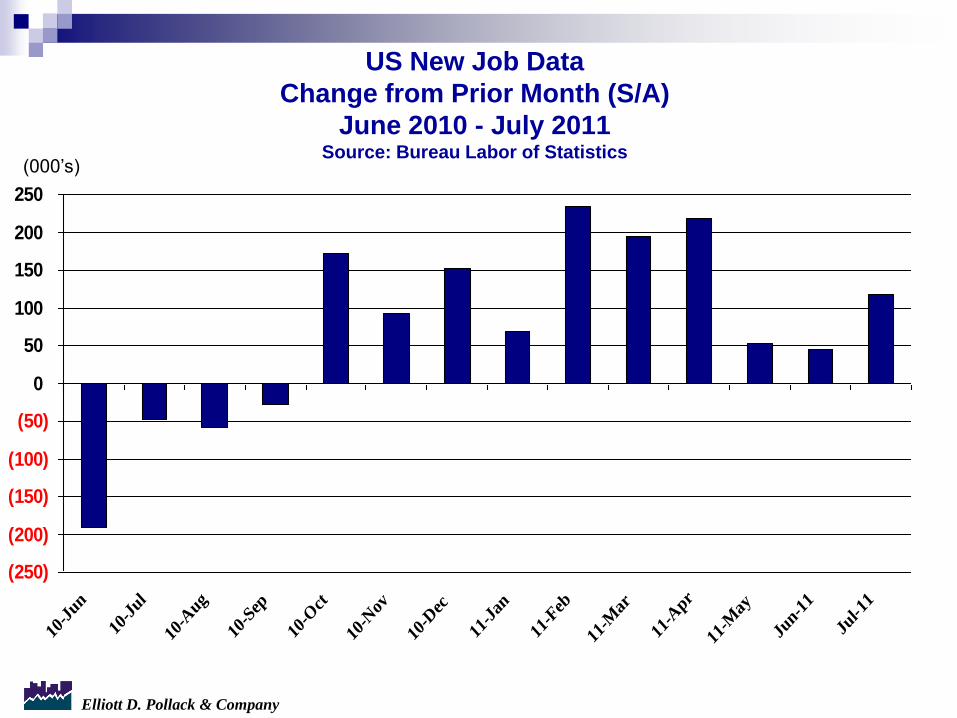
US New Job Data
Change from Prior Month (S/A)
June 2010 - July 2011Source: Bureau Labor of Statistics
(250)
(200)
(150)
(100)
(50)
0
50
100
150
200
250
10-J
un
10-J
ul
10-A
ug
10-S
ep
10-O
ct
10-N
ov
10-D
ec
11-J
an
11-F
eb
11-M
ar
11-A
pr
11-M
ay
Jun-1
1
Jul-11
(000’s)
Elliott D. Pollack & Company
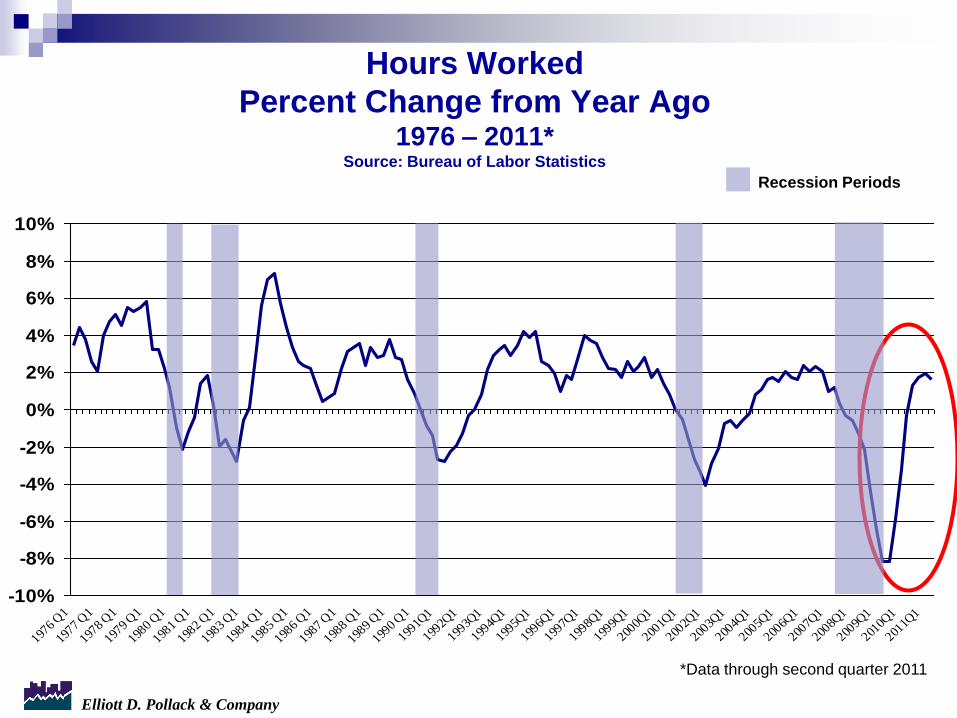
Hours Worked
Percent Change from Year Ago1976 – 2011*
Source: Bureau of Labor Statistics
-10%
-8%
-6%
-4%
-2%
0%
2%
4%
6%
8%
10%
1976
Q1
1977
Q1
1978
Q1
1979
Q1
1980
Q1
1981
Q1
1982
Q1
1983
Q1
1984
Q1
1985
Q1
1986
Q1
1987
Q1
1988
Q1
1989
Q1
1990
Q1
1991Q
1
1992Q
1
1993Q
1
1994Q
1
1995Q
1
1996Q
1
1997Q
1
1998Q
1
1999Q
1
2000Q
1
2001Q
1
2002Q
1
2003Q
1
2004Q
1
2005Q
1
2006Q
1
2007Q
1
2008Q
1
2009Q
1
2010Q
1
2011Q
1
Recession Periods
*Data through second quarter 2011
Elliott D. Pollack & Company
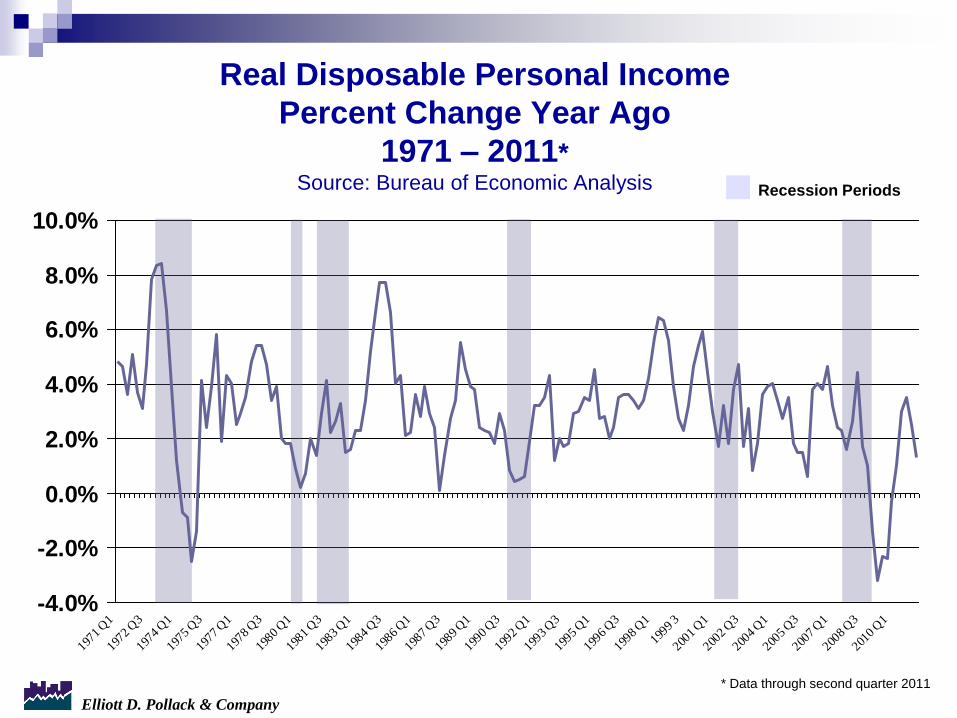
Real Disposable Personal Income
Percent Change Year Ago
1971 – 2011* Source: Bureau of Economic Analysis
-4.0%
-2.0%
0.0%
2.0%
4.0%
6.0%
8.0%
10.0%
1971 Q
1
1972 Q
3
1974 Q
1
1975 Q
3
1977 Q
1
1978 Q
3
1980 Q
1
1981 Q
3
1983 Q
1
1984 Q
3
1986 Q
1
1987 Q
3
1989 Q
1
1990 Q
3
1992 Q
1
1993 Q
3
1995 Q
1
1996 Q
3
1998 Q
1
1999 3
2001 Q
1
2002 Q
3
2004 Q
1
2005 Q
3
2007 Q
1
2008 Q
3
2010 Q
1
* Data through second quarter 2011
Recession Periods
Elliott D. Pollack & Company
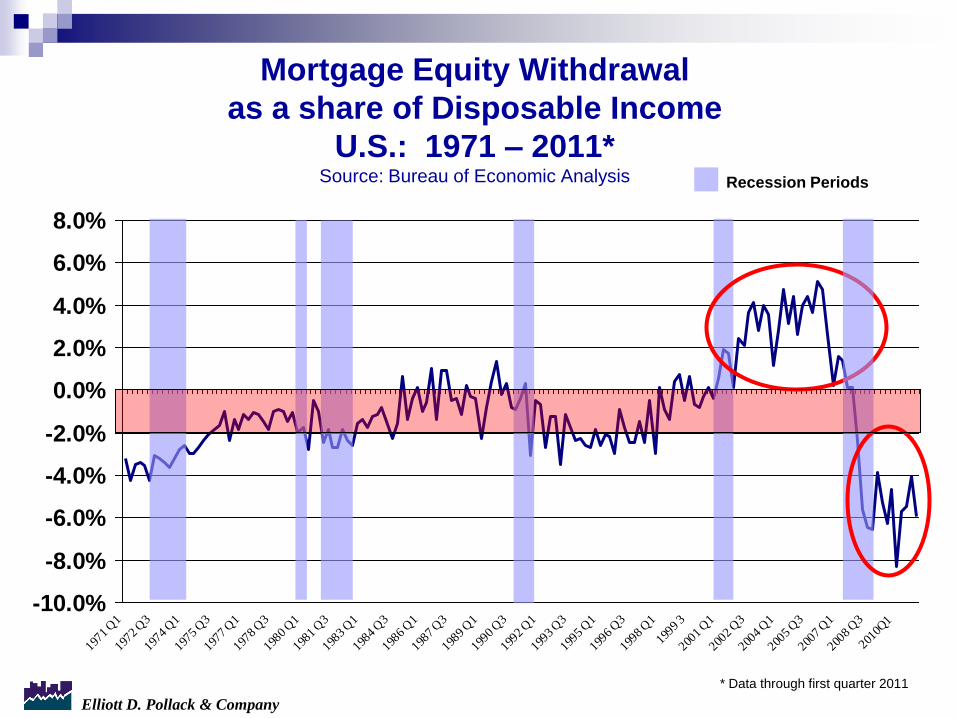
Mortgage Equity Withdrawal
as a share of Disposable Income
U.S.: 1971 – 2011* Source: Bureau of Economic Analysis
-10.0%
-8.0%
-6.0%
-4.0%
-2.0%
0.0%
2.0%
4.0%
6.0%
8.0%
1971 Q
1
1972 Q
3
1974 Q
1
1975 Q
3
1977 Q
1
1978 Q
3
1980 Q
1
1981 Q
3
1983 Q
1
1984 Q
3
1986 Q
1
1987 Q
3
1989 Q
1
1990 Q
3
1992 Q
1
1993 Q
3
1995 Q
1
1996 Q
3
1998 Q
1
1999 3
2001 Q
1
2002 Q
3
2004 Q
1
2005 Q
3
2007 Q
1
2008 Q
3
2010Q
1
* Data through first quarter 2011
Recession Periods
Elliott D. Pollack & Company
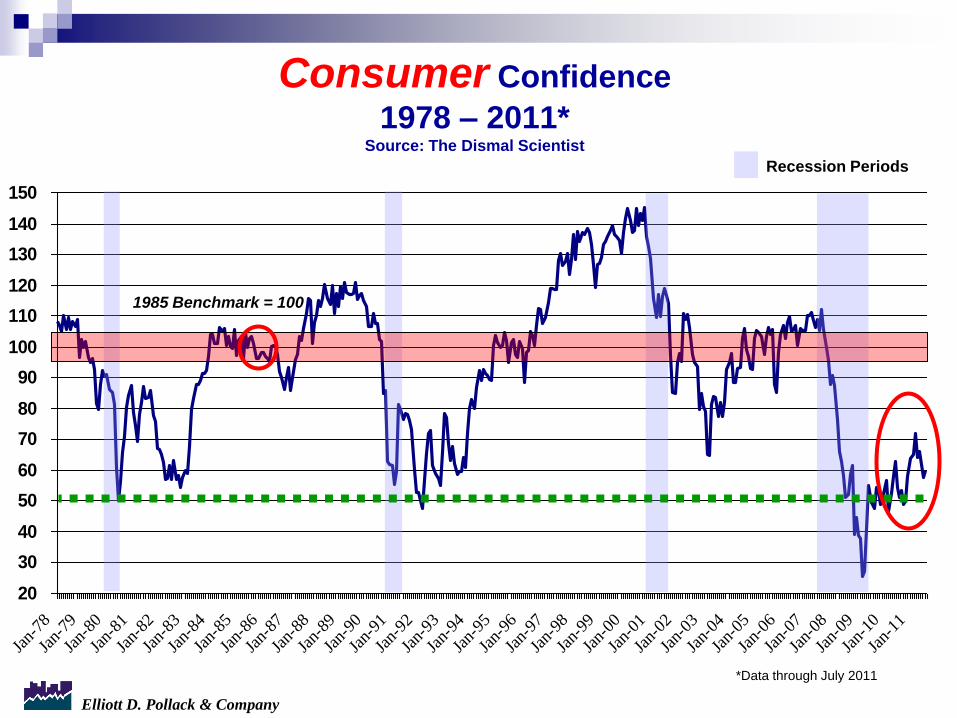
Consumer Confidence
1978 – 2011* Source: The Dismal Scientist
20
30
40
50
60
70
80
90
100
110
120
130
140
150
Jan-
78
Jan-
79
Jan-
80
Jan-
81
Jan-
82
Jan-
83
Jan-
84
Jan-
85
Jan-
86
Jan-
87
Jan-
88
Jan-
89
Jan-
90
Jan-
91
Jan-
92
Jan-
93
Jan-
94
Jan-
95
Jan-
96
Jan-
97
Jan-
98
Jan-
99
Jan-
00
Jan-
01
Jan-
02
Jan-
03
Jan-
04
Jan-
05
Jan-
06
Jan-
07
Jan-
08
Jan-
09
Jan-
10
Jan-
11
*Data through July 2011
Recession Periods
1985 Benchmark = 100

Elliott D. Pollack & Company
U.S. Unemployment Rate
1980 – 2011* Source: Bureau of Labor Statistics
0%
2%
4%
6%
8%
10%
12%
Jan-
80
Jan-
81
Jan-
82
Jan-
83
Jan-
84
Jan-
85
Jan-
86
Jan-
87
Jan-
88
Jan-
89
Jan-
90
Jan-
91
Jan-
92
Jan-
93
Jan-
94
Jan-
95
Jan-
96
Jan-
97
Jan-
98
Jan-
99
Jan-
00
Jan-
01
Jan-
02
Jan-
03
Jan-
04
Jan-
05
Jan-
06
Jan-
07
Jan-
08
Jan-
09
Jan-
10
Jan-
11
*Data through July 2011
Recession Periods
Elliott D. Pollack & Company
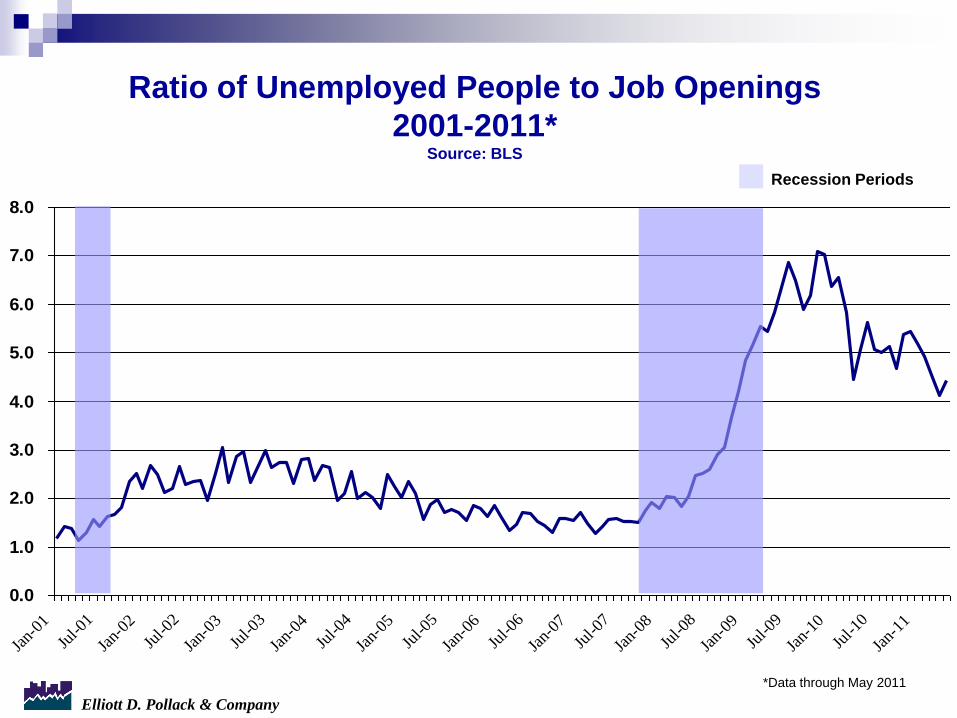
Ratio of Unemployed People to Job Openings
2001-2011*Source: BLS
0.0
1.0
2.0
3.0
4.0
5.0
6.0
7.0
8.0
Jan-
01
Jul-0
1
Jan-
02
Jul-0
2
Jan-
03
Jul-0
3
Jan-
04
Jul-0
4
Jan-
05
Jul-0
5
Jan-
06
Jul-0
6
Jan-
07
Jul-0
7
Jan-
08
Jul-0
8
Jan-
09
Jul-0
9
Jan-
10
Jul-1
0
Jan-
11
Recession Periods
*Data through May 2011
Elliott D. Pollack & Company
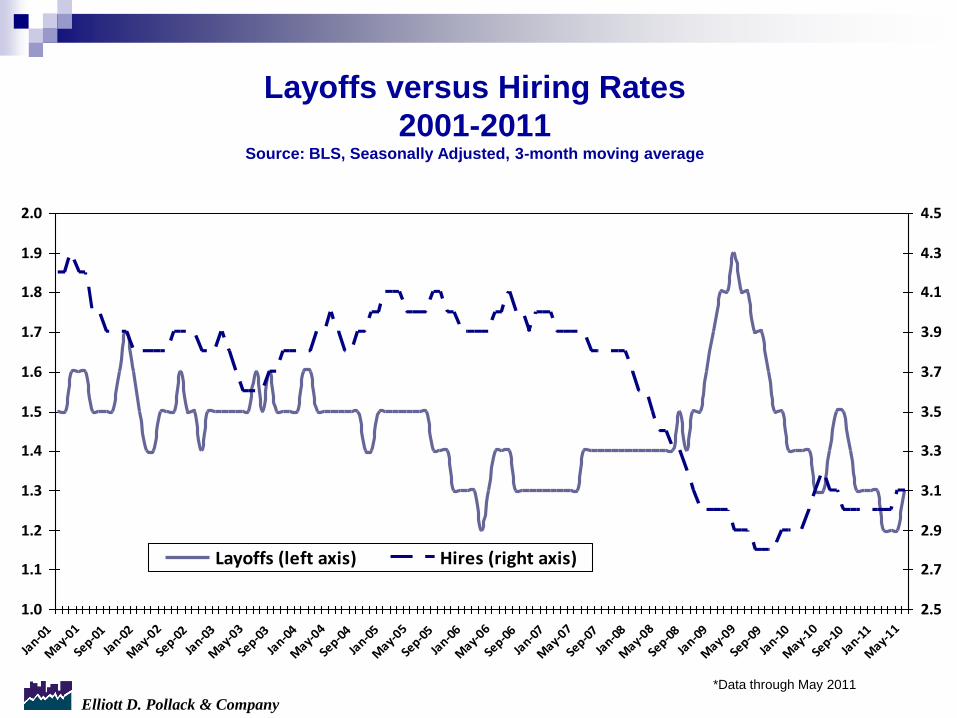
Layoffs versus Hiring Rates
2001-2011Source: BLS, Seasonally Adjusted, 3-month moving average
1.0
1.1
1.2
1.3
1.4
1.5
1.6
1.7
1.8
1.9
2.0
Jan-0
1
May-
01
Sep-0
1
Jan-0
2
May-
02
Sep-0
2
Jan-0
3
May-
03
Sep-0
3
Jan-0
4
May-
04
Sep-0
4
Jan-0
5
May-
05
Sep-0
5
Jan-0
6
May-
06
Sep-0
6
Jan-0
7
May-
07
Sep-0
7
Jan-0
8
May-
08
Sep-0
8
Jan-0
9
May-
09
Sep-0
9
Jan-1
0
May-
10
Sep-1
0
Jan-1
1
May-
11
2.5
2.7
2.9
3.1
3.3
3.5
3.7
3.9
4.1
4.3
4.5
Layoffs (left axis) Hires (right axis)
*Data through May 2011

Elliott D. Pollack & Company
Wealth
Effect

Elliott D. Pollack & Company
In the 90sHousing prices increased moderately,
but stock market boomed.
First half of 2000’sStock market was doing poorly,
but housing prices boomed.
NowHousing prices AND stock market
down from the peak.
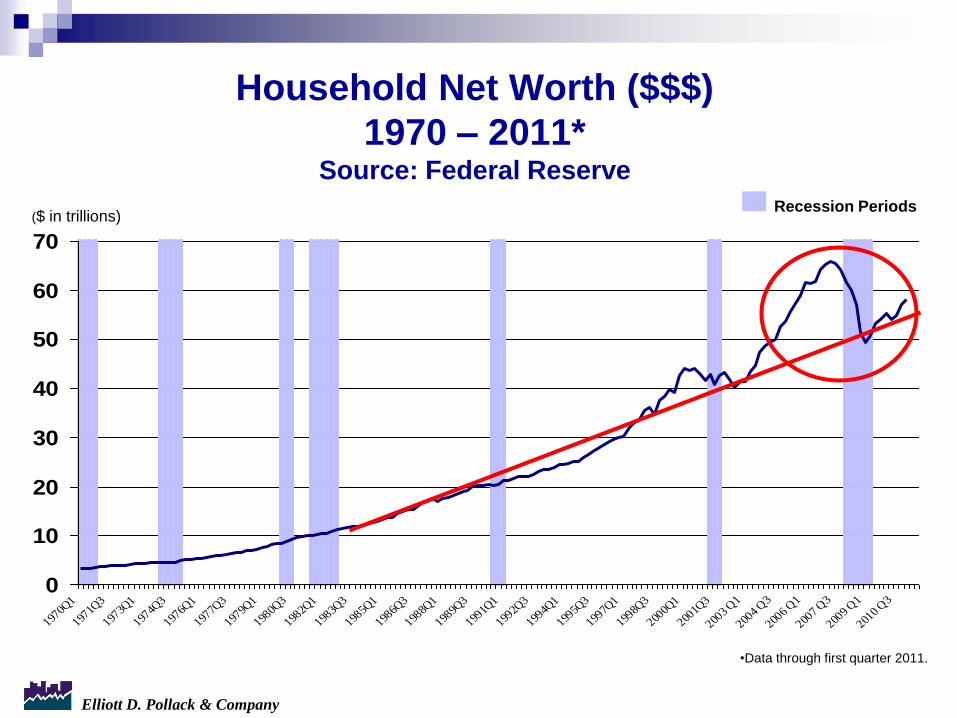
What Will Happen to HH Net Worth?
Elliott D. Pollack & Company
Household Net Worth ($$$)
1970 – 2011*Source: Federal Reserve
0
10
20
30
40
50
60
70
1970Q
1
1971Q
3
1973Q
1
1974Q
3
1976Q
1
1977Q
3
1979Q
1
1980Q
3
1982Q
1
1983Q
3
1985Q
1
1986Q
3
1988Q
1
1989Q
3
1991Q
1
1992Q
3
1994Q
1
1995Q
3
1997Q
1
1998Q
3
2000Q
1
2001Q
3
2003
Q1
2004
Q3
2006
Q1
2007
Q3
2009
Q1
2010
Q3
•Data through first quarter 2011.
Recession Periods($ in trillions)
Elliott D. Pollack & Company
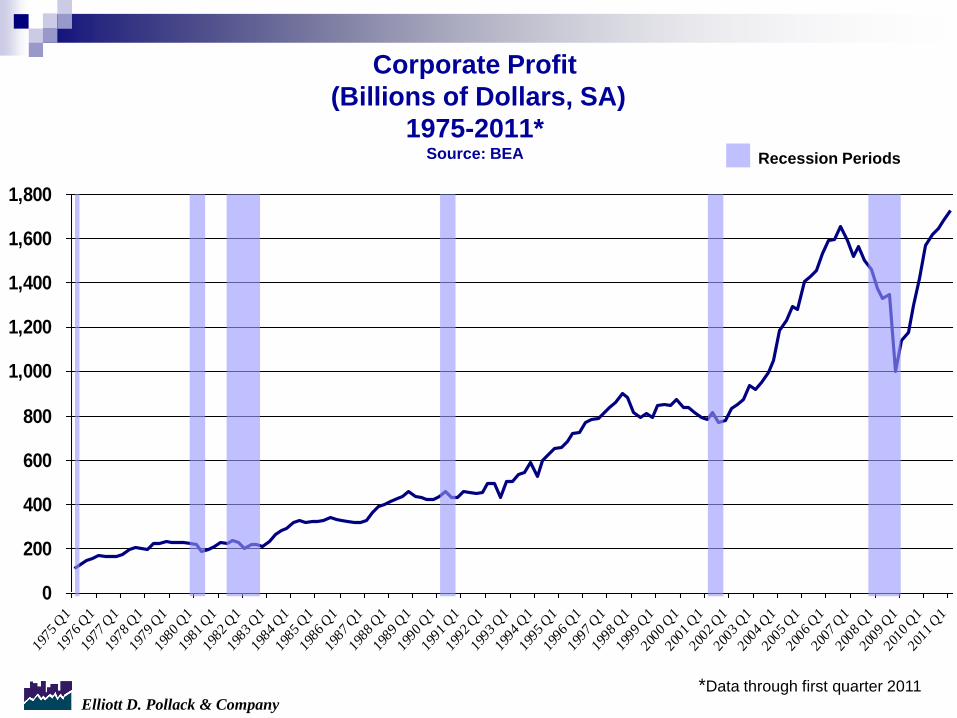
Corporate Profit
(Billions of Dollars, SA)
1975-2011*Source: BEA
0
200
400
600
800
1,000
1,200
1,400
1,600
1,800
1975
Q1
1976
Q1
1977
Q1
1978
Q1
1979
Q1
1980
Q1
1981
Q1
1982
Q1
1983
Q1
1984
Q1
1985
Q1
1986
Q1
1987
Q1
1988
Q1
1989
Q1
1990
Q1
1991
Q1
1992
Q1
1993
Q1
1994
Q1
1995
Q1
1996
Q1
1997
Q1
1998
Q1
1999
Q1
2000
Q1
2001
Q1
2002
Q1
2003
Q1
2004
Q1
2005
Q1
2006
Q1
2007
Q1
2008
Q1
2009
Q1
2010
Q1
2011
Q1
*Data through first quarter 2011
Recession Periods
Elliott D. Pollack & Company
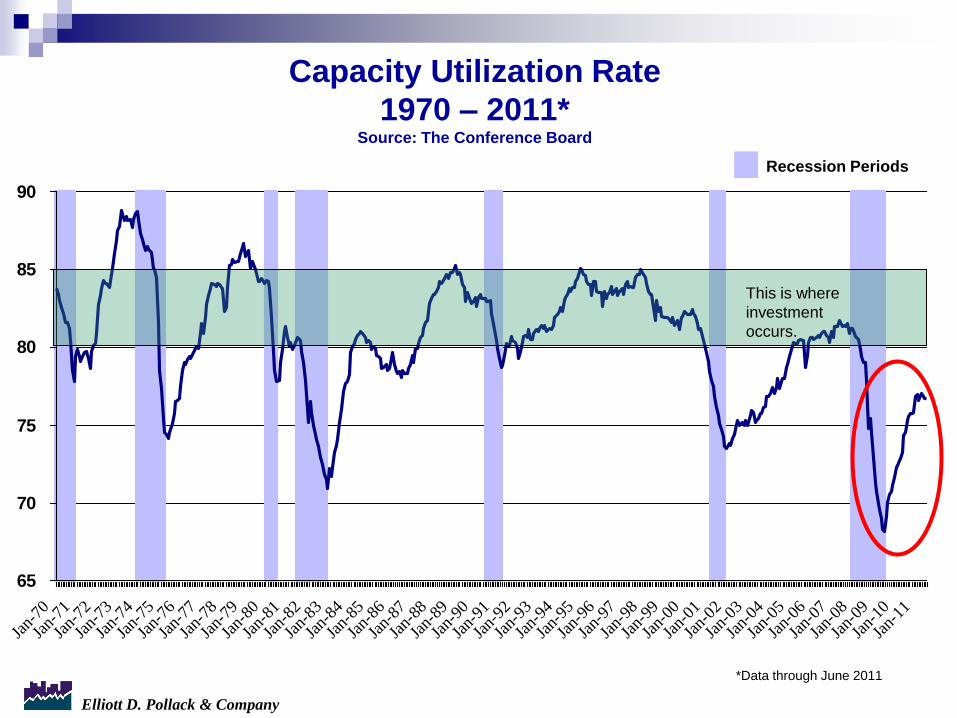
Capacity Utilization Rate
1970 – 2011* Source: The Conference Board
65
70
75
80
85
90
Jan-
70
Jan-
71
Jan-
72
Jan-
73
Jan-
74
Jan-
75
Jan-
76
Jan-
77
Jan-
78
Jan-
79
Jan-
80
Jan-
81
Jan-
82
Jan-
83
Jan-
84
Jan-
85
Jan-
86
Jan-
87
Jan-
88
Jan-
89
Jan-
90
Jan-
91
Jan-
92
Jan-
93
Jan-
94
Jan-
95
Jan-
96
Jan-
97
Jan-
98
Jan-
99
Jan-
00
Jan-
01
Jan-
02
Jan-
03
Jan-
04
Jan-
05
Jan-
06
Jan-
07
Jan-
08
Jan-
09
Jan-
10
Jan-
11
*Data through June 2011
Recession Periods
This is where
investment
occurs.
Elliott D. Pollack & Company
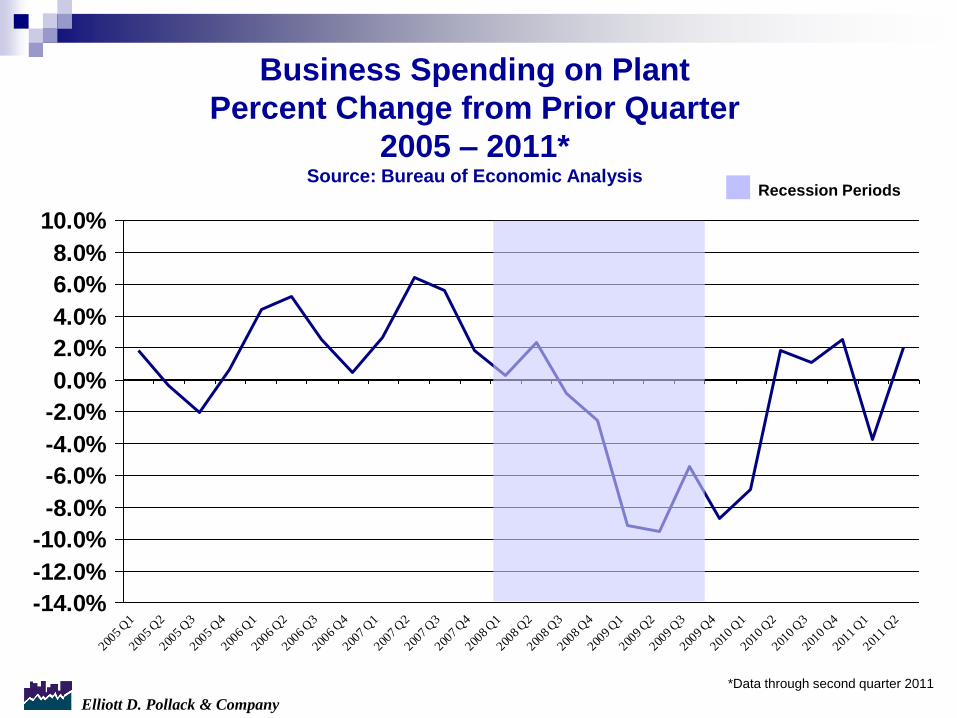
Business Spending on Plant
Percent Change from Prior Quarter
2005 – 2011* Source: Bureau of Economic Analysis
-14.0%
-12.0%
-10.0%
-8.0%
-6.0%
-4.0%
-2.0%
0.0%
2.0%
4.0%
6.0%
8.0%
10.0%
2005 Q
1
2005 Q
2
2005 Q
3
2005 Q
4
2006 Q
1
2006 Q
2
2006 Q
3
2006 Q
4
2007 Q
1
2007 Q
2
2007 Q
3
2007 Q
4
2008 Q
1
2008 Q
2
2008 Q
3
2008 Q
4
2009 Q
1
2009 Q
2
2009 Q
3
2009 Q
4
2010 Q
1
2010 Q
2
2010 Q
3
2010 Q
4
2011 Q
1
2011 Q
2
Recession Periods
*Data through second quarter 2011
Elliott D. Pollack & Company
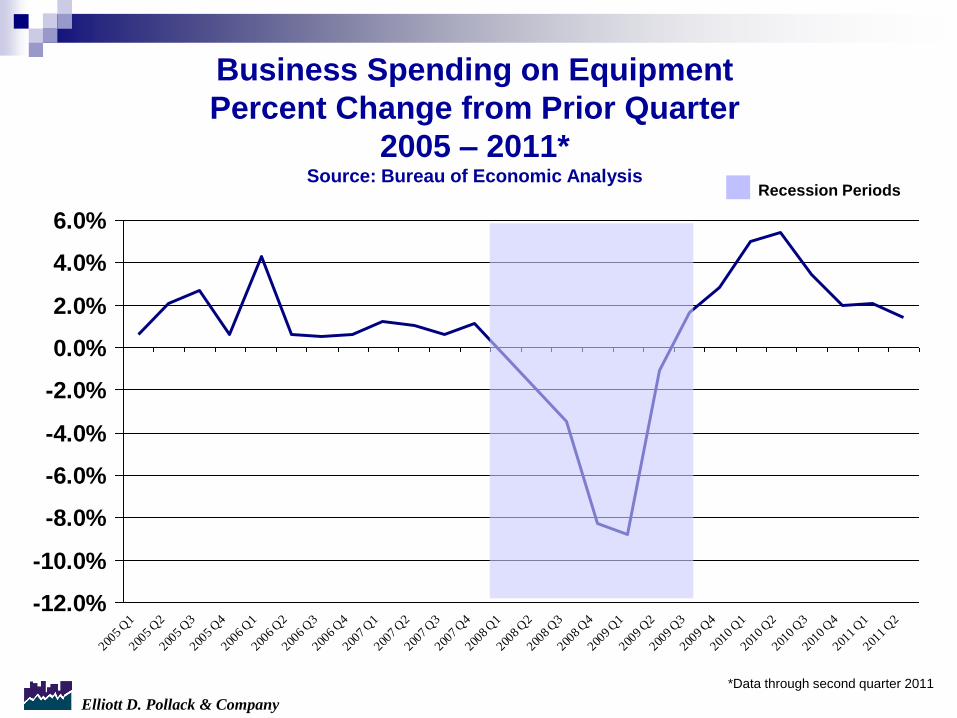
Business Spending on Equipment
Percent Change from Prior Quarter
2005 – 2011* Source: Bureau of Economic Analysis
-12.0%
-10.0%
-8.0%
-6.0%
-4.0%
-2.0%
0.0%
2.0%
4.0%
6.0%
2005 Q
1
2005 Q
2
2005 Q
3
2005 Q
4
2006 Q
1
2006 Q
2
2006 Q
3
2006 Q
4
2007 Q
1
2007 Q
2
2007 Q
3
2007 Q
4
2008 Q
1
2008 Q
2
2008 Q
3
2008 Q
4
2009 Q
1
2009 Q
2
2009 Q
3
2009 Q
4
2010 Q
1
2010 Q
2
2010 Q
3
2010 Q
4
2011 Q
1
2011 Q
2
Recession Periods
*Data through second quarter 2011

Elliott D. Pollack & Company
U.S. Summary:
Recovering but not recovered.

Elliott D. Pollack & Company
ARIZONA
Elliott D. Pollack & Company
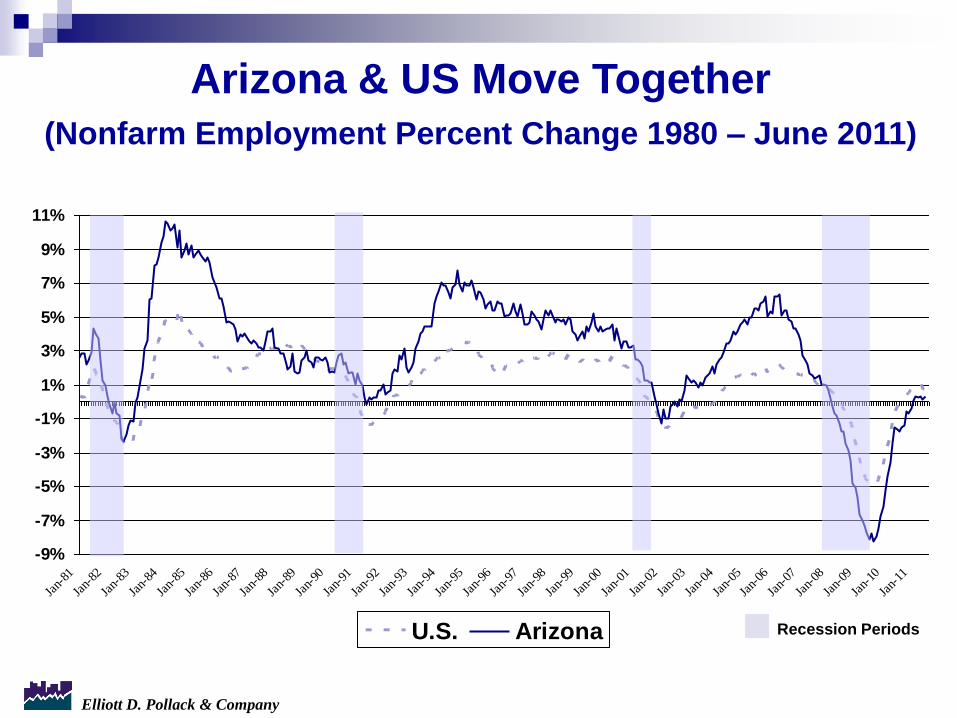
Arizona & US Move Together
(Nonfarm Employment Percent Change 1980 – June 2011)
-9%
-7%
-5%
-3%
-1%
1%
3%
5%
7%
9%
11%
Jan-
81
Jan-
82
Jan-
83
Jan-
84
Jan-
85
Jan-
86
Jan-
87
Jan-
88
Jan-
89
Jan-
90
Jan-
91
Jan-
92
Jan-
93
Jan-
94
Jan-
95
Jan-
96
Jan-
97
Jan-
98
Jan-
99
Jan-
00
Jan-
01
Jan-
02
Jan-
03
Jan-
04
Jan-
05
Jan-
06
Jan-
07
Jan-
08
Jan-
09
Jan-
10
Jan-
11
U.S. Arizona Recession Periods
Elliott D. Pollack & Company
• It took a number of unusual circumstances all
occurring simultaneously,
• Virtually all are temporary events or
conditions,
• This is still a basic ―cyclical‖ problem.
The WHY…

Elliott D. Pollack & Company
• Tourism and Retirement were significantly
impacted (two of our base sectors),
• ―Growth‖ also acts like a base sector in many
western states; this was similarly
impacted (both residential and
commercial) when population growth went
from 3.0% to virtually 0%. We needed
fewer doctors, car dealers, chiropractors,
etc.
• Eventually the recession spread across all
sectors.
The WHO…

Elliott D. Pollack & Company
• Home prices will stabilize across the US as will
wealth levels.
• Those that postponed retirement will indeed retire
and absorb AZ product.
• Those that postponed moving here will do so
as job creation continues and home prices
stabilize and grow.
• Now through about 2015 will still be slower than
normal; but 2015 through 2025 should be
strong.
The WHEN…
Elliott D. Pollack & Company
The problem with base
sectors is just cyclical;
the difference this time has
to do with our dependence
on growth and people’s
ability to move.

Elliott D. Pollack & Company
Arizona Economic
Drivers (Base Industries):(where to focus?)
• Manufacturing (focus)
• Tourism
• Advanced business services (focus)
• Federal government
• Retirement & second homes
• Others (look to where money is being imported).
Elliott D. Pollack & Company
• Goods or services are sold outside the
local economy;
• Money is imported into the region;
• These monies circulate;
• Leakage eventually occurs...
The Effect of Base Industries on
the Local Economy

Elliott D. Pollack & Company
All of these problems
are cyclical and
transitory.

Elliott D. Pollack & Company
The difference this
time is the population
slowdown.
Elliott D. Pollack & Company
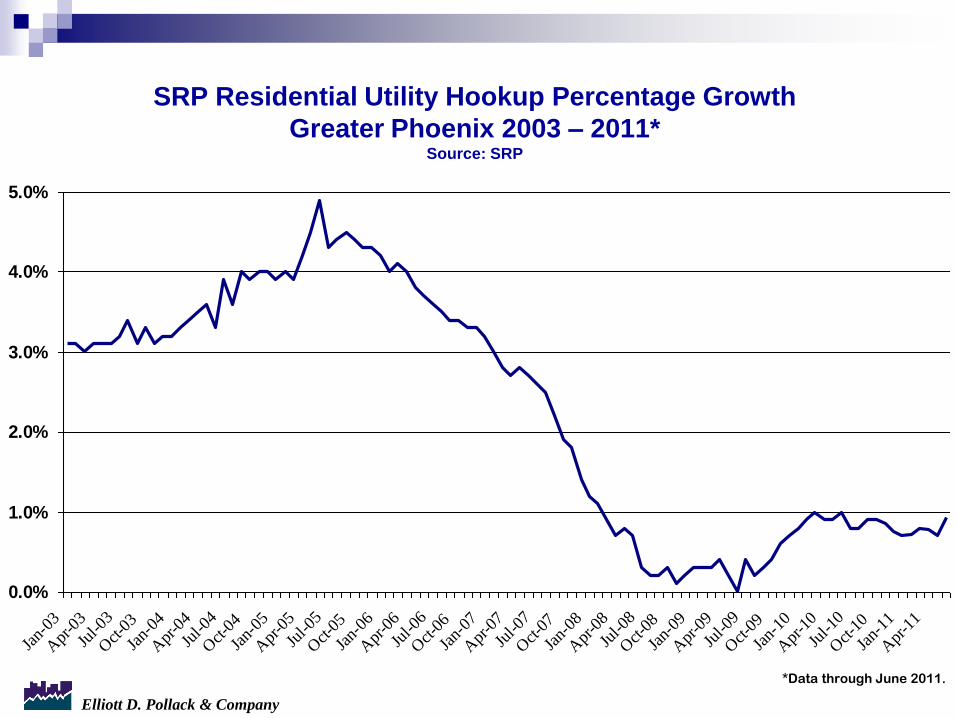
SRP Residential Utility Hookup Percentage Growth
Greater Phoenix 2003 – 2011* Source: SRP
0.0%
1.0%
2.0%
3.0%
4.0%
5.0%
Jan-
03
Apr
-03
Jul-0
3
Oct-0
3
Jan-
04
Apr
-04
Jul-0
4
Oct-0
4
Jan-
05
Apr
-05
Jul-0
5
Oct-0
5
Jan-
06
Apr
-06
Jul-0
6
Oct-0
6
Jan-
07
Apr
-07
Jul-0
7
Oct-0
7
Jan-
08
Apr
-08
Jul-0
8
Oct-0
8
Jan-
09
Apr
-09
Jul-0
9
Oct-0
9
Jan-
10
Apr
-10
Jul-1
0
Oct-1
0
Jan-
11
Apr
-11
*Data through June 2011.
Elliott D. Pollack & Company
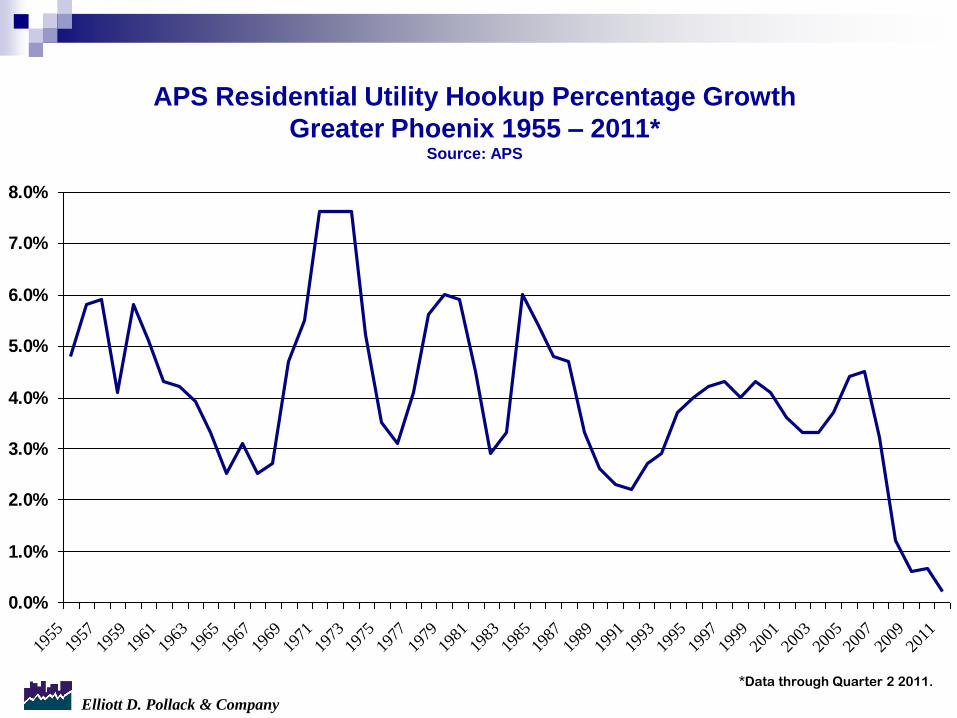
APS Residential Utility Hookup Percentage Growth
Greater Phoenix 1955 – 2011* Source: APS
0.0%
1.0%
2.0%
3.0%
4.0%
5.0%
6.0%
7.0%
8.0%
1955
1957
1959
1961
1963
1965
1967
1969
1971
1973
1975
1977
1979
1981
1983
1985
1987
1989
1991
1993
1995
1997
1999
2001
2003
2005
2007
2009
2011
*Data through Quarter 2 2011.

Elliott D. Pollack & Company
Yet we are optimistic about the
long term and cautious about the
short term.
It’s all about the basics: jobs and
population growth.
Elliott D. Pollack & Company
2.1%
3.7%
4.2%
4.7%
3.9%
3.3%
3.0%
3.1%
4.3%
5.1%
4.2%4.4%
2.9%
2.5%
1.3%
2.4%
2.8%
3.5%
4.3%
4.6%
4.2%4.2%
3.8%
4.3% 4.3%
3.1%
3.2%3.3%
3.4%3.4%
2.7%2.5%
1.6%
1.0%0.9%
0.9%1.2%
0%
2%
4%
6%
1976 1979 1982 1985 1988 1991 1994 1997 2000 2003 2006 2009 2012
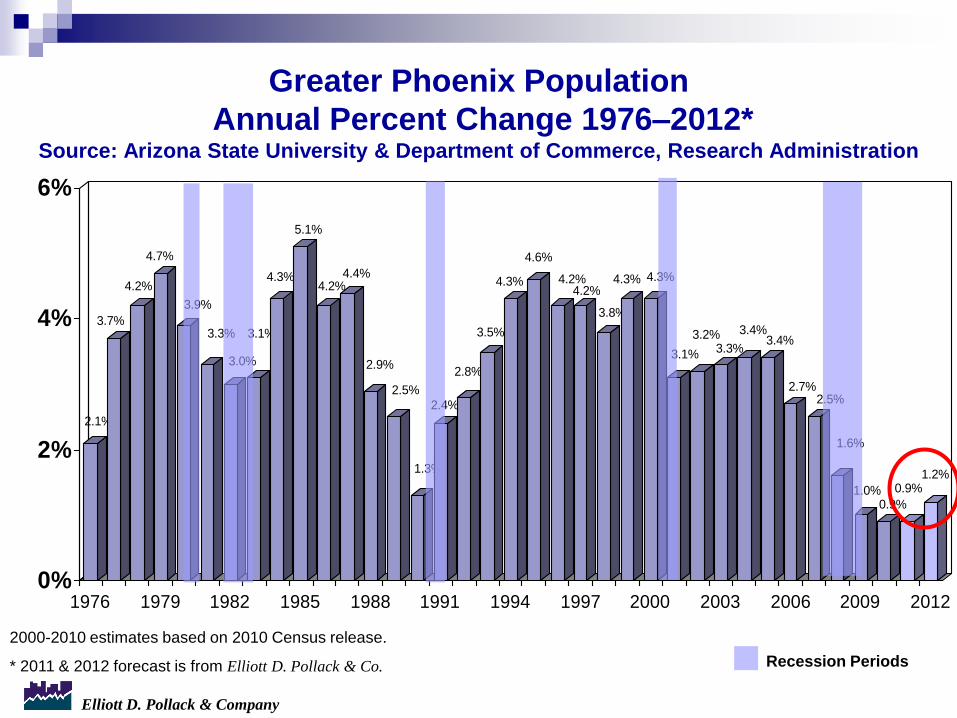
Greater Phoenix Population
Annual Percent Change 1976–2012*Source: Arizona State University & Department of Commerce, Research Administration
2000-2010 estimates based on 2010 Census release.
* 2011 & 2012 forecast is from Elliott D. Pollack & Co. Recession Periods
Elliott D. Pollack & Company
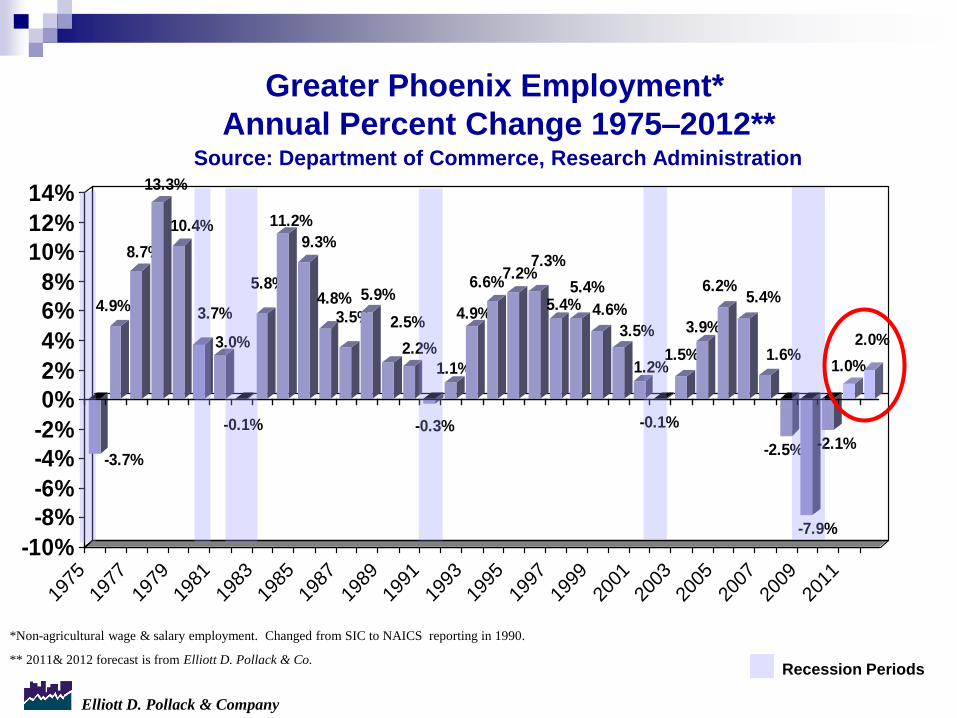
Greater Phoenix Employment*
Annual Percent Change 1975–2012**Source: Department of Commerce, Research Administration
-3.7%
4.9%
8.7%
13.3%
10.4%
3.7%
3.0%
-0.1%
5.8%
11.2%
9.3%
4.8%3.5%
5.9%
2.5%
2.2%
-0.3%
1.1%
4.9%
6.6%7.2%
7.3%
5.4%5.4%
4.6%
3.5%
1.2%
-0.1%
1.5%
3.9%
6.2%5.4%
1.6%
-2.5%
-7.9%
-2.1%
1.0%
2.0%
-10%
-8%
-6%
-4%
-2%
0%
2%
4%
6%
8%
10%
12%
14%
1975
1977
1979
1981
1983
1985
1987
1989
1991
1993
1995
1997
1999
2001
2003
2005
2007
2009
2011
*Non-agricultural wage & salary employment. Changed from SIC to NAICS reporting in 1990.
** 2011& 2012 forecast is from Elliott D. Pollack & Co.Recession Periods

Elliott D. Pollack & Company
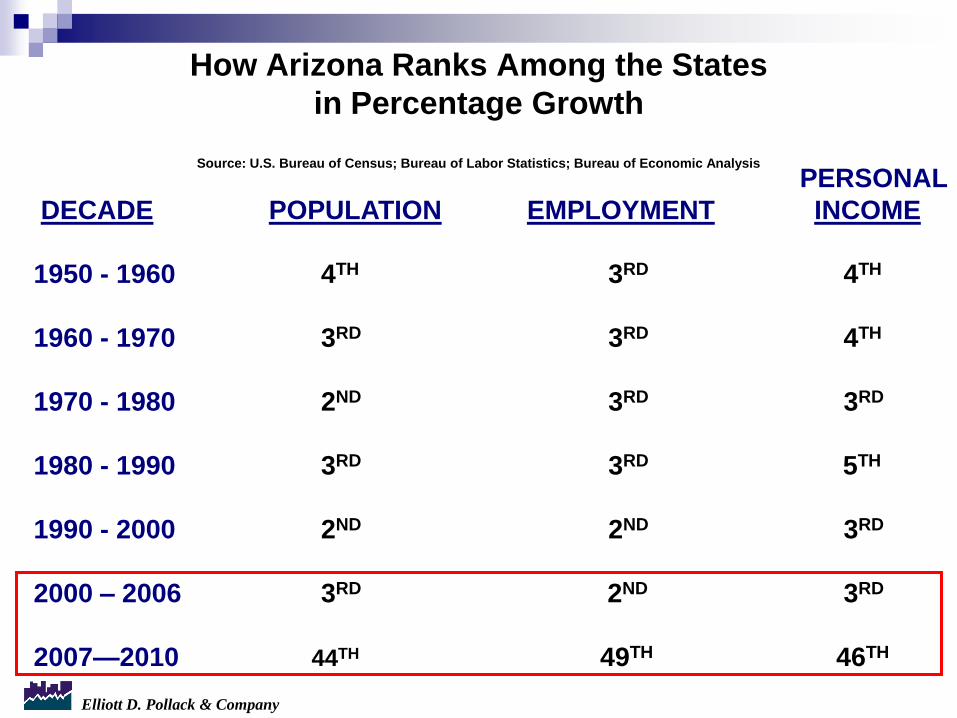
Arizona was one of the only two
states to be in the top 5 growth
states in terms of population,
employment and personal income
every decade since WWII.
Pre 2007
Elliott D. Pollack & Company
Below average performance in
many economic categories, but
this is a temporary condition and
is already improving…
Post 2007
Elliott D. Pollack & Company
How Arizona Ranks Among the States
in Percentage Growth
Source: U.S. Bureau of Census; Bureau of Labor Statistics; Bureau of Economic Analysis
PERSONAL
DECADE POPULATION EMPLOYMENT INCOME
1950 - 1960 4TH 3RD 4TH
1960 - 1970 3RD 3RD 4TH
1970 - 1980 2ND 3RD 3RD
1980 - 1990 3RD 3RD 5TH
1990 - 2000 2ND 2ND 3RD
2000 – 2006 3RD 2ND 3RD
2007—2010 44TH 49TH 46TH

Elliott D. Pollack & Company
The recovery
has already started.

Elliott D. Pollack & Company
Signs of Recovery
• Jobs
• Retail Sales
• Jobs rebound in other cities
• Fewer excess homes
• Fewer excess lots
• Population growth

Elliott D. Pollack & Company
Greater Phoenix -
Jobs Finally in the Black
Over last 12 months: 17,900
12 months before that: (29,100)
12 months before that: (161,400)
* As of June 2011

Elliott D. Pollack & Company
Employment Levels:
Greater Phoenix back to Peak in 2015?Source: ADOC
1,000.0
1,200.0
1,400.0
1,600.0
1,800.0
2,000.0
2,200.0
2,400.0
Jan-
95
Jul-9
5
Jan-
96
Jul-9
6
Jan-
97
Jul-9
7
Jan-
98
Jul-9
8
Jan-
99
Jul-9
9
Jan-
00
Jul-0
0
Jan-
01
Jul-0
1
Jan-
02
Jul-0
2
Jan-
03
Jul-0
3
Jan-
04
Jul-0
4
Jan-
05
Jul-0
5
Jan-
06
Jul-0
6
Jan-
07
Jul-0
7
Jan-
08
Jul-0
8
Jan-
09
Jul-0
9
Jan-
10
Jul-1
0
Jan-
11
Jul-1
1
Jan-
12
Jul-1
2
Jan-
13
Jul-1
3
Jan-
14
Jul-1
4
Jan-
15
Recession Periods
Peak
Elliott D. Pollack & Company
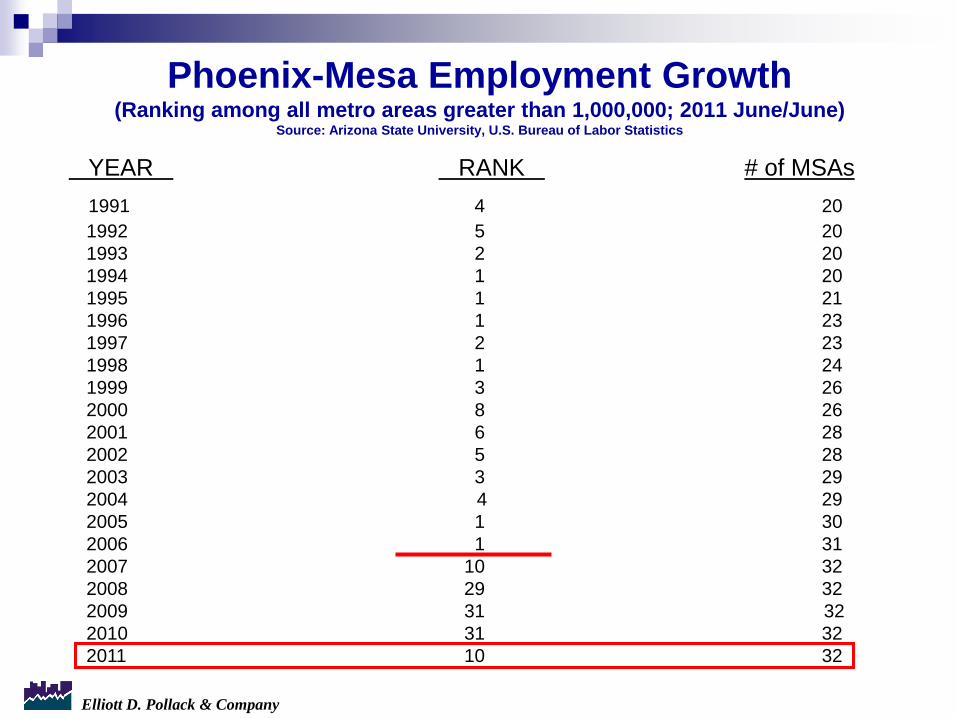
Phoenix-Mesa Employment Growth(Ranking among all metro areas greater than 1,000,000; 2011 June/June)
Source: Arizona State University, U.S. Bureau of Labor Statistics
YEAR RANK # of MSAs
1991 4 20
1992 5 20
1993 2 20
1994 1 20
1995 1 21
1996 1 23
1997 2 23
1998 1 24
1999 3 26
2000 8 26
2001 6 28
2002 5 28
2003 3 29
2004 4 29
2005 1 30
2006 1 31
2007 10 32
2008 29 32
2009 31 32
2010 31 32
2011 10 32
Elliott D. Pollack & Company
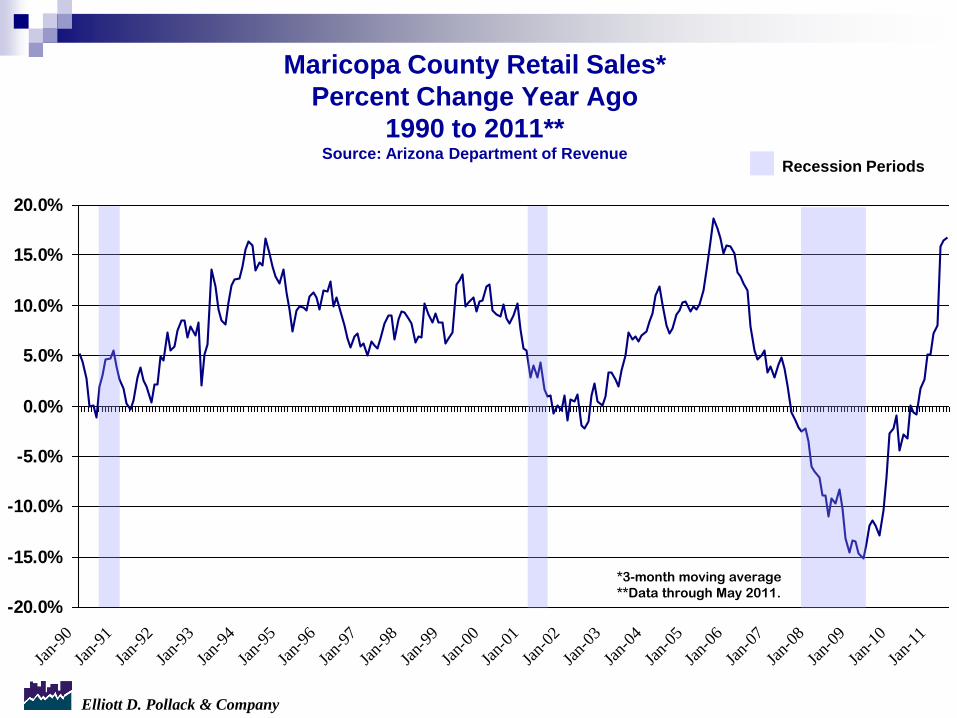
Maricopa County Retail Sales*
Percent Change Year Ago
1990 to 2011**Source: Arizona Department of Revenue
-20.0%
-15.0%
-10.0%
-5.0%
0.0%
5.0%
10.0%
15.0%
20.0%
Jan-
90
Jan-
91
Jan-
92
Jan-
93
Jan-
94
Jan-
95
Jan-
96
Jan-
97
Jan-
98
Jan-
99
Jan-
00
Jan-
01
Jan-
02
Jan-
03
Jan-
04
Jan-
05
Jan-
06
Jan-
07
Jan-
08
Jan-
09
Jan-
10
Jan-
11
*3-month moving average
**Data through May 2011.
Recession Periods

Elliott D. Pollack & Company
Single Family Housing
―No significant recovery
without a recovery in
housing‖

Elliott D. Pollack & Company
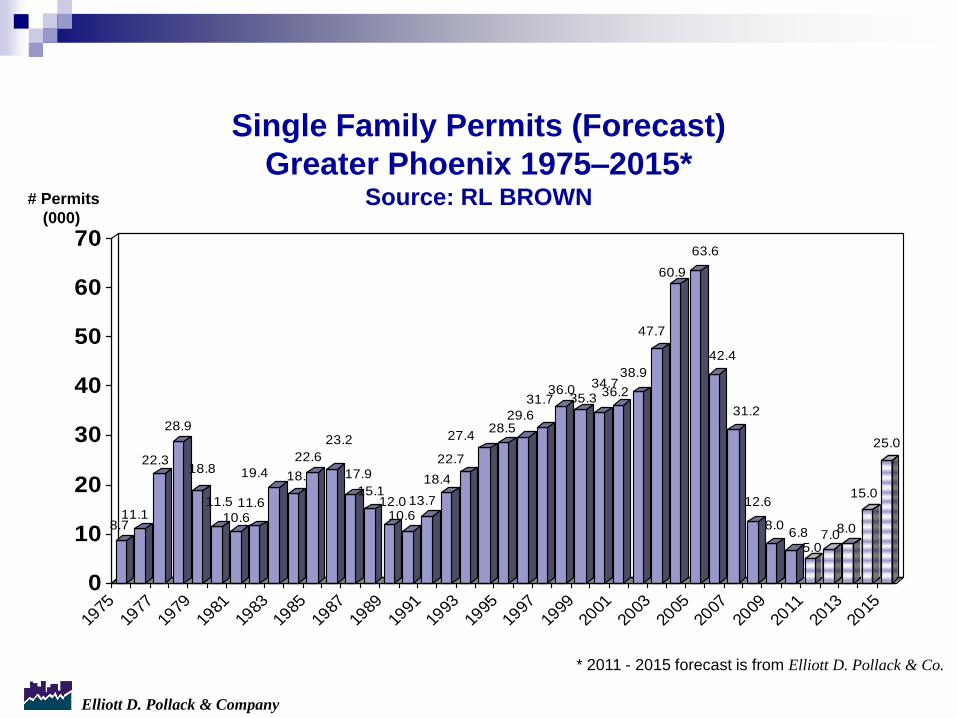
For Housing -
This is NOT a multi decade
recovery…
Think 2015 – 2016 for full
recovery, but growth
before then.
Elliott D. Pollack & Company
Single Family Permits (Forecast)
Greater Phoenix 1975–2015*Source: RL BROWN
8.711.1
22.3
28.9
18.8
11.5
10.611.6
19.4 18.1
22.6
23.2
17.9
15.112.0
10.613.7
18.4
22.7
27.428.5
29.6
31.736.0
35.334.7
36.2
38.9
47.7
60.9
63.6
42.4
31.2
12.6
8.06.8
5.07.0
8.0
15.0
25.0
0
10
20
30
40
50
60
70
1975
1977
1979
1981
1983
1985
1987
1989
1991
1993
1995
1997
1999
2001
2003
2005
2007
2009
2011
2013
2015
# Permits
(000)
* 2011 - 2015 forecast is from Elliott D. Pollack & Co.

Elliott D. Pollack & Company
Across the US, little new
building has been
occurring.
This helps reduce the
oversupply.

Elliott D. Pollack & Company
Excess supply
in Greater
Phoenix is
about
55-60k units as
of today, down
from about 80k
units.
SUPPLY
demand

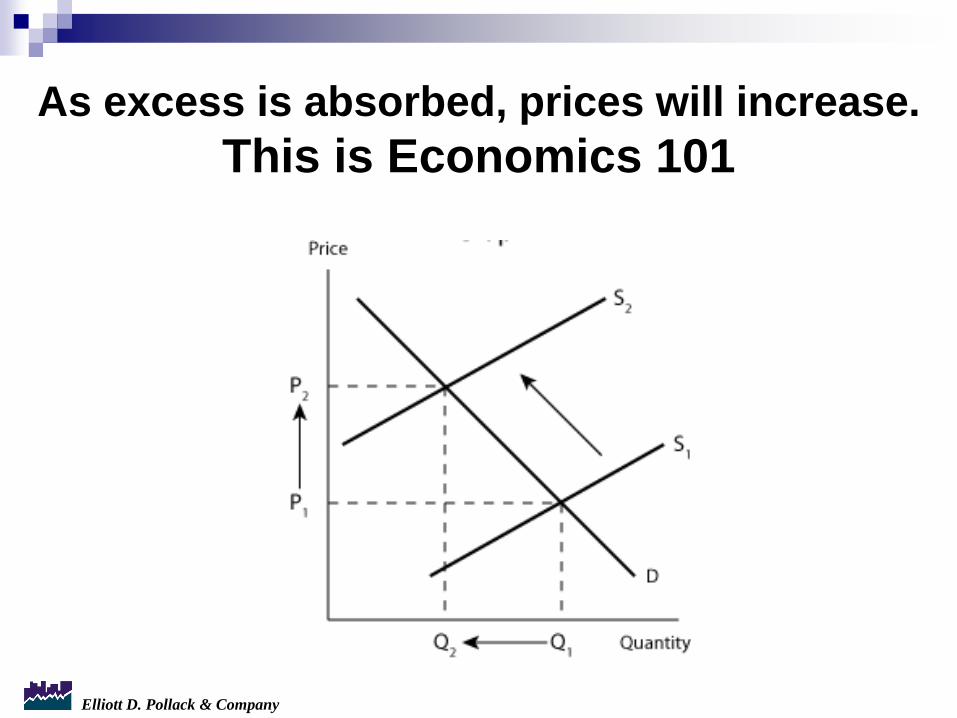
Elliott D. Pollack & Company
Think of what the housing
market is going through as the
same as any manufacturer that
finds themselves with
excess inventory.
Prices are cut until the
excess is sold.
Then prices rise.
Elliott D. Pollack & Company
As excess is absorbed, prices will increase.
This is Economics 101
Elliott D. Pollack & Company
Historically, there is a one-to-one
relationship between population
growth and household growth
(meaning a 1% increase in
population growth leads to a 1%
increase in household growth).
Source: Linneman Letter
Elliott D. Pollack & Company
When unemployment exceeds 7%, a
1% increase in population leads to a
0.3% increase in households.
When unemployment falls below
7%, each 1% increase in population
leads to a 1.9% increase in
households.
Source: Linneman Letter

Elliott D. Pollack & Company
Thus, in a weak economy,
population growth fails to
translate into household growth,
but when the economy begins to
strengthen, there is pent-up
demand for housing.
Source: Linneman Letter
Elliott D. Pollack & Company
In Arizona, the same basic
trend has occurred.
Elliott D. Pollack & Company
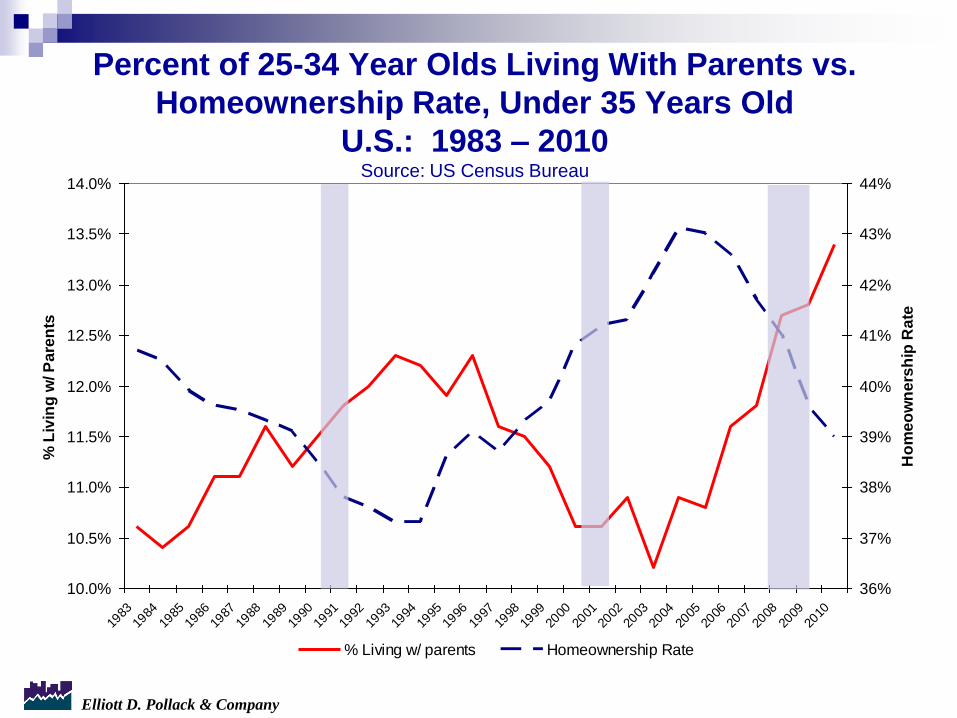
Percent of 25-34 Year Olds Living With Parents vs.
Homeownership Rate, Under 35 Years Old
U.S.: 1983 – 2010 Source: US Census Bureau
10.0%
10.5%
11.0%
11.5%
12.0%
12.5%
13.0%
13.5%
14.0%
1983
1984
1985
1986
1987
1988
1989
1990
1991
1992
1993
1994
1995
1996
1997
1998
1999
2000
2001
2002
2003
2004
2005
2006
2007
2008
2009
2010
% L
ivin
g w
/ P
are
nts
36%
37%
38%
39%
40%
41%
42%
43%
44%
Ho
me
ow
ne
rsh
ip R
ate
% Living w/ parents Homeownership Rate

Elliott D. Pollack & Company
Why are households not forming?
1. Lack of jobs,
2. Inability to sell home elsewhere and
move to Greater Phoenix,
3. Lack of jobs,
4. Lack of jobs,
5. Lack of jobs.

Elliott D. Pollack & Company
The Real Problem:
• Too many vacant homes
(but amount of excess is declining).
• Not enough new households
(but this will change as jobs increase).

Elliott D. Pollack & Company
Commercial
Markets…

Elliott D. Pollack & Company
APARTMENTS
Elliott D. Pollack & Company
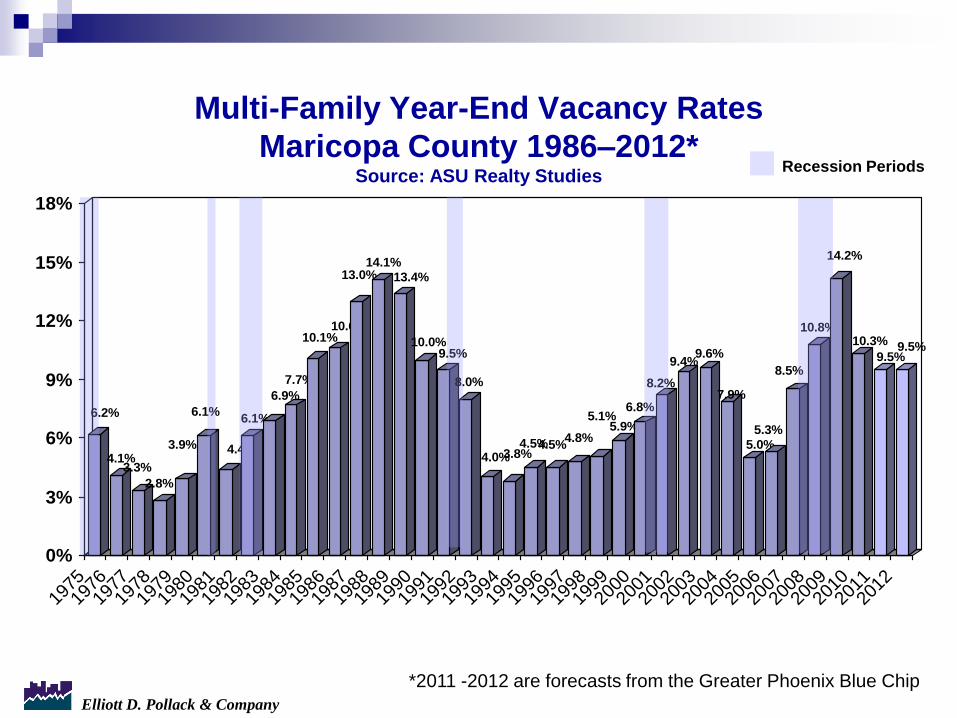
Multi-Family Year-End Vacancy Rates
Maricopa County 1986–2012*Source: ASU Realty Studies
6.2%
4.1%3.3%
2.8%
3.9%
6.1%
4.4%
6.1%
6.9%
7.7%
10.1%10.6%
13.0%14.1%
13.4%
10.0%9.5%
8.0%
4.0%3.8%4.5%4.5%
4.8%
5.1%5.9%
6.8%
8.2%
9.4%9.6%
7.9%
5.0%
5.3%
8.5%
10.8%
14.2%
10.3%
9.5%9.5%
0%
3%
6%
9%
12%
15%
18%
1975
1976
1977
1978
1979
1980
1981
1982
1983
1984
1985
1986
1987
1988
1989
1990
1991
1992
1993
1994
1995
1996
1997
1998
1999
2000
2001
2002
2003
2004
2005
2006
2007
2008
2009
2010
2011
2012
*2011 -2012 are forecasts from the Greater Phoenix Blue Chip
Recession Periods
Elliott D. Pollack & Company
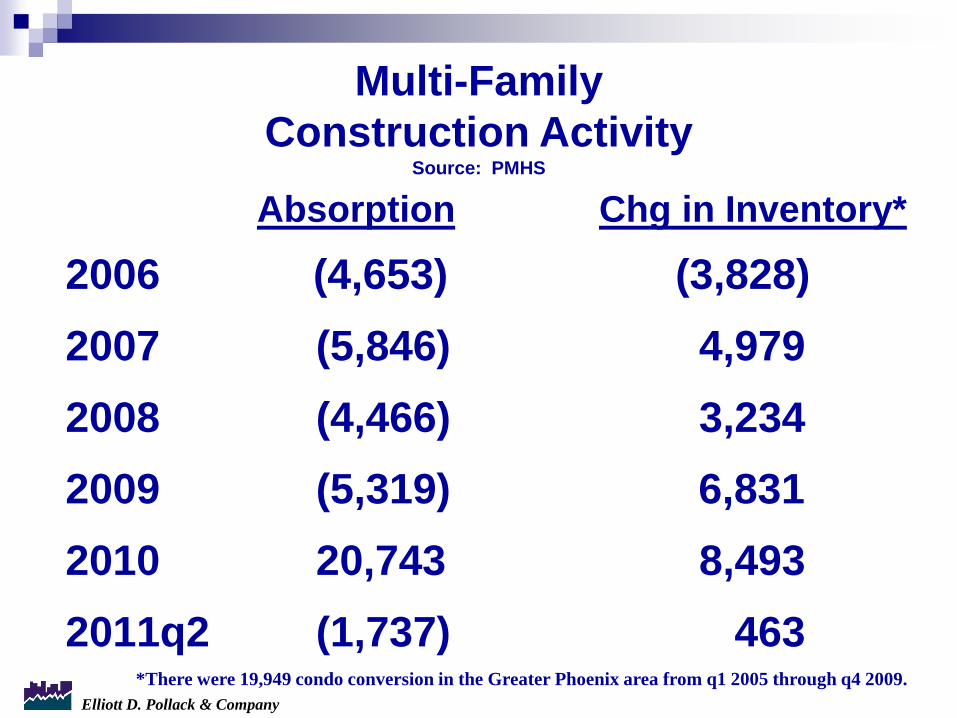
Absorption Chg in Inventory*
2006 (4,653) (3,828)
2007 (5,846) 4,979
2008 (4,466) 3,234
2009 (5,319) 6,831
2010 20,743 8,493
2011q2 (1,737) 463
Multi-Family
Construction ActivitySource: PMHS
*There were 19,949 condo conversion in the Greater Phoenix area from q1 2005 through q4 2009.

Elliott D. Pollack & Company
There are currently
191 multi-family units under
construction (Q2 11).

Elliott D. Pollack & Company
OFFICE
Elliott D. Pollack & Company
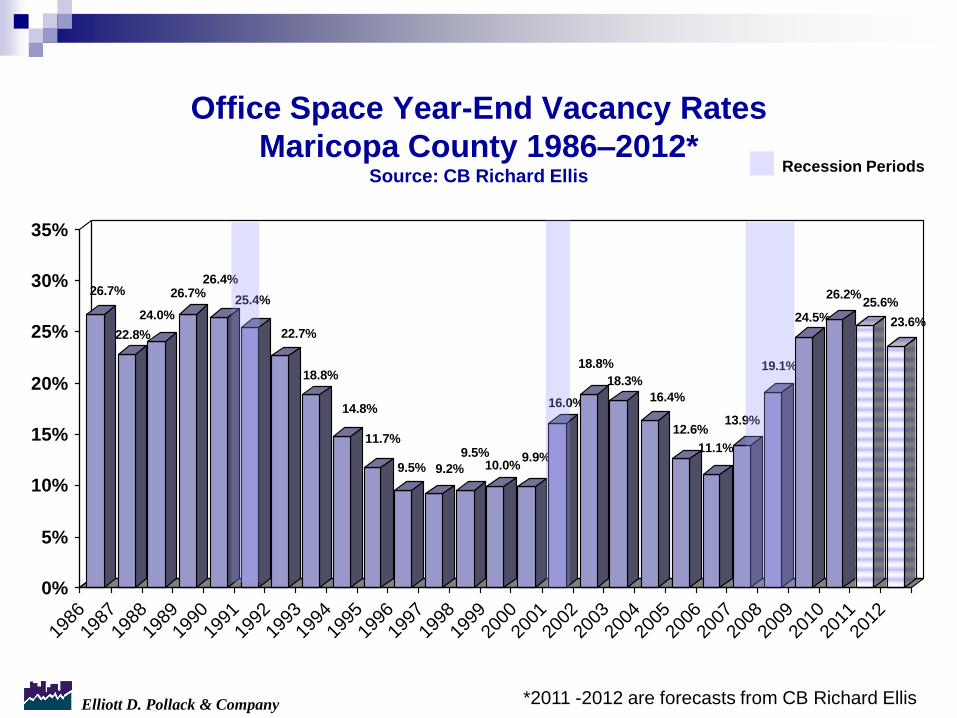
Office Space Year-End Vacancy Rates
Maricopa County 1986–2012*Source: CB Richard Ellis
26.7%
22.8%
24.0%
26.7%26.4%
25.4%
22.7%
18.8%
14.8%
11.7%
9.5% 9.2%
9.5%10.0%
9.9%
16.0%
18.8%
18.3%
16.4%
12.6%
11.1%
13.9%
19.1%
24.5%
26.2%25.6%
23.6%
0%
5%
10%
15%
20%
25%
30%
35%
1986
1987
1988
1989
1990
1991
1992
1993
1994
1995
1996
1997
1998
1999
2000
2001
2002
2003
2004
2005
2006
2007
2008
2009
2010
2011
2012
*2011 -2012 are forecasts from CB Richard Ellis
Recession Periods
Elliott D. Pollack & Company
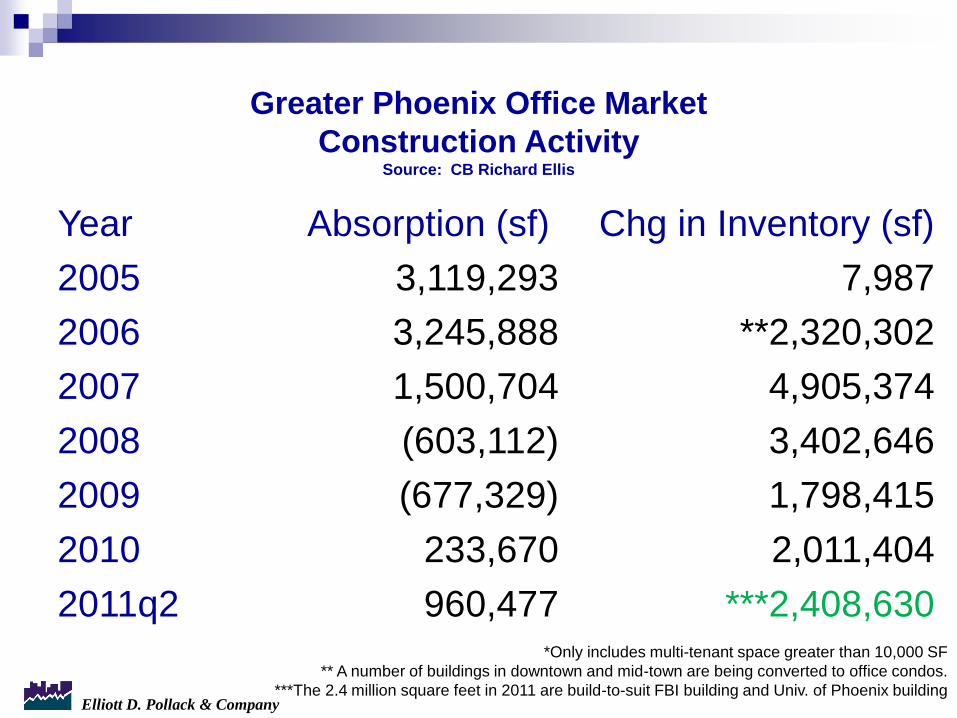
Greater Phoenix Office Market
Construction ActivitySource: CB Richard Ellis
Year Absorption (sf) Chg in Inventory (sf)
2005 3,119,293 7,987
2006 3,245,888 **2,320,302
2007 1,500,704 4,905,374
2008 (603,112) 3,402,646
2009 (677,329) 1,798,415
2010 233,670 2,011,404
2011q2 960,477 ***2,408,630*Only includes multi-tenant space greater than 10,000 SF
** A number of buildings in downtown and mid-town are being converted to office condos.
***The 2.4 million square feet in 2011 are build-to-suit FBI building and Univ. of Phoenix building

Elliott D. Pollack & Company
There is currently
NO multi-tenant office space under
construction (q2 11).
*Greater than 10,000 sf

Elliott D. Pollack & Company
No significant office
building in Greater
Phoenix for next
3-5 years.

Elliott D. Pollack & Company
INDUSTRIAL
Elliott D. Pollack & Company
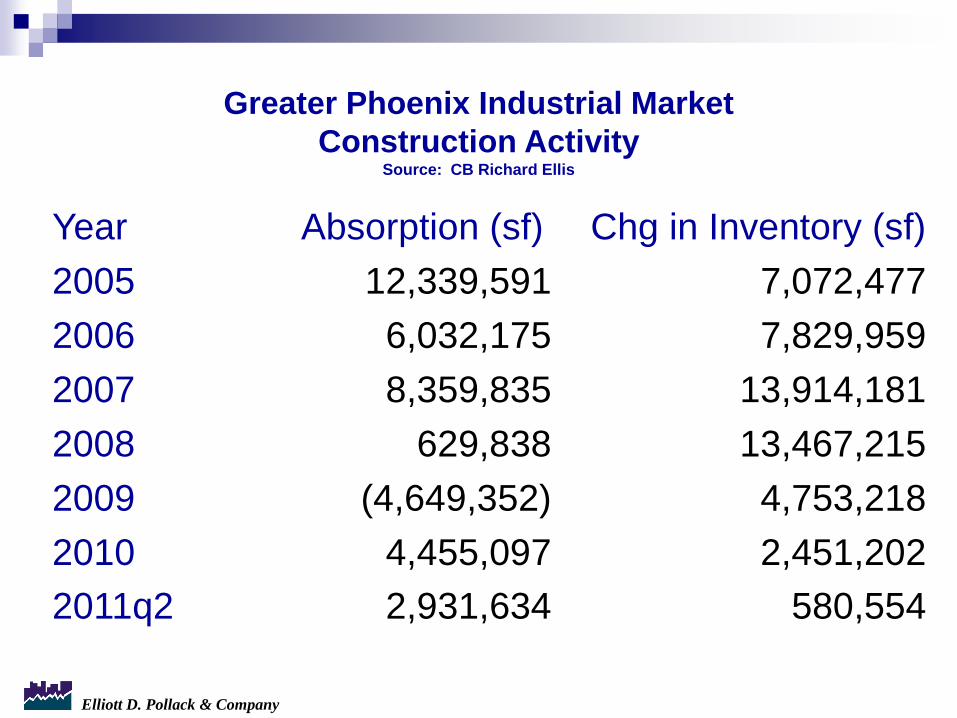
Greater Phoenix Industrial Market
Construction ActivitySource: CB Richard Ellis
Year Absorption (sf) Chg in Inventory (sf)
2005 12,339,591 7,072,477
2006 6,032,175 7,829,959
2007 8,359,835 13,914,181
2008 629,838 13,467,215
2009 (4,649,352) 4,753,218
2010
2011q2
4,455,097
2,931,634
2,451,202
580,554

Elliott D. Pollack & Company
There are currently
3.9 million square feet of
industrial space
under construction (q2 11).
Elliott D. Pollack & Company
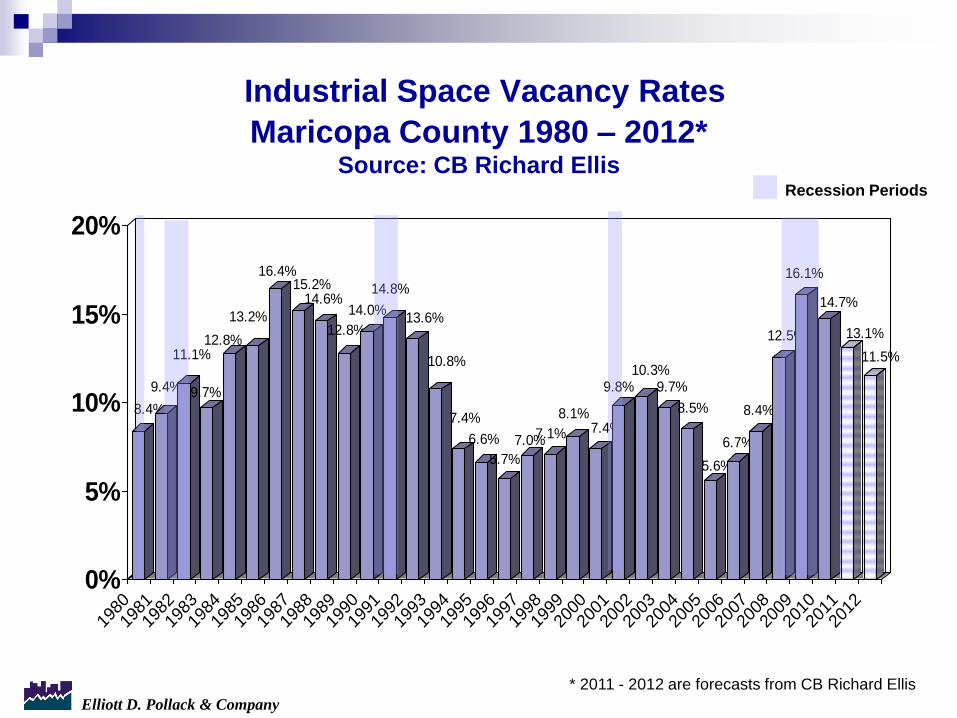
Industrial Space Vacancy Rates
Maricopa County 1980 – 2012*Source: CB Richard Ellis
8.4%
9.4%
11.1%
9.7%
12.8%
13.2%
16.4%15.2%
14.6%
12.8%
14.0%
14.8%
13.6%
10.8%
7.4%
6.6%
5.7%
7.0%7.1%
8.1%7.4%
9.8%10.3%
9.7%
8.5%
5.6%
6.7%
8.4%
12.5%
16.1%
14.7%
13.1%
11.5%
0%
5%
10%
15%
20%
1980
1981
1982
1983
1984
1985
1986
1987
1988
1989
1990
1991
1992
1993
1994
1995
1996
1997
1998
1999
2000
2001
2002
2003
2004
2005
2006
2007
2008
2009
2010
2011
2012
* 2011 - 2012 are forecasts from CB Richard Ellis
Recession Periods

Elliott D. Pollack & Company
RETAIL
Elliott D. Pollack & Company
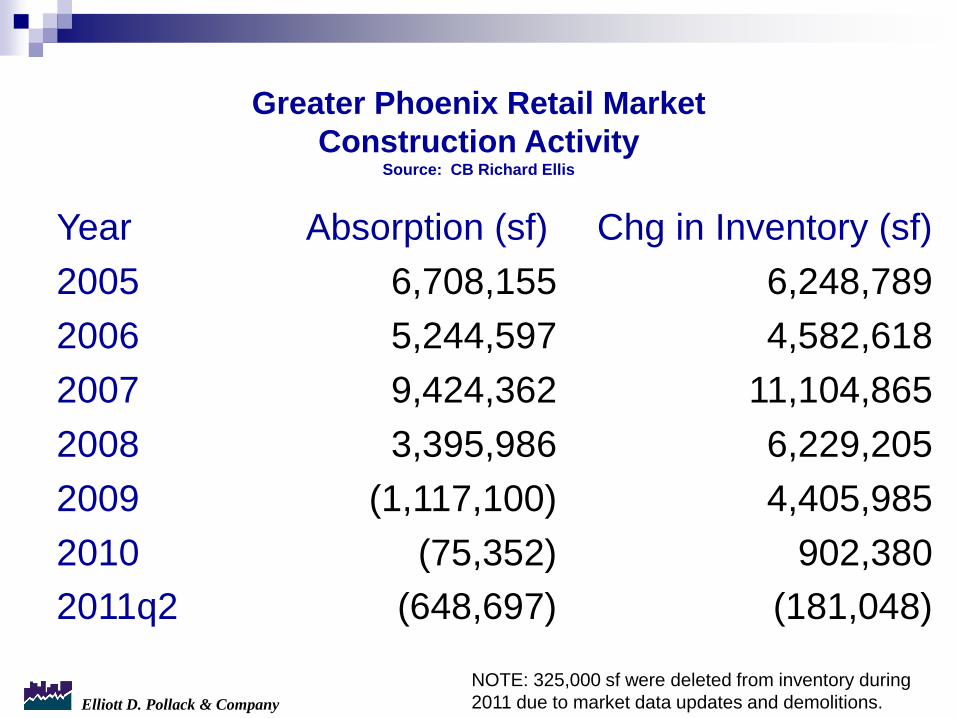
Greater Phoenix Retail Market
Construction ActivitySource: CB Richard Ellis
Year Absorption (sf) Chg in Inventory (sf)
2005 6,708,155 6,248,789
2006 5,244,597 4,582,618
2007 9,424,362 11,104,865
2008 3,395,986 6,229,205
2009 (1,117,100) 4,405,985
2010
2011q2
(75,352)
(648,697)
902,380
(181,048)
NOTE: 325,000 sf were deleted from inventory during
2011 due to market data updates and demolitions.
Elliott D. Pollack & Company
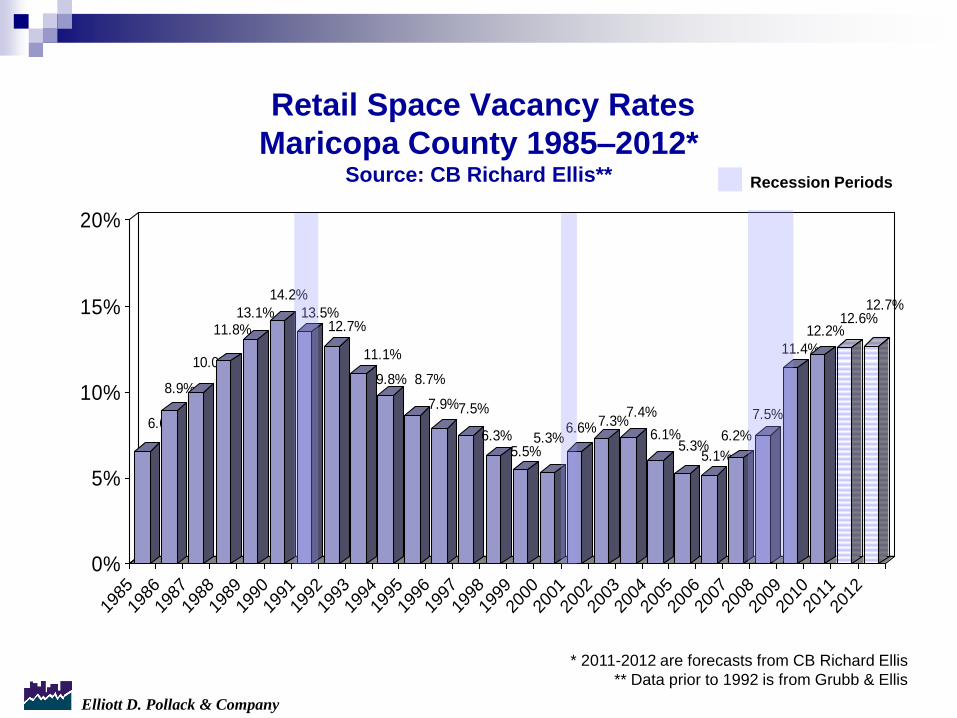
Retail Space Vacancy Rates
Maricopa County 1985–2012*Source: CB Richard Ellis**
6.6%
8.9%
10.0%
11.8%13.1%
14.2%
13.5%12.7%
11.1%
9.8% 8.7%
7.9%7.5%
6.3%5.5%
5.3%6.6%7.3%
7.4%
6.1%5.3%
5.1%
6.2%
7.5%
11.4%
12.2%12.6%
12.7%
0%
5%
10%
15%
20%
1985
1986
1987
1988
1989
1990
1991
1992
1993
1994
1995
1996
1997
1998
1999
2000
2001
2002
2003
2004
2005
2006
2007
2008
2009
2010
2011
2012
* 2011-2012 are forecasts from CB Richard Ellis
** Data prior to 1992 is from Grubb & Ellis
Recession Periods
Elliott D. Pollack & Company
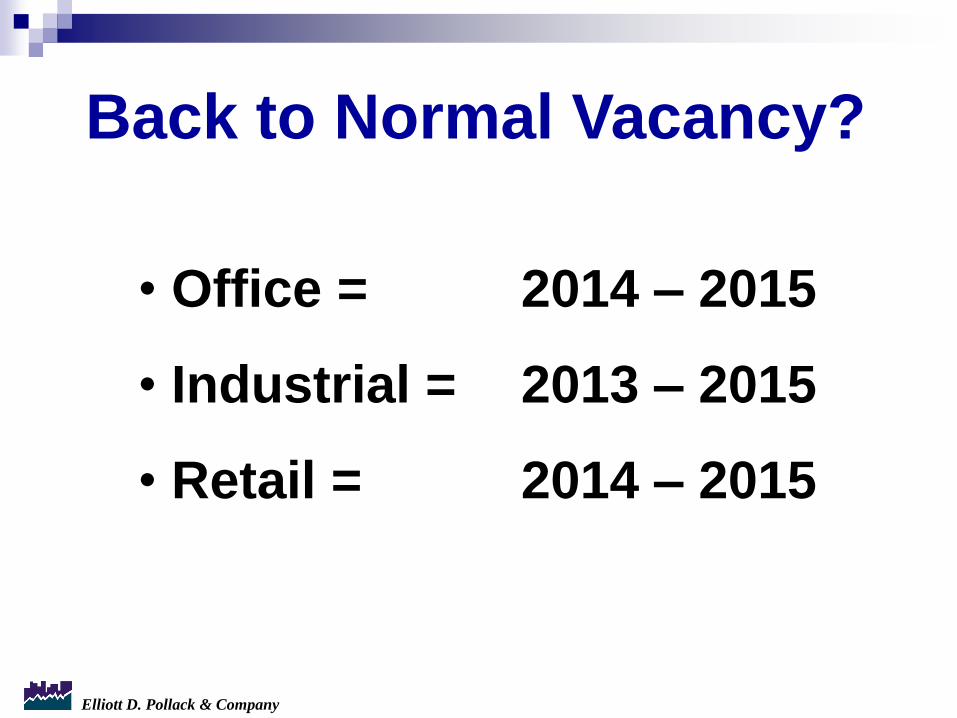
Back to Normal Vacancy?
• Office = 2014 – 2015
• Industrial = 2013 – 2015
• Retail = 2014 – 2015

Elliott D. Pollack & Company
No new commercial
construction is needed
for years.
Elliott D. Pollack & Company
The long term economic
fundamentals have not really
changed.
The long term economic outlook
remains favorable.
AZ will be a national growth leader
by mid decade.

Elliott D. Pollack & Company
There is a BOOM for Arizona
out there somewhere.

Elliott D. Pollack & Company
But not in
2011, 2012 or 2013.

Elliott D. Pollack & Company
What does this all mean
for REVENUES?
Elliott D. Pollack & Company
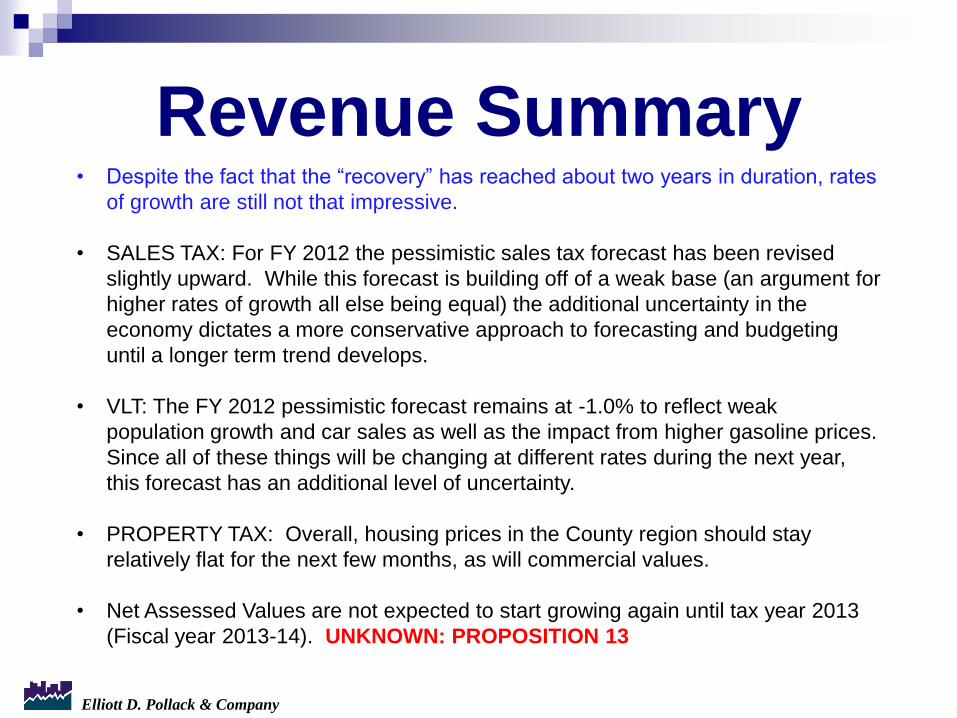
Revenue Summary• Despite the fact that the “recovery” has reached about two years in duration, rates
of growth are still not that impressive.
• SALES TAX: For FY 2012 the pessimistic sales tax forecast has been revised
slightly upward. While this forecast is building off of a weak base (an argument for
higher rates of growth all else being equal) the additional uncertainty in the
economy dictates a more conservative approach to forecasting and budgeting
until a longer term trend develops.
• VLT: The FY 2012 pessimistic forecast remains at -1.0% to reflect weak
population growth and car sales as well as the impact from higher gasoline prices.
Since all of these things will be changing at different rates during the next year,
this forecast has an additional level of uncertainty.
• PROPERTY TAX: Overall, housing prices in the County region should stay
relatively flat for the next few months, as will commercial values.
• Net Assessed Values are not expected to start growing again until tax year 2013
(Fiscal year 2013-14). UNKNOWN: PROPOSITION 13
Elliott D. Pollack & Company
WHAT IS PROPOSITION 13?
• It is a property tax initiative planned for the
November 2012 ballot that rolls back
property values to 2003 values (until
property sells).
• Similar to Prop 13 in California.
Elliott D. Pollack & Company
Prop 13 Impact
• Impacts overall revenue streams the most when
property values start to go back up.
• UNKNOWN: how each of the taxing jurisdictions
(including the County) would receive portions of total
tax revenue.
• ALSO caps the total property tax to be only 0.5% of
the value of the residential property (1.0% of
commercial and other property). This alone would
impact assessed values by a drop of more than 50%.

Elliott D. Pollack & Company90
ELLIOTT D. POLLACK
& Company
7505 East Sixth Avenue, Suite 100 Scottsdale, Arizona 85251
480-423-9200 P / 480-423-5942 F / www.arizonaeconomy.com / [email protected]
• Economic and Fiscal Impact Analysis/Modeling
• Real Estate Market and Feasibility Studies
• Litigation Support
• Revenue Forecasting
• Keynote Speaking
• Public Finance and Policy Development
• Land Use Economics
• Economic Development