lectures 1: review of technology trends and...
TRANSCRIPT

JR.S00 1
Lectures 1: Review of Technology Trendsand Cost/Performance
Prof. Jan M. RabaeyComputer Science 252
Spring 2000“Computer Architecture in Cory Hall”

JR.S00 2
CS 252 Course FocusUnderstanding the design techniques, machine
structures, technology factors, evaluationmethods that will determine the form ofprogrammable processors in 21st Century
TechnologyProgrammingLanguages
OperatingSystems History
Applications
Interface Design(ISA)
Measurement &Evaluation
Computer Architecture:• Instruction Set Design• Organization• Hardware

JR.S00 3
Related Courses
CS 152CS 152 CS 252CS 252 CS 258CS 258
CS 250CS 250
How to build itImplementation details
Why, Analysis,Evaluation
Parallel Architectures,Languages, Systems
Integrated CircuitDesign
Strong
Prerequisite
Basic knowledge of theorganization of a computeris assumed!
EE 141EE 141
Digital IntegratedCircuits
JR.S00 4
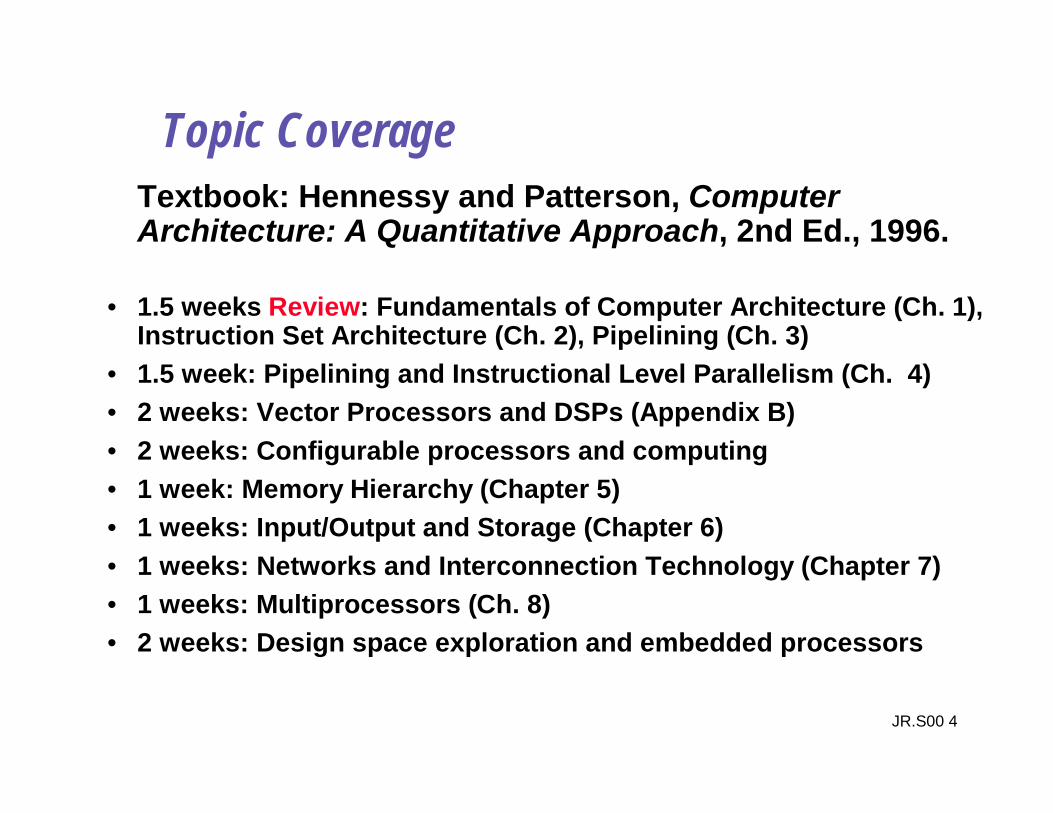
Topic CoverageTextbook: Hennessy and Patterson, ComputerArchitecture: A Quantitative Approach, 2nd Ed., 1996.
• 1.5 weeks Review: Fundamentals of Computer Architecture (Ch. 1),Instruction Set Architecture (Ch. 2), Pipelining (Ch. 3)
• 1.5 week: Pipelining and Instructional Level Parallelism (Ch. 4)• 2 weeks: Vector Processors and DSPs (Appendix B)• 2 weeks: Configurable processors and computing• 1 week: Memory Hierarchy (Chapter 5)• 1 weeks: Input/Output and Storage (Chapter 6)• 1 weeks: Networks and Interconnection Technology (Chapter 7)• 1 weeks: Multiprocessors (Ch. 8)• 2 weeks: Design space exploration and embedded processors

JR.S00 5
CS252: Administrative Information
Instructors: Prof. Jan M. Rabaey Office: 231 Cory Hall, 666-3111, jan@eecs Office Hours: M 1:30-3pm,Tu 12:30-2pmProf. Kurt Keutzer Office: 566 Cory Hall, 642-9267, keutzer@eecs Office Hours: W 10-11:30am
T. A: TBDClass: TuTh 2- 3:30pm Hogan Room - Cory HallText: Computer Architecture: A Quantitative Approach,
Second Edition (1996) (second printing)Web page: http://bwrc.eecs.berkeley.edu/Classes/CS252Newsgroup: ucb.class.c252

JR.S00 6
Course Style
• Reduce the pressure of taking quizzes– Only 2 Graded Quizzes: Thursday Mar. 3 and Th. Apr. 13– Our goal: test knowledge vs. speed writing– Take home!
• Major emphasis on research project– Transition from undergrad to grad student– Berkeley wants you to succeed, but you need to show initiative– pick topic– meet 3 times with faculty/TA to see progress– give oral presentation– give poster session– written report like conference paper– ~ 3 weeks work full time for 2 people– Opportunity to do “research in the small” to help make transition
from good student to research colleague

JR.S00 7
Course Style• Everything is on the course Web page:
bwrc.eecs.berkeley.edu/Classes/CS252• Notes:
– Lecture notes will be available on the web-page at the latest at noon ofthe lecture day
– Midterms and pointers to old exams can be found on the web-pages ofprevious offerings (pointers on web-site).
• Schedule:– 2 Graded Quizes: Thursday Mar. 3 and Thursday Apr. 13– Project Reviews/Checkpoints: Tu. Feb 15, Tu March 14, Tu Apr 11– Oral Presentations: Tu Th April 25/27– 252 Poster Session: Tu May 2– 252 Last lecture: Th May 4– Project Papers/URLs due: Tu May 9

JR.S00 8
Grading• 5% Homeworks (work in pairs)• 35% Examinations (2 Midterms)• 60% Research Project (work in pairs)

JR.S00 9
1988 Computer Food Chain
PCWork-stationMini-
computer
Mainframe
Mini-supercomputer
Supercomputer
Massively ParallelProcessors

JR.S00 10
1997 Computer Food Chain
PCWork-station
Mainframe
Supercomputer
Mini-supercomputerMassively Parallel Processors
Mini-computer
ServerPDA
JR.S00 11
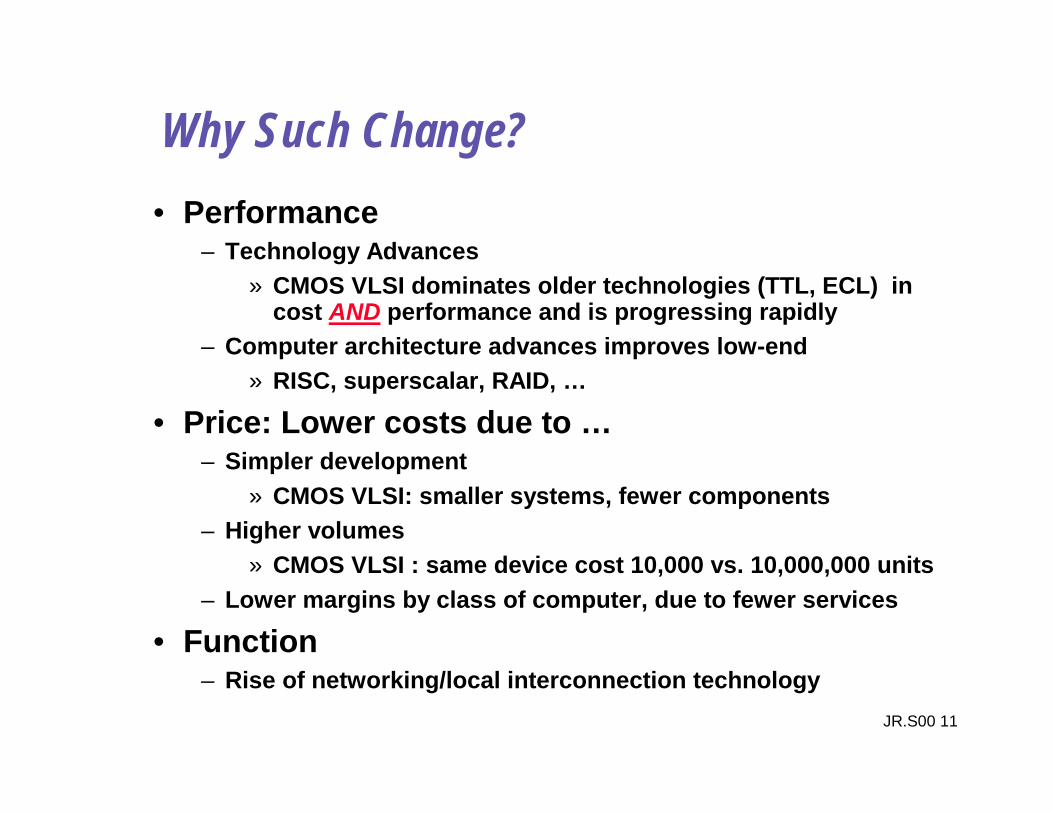
Why Such Change?• Performance
– Technology Advances» CMOS VLSI dominates older technologies (TTL, ECL) in
cost AND performance and is progressing rapidly– Computer architecture advances improves low-end
» RISC, superscalar, RAID, …
• Price: Lower costs due to …– Simpler development
» CMOS VLSI: smaller systems, fewer components– Higher volumes
» CMOS VLSI : same device cost 10,000 vs. 10,000,000 units– Lower margins by class of computer, due to fewer services
• Function– Rise of networking/local interconnection technology

JR.S00 12Year
1000
10000
100000
1000000
10000000
100000000
1970 1975 1980 1985 1990 1995 2000
i80386
i4004
i8080
Pentium
i80486
i80286
i8086
Technology Trends: MicroprocessorCapacity
CMOS improvements:• Die size: 2X every 3 yrs• Line width: halve / 7 yrs
Alpha 21264: 15 millionPentium Pro: 5.5 millionPowerPC 620: 6.9 millionAlpha 21164: 9.3 millionSparc Ultra: 5.2 million
Moore’s Law
ISSCC 2000: 25M+ transistor processors (Intel)

JR.S00 13
Memory Capacity(Single Chip DRAM)
size
Year
1000
10000
100000
1000000
10000000
100000000
1000000000
1970 1975 1980 1985 1990 1995 2000
year size(Mb) cyc time1980 0.0625 250 ns1983 0.25 220 ns1986 1 190 ns1989 4 165 ns1992 16 145 ns1996 64 120 ns2000 256 100 ns

JR.S00 14
Technology Trends(Summary)
Capacity Speed (latency)Logic 2x in 3 years 2x in 3 yearsDRAM 4x in 3 years 2x in 10 yearsDisk 4x in 3 years 2x in 10 years

JR.S00 15
386486
Pentium(R)
Pentium Pro(R)
Pentium(R) II
MPC750604+604
601, 603
21264S
2126421164A
2116421064A
21066
10
100
1,000
10,000
1987
1989
1991
1993
1995
1997
1999
2001
2003
2005
Mhz
1
10
100
Gat
e D
elay
s/ C
lock
Intel
IBM Power PC
DEC
Gate delays/clock
Processor freq scales by 2X per
generation
Processor frequency trend
Ê Frequency doubles each generationË Number of gates/clock reduce by 25%

JR.S00 16
Processor PerformanceTrends
Microprocessors
Minicomputers
Mainframes
Supercomputers
Year
0.1
1
10
100
1000
1965 1970 1975 1980 1985 1990 1995 2000

JR.S00 17
Processor Performance(1.35X before, 1.55X now)
0
200
400
600
800
1000
1200
87 88 89 90 91 92 93 94 95 96 97
DEC Alpha 21264/600
DEC Alpha 5/500
DEC Alpha 5/300
DEC Alpha 4/266IBM POWER 100
DEC AXP/500
HP 9000/750
Sun-4/
260
IBMRS/
6000
MIPS M/
120
MIPS M
2000
1.54X/yr

JR.S00 18
Performance Trends(Summary)
• Workstation performance (measured in SpecMarks) improves roughly 50% per year(2X every 18 months)
• Improvement in cost performance estimatedat 70% per year

JR.S00 19
Dens ity Ac c e s s Time
(Gbits /cm2) (ns )
DRAM 8.5 10
DRAM (Lo g ic ) 2.5 10
SRAM (Cache) 0.3 1.5
Dens ity Max. Av e . Po we rClo c k Rate(Mgate s /c m 2 ) (W/c m 2) (GHz)
Cus tom 25 54 3S td. Ce ll 10 27 1.5
Gate Array 5 18 1S in g le -Mas k GA 2.5 12.5 0.7
FPGA 0.4 4.5 0.25
A glimpse into the future
Die Area: 2.5x2.5 cmVoltage: 0.6 - 0.9 VTechnology: 0.07 µm 15 times denser
than today2.5 times power
density5 times clock rate
Silicon in 2010Silicon in 2010

JR.S00 20
What is the next wave?
Source: Richard Newton

JR.S00 21
The Embedded Processor
What?A programmable processor whose programming
interface is not accessible to the end-user of theproduct.
The only user-interaction is through the actualapplication.
Examples:- Sharp PDA’s are encapsulated products with fixed
functionality- 3COM Palm pilots were originally intended as embedded
systems. Opening up the programmers interface turnedthem into more generic computer systems.

JR.S00 22
Some interesting numbers
• The Intel 4004 was intended for an embeddedapplication (a calculator)
• Of todays microprocessors– 95% go into embedded applications
» SSH3/4 (Hitachi): best selling RISC microprocessor– 50% of microprocessor revenue stems from embedded
systems
• Often focused on particular application area– Microcontrollers– DSPs– Media Processors– Graphics Processors– Network and Communication Processors

JR.S00 23
Some different evaluation metrics
Flexibility
Power
Cost
Performance as a Functionality ConstraintPerformance as a Functionality Constraint(“Just-in-Time Computing”)(“Just-in-Time Computing”)
• Components of Cost– Area of die / yield– Code density (memory is
the major part of die size)– Packaging– Design effort– Programming cost– Time-to-market– Reusability

JR.S00 24
The Secret of Architecture Design:Measurement and Evaluation
Design
Analysis
Architecture Design is an iterative process:• Searching the space of possible designs• At all levels of computer systems
Creativity
Good IdeasGood Ideas
Mediocre IdeasBad Ideas
Cost /PerformanceAnalysis

JR.S00 25
Computer Architecture Topics
Instruction Set Architecture
Pipelining, Hazard Resolution,Superscalar, Reordering, Prediction, Speculation,Vector, VLIW, DSP, Reconfiguration
Addressing,Protection,Exception Handling
L1 Cache
L2 Cache
DRAM
Disks, WORM, Tape
Coherence,Bandwidth,Latency
Emerging TechnologiesInterleavingBus protocols
RAID
VLSI
Input/Output and Storage
MemoryHierarchy
Pipelining and Instruction Level Parallelism

JR.S00 26
Computer Architecture Topics
M
Interconnection NetworkS
PMPMPMP° ° °
Topologies,Routing,Bandwidth,Latency,Reliability
Network Interfaces
Shared Memory,Message Passing,Data Parallelism
Processor-Memory-Switch
MultiprocessorsNetworks and Interconnections

JR.S00 27
Computer Engineering Methodology
Simulate NewSimulate NewDesigns andDesigns and
OrganizationsOrganizations
TechnologyTrends
Evaluate ExistingEvaluate ExistingSystems for Systems for BottlenecksBottlenecks
Benchmarks
Workloads
Implement NextImplement NextGeneration SystemGeneration System
ImplementationComplexity Analysis
Design
Imple-mentation

JR.S00 28
Measurement Tools
• Hardware: Cost, delay, area, power estimation• Benchmarks, Traces, Mixes• Simulation (many levels)
– ISA, RT, Gate, Circuit
• Queuing Theory• Rules of Thumb• Fundamental “Laws”/Principles

JR.S00 29
Review:Performance, Cost, Power

JR.S00 30
Metric 1: Performance
• Time to run the task– Execution time, response time, latency
• Tasks per day, hour, week, sec, ns …– Throughput, bandwidth
Plane
Boeing 747
Concorde
Speed
610 mph
1350 mph
DC to Paris
6.5 hours
3 hours
Passengers
470
132
Throughput
286,700
178,200
In passenger-mile/hour
JR.S00 31
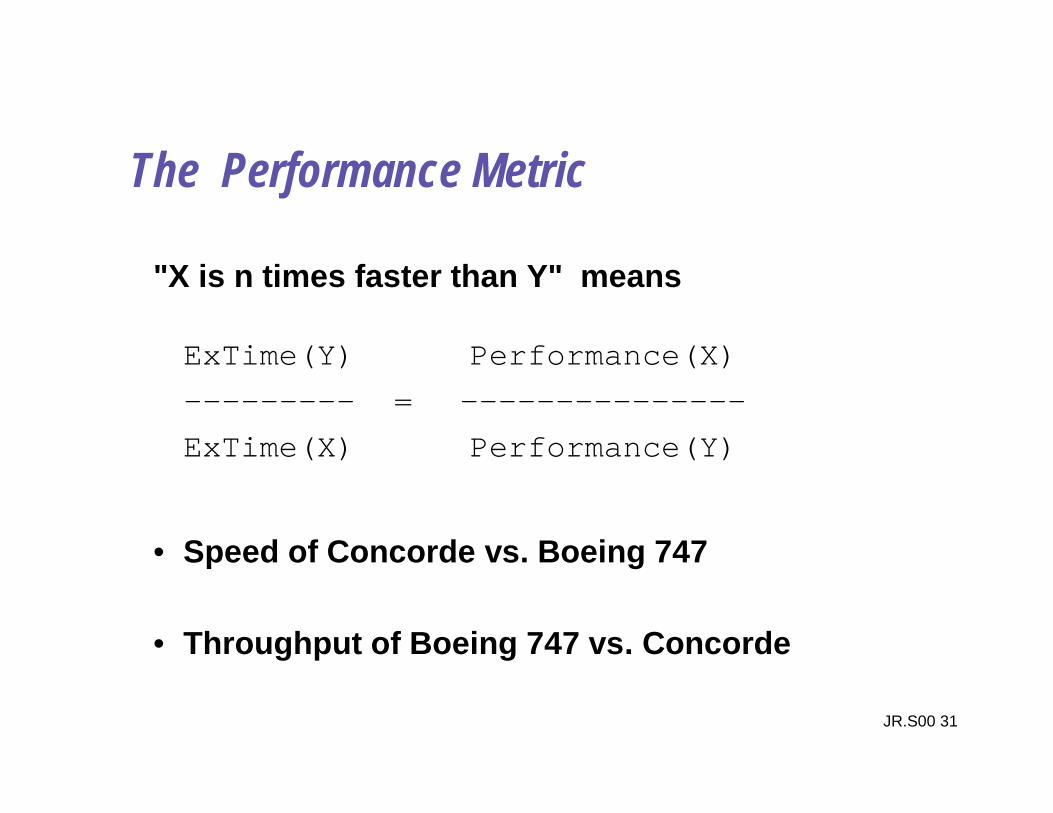
The Performance Metric
"X is n times faster than Y" means
ExTime(Y) Performance(X)--------- = ---------------ExTime(X) Performance(Y)
• Speed of Concorde vs. Boeing 747
• Throughput of Boeing 747 vs. Concorde

JR.S00 32
Amdahl's LawSpeedup due to enhancement E: ExTime w/o E Performance w/ ESpeedup(E) = ------------- = ------------------- ExTime w/ E Performance w/o E
Suppose that enhancement E accelerates a fraction Fof the task by a factor S, and the remainder of thetask is unaffected
JR.S00 33
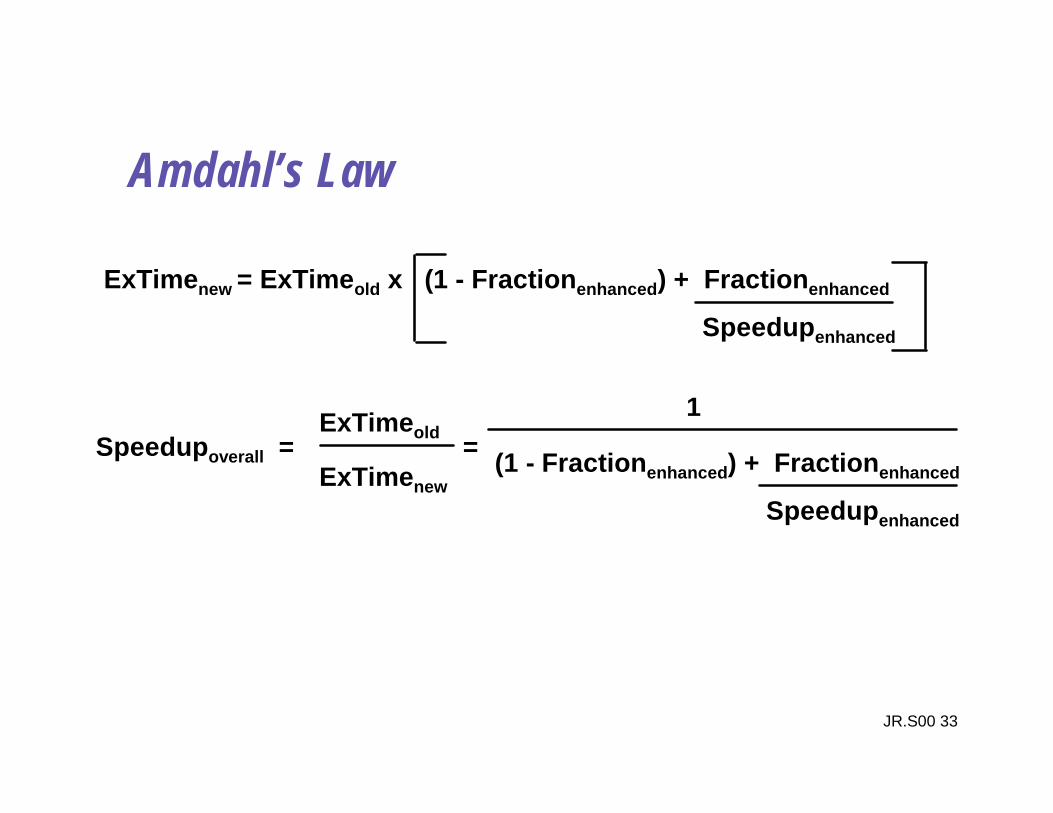
Amdahl’s Law
ExTimenew = ExTimeold x (1 - Fractionenhanced) + Fractionenhanced
Speedupoverall =ExTimeold
ExTimenew
Speedupenhanced
=1
(1 - Fractionenhanced) + Fractionenhanced
Speedupenhanced

JR.S00 34
Amdahl’s Law
• Floating point instructions improved to run 2X;but only 10% of actual instructions are FP
Speedupoverall = 10.95
= 1.053
ExTimenew = ExTimeold x (0.9 + .1/2) = 0.95 x ExTimeold
Law of diminishing return:Law of diminishing return:Focus on the common case!Focus on the common case!
JR.S00 35
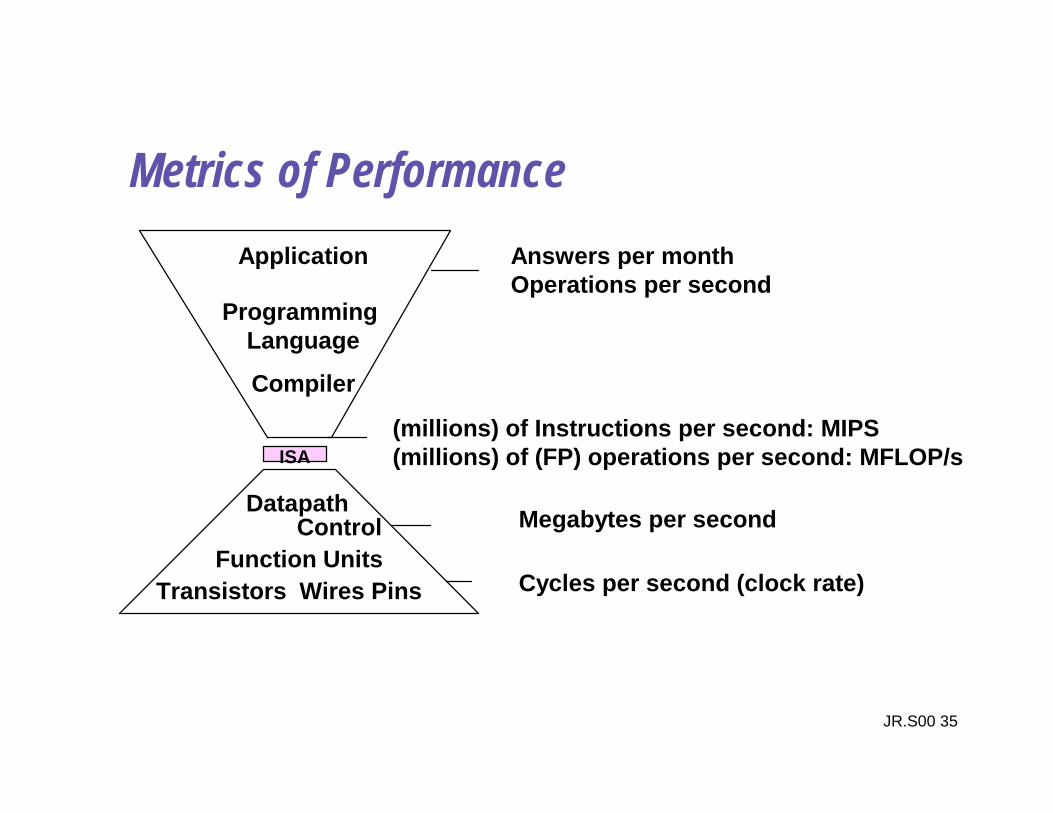
Metrics of Performance
Compiler
Programming Language
Application
DatapathControl
Transistors Wires Pins
ISA
Function Units
(millions) of Instructions per second: MIPS(millions) of (FP) operations per second: MFLOP/s
Cycles per second (clock rate)
Megabytes per second
Answers per monthOperations per second

JR.S00 36
Aspects of CPU PerformanceCPU time = Seconds = Instructions x Cycles x Seconds
Program Program Instruction Cycle
CPU time = Seconds = Instructions x Cycles x Seconds Program Program Instruction Cycle
Inst Count CPI Clock RateProgram X
Compiler X (X)
Inst. Set. X X
Organization X X
Technology X

JR.S00 37
Cycles Per Instruction
CPU time = CycleTime * Σ CPI * Ii = 1
n
i i
CPI = Σ CPI * F where F = I i = 1
n
i i i i
Instruction Count
“Instruction Frequency”
Invest Resources where time is Spent!Invest Resources where time is Spent!
CPI = Cycles / Instruction Count = (CPU Time * Clock Rate) / Instruction Count
“Average Cycles per Instruction”

JR.S00 38
Example: Calculating CPI
Typical Mix
Base Machine (Reg / Reg)Op Freq CPIi CPIi*Fi (% Time)ALU 50% 1 .5 (33%)Load 20% 2 .4 (27%)Store 10% 2 .2 (13%)Branch 20% 2 .4 (27%) 1.5

JR.S00 39
Creating Benchmark Sets
•Real programs•Kernels•Toy benchmarks•Synthetic benchmarks
– e.g. Whetstones and Dhrystones

JR.S00 40
SPEC: System Performance EvaluationCooperative• First Round 1989
– 10 programs yielding a single number (“SPECmarks”)
• Second Round 1992– SPECInt92 (6 integer programs) and SPECfp92 (14 floating point
programs)» Compiler Flags unlimited. March 93 of DEC 4000 Model 610:spice: unix.c:/def=(sysv,has_bcopy,”bcopy(a,b,c)=
memcpy(b,a,c)”wave5: /ali=(all,dcom=nat)/ag=a/ur=4/ur=200nasa7: /norecu/ag=a/ur=4/ur2=200/lc=blas
• Third Round 1995– new set of programs: SPECint95 (8 integer programs) and
SPECfp95 (10 floating point)– “benchmarks useful for 3 years”– Single flag setting for all programs: SPECint_base95,
SPECfp_base95

JR.S00 41
How to Summarize Performance• Arithmetic mean (weighted arithmetic mean)
tracks execution time: Σ(Ti)/n or Σ(Wi*Ti)• Harmonic mean (weighted harmonic mean) of
rates (e.g., MFLOPS) tracks execution time:n/ Σ(1/Ri) or n/Σ(Wi/Ri)
• Normalized execution time is handy for scalingperformance (e.g., X times faster thanSPARCstation 10)
– Arithmetic mean impacted by choice of reference machine
• Use the geometric mean for comparison:∏ (Ti)^1/n
– Independent of chosen machine– but not good metric for total execution time
JR.S00 42
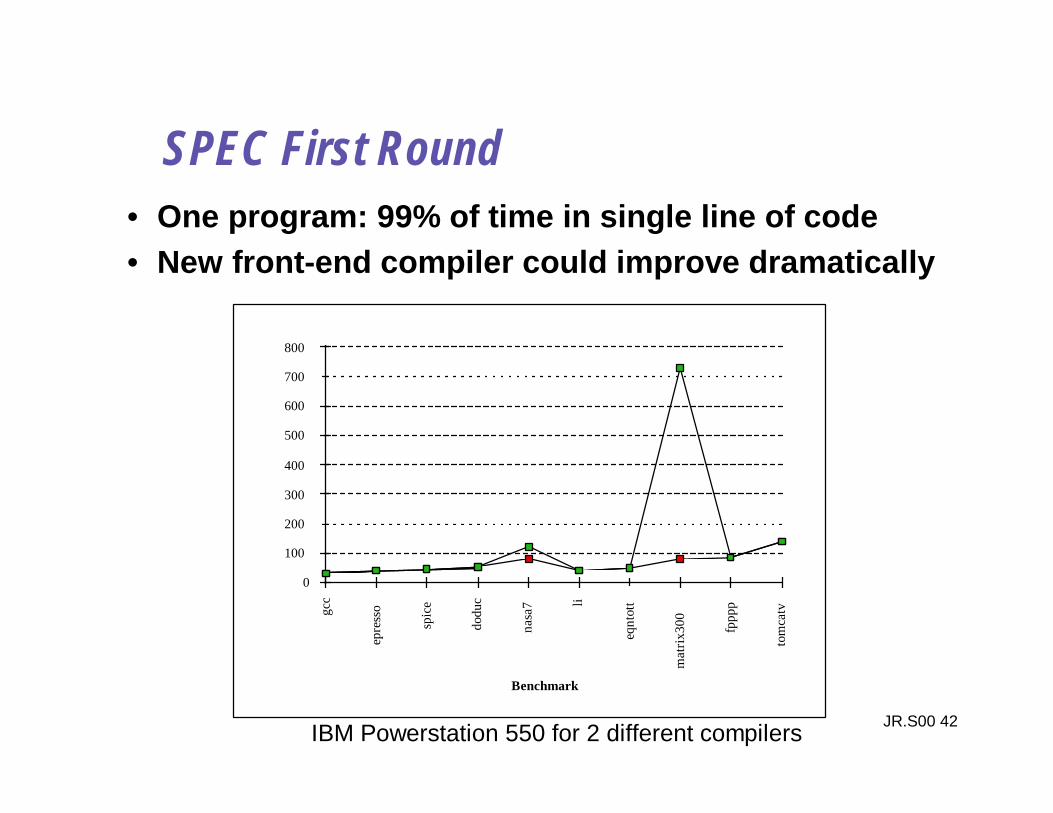
SPEC First Round• One program: 99% of time in single line of code• New front-end compiler could improve dramatically
Benchmark
0
100
200
300
400
500
600
700
800
gcc
epre
sso
spic
e
dodu
c
nasa
7 li
eqnt
ott
mat
rix3
00 fppp
p
tom
catv
IBM Powerstation 550 for 2 different compilers

JR.S00 43
Impact of Meanson SPECmark89 for IBM 550(without and with special compiler option)
Ratio to VAX: Time: Weighted Time:Program Before After Before After Before Aftergcc 30 29 49 51 8.91 9.22espresso 35 34 65 67 7.64 7.86spice 47 47 510 510 5.69 5.69doduc 46 49 41 38 5.81 5.45nasa7 78 144 258 140 3.43 1.86li 34 34 183 183 7.86 7.86eqntott 40 40 28 28 6.68 6.68matrix300 78 730 58 6 3.43 0.37fpppp 90 87 34 35 2.97 3.07tomcatv 33 138 20 19 2.01 1.94Mean 54 72 124 108 54.42 49.99
Geometric Arithmetic Weighted Arith.Ratio 1.33 Ratio 1.16 Ratio 1.09

JR.S00 44
Performance Evaluation• “For better or worse, benchmarks shape a field”• Good products created when have:
– Good benchmarks– Good ways to summarize performance
• Given sales is a function in part of performancerelative to competition, investment in improvingproduct as reported by performance summary
• If benchmarks/summary inadequate, then choosebetween improving product for real programs vs.improving product to get more sales;Sales almost always wins!
• Execution time is the measure of computerperformance!

JR.S00 45
Integrated Circuits Costs
Die Cost goes roughly with die area4
Test_Die Die_Area 2Wafer_diam Die_Area
2m/2)(Wafer_dia wafer per Dies −⋅
×π−π=
α×+×=
α−Die_area sityDefect_Den 1 dWafer_yiel YieldDie
yieldtest Finalcost Packaging cost Testingcost Die cost IC ++=
yield Die Wafer per DiescostWafer cost Die×
=

JR.S00 46
Real World Examples
Chip Metal Line Wafer Defect Area Dies/ Yield Die Cost layers width cost /cm2 mm2 wafer386DX 2 0.90 $900 1.0 43 360 71% $4486DX2 3 0.80 $1200 1.0 81 181 54% $12PowerPC 601 4 0.80 $1700 1.3 121 115 28% $53HP PA 7100 3 0.80 $1300 1.0 196 66 27% $73DEC Alpha 3 0.70 $1500 1.2 234 53 19% $149SuperSPARC 3 0.70 $1700 1.6 256 48 13% $272Pentium 3 0.80 $1500 1.5 296 40 9% $417
– From "Estimating IC Manufacturing Costs,” by Linley Gwennap,Microprocessor Report, August 2, 1993, p. 15

JR.S00 47
Cost/PerformanceWhat is Relationship of Cost to Price?
• Recurring Costs– Component Costs– Direct Costs (add 25% to 40%) recurring costs: labor, purchasing, scrap,
warranty
• Non-Recurring Costs or Gross Margin (add 82% to186%)(R&D, equipment maintenance, rental, marketing, sales, financingcost, pretax profits, taxes
• Average Discount to get List Price (add 33% to 66%): volumediscounts and/or retailer markup
ComponentCost
Direct Cost
GrossMargin
AverageDiscount
Avg. Selling Price
List Price
15% to 33% 6% to 8%34% to 39%
25% to 40%

JR.S00 48
• Assume purchase 10,000 units
Chip Prices (August 1993)
Chip Area Mfg. Price Multi- Commentmm2 cost plier
386DX 43 $9 $31 3.4 Intense CompetitionIntense Competition486DX2 81 $35 $245 7.0 No CompetitionNo CompetitionPowerPC 601 121 $77 $280 3.6 DEC Alpha 234 $202 $1231 6.1 Recoup R&D?Pentium 296 $473 $965 2.0 Early in shipments

JR.S00 49
Summary: Price vs. Cost
0%
20%
40%
60%
80%
100%
Mini W/S PC
Average Discount
Gross Margin
Direct Costs
Component Costs
0
1
2
3
4
5
Mini W/S PC
Average Discount
Gross Margin
Direct Costs
Component Costs
4.73.8
1.8
3.52.5
1.5

JR.S00 50
386 386
486 486
Pentium(R) Pentium(R) MMX
Pentium Pro (R)
Pentium II (R)
1
10
100
1.5µ 1µ 0.8µ 0.6µ 0.35µ 0.25µ 0.18µ 0.13µ
Max
Pow
er (W
atts
) ?
Power/Energy
Ê Lead processor power increases every generation
Ë Compactions provide higher performance at lower power
Sou
rce:
Inte
l

JR.S00 51
• Power dissipation: rate at which energy istaken from the supply (power source) andtransformed into heat
P = E/t• Energy dissipation for a given instruction
depends upon type of instruction (and stateof the processor)
Energy/Power
P = (1/CPU Time) * Σ E * Ii = 1
n
i i

JR.S00 52
Summary, #1• Designing to Last through Trends
Capacity SpeedLogic 2x in 3 years 2x in 3 yearsSPEC RATING: 2x in 1.5 yearsDRAM 4x in 3 years 2x in 10 yearsDisk 4x in 3 years 2x in 10 years
• 6yrs to graduate => 16X CPU speed, DRAM/Disk size• Time to run the task
– Execution time, response time, latency• Tasks per day, hour, week, sec, ns, …
– Throughput, bandwidth• “X is n times faster than Y” means
ExTime(Y) Performance(X) --------- = -------------- ExTime(X) Performance(Y)

JR.S00 53
Summary, #2
• Amdahl’s Law:
• CPI Law:
• Execution time is the REAL measure of computerperformance!
• Good products created when have:– Good benchmarks, good ways to summarize performance
• Different set of metrics apply to embeddedsystems
Speedupoverall =ExTimeold
ExTimenew
=1
(1 - Fractionenhanced) + Fractionenhanced
Speedupenhanced
CPU time = Seconds = Instructions x Cycles x Seconds Program Program Instruction Cycle
CPU time = Seconds = Instructions x Cycles x Seconds Program Program Instruction Cycle