leasing top 50 2017 - commercial aircraft leasing & sales ... · news analysis 45 leasing top...
TRANSCRIPT

News analysis
www.airfinancejournal.com 45
Leasing top 50 2017
An Airfinance Journal
special supplement

Leasing top 50
Airfinance Journal October/November 201746

Leasing top 50
www.airfinancejournal.com 47
This year, in addition to presenting our “Lessor comps” in the next section
which compares the most recent financial period’s performance for individual lessors, we decided that there would be interest in an analysis of the global trends for the industry. This is facilitated by the increased availability of public financial data for the world’s lessors. The survey group includes 20 lessors, including seven of the ten largest (the exceptions being GECAS, BBAM (though it includes FLY) and DAE Capital (though it includes AWAS).
Among the questions that can be addressed are: what has been the industry’s growth rate; what is the trend in yields and what are the trends in financing costs, capital structure and profitability of the industry.
GrowthFirstly, growth rate. Figure 1 shows the key financials for the approximately 20 lessors whose financials have been continuously available (we have made some estimates to fill a couple of gaps) over the last five years (or were start-ups during the period).
Total property, plant and equipment assets for the population in their most recent financial years were $125.4 billion, revenues were $16.7 billion and net income was $3.3 billion. We have added the values for GECAS which are available from GE annual reports and investor presentations to get a more comprehensive view of the segment’s size.
As we can see, despite the large volume of purchase and leasebacks and OEM orders, the growth in property, plant and equipment assets among our survey group over the last five years has been a relatively modest 23%. Of course this is affected by the relatively high rate of asset
sales among some of the larger lessors who are included in the survey. These sales have been to other leasing companies, into structured ABS deals or side-cars. And it may be because a lot of growth is through entities whose financials are undisclosed, particularly the Chinese lessors.
Yield Figure 2 shows the yield trend over the last five years. We had anticipated that with the many new investors competing for sale and leasebacks, competition to place their speculative OEM orders and rumours of lease rates in the 50-60 bps per month
Trend analysis – An aggregate view of the global leasing industry
$ billion 2012/13 2013/14 2014/15 2015/16 2016/17
Revenue in survey 12.5 13.9 13.2 16.0 16.7
GECAS 5.3 5.3 5.2 5.3 N/A
Total revenue 17.8 19.3 18.5 21.4 N/A
PP&E in survey 102.0 112.3 112.2 116.5 125.4
GECAS 36.2 34.9 30.6 34.3 N/A
Total assets 138.2 147.3 142.8 150.8 ???
Net income in survey 1.7 1.4 2.7 3.1 3.3
GECAS 1.2 0.9 1.0 1.3 1.4
Total net income 3.0 2.2 3.8 4.4 4.7
Figure 1 - Financial highlights
Figure 2: Lease yield
0%
2%
4%
6%
8%
10%
12%
14%
2013/14 2014/15 2015/16 2016/17
Source: Company reports and The Airline Analyst
Continued on page 50 >>>
Leasing top 50
Airfinance Journal October/November 201748
Rank Lessor Total Turboprop Regional jet Narrowbody Widebody
1 GECAS 1,271 19 260 822 170
2 AERCAP 1,121 - - 839 282
3 AVOLON 572 - 52 433 87
4 SMBC AVIATION CAPITAL 437 - 4 395 38
5= NORDIC AVIATION CAPITAL 404 247 149 8 -
5= BBAM 404 - 2 299 103
7 DAE CAPITAL 334 52 - 219 63
8 BOC AVIATION 299 - 5 248 46
9 AIR LEASE CORPORATION 278 - 2 217 59
10 AVIATION CAPITAL GROUP 274 - - 267 7
11 ICBC LEASING 250 - 5 215 30
12 AIRCASTLE 214 - 8 165 41
13 ORIX AVIATION 209 - - 185 24
14 MACQUARIE AIRFINANCE 202 - 3 188 11
15 CDB LEASING 179 - 20 130 29
16 AVMAX 156 87 63 5 1
17 APOLLO AVIATION GROUP 148 - - 123 25
18= CASTLELAKE 146 17 8 94 27
18= JACKSON SQUARE AVIATION 146 - - 128 18
20 STANDARD CHARTERED BANK 133 - - 113 20
21 BOCOM LEASING 115 - 5 91 19
22 DEUCALION AVIATION FUNDS 110 - - 90 20
23 CHINA AIRCRAFT LEASING COMPANY 93 - - 89 4
24 CARGO AIRCRAFT MANAGEMENT 88 - - 10 78
25 GOSHAWK 85 - 1 80 4
26= VEB LEASING 82 3 29 23 27
26= TOKYO CENTURY LEASING 82 - 3 63 16
28 ELIX AVIATION CAPITAL 79 78 - 1 -
29 SKYWORKS LEASING 75 4 16 34 21
30 FALKO 74 3 55 16 -
31 CCB LEASING 72 - 2 59 11
32 TRANSPORTATION PARTNERS 71 52 - 19 -
33 ALAFCO 65 - - 59 6
34= FUYO GENERAL LEASE 60 - 8 44 8
34= GOAL 60 17 10 30 3
36= MINSHENG FINANCIAL LEASING 59 - 14 43 2
36= MERX AVIATION 59 - 2 55 2
38 SKY LEASING 57 - - 45 12
39 INVESTEC 56 13 6 15 22
39 SBERBANK LEASING 56 - 20 30 6
41 ACCIPITER 53 - - 51 2
42= JETRAN LLC 52 4 3 41 4
42= STATE TRANSPORT LEASING COMPANY 52 - 6 38 8
42= MC AVIATION PARTNERS 52 - - 46 6
42= ALTAVAIR AIRFINANCE 52 - - 24 28
46 ASL AVIATION GROUP 49 20 - 22 7
47 FPG AMENTUM 44 - - 33 11
48 WNG CAPITAL 42 - - 39 3
49= FORTRESS T&I INVESTORS 40 - - 28 12
49= DORIC 40 6 - 6 28
Total 9,151 622 761 6,317 1,451
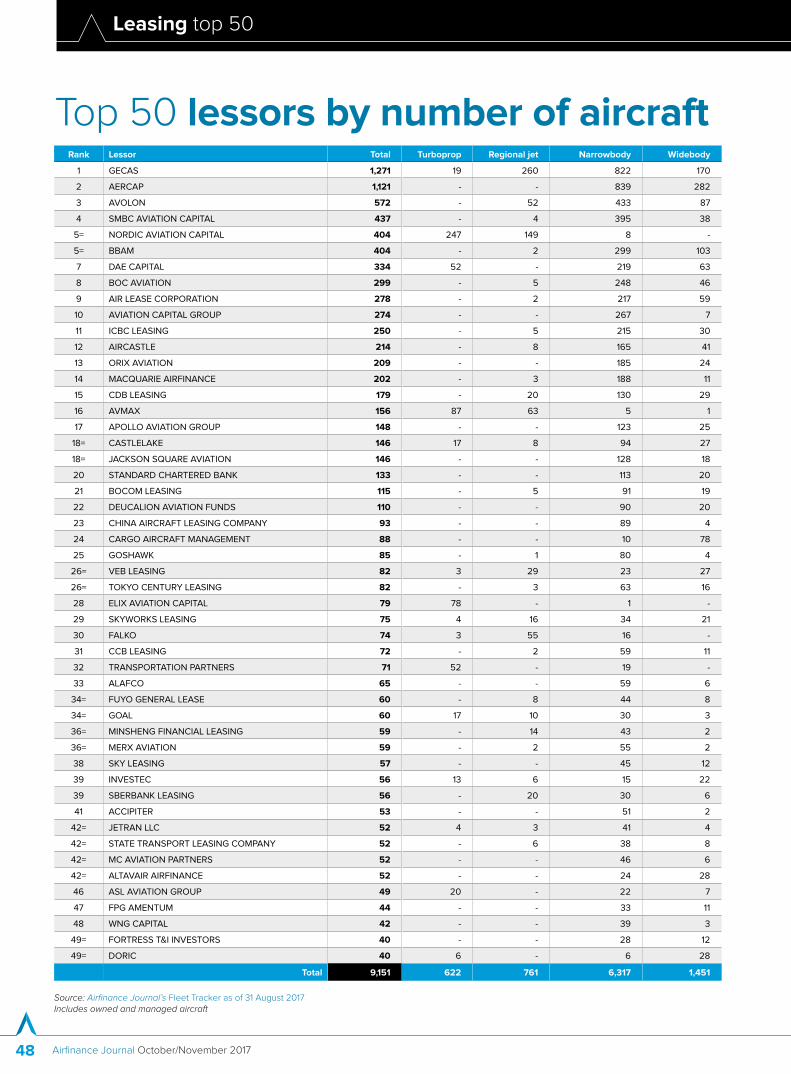
Top 50 lessors by number of aircraft
Source: Airfinance Journal’s Fleet Tracker as of 31 August 2017Includes owned and managed aircraft
Leasing top 50
www.airfinancejournal.com 49
Rank Lessor Total Turboprop Regional jet Narrowbody Widebody
1 AERCAP $35,110 - - $18,795 $16,315
2 GECAS $28,327 $249 $1,793 $16,755 $9,531
3 AVOLON $21,254 - $1,040 $13,537 $6,677
4 BBAM $19,711 - $35 $8,737 $10,939
5 SMBC AVIATION CAPITAL $17,393 - $72 $12,995 $4,326
6 BOC AVIATION $13,862 - $131 $9,368 $4,362
7 AIR LEASE CORPORATION $13,772 - $44 $7,711 $6,018
8 ICBC LEASING $11,779 - $135 $8,422 $3,222
9 DAE CAPITAL $11,655 $864 - $6,524 $4,267
10 AVIATION CAPITAL GROUP $8,465 - - $8,195 $270
11 CDB LEASING $6,987 - $457 $4,667 $1,863
12 JACKSON SQUARE AVIATION $6,793 - - $4,953 $1,840
13 ORIX AVIATION $6,648 - - $5,158 $1,490
14 AIRCASTLE $6,627 - $198 $3,774 $2,654
15 NORDIC AVIATION CAPITAL $6,135 $3,025 $2,860 $250 -
16 MACQUARIE AIRFINANCE $5,824 - $51 $5,024 $748
17 BOCOM LEASING $5,743 - $171 $3,511 $2,060
18 STANDARD CHARTERED BANK $5,577 - - $4,175 $1,402
19 CCB LEASING $3,774 - $48 $2,443 $1,283
20 CHINA AIRCRAFT LEASING COMPANY $3,614 - - $3,335 $278
21 TOKYO CENTURY LEASING $3,590 - $51 $2,301 $1,238
22 GOSHAWK $3,520 - $23 $3,050 $446
23 INVESTEC $3,049 $140 $146 $427 $2,336
24 DORIC $2,794 $61 - $144 $2,589
25 ALAFCO $2,785 - - $1,905 $880
26 INTREPID AVIATION $2,759 - - $39 $2,720
27 ALTAVAIR AIRFINANCE $2,731 - - $595 $2,136
28 APOLLO AVIATION GROUP $2,702 - - $1,996 $706
29 VEB LEASING $2,698 $34 $548 $623 $1,492
30 DEUCALION AVIATION FUNDS $2,666 - - $1,604 $1,062
31 AMEDEO AIR FOUR PLUS $2,635 - - - $2,635
32 IAFC $2,381 - - $350 $2,031
33 FUYO GENERAL LEASE $2,249 - $210 $1,417 $621
34 ACCIPITER $1,879 - - $1,717 $161
35 CASTLELAKE $1,871 $57 $45 $1,350 $418
36 FPG AMENTUM $1,829 - - $1,039 $789
37 SKY LEASING $1,794 - - $985 $809
38 NOVUS AVIATION $1,713 - - $99 $1,614
39 MC AVIATION PARTNERS $1,676 - - $1,492 $184
40 MINSHENG FINANCIAL LEASING $1,645 - - $1,437 $207
41 MERX AVIATION $1,608 - $58 $1,386 $163
42 AVIA CAPITAL LEASING $1,576 - - $1,502 $74
43 TRANSPORTATION PARTNERS $1,551 $805 - $746 -
44 CMB FINANCIAL LEASING $1,479 - - $1,219 $259
45 GOAL $1,448 $227 $195 $900 $126
46 VIETNAM AIRCRAFT LEASING $1,205 $50 - $369 $787
47 EMP STRUCTURED ASSETS GmbH $1,194 - - - $1,194
48 STELLWAGEN GROUP $1,130 - - $282 $848
49 SBERBANK LEASING $1,129 - $386 $449 $294
50 DRAGON AVIATION LEASING $1,094 - - $1,009 $85
Total $301,425 $5,512 $8,699 $178,767 $108,448
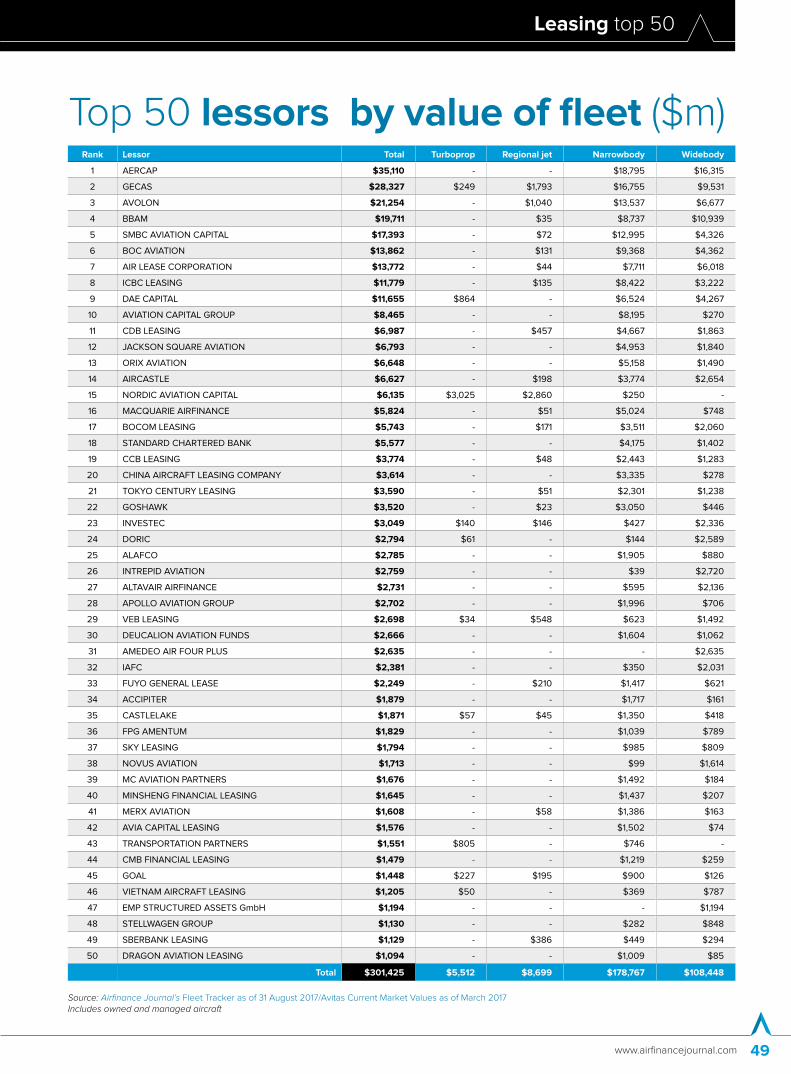
Top 50 lessors by value of fleet ($m)
Source: Airfinance Journal’s Fleet Tracker as of 31 August 2017/Avitas Current Market Values as of March 2017Includes owned and managed aircraft
Leasing top 50
Airfinance Journal October/November 201750
range for some aircraft types, there would be a noticeable decline in yield. As can be seen, although there is a flattening, there is no meaningful decline, so far.
The possible explanations are numerous: it could be that these deals are being done only at the margin and have not started to move the aggregate needle (yet). Or it could be (again) that they are being executed by lessors not within the scope of the survey. Or it could be that they have mostly been executed in calendar 2017 and the financials have not caught up with them. Next year’s study will be interesting.
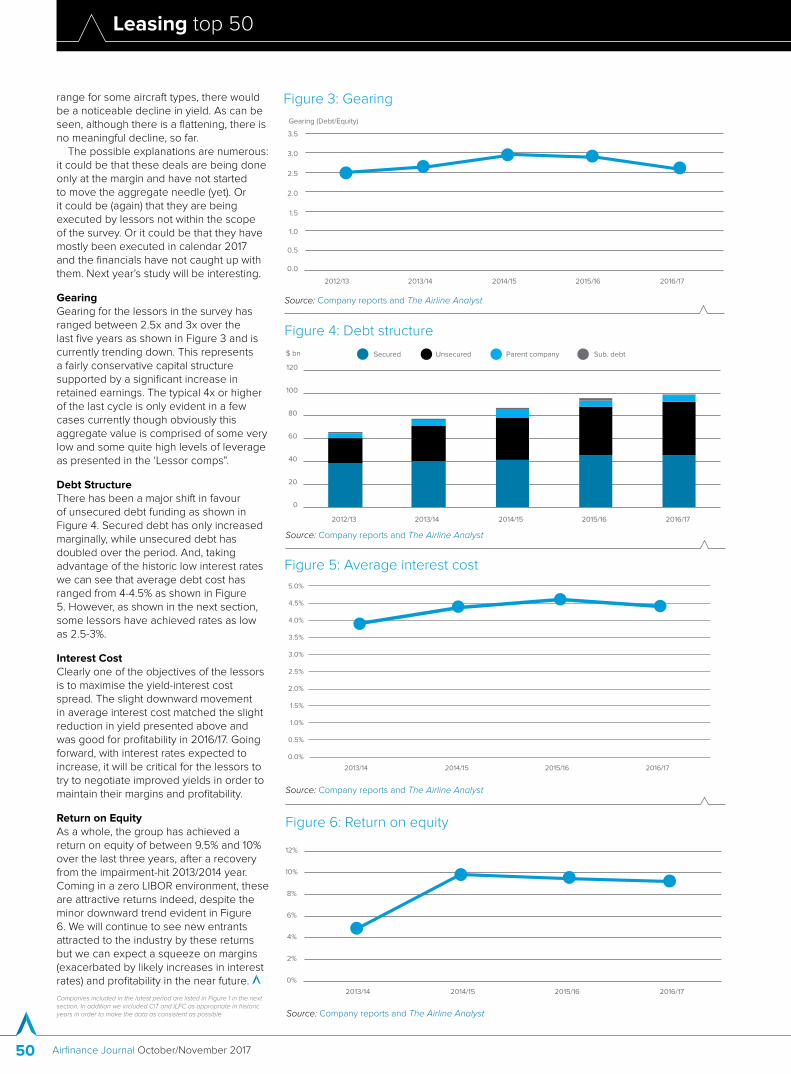
GearingGearing for the lessors in the survey has ranged between 2.5x and 3x over the last five years as shown in Figure 3 and is currently trending down. This represents a fairly conservative capital structure supported by a significant increase in retained earnings. The typical 4x or higher of the last cycle is only evident in a few cases currently though obviously this aggregate value is comprised of some very low and some quite high levels of leverage as presented in the ‘Lessor comps”.
Debt StructureThere has been a major shift in favour of unsecured debt funding as shown in Figure 4. Secured debt has only increased marginally, while unsecured debt has doubled over the period. And, taking advantage of the historic low interest rates we can see that average debt cost has ranged from 4-4.5% as shown in Figure 5. However, as shown in the next section, some lessors have achieved rates as low as 2.5-3%.
Interest CostClearly one of the objectives of the lessors is to maximise the yield-interest cost spread. The slight downward movement in average interest cost matched the slight reduction in yield presented above and was good for profitability in 2016/17. Going forward, with interest rates expected to increase, it will be critical for the lessors to try to negotiate improved yields in order to maintain their margins and profitability.
Return on EquityAs a whole, the group has achieved a return on equity of between 9.5% and 10% over the last three years, after a recovery from the impairment-hit 2013/2014 year. Coming in a zero LIBOR environment, these are attractive returns indeed, despite the minor downward trend evident in Figure 6. We will continue to see new entrants attracted to the industry by these returns but we can expect a squeeze on margins (exacerbated by likely increases in interest rates) and profitability in the near future.
Companies included in the latest period are listed in Figure 1 in the next section. In addition we included CIT and ILFC as appropriate in historic years in order to make the data as consistent as possible
Figure 3: Gearing
0.0
0.5
1.0
1.5
2.0
2.5
3.0
3.5
2012/13 2013/14 2014/15 2015/16 2016/17
Gearing (Debt/Equity)
Source: Company reports and The Airline Analyst
Figure 4: Debt structure
0
20
40
60
80
100
120
2012/13 2013/14 2014/15 2015/16 2016/17
$ bn Secured Unsecured Parent company Sub. debt
Source: Company reports and The Airline Analyst
Figure 5: Average interest cost
0.0%
0.5%
1.0%
1.5%
2.0%
2.5%
3.0%
3.5%
4.0%
4.5%
5.0%
2013/14 2014/15 2015/16 2016/17
Source: Company reports and The Airline Analyst
Figure 6: Return on equity
0%
2%
4%
6%
8%
10%
12%
2013/14 2014/15 2015/16 2016/17
Source: Company reports and The Airline Analyst

Leasing top 50
www.airfinancejournal.com 51
Lessor Country FYE Abbreviation
Accipiter Holdings Ireland 31-Dec-16 Accipiter
AerCap Holdings NV Netherlands 31-Dec-16 AerCap
Air Lease Corporation USA 31-Dec-16 ALC
Aircastle USA 31-Dec-16 Aircastle
ALAFCO Kuwait 30-Sep-16 ALAFCO
Amedeo Air Four Plus UK 31-Mar-17 AA4+
Avation PLC UK 30-Jun-17 Avation
AviaAM Leasing AB Lithuania 31-Dec-16 AviaAM
Aviation Capital Group Corp. USA 31-Dec-16 ACG
Avolon Holdings Inc. Ireland 31-Dec-16 Avolon
AWAS Aviation Capital Ireland 30-Nov-16 AWAS
BOC Aviation Singapore 31-Dec-16 BOC Aviation
CDB Aviation Lease Finance Ireland 31-Dec-16 CDBL
China Aircraft Leasing Group Holdings China 31-Dec-16 CALC
Elix Aviation Capital Ireland 31-Dec-16 Elix
FLY Leasing Ireland 31-Dec-16 FLY
GECAS1 USA 31-Dec-16 GECAS
MCAP Europe Ireland 31-Mar-16 MCAP
Nordic Aviation Capital Denmark 30-Jun-16 NAC
SMBC Aviation Capital Ireland 31-Mar-17 SMBC AC
Vermillion Aviation Holdings Ireland Ireland 31-Dec-16 Vermillion
1 Assets and net income only
Lessor comparisons – 2016/17This study offers a comparison of the financial performance and capital structures of the aircraft leasing companies based on their most recent available financial statements (ending either in 2016 or 2017).
Figure 1: Lessors included in the study
Item Treatment
Gain on sale of aircraft Net gain included in revenue
Recognition of "excess" maintenance reserves Included in lease revenue but not seperately disclosed by every lessor
Maintenance and transition costs Recognised under its own heading when disclosed, but not disclosed by every lessor
Staff cost, including stock-based compensation Included in SG&A expenses
Interest income Included in other revenue
Source: Company reports and The Airline Analyst
Figure 2: Adjustments to enhance comparability
To make this report as comprehensive as possible, we have reached beyond the
publicly listed lessors to the public filings of lessors in Ireland, Denmark and Kuwait.
Figure 1 identifies the entities included in the study. In total we have been able to source the financials for 20 leasing companies. Financials are not available for GECAS, but some headline numbers (though fewer than historically) are available in the GE Annual Report. In addition to the obvious major players, we include AviaAM from Lithuania (listed in Poland) and Avation Plc from Singapore (listed in the UK). Most of the lessors in the study are incorporated in the USA or Ireland though two of the largest, AerCap and BOC Aviation, are incorporated in the Netherlands and Singapore, respectively. The abbreviations used to refer to the lessors through the rest of this study are also indicated in Figure 1.
In aggregate, the lessors included in the study represent a total current fleet of 5,679 aircraft or 49% of the 11,593 aircraft analysed in the “Global leased fleet” section of this supplement. The significant absences from our coverage include Macquarie who do not file financial information publicly other than a few headline numbers, DAE Capital (though we do include the 2016 numbers for AWAS) and BBAM (though we do include FLY). Some lessors that we have included previously are not included as they had not filed their 2016 financial statements at the date of preparing this compilation. These are AerDragon, Lease Corporation International, Pembroke Capital and Triangle (Falko). We have included for the first time Avolon, Vermillion and Accipter.
Note that for some lessors, the entities analysed do not represent the entirety of their global leasing business and may be impacted by internal funding arrangements and inter-company transactions. This applies particularly to Accipiter, MCAP and SMBC AC who have been heavily funded by shareholder loans so please interpret their numbers
accordingly. Over the last two years, however, SMBC AC has partially funded itself from external sources.
AdjustmentsIn order to enhance comparability in treatment and presentation of the financial statements we have made some adjustments as described in Figure 2.
Leasing top 50
Airfinance Journal October/November 201752
Profitability
Figure 3: Total revenue ($ million)
0
1,000
2,000
3,000
4,000
5,000
6,000
Ae
rCa
p
ALC
BO
C A
via
tio
n
SM
BC
AC
Avo
lon
AW
AS
AC
G
Air
cast
le
NA
C
CD
B A
via
tio
n
FLY
Le
asi
ng
ALA
FC
O
CA
LC
Acc
ipit
er
Am
ed
eo
Air
MC
AP
Eu
rop
e
Ve
rmill
ion
Ava
tio
n P
LC
ELI
X A
via
tio
n
Avi
aA
M
$m
Figure 4: Net income ($ million)
(200)
0
200
400
600
800
1,000
1,200
1,400
1,600
GE
CA
S*
Ae
rCa
p
BO
C A
via
tio
n
ALC
Avo
lon
SM
BC
AC
Air
cast
le
NA
C
CD
B A
via
tio
n L
ea
se
CA
LC
AC
G
ALA
FC
O
MC
AP
Eu
rop
e
Ava
tio
n P
LC
Avi
aA
M
Ve
rmill
ion
Acc
ipit
er
Ho
ldin
gs
ELI
X A
via
tio
n C
ap
ita
l
FLY
Le
asi
ng
Am
ed
eo
Air
Fo
ur
Plu
s
AW
AS
$m
Source: Company reports and The Airline Analyst
Source: Company reports and The Airline Analyst
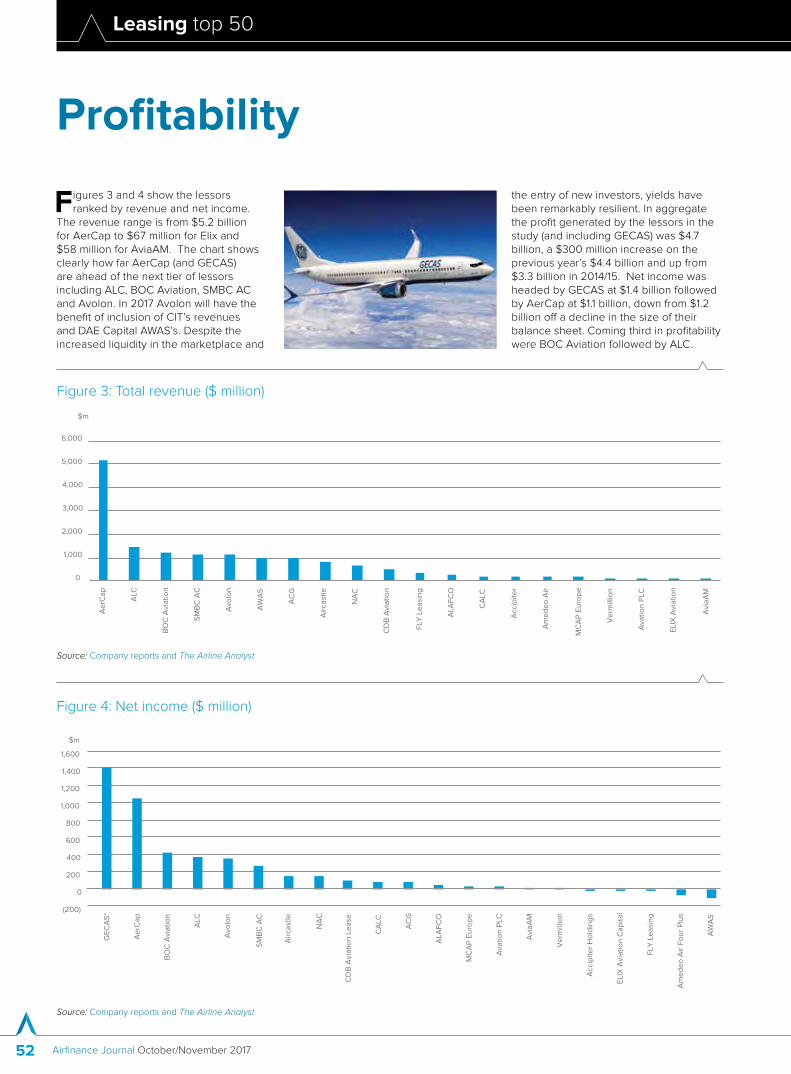
Figures 3 and 4 show the lessors ranked by revenue and net income.
The revenue range is from $5.2 billion for AerCap to $67 million for Elix and $58 million for AviaAM. The chart shows clearly how far AerCap (and GECAS) are ahead of the next tier of lessors including ALC, BOC Aviation, SMBC AC and Avolon. In 2017 Avolon will have the benefit of inclusion of CIT’s revenues and DAE Capital AWAS’s. Despite the increased liquidity in the marketplace and
the entry of new investors, yields have been remarkably resilient. In aggregate the profit generated by the lessors in the study (and including GECAS) was $4.7 billion, a $300 million increase on the previous year’s $4.4 billion and up from $3.3 billion in 2014/15. Net income was headed by GECAS at $1.4 billion followed by AerCap at $1.1 billion, down from $1.2 billion off a decline in the size of their balance sheet. Coming third in profitability were BOC Aviation followed by ALC.
Leasing top 50
www.airfinancejournal.com 53
Figure 5: Yield, spread and debt costDebt Cost Spread
0%
5%
10%
15%
20%
25%
30%
35%
40%
Avi
aA
M
NA
C
MC
AP
Eu
rop
e
Ae
rCa
p
CD
B A
via
tio
n L
ea
se
Ava
tio
n
AW
AS
Avo
lon
ELI
X A
via
tio
n C
ap
ita
l
Air
cast
le
FLY
Le
asi
ng
AC
G
ALC
Ve
rmill
ion
Acc
ipit
er
Ho
ldin
gs
AA
4+
ALA
FC
O
BO
C A
via
tio
n
SM
BC
AC
CA
LC
Figure 6: Gain (loss) on disposal of aircraft
$m
0
20
40
60
80
100
120
140
160
Ae
rCa
p
BO
C A
via
tio
n
SM
BC
AC
Avo
lon
Air
cast
le
FLY
Le
asi
ng
AW
AS
CD
B A
via
tio
n
Avi
aA
M
NA
C
Ava
tio
n P
LC
ALA
FC
O
AC
G
Source: Company reports and The Airline Analyst
Source: Company reports and The Airline Analyst
Among the key drivers of lessor profitability is the spread between lease yield and debt cost of funds. Figure 5 shows all three, ranked in descending order of yield.
AviaAM leads on this measure. NAC comes second with yield of 17.4%, followed by MCAP Europe at 16% and AerCap at 15.6%.
AWAS also generates attractive yields but their relatively high debt costs result in lower margins. BOC Aviation comes third bottom of the lease yield ranking at 11.5% but makes it up with the second lowest debt finance cost of 2.7%, resulting in a spread of 7.8%.
Commercial finance costs range from AA4+’s 2.5% and BOC Aviation’s 2.7% to AviaAM’s 14%. Others at the low end of the scale include ALAFCO and AerCap. MCAP and SMBC AC have a low debt cost but both have large amounts of shareholder provided debt.
ALC shows a creditable 3.7% average cost of debt. At the higher end are Aircastle, Avation, FLY and AWAS.
NAC showed a sizeable reduction in cost of debt from 6.4% to 5.6% in the prior year (and may show further improvement when they release their 2016/17 financials shortly).
Gains/losses on salesAggregate Plant, Property and Equipment for the lessors in the study (excluding GECAS) is $121 billion. Gains booked were $518 million, 10% up on 2015/16 and double the prior year, and 13% of reported profit before tax. Gains from aircraft sales made a significant contribution to the profitability of a number of lessors as shown in Figure 6.

Leasing top 50
Airfinance Journal October/November 201754
Financial flexibility
Figure 7: Asset impairment
$m
(250)
(200)
(150)
(100)
(50)
0
AW
AS
AC
G
NA
C
FLY
Le
asi
ng
Ae
rCa
p
Air
cast
le
SM
BC
AC
CD
B A
via
tio
n
ALA
FC
O
Avi
aA
M
BO
C A
via
tio
n
Acc
ipit
er
Avo
lon
Figure 8: Debt/equity ratio
0
2
4
6
8
10
12
14
MC
AP
Eu
rop
e
CD
B A
via
tio
n L
ea
se
Avi
aA
M
SM
BC
AC
Avo
lon
ALA
FC
O
Ve
rmill
ion
Acc
ipit
er
Air
cast
le
BO
C A
via
tio
n
ALC
AW
AS
AC
G
Ae
rCa
p
NA
C
Ava
tio
n P
LC
AA
4+
FLY
Le
asi
ng
CA
LC
Times Debt/Equity Debt/Equity (Shareholder Loans as Equity)
Source: Company reports and The Airline Analyst
ImpairmentsImpairments were not universal but had a significant impact on AWAS, ACG, NAC and FLY in particular, as shown in Figure 7.
Financial FlexibilityWe assess four elements of financial flexibility – leverage as measured by the debt/equity ratio, level of secured debt relative to tangible assets, EBITDA (earnings before interest, tax, depreciation and amortisation) interest coverage and liquidity.
LeverageWe measure leverage using a simpledebt/equity ratio made slightly complicatedas a number of lessors use parent loansas a more-or-less permanent part of theircapital structure.
Figure 8 therefore shows leverage both counting parent company loans as debt and as equity. You can see this is quite significant for a few lessors. On the latter basis the majority of the lessors are in a range of 2x-4x.
Debt structureBorrowing unsecured has many attractions, being more flexible and having lower transaction costs than borrowing on a secured basis, though at the cost of higher coupons or margins. The ratings agencies generally cite low levels of secured debt as being a key consideration in granting unsecured investment grade ratings to lessors. AerCap lost its investment grade ratings as a result of its acquisition of ILFC, which increased leverage significantly.
Source: Company reports and The Airline Analyst
Figure 9: Lessor unsecured credit ratings
Fitch Moody's S&P Kroll
AerCap BBB-(stable) - BBB-(stable) -
ALC BBB(stable) - BBB(stable) A-
Aircastle - Ba1(stable) BB+(pos) -
Avation B+(stable) - B+(stable)
ACG BBB(stable) - A-(stable) -
Avolon BB(stable) Ba2(stable) BB+(stable) BBB
AWAS - Ba3(stable) BB(pos) -
BOC Aviation A-(stable) - A-(stable) -
DAE - B3(stable) B-(pos) -
FLY - Ba3(stable) BB-(stable) BBB
ILFC - Baa3(stable) - -
NAC - - - BBB+
SMBC AC A-(stable) - BBB+(stable) -
Leasing top 50
www.airfinancejournal.com 55
Figure 10: Debt structure
Secured borrowings Unsecured borrowings Borrowings from shareholders Subordinated debt
0% 10% 20% 30% 40% 50% 60% 70% 80% 90% 100%
ALC
ACG
Aircastle
BOC Aviation
AerCap
SMBC AC
FLY Leasing
CALC
Avation
NAC
AWAS
CDB Aviation Lease
Accipiter
Avolon
ALAFCO
MCAP Europe
AviaAM
Vermillion
ELIX Aviation Capital
AA4+
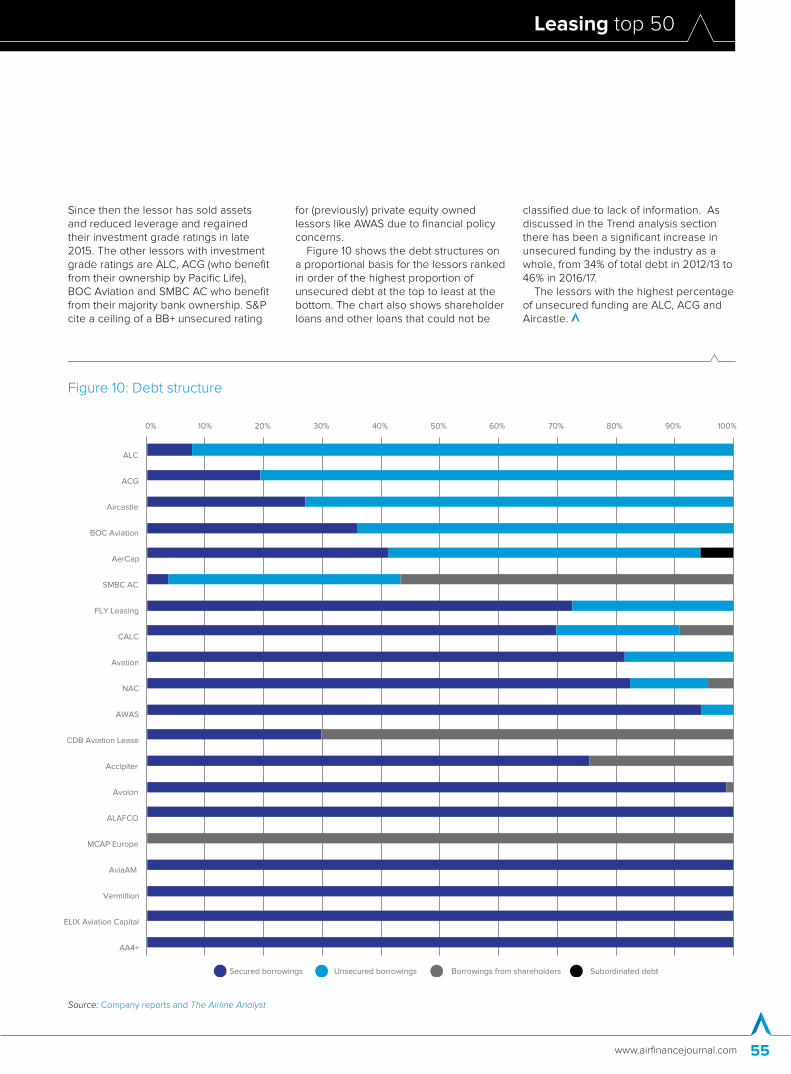
Since then the lessor has sold assets and reduced leverage and regained their investment grade ratings in late 2015. The other lessors with investment grade ratings are ALC, ACG (who benefit from their ownership by Pacific Life), BOC Aviation and SMBC AC who benefit from their majority bank ownership. S&P cite a ceiling of a BB+ unsecured rating
for (previously) private equity owned lessors like AWAS due to financial policy concerns.
Figure 10 shows the debt structures on a proportional basis for the lessors ranked in order of the highest proportion of unsecured debt at the top to least at the bottom. The chart also shows shareholder loans and other loans that could not be
classified due to lack of information. As discussed in the Trend analysis section there has been a significant increase in unsecured funding by the industry as a whole, from 34% of total debt in 2012/13 to 46% in 2016/17.
The lessors with the highest percentage of unsecured funding are ALC, ACG and Aircastle.
Source: Company reports and The Airline Analyst

Leasing top 50
Airfinance Journal October/November 201756
Financial flexibility
Figure 11: Secured debt/gross tangible assets
0%
10%
20%
30%
40%
50%
60%
70%
80%
90%
MC
AP
Eu
rop
e
SM
BC
AC
ALC
AC
G
Air
cast
le
CD
B A
via
tio
n L
ea
se
BO
C A
via
tio
n
Avi
aA
M
Ae
rCa
p
ALA
FC
O
FLY
Le
asi
ng
NA
C
CA
LC
Ava
tio
n
AW
AS
Avo
lon
Acc
ipit
er
AA
4+
Ve
rmill
ion
ELI
X A
via
tio
n C
ap
ita
l
Source: Company reports and The Airline Analyst
Secured debt/Tangible assetsFigure 11 shows secured borrowing as a percentage of tangible assets which indicates the level of protection available for unsecured creditors. The data for MCAP reflects their 100% shareholder funding debt structure. The next five best ranked lessors reflect significant amounts of unsecured funding.
MCAP Europe, SMBC and ALC come top of the list, the last with its 94/6 unsecured/secured debt structure which supports its BBB- investment grade rating. Then follow ACG, Aircastle, CDB Aviation Lease, BOC Aviation, AviaAM and AerCap, who all have
significant portions of unsecured debt in their debt structures. AerCap had $14.8 billion of unsecured financing outstanding at balance date, but this represented only 53% of its total debt. BOC Aviation has been a regular visitor to the unsecured capital markets in several jurisdictions. FLY increased its unsecured debt to $691 million in 2016. NAC raised a $230 million unsecured five year term loan facility in 2012/13 and had $345 million unsecured debt outstanding at its 30 June 2016 balance date. SMBC AC’s debt structure features a large element of shareholder funding of $4.3 billion and $2.5 billion of
loans (all unsecured) from third-parties, the source of which is not disclosed in the financial statements.
Interest coverageInterest coverage measured as EBITDA/finance costs is another key aspect of financial flexibility. From Figure 12 we see that the majority of lessors covered by the study have a healthy coverage of at least two times and many have much better coverage than that, particularly AviaAM, AA4+, ALAFCO, BOC Aviation and ALC. A sharp contrast can be seen with some of those further down the chart.
Figure 12: Ebitda/total finance costs
0
1.0
2.0
3.0
4.0
5.0
6.0
7.0
Avi
aA
M
AA
4+
ALA
FC
O
BO
C A
via
tio
n
ALC
MC
AP
Eu
rop
e
Avo
lon
Ae
rCa
p
CD
B A
via
tio
n
SM
BC
Avi
ati
on
AC
G
Air
cast
le
Ava
tio
n P
LC
Ve
rmill
ion
No
rdic
Avi
ati
on
Acc
ipit
er
FLY
Le
asi
ng
CA
LC
AW
AS
ELI
X A
via
tio
n
Times
Source: Company reports and The Airline Analyst
Leasing top 50
www.airfinancejournal.com 57
Figure 13: Cash/total debt
0%
10%
20%
30%
40%
50%
60%
Avi
aA
M
CA
LC
FLY
Le
asi
ng
CD
B A
via
tio
n L
ea
se
Ava
tio
n P
LC
Acc
ipit
er
Ho
ldin
gs
ALA
FC
O
Air
cast
le
MC
AP
Eu
rop
e
Ve
rmill
ion
ELI
X A
via
tio
n C
ap
ita
l
Ae
rCa
p
BO
C A
via
tio
n
AA
4+
Avo
lon
NA
C
AW
AS
SM
BC
AC
ALC
AC
G
Figure 14: PBT margin
-60%
-40%
-20%
0%
20%
40%
60%
80%
CA
LC
ALC
BO
C A
via
tio
n
Avi
aA
M
Avo
lon
SM
BC
AC
NA
C
CD
B A
via
tio
n L
ea
se
MC
AP
Eu
rop
e
Ae
rCa
p
Ava
tio
n P
LC
ALA
FC
O
Air
cast
le
AC
G
Ve
rmill
ion
Acc
ipit
er
Ho
ldin
gs
FLY
Le
asi
ng
AW
AS
ELI
X A
via
tio
n C
ap
ita
l
AA
4+
Source: Company reports and The Airline Analyst
Source: Company reports and The Airline Analyst
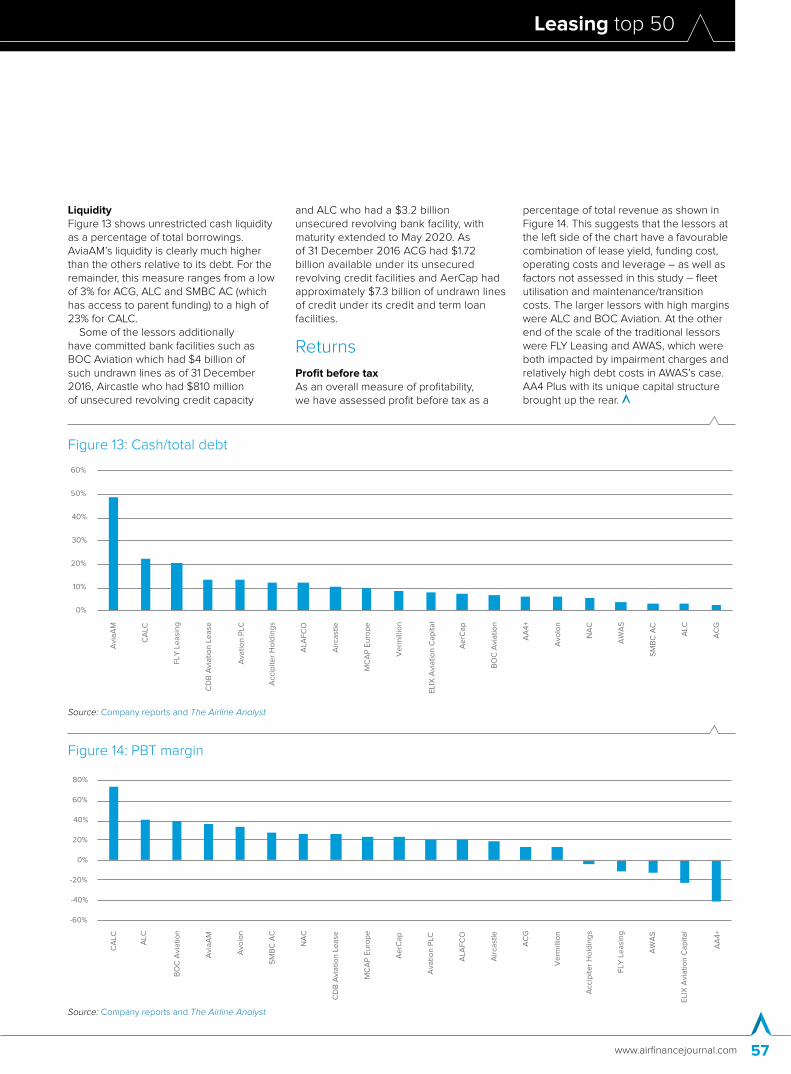
LiquidityFigure 13 shows unrestricted cash liquidity as a percentage of total borrowings. AviaAM’s liquidity is clearly much higher than the others relative to its debt. For the remainder, this measure ranges from a low of 3% for ACG, ALC and SMBC AC (which has access to parent funding) to a high of 23% for CALC.
Some of the lessors additionally have committed bank facilities such as BOC Aviation which had $4 billion of such undrawn lines as of 31 December 2016, Aircastle who had $810 million of unsecured revolving credit capacity
and ALC who had a $3.2 billion unsecured revolving bank facility, with maturity extended to May 2020. As of 31 December 2016 ACG had $1.72 billion available under its unsecured revolving credit facilities and AerCap had approximately $7.3 billion of undrawn lines of credit under its credit and term loan facilities.
Returns
Profit before taxAs an overall measure of profitability, we have assessed profit before tax as a
percentage of total revenue as shown in Figure 14. This suggests that the lessors at the left side of the chart have a favourable combination of lease yield, funding cost, operating costs and leverage – as well as factors not assessed in this study – fleet utilisation and maintenance/transition costs. The larger lessors with high margins were ALC and BOC Aviation. At the other end of the scale of the traditional lessors were FLY Leasing and AWAS, which were both impacted by impairment charges and relatively high debt costs in AWAS’s case. AA4 Plus with its unique capital structure brought up the rear.

Leasing top 50
Airfinance Journal October/November 201758
Returns
Figure 15: Tax rate
0%
5%
10%
15%
20%
25%
30%
35%
40%
AA
4+
Ava
tio
n P
LC
ELI
X A
C
Avo
lon
ALA
FC
O
AW
AS
Air
cast
le
NA
C
Acc
ipit
er
Ho
ldin
gs
BO
C A
via
tio
n
MC
AP
Eu
rop
e
Ve
rmill
ion
SM
BC
AC
Ae
rCa
p
CD
B A
LF
Avi
aA
M
FLY
Le
asi
ng
CA
LC
Air
Le
ase
Co
rp
AC
G
Figure 16: Return on average equity (shareholder loans as equity)
-30%
-20%
-10%
0%
10%
20%
30%
40%
50%
60%
70%
80%
ELI
X A
C
CD
B A
via
tio
n L
ea
se
NA
C
Avi
aA
M
BO
C A
via
tio
n
Ae
rCa
p
CA
LC
ALC
Ava
tio
n P
LC
Ve
rmill
ion
Air
cast
le
Avo
lon
ALA
FC
O
SM
BC
AC
AC
G
MC
AP
Eu
rop
e
FLY
Le
asi
ng
Acc
ipit
er
Ho
ldin
gs
AW
AS
AA
4+
Source: Company reports and The Airline Analyst
Source: Company reports and The Airline Analyst
Tax chargeOne of the drivers of net profitability is the tax rate on profits. Figure 15 shows that, with three exceptions, tax charges were all below 20%. So it is not just Ireland and Singapore that would appear to offer attractive fiscal regimes for aircraft operating lease companies. However prima facie, the US does not look a very attractive jurisdiction!
Return on equityReturn on average equity is shown in Figure 16. Just under half of the lessors delivered a return on equity in excess of
10% in their most recent annual financial period. Elix’s, CDB Aviation Lease Finance’s and CALC’s returns are commendable but should be interpreted in conjunction with their high leverage. NAC with 16.2% arguably generated the best returns of the group for those lessors with a more normal balance sheet structure. Other established lessors like BOC Aviation and AerCap generated solid low teens returns, but down from “mid-teens” last year.
ConclusionThis review has shown some of the key dynamics affecting aircraft lessors’ business
models which are more varied than would appear the case at first inspection. Lease yield, debt cost, asset selection, asset utilisation and re-marketing capabilities are all critical components of the aircraft operating leasing business.
Get these right, and the aircraft leasing business can offer substantial “libor-plus” returns to equity investors.
However lease yields and ROEs appear to be trending down and it will be interesting to see the implications for this set of lessors in a year’s time.
Please direct any questions or comments to [email protected].
Leasing top 50
www.airfinancejournal.com 59
Analysis of the global leased fleet
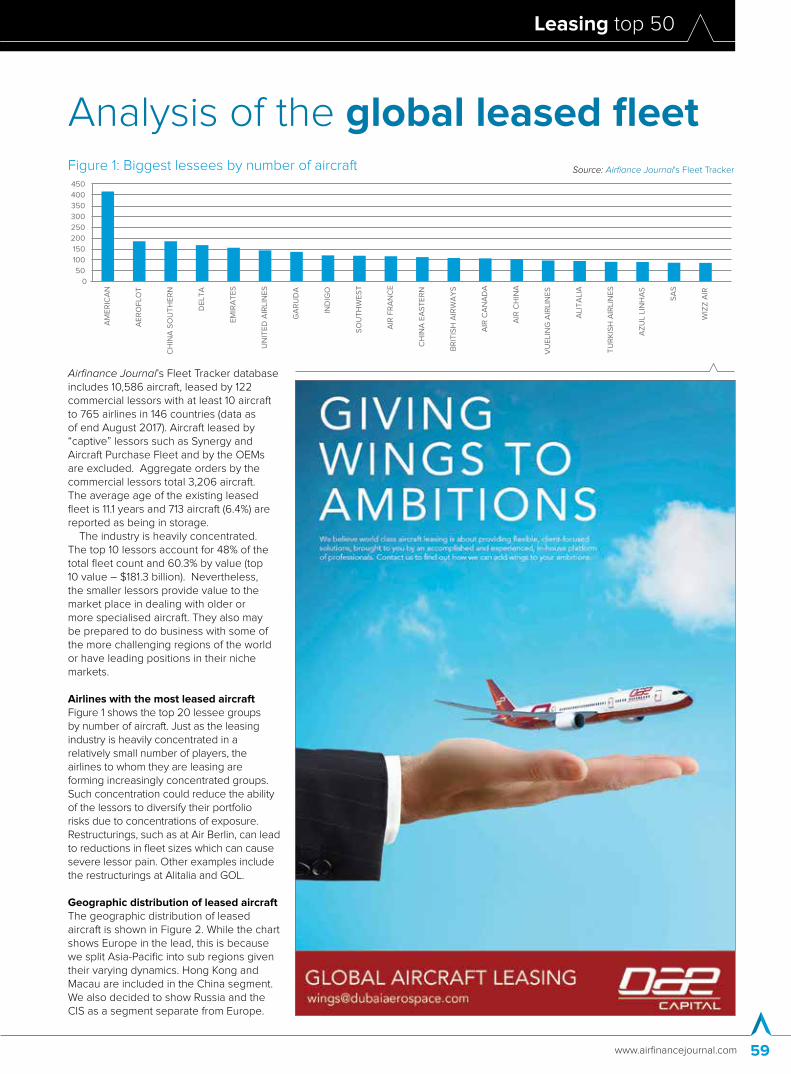
Airfinance Journal’s Fleet Tracker database includes 10,586 aircraft, leased by 122 commercial lessors with at least 10 aircraft to 765 airlines in 146 countries (data as of end August 2017). Aircraft leased by “captive” lessors such as Synergy and Aircraft Purchase Fleet and by the OEMs are excluded. Aggregate orders by the commercial lessors total 3,206 aircraft. The average age of the existing leased fleet is 11.1 years and 713 aircraft (6.4%) are reported as being in storage.
The industry is heavily concentrated. The top 10 lessors account for 48% of the total fleet count and 60.3% by value (top 10 value – $181.3 billion). Nevertheless, the smaller lessors provide value to the market place in dealing with older or more specialised aircraft. They also may be prepared to do business with some of the more challenging regions of the world or have leading positions in their niche markets.
Airlines with the most leased aircraftFigure 1 shows the top 20 lessee groups by number of aircraft. Just as the leasing industry is heavily concentrated in a relatively small number of players, the airlines to whom they are leasing are forming increasingly concentrated groups. Such concentration could reduce the ability of the lessors to diversify their portfolio risks due to concentrations of exposure. Restructurings, such as at Air Berlin, can lead to reductions in fleet sizes which can cause severe lessor pain. Other examples include the restructurings at Alitalia and GOL.
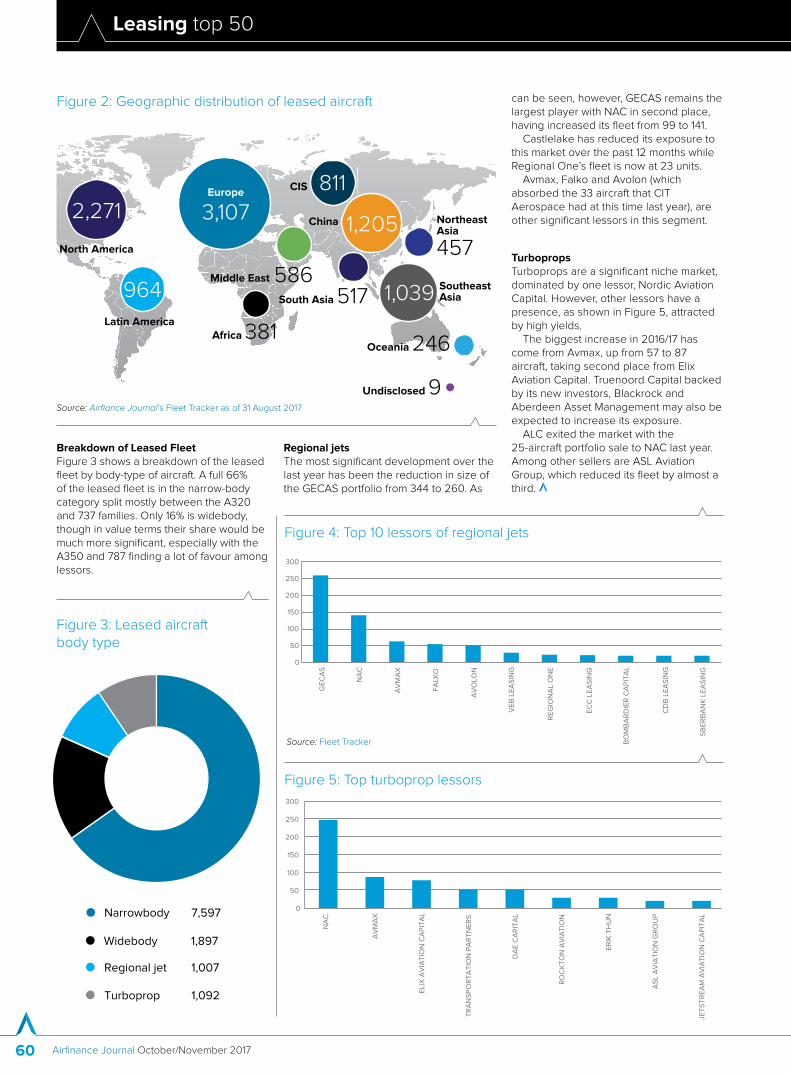
Geographic distribution of leased aircraftThe geographic distribution of leased aircraft is shown in Figure 2. While the chart shows Europe in the lead, this is because we split Asia-Pacific into sub regions given their varying dynamics. Hong Kong and Macau are included in the China segment. We also decided to show Russia and the CIS as a segment separate from Europe.
0
50
100
150
200
250
300
350
400
450
AM
ER
ICA
N
AE
RO
FLO
T
CH
INA
SO
UT
HE
RN
DE
LTA
EM
IRA
TE
S
UN
ITE
D A
IRLI
NE
S
GA
RU
DA
IND
IGO
SO
UT
HW
ES
T
AIR
FR
AN
CE
CH
INA
EA
ST
ER
N
BR
ITIS
H A
IRW
AY
S
AIR
CA
NA
DA
AIR
CH
INA
VU
ELI
NG
AIR
LIN
ES
ALI
TA
LIA
TU
RK
ISH
AIR
LIN
ES
AZ
UL
LIN
HA
S
SA
S
WIZ
Z A
IR
Figure 1: Biggest lessees by number of aircraft Source: Airfiance Journal’s Fleet Tracker
Leasing top 50
Airfinance Journal October/November 201760
Breakdown of Leased FleetFigure 3 shows a breakdown of the leased fleet by body-type of aircraft. A full 66% of the leased fleet is in the narrow-body category split mostly between the A320 and 737 families. Only 16% is widebody, though in value terms their share would be much more significant, especially with the A350 and 787 finding a lot of favour among lessors.
Europe
3,107 ●●
Latin America
●964Middle East 586
North America●2,271
●Northeast Asia
457
South Asia 517●
SoutheastAsia1,039
Oceania 246●Africa 381●
CIS 811
China
Undisclosed 9
1,205
Figure 2: Geographic distribution of leased aircraft
● Narrowbody 7,597
● Widebody 1,897
● Regional jet 1,007
● Turboprop 1,092
Figure 3: Leased aircraft body type
Regional jetsThe most significant development over the last year has been the reduction in size of the GECAS portfolio from 344 to 260. As
can be seen, however, GECAS remains the largest player with NAC in second place, having increased its fleet from 99 to 141.
Castlelake has reduced its exposure to this market over the past 12 months while Regional One’s fleet is now at 23 units.
Avmax, Falko and Avolon (which absorbed the 33 aircraft that CIT Aerospace had at this time last year), are other significant lessors in this segment.
TurbopropsTurboprops are a significant niche market, dominated by one lessor, Nordic Aviation Capital. However, other lessors have a presence, as shown in Figure 5, attracted by high yields.
The biggest increase in 2016/17 has come from Avmax, up from 57 to 87 aircraft, taking second place from Elix Aviation Capital. Truenoord Capital backed by its new investors, Blackrock and Aberdeen Asset Management may also be expected to increase its exposure.
ALC exited the market with the 25-aircraft portfolio sale to NAC last year. Among other sellers are ASL Aviation Group, which reduced its fleet by almost a third.
Figure 4: Top 10 lessors of regional jets
0
50
100
150
200
250
300
GE
CA
S
NA
C
AV
MA
X
FA
LKO
AV
OLO
N
VE
B L
EA
SIN
G
RE
GIO
NA
L O
NE
EC
C L
EA
SIN
G
BO
MB
AR
DIE
R C
AP
ITA
L
CD
B L
EA
SIN
G
SB
ER
BA
NK
LE
AS
ING
Source: Fleet Tracker
Figure 5: Top turboprop lessors
0
50
100
150
200
250
300
NA
C
AV
MA
X
ELI
X A
VIA
TIO
N C
AP
ITA
L
TR
AN
SP
OR
TA
TIO
N P
AR
TN
ER
S
DA
E C
AP
ITA
L
RO
CK
TO
N A
VIA
TIO
N
ER
IK T
HU
N
AS
L A
VIA
TIO
N G
RO
UP
JET
ST
RE
AM
AV
IAT
ION
CA
PIT
AL
Source: Airfiance Journal’s Fleet Tracker as of 31 August 2017
Leasing top 50
www.airfinancejournal.com 61
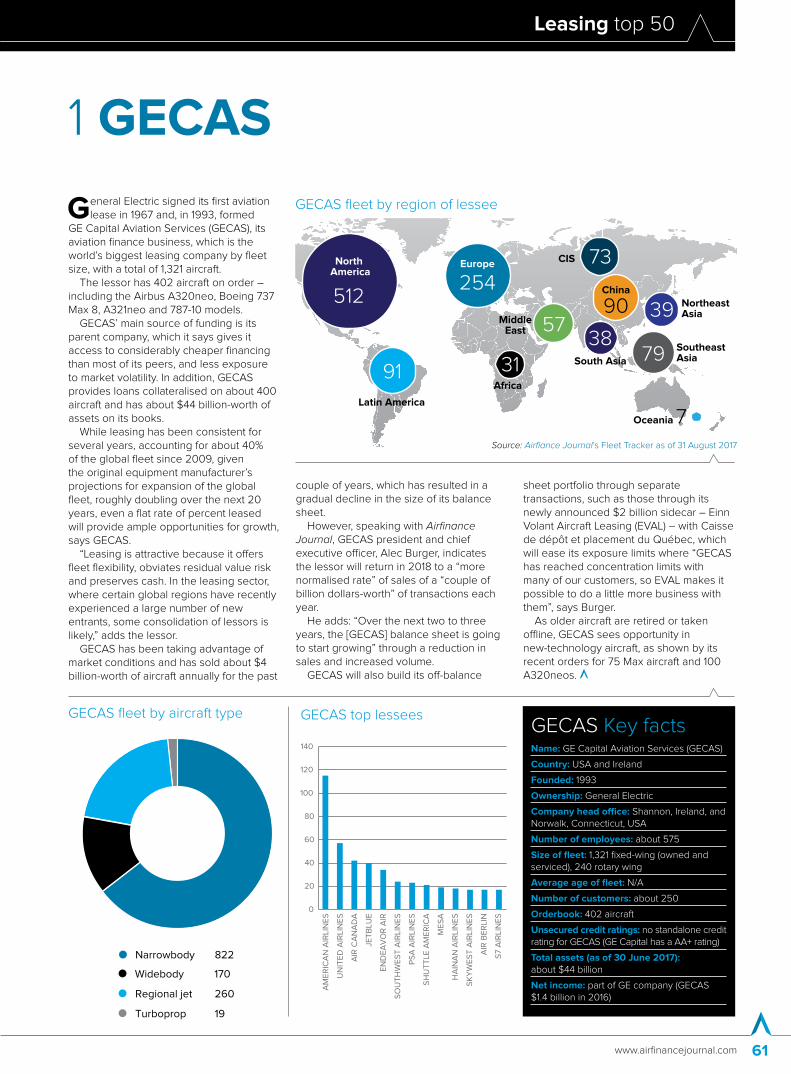
● Narrowbody 822
● Widebody 170
● Regional jet 260
● Turboprop 19
GECAS fleet by aircraft type
General Electric signed its first aviation lease in 1967 and, in 1993, formed
GE Capital Aviation Services (GECAS), its aviation finance business, which is the world’s biggest leasing company by fleet size, with a total of 1,321 aircraft.
The lessor has 402 aircraft on order – including the Airbus A320neo, Boeing 737 Max 8, A321neo and 787-10 models.
GECAS’ main source of funding is its parent company, which it says gives it access to considerably cheaper financing than most of its peers, and less exposure to market volatility. In addition, GECAS provides loans collateralised on about 400 aircraft and has about $44 billion-worth of assets on its books.
While leasing has been consistent for several years, accounting for about 40% of the global fleet since 2009, given the original equipment manufacturer’s projections for expansion of the global fleet, roughly doubling over the next 20 years, even a flat rate of percent leased will provide ample opportunities for growth, says GECAS.
“Leasing is attractive because it offers fleet flexibility, obviates residual value risk and preserves cash. In the leasing sector, where certain global regions have recently experienced a large number of new entrants, some consolidation of lessors is likely,” adds the lessor.
GECAS has been taking advantage of market conditions and has sold about $4 billion-worth of aircraft annually for the past
couple of years, which has resulted in a gradual decline in the size of its balance sheet.
However, speaking with Airfinance Journal, GECAS president and chief executive officer, Alec Burger, indicates the lessor will return in 2018 to a “more normalised rate” of sales of a “couple of billion dollars-worth” of transactions each year.
He adds: “Over the next two to three years, the [GECAS] balance sheet is going to start growing” through a reduction in sales and increased volume.
GECAS will also build its off-balance
sheet portfolio through separate transactions, such as those through its newly announced $2 billion sidecar – Einn Volant Aircraft Leasing (EVAL) – with Caisse de dépôt et placement du Québec, which will ease its exposure limits where “GECAS has reached concentration limits with many of our customers, so EVAL makes it possible to do a little more business with them”, says Burger.
As older aircraft are retired or taken offline, GECAS sees opportunity in new-technology aircraft, as shown by its recent orders for 75 Max aircraft and 100 A320neos.
1 GECAS
GECAS Key factsName: GE Capital Aviation Services (GECAS)
Country: USA and Ireland
Founded: 1993
Ownership: General Electric
Company head office: Shannon, Ireland, and Norwalk, Connecticut, USA
Number of employees: about 575
Size of fleet: 1,321 fixed-wing (owned and serviced), 240 rotary wing
Average age of fleet: N/A
Number of customers: about 250
Orderbook: 402 aircraft
Unsecured credit ratings: no standalone credit rating for GECAS (GE Capital has a AA+ rating)
Total assets (as of 30 June 2017): about $44 billion
Net income: part of GE company (GECAS $1.4 billion in 2016)
GECAS top lessees
AM
ER
ICA
N A
IRLI
NE
S
UN
ITE
D A
IRLI
NE
S
AIR
CA
NA
DA
JET
BLU
E
EN
DE
AV
OR
AIR
SO
UT
HW
ES
T A
IRLI
NE
S
PS
A A
IRLI
NE
S
SH
UT
TLE
AM
ER
ICA
ME
SA
HA
INA
N A
IRLI
NE
S
SK
YW
ES
T A
IRLI
NE
S
AIR
BE
RLI
N
S7 A
IRLI
NE
S
0
20
40
60
80
100
120
140
Europe
254 ●CIS
●Latin America●91
57●512●Northeast
Asia
South Asia●38
SoutheastAsia79
Oceania 7 ●
Africa
China
90
●39
31
73
MiddleEast
North America
GECAS fleet by region of lessee
Source: Airfiance Journal’s Fleet Tracker as of 31 August 2017
Leasing top 50
Airfinance Journal October/November 201762
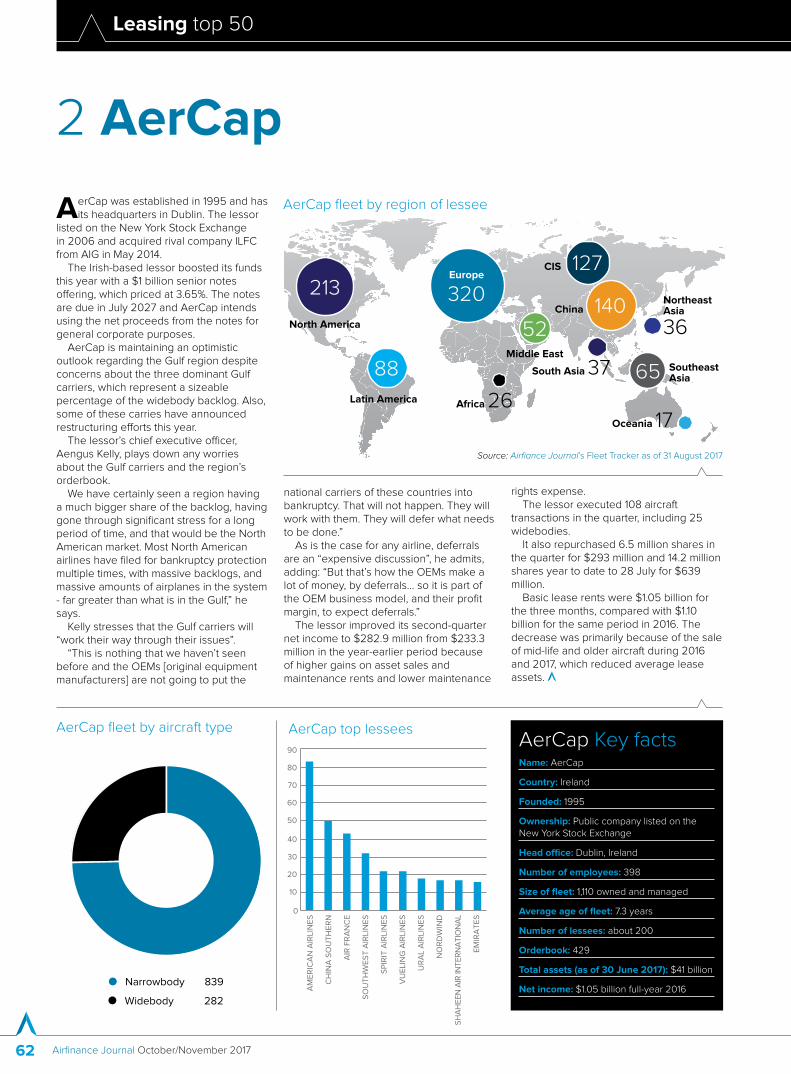
● Narrowbody 839
● Widebody 282
AerCap fleet by aircraft type
AerCap was established in 1995 and has its headquarters in Dublin. The lessor
listed on the New York Stock Exchange in 2006 and acquired rival company ILFC from AIG in May 2014.
The Irish-based lessor boosted its funds this year with a $1 billion senior notes offering, which priced at 3.65%. The notes are due in July 2027 and AerCap intends using the net proceeds from the notes for general corporate purposes.
AerCap is maintaining an optimistic outlook regarding the Gulf region despite concerns about the three dominant Gulf carriers, which represent a sizeable percentage of the widebody backlog. Also, some of these carries have announced restructuring efforts this year.
The lessor’s chief executive officer, Aengus Kelly, plays down any worries about the Gulf carriers and the region’s orderbook.
We have certainly seen a region having a much bigger share of the backlog, having gone through significant stress for a long period of time, and that would be the North American market. Most North American airlines have filed for bankruptcy protection multiple times, with massive backlogs, and massive amounts of airplanes in the system - far greater than what is in the Gulf,” he says.
Kelly stresses that the Gulf carriers will “work their way through their issues”.
“This is nothing that we haven’t seen before and the OEMs [original equipment manufacturers] are not going to put the
national carriers of these countries into bankruptcy. That will not happen. They will work with them. They will defer what needs to be done.”
As is the case for any airline, deferrals are an “expensive discussion”, he admits, adding: “But that’s how the OEMs make a lot of money, by deferrals... so it is part of the OEM business model, and their profit margin, to expect deferrals.”
The lessor improved its second-quarter net income to $282.9 million from $233.3 million in the year-earlier period because of higher gains on asset sales and maintenance rents and lower maintenance
rights expense.The lessor executed 108 aircraft
transactions in the quarter, including 25 widebodies.
It also repurchased 6.5 million shares in the quarter for $293 million and 14.2 million shares year to date to 28 July for $639 million.
Basic lease rents were $1.05 billion for the three months, compared with $1.10 billion for the same period in 2016. The decrease was primarily because of the sale of mid-life and older aircraft during 2016 and 2017, which reduced average lease assets.
2 AerCap
AerCap Key factsName: AerCap
Country: Ireland
Founded: 1995
Ownership: Public company listed on the New York Stock Exchange
Head office: Dublin, Ireland
Number of employees: 398
Size of fleet: 1,110 owned and managed
Average age of fleet: 7.3 years
Number of lessees: about 200
Orderbook: 429
Total assets (as of 30 June 2017): $41 billion
Net income: $1.05 billion full-year 2016
AerCap top lessees
AM
ER
ICA
N A
IRLI
NE
S
CH
INA
SO
UT
HE
RN
AIR
FR
AN
CE
SO
UT
HW
ES
T A
IRLI
NE
S
SP
IRIT
AIR
LIN
ES
VU
ELI
NG
AIR
LIN
ES
UR
AL
AIR
LIN
ES
NO
RD
WIN
D
SH
AH
EE
N A
IR IN
TE
RN
AT
ION
AL
EM
IRA
TE
S
0
10
20
30
40
50
60
70
80
90
Europe
320 ●●
Latin America
●88Middle East
52North America●213
●
Northeast Asia
36
South Asia 37●
SoutheastAsia65
Oceania 17 ●Africa 26
●
CIS 127
China 140
AerCap fleet by region of lessee
Source: Airfiance Journal’s Fleet Tracker as of 31 August 2017
Leasing top 50
www.airfinancejournal.com 63
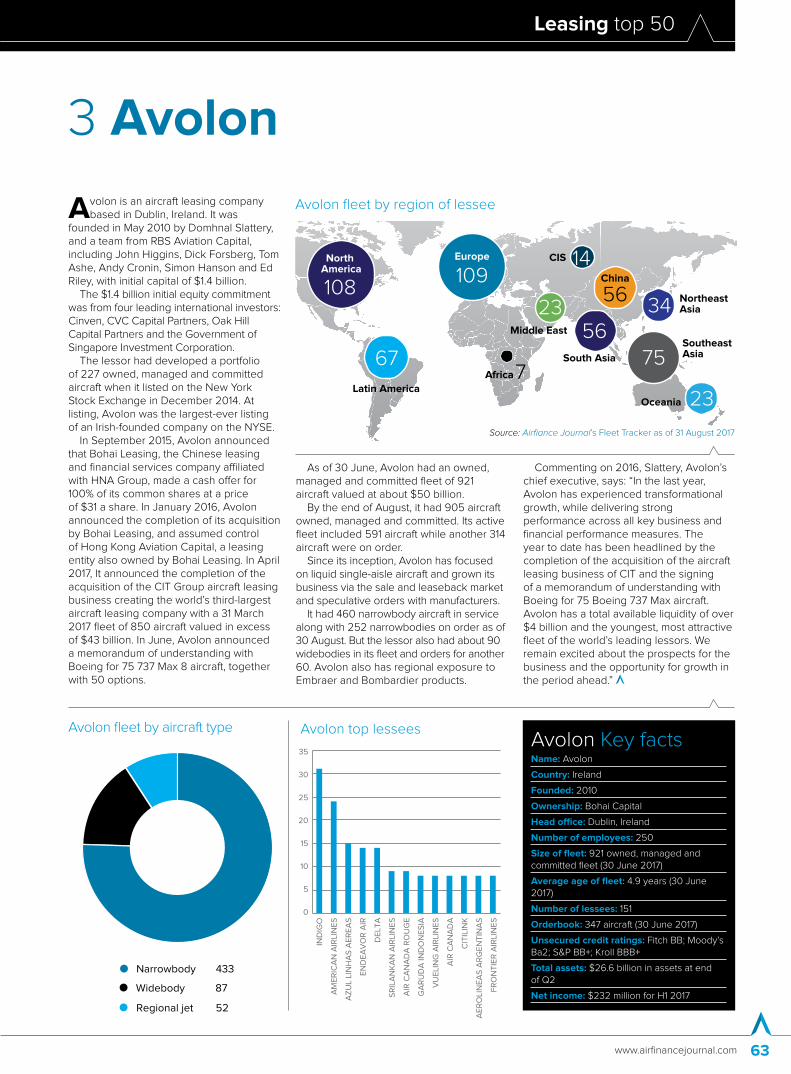
● Narrowbody 433
● Widebody 87
● Regional jet 52
Avolon fleet by aircraft type
Avolon is an aircraft leasing company based in Dublin, Ireland. It was
founded in May 2010 by Domhnal Slattery, and a team from RBS Aviation Capital, including John Higgins, Dick Forsberg, Tom Ashe, Andy Cronin, Simon Hanson and Ed Riley, with initial capital of $1.4 billion.
The $1.4 billion initial equity commitment was from four leading international investors: Cinven, CVC Capital Partners, Oak Hill Capital Partners and the Government of Singapore Investment Corporation.
The lessor had developed a portfolio of 227 owned, managed and committed aircraft when it listed on the New York Stock Exchange in December 2014. At listing, Avolon was the largest-ever listing of an Irish-founded company on the NYSE.
In September 2015, Avolon announced that Bohai Leasing, the Chinese leasing and financial services company affiliated with HNA Group, made a cash offer for 100% of its common shares at a price of $31 a share. In January 2016, Avolon announced the completion of its acquisition by Bohai Leasing, and assumed control of Hong Kong Aviation Capital, a leasing entity also owned by Bohai Leasing. In April 2017, It announced the completion of the acquisition of the CIT Group aircraft leasing business creating the world’s third-largest aircraft leasing company with a 31 March 2017 fleet of 850 aircraft valued in excess of $43 billion. In June, Avolon announced a memorandum of understanding with Boeing for 75 737 Max 8 aircraft, together with 50 options.
As of 30 June, Avolon had an owned, managed and committed fleet of 921 aircraft valued at about $50 billion.
By the end of August, it had 905 aircraft owned, managed and committed. Its active fleet included 591 aircraft while another 314 aircraft were on order.
Since its inception, Avolon has focused on liquid single-aisle aircraft and grown its business via the sale and leaseback market and speculative orders with manufacturers.
It had 460 narrowbody aircraft in service along with 252 narrowbodies on order as of 30 August. But the lessor also had about 90 widebodies in its fleet and orders for another 60. Avolon also has regional exposure to Embraer and Bombardier products.
Commenting on 2016, Slattery, Avolon’s chief executive, says: “In the last year, Avolon has experienced transformational growth, while delivering strong performance across all key business and financial performance measures. The year to date has been headlined by the completion of the acquisition of the aircraft leasing business of CIT and the signing of a memorandum of understanding with Boeing for 75 Boeing 737 Max aircraft. Avolon has a total available liquidity of over $4 billion and the youngest, most attractive fleet of the world’s leading lessors. We remain excited about the prospects for the business and the opportunity for growth in the period ahead.”
3 Avolon
Avolon Key factsName: Avolon
Country: Ireland
Founded: 2010
Ownership: Bohai Capital
Head office: Dublin, Ireland
Number of employees: 250
Size of fleet: 921 owned, managed and committed fleet (30 June 2017)
Average age of fleet: 4.9 years (30 June 2017)
Number of lessees: 151
Orderbook: 347 aircraft (30 June 2017)
Unsecured credit ratings: Fitch BB; Moody’s Ba2; S&P BB+; Kroll BBB+
Total assets: $26.6 billion in assets at end of Q2
Net income: $232 million for H1 2017
Avolon top lessees
IND
IGO
AM
ER
ICA
N A
IRLI
NE
S
AZ
UL
LIN
HA
S A
ER
EA
S
EN
DE
AV
OR
AIR
DE
LTA
SR
ILA
NK
AN
AIR
LIN
ES
AIR
CA
NA
DA
RO
UG
E
GA
RU
DA
IND
ON
ES
IA
VU
ELI
NG
AIR
LIN
ES
AIR
CA
NA
DA
CIT
ILIN
K
AE
RO
LIN
EA
S A
RG
EN
TIN
AS
FR
ON
TIE
R A
IRLI
NE
S
0
5
10
15
20
25
30
35
Europe
109 ●CIS
●
Latin America
●67
Middle East
23●108● Northeast
Asia
South Asia●56
SoutheastAsia75
●Africa
China
56
●
34
7
14North America
Oceania 23
Avolon fleet by region of lessee
Source: Airfiance Journal’s Fleet Tracker as of 31 August 2017

Leasing top 50
Airfinance Journal October/November 201764
● Narrowbody 395
● Widebody 38
● Regional jet 4
SMBC Aviation Capital fleet by aircraft type
Although most of its business is based out of Dublin, SMBC Aviation Capital
is owned and supported by a consortium of Japanese institutions: Sumitomo Mitsui Banking Corporation (SMBC), Sumitomo Mitsui Finance and Leasing Company Limited (SMFL) and Sumitomo Corporation.
Before January 2012, when the lessor was sold to Sumitomo Mitsui Financial Group for $7.6 billion, the company was known as RBS Aviation Capital and was owned by Royal Bank of Scotland Group.
SMBC Aviation Capital, which has been profitable for 15 consecutive years, has more than 160 staff working in Dublin, as well as in China, France, Hong Kong, Japan, the Netherlands, Singapore and the US.
Peter Barrett, the lessor’s chief executive officer, says: “It’s been a good year for SMBC Aviation Capital, one in which we recorded strong financial and operational growth, which is testament to the strength of our strategy of continued investment in liquid, new-technology aircraft, combined with trading through the cycle.”
In 2017, the Dublin-based lessor added the first Airbus A350 to its portfolio and secured a number of sale and leaseback transactions, building new customer relationships with airlines such as SAS, West Air and Philippine Airlines.
The company also experienced significant investor demand for its portfolio and sold 35 aircraft to 21 different investors, 18 of which were new customers, making 2017 one of the strongest years for the
lessor’s aircraft trading side of the business. These trades lowered SMBC’s average overall portfolio age to 4.5 years.
On top of this, the lessor closed the sale of $500 million principal amount of 3%, five-year senior unsecured notes due July 2022.
“Our orderbook consists of one of the most modern and technologically advanced fleets in the industry and our objective is to continue to build on our placement programme over the coming year,” says Barrett. “All of our orderbook aircraft are placed up to May 2019, and our focus during the current financial year will be on placing aircraft to 2020 and beyond.
“We are also future proofing our business by continuing to trade our portfolio so that we can have the youngest fleet in the industry. We sold 35 aircraft during the year, with an average age of 9.8 years, and so we are well on our way to achieving this goal.”
Barrett is optimistic about the health of the leasing industry, as well his lessor’s performance.
“It is a competitive market and we are at a strong part of the industry cycle,” he says, “but the performance of the core business is good. We remain confident in the outlook for the business especially in growth markets like Asia and South America.”
4 SMBC Aviation Capital
SMBC Aviation Capital Key factsName: SMBC Aviation Capital
Country: Ireland
Founded: 2001
Ownership: SMBC, SMFL and Sumitomo Corporation
Head office: IFSC House, Dublin, Ireland
Number of employees: 175
Size of fleet: 670
Average age of fleet: 4.5 years
Number of lessees: 150-plus customers in more than 50 countries
Orderbook: 110 Airbus and 90 Boeing 737 Max
Unsecured credit ratings: Fitch and S&P A-/BBB+
Total assets (owned and managed): $16 billion at 31 March 2017
Net income: Total revenue of $1.162 billion. Operating profit up 25% to $661 million
SMBC Aviation Capital top lessees
CO
PA
TU
RK
ISH
AIR
LIN
ES
VO
LAR
IS
BR
ITIS
H A
IRW
AY
S
LUF
TH
AN
SA
JEJU
AIR
QA
NT
AS
AE
RO
FLO
T
AM
ER
ICA
N A
IRLI
NE
S
ET
IHA
D A
IRW
AY
S
GO
L T
RA
NS
PO
RT
ES
AE
RE
OS
0
2
4
6
8
10
12
14
16
Europe
138
●●
Latin America
●64
20North America●30
●Northeast Asia
South Asia●12
SoutheastAsia35
Oceania
Africa
China
28
●54
4
29
MiddleEast
23
CIS
SMBC Aviation Capital fleet by region of lessee
Source: Airfiance Journal’s Fleet Tracker as of 31 August 2017
Leasing top 50
www.airfinancejournal.com 65
● Narrowbody 8
● Regional jet 149
● Turboprop 247
NAC fleet by aircraft type
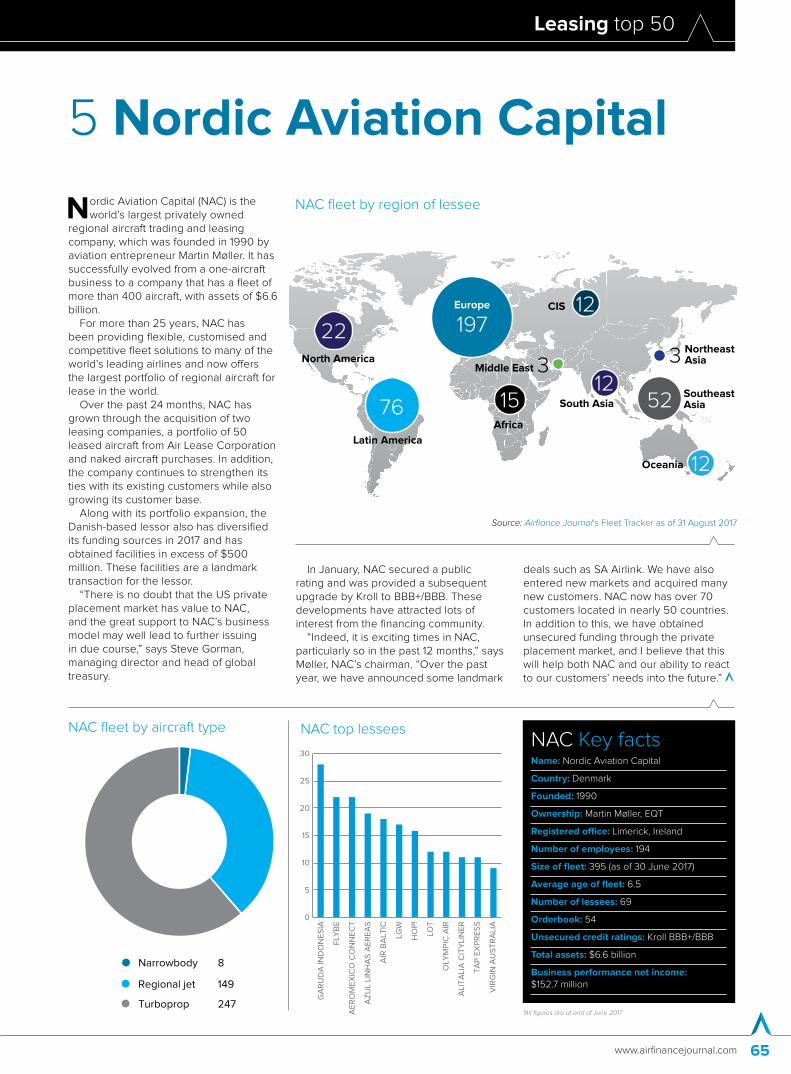
Nordic Aviation Capital (NAC) is the world’s largest privately owned
regional aircraft trading and leasing company, which was founded in 1990 by aviation entrepreneur Martin Møller. It has successfully evolved from a one-aircraft business to a company that has a fleet of more than 400 aircraft, with assets of $6.6 billion.
For more than 25 years, NAC has been providing flexible, customised and competitive fleet solutions to many of the world’s leading airlines and now offers the largest portfolio of regional aircraft for lease in the world.
Over the past 24 months, NAC has grown through the acquisition of two leasing companies, a portfolio of 50 leased aircraft from Air Lease Corporation and naked aircraft purchases. In addition, the company continues to strengthen its ties with its existing customers while also growing its customer base.
Along with its portfolio expansion, the Danish-based lessor also has diversified its funding sources in 2017 and has obtained facilities in excess of $500 million. These facilities are a landmark transaction for the lessor.
“There is no doubt that the US private placement market has value to NAC, and the great support to NAC’s business model may well lead to further issuing in due course,” says Steve Gorman, managing director and head of global treasury.
In January, NAC secured a public rating and was provided a subsequent upgrade by Kroll to BBB+/BBB. These developments have attracted lots of interest from the financing community.
“Indeed, it is exciting times in NAC, particularly so in the past 12 months,” says Møller, NAC’s chairman. “Over the past year, we have announced some landmark
deals such as SA Airlink. We have also entered new markets and acquired many new customers. NAC now has over 70 customers located in nearly 50 countries. In addition to this, we have obtained unsecured funding through the private placement market, and I believe that this will help both NAC and our ability to react to our customers’ needs into the future.”
5 Nordic Aviation Capital
NAC Key factsName: Nordic Aviation Capital
Country: Denmark
Founded: 1990
Ownership: Martin Møller, EQT
Registered office: Limerick, Ireland
Number of employees: 194
Size of fleet: 395 (as of 30 June 2017)
Average age of fleet: 6.5
Number of lessees: 69
Orderbook: 54
Unsecured credit ratings: Kroll BBB+/BBB
Total assets: $6.6 billion
Business performance net income: $152.7 million
NAC top lessees
0
5
10
15
20
25
30
GA
RU
DA
IND
ON
ES
IA
FLY
BE
AE
RO
ME
XIC
O C
ON
NE
CT
AZ
UL
LIN
HA
S A
ER
EA
S
AIR
BA
LTIC
LGW
HO
P!
LOT
OLY
MP
IC A
IR
ALI
TA
LIA
CIT
YLI
NE
R
TA
P E
XP
RE
SS
VIR
GIN
AU
ST
RA
LIA
Europe
197CIS
●Latin America●76
3North America●22
Northeast Asia
South Asia●12 Southeast
Asia52
Oceania
Africa
3
15
Middle East
●12
●12
NAC fleet by region of lessee
*All figures are at end of June 2017
Source: Airfiance Journal’s Fleet Tracker as of 31 August 2017

Leasing top 50
Airfinance Journal October/November 201766
● Narrowbody 299
● Widebody 103
● Regional jet 2
BBAM fleet by aircraft type
BBAM is the largest independent aircraft manager with 402 aircraft under
its management. It is a privately held company.
As of 15 September, BBAM is owned 50% by the private equity firm Onex and 50% by its management. On the consummation of a publicly announced transaction under which the sovereign wealth fund GIC will acquire 30% of BBAM, the company will be owned 35% by Onex, 35% by its management and 30% by GIC.
BBAM sources and remarkets aircraft for FLY Leasing and Nomura Babcock & Brown. Alongside Nomura Babcock & Brown, BBAM has become the largest arranger of Japanese equity capital to the airline industry, having financed more than 300 aircraft with Japanese operating lease deals.
BBAM manages the 83-aircraft fleet of FLY Leasing, the NYSE-traded public company, and owns about 14% of the lessor’s stock.
Over the past few years, BBAM has helped FLY Leasing to transform its fleet from an average age of eight years in the second quarter of 2015 to an average age of 6.1 years in the second quarter of 2017.
FLY Leasing ended the second quarter of 2017 with $335 million of unrestricted cash, and more than $500 million of unencumbered aircraft, which it will use to continue growing its fleet. Its aircraft acquisition target for 2017 is $750 million, of which $459 million had been allocated at the end of the second quarter.
FLY recently acquired two new Boeing 737 Max 8 aircraft and a new 787 Dreamliner in sale and leaseback deals.BBAM’s three-largest lessees by value of
aircraft include: Emirates (with an estimated $3.38 billion of aircraft on lease), British Airways, $1.75 billion, and Cathay Pacific Airways, $1.20 billion.
6 BBAM
BBAM Key factsName: BBAM
Country: USA
Founded: 1991
Ownership: ONEX 50%, BBAM 50% (as at 15th September 2017, see note)
Head office: San Francisco
Number of Employees: 120
Size of fleet: 402 (managed)
Average age of fleet: 7.5
Number of lessees: 105
Order book: 0
Delivery commitments: N/A
Net income (as of 30 June 2016): N/A
BBAM top lessees
BR
ITIS
H A
IRW
AY
S
EM
IRA
TE
S
TU
RK
ISH
AIR
LIN
ES
TH
OM
SO
N A
IRW
AY
S
MA
LAY
SIA
AIR
LIN
ES
DE
LTA
CH
INA
SO
UT
HE
RN
EA
SY
JET
CH
INA
EA
ST
ER
N
TA
M
CA
TH
AY
PA
CIF
IC A
IRW
AY
S
AIR
IND
IA
0
5
10
15
20
25
Europe
173
●CIS
●
Latin America
●30
45
North America●29
● Northeast Asia
South Asia●21
SoutheastAsia40
Oceania 4 ●
Africa
China
42
●
12
4
4
MiddleEast
BBAM fleet by region of lessee
Source: Airfiance Journal’s Fleet Tracker as of 31 August 2017
Leasing top 50
www.airfinancejournal.com 67
● Narrowbody 219
● Widebody 52
● Turboprop 63
DAE fleet by aircraft type
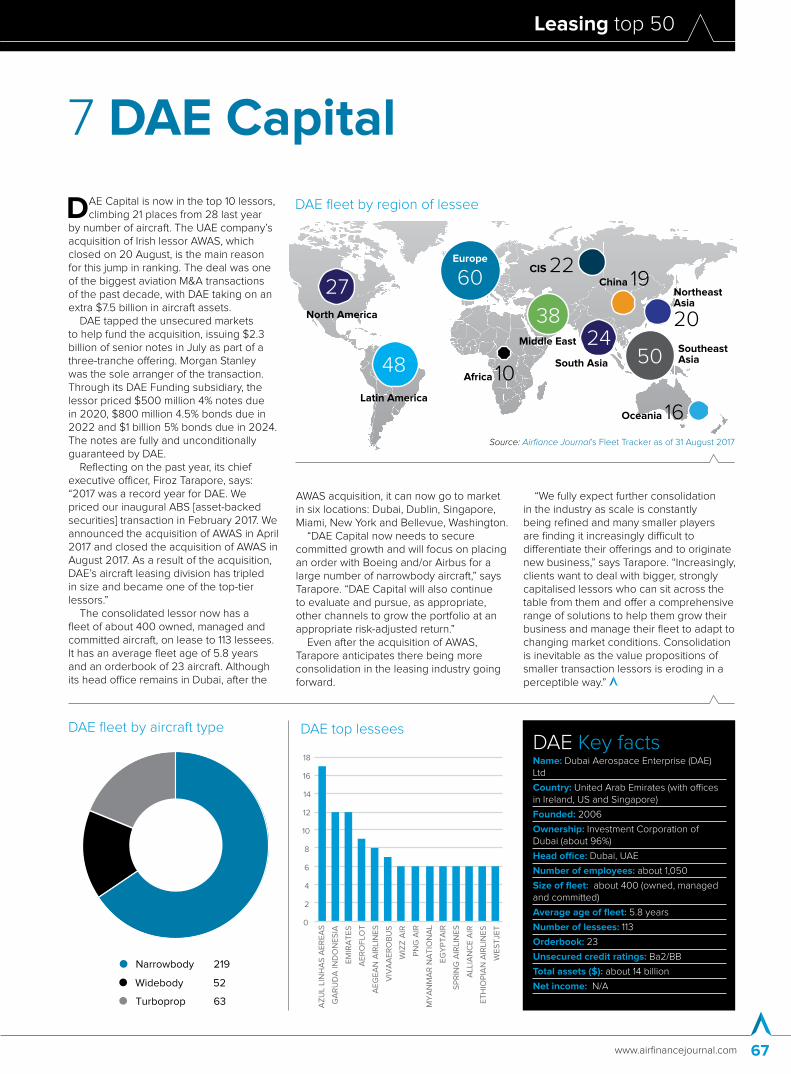
DAE Capital is now in the top 10 lessors, climbing 21 places from 28 last year
by number of aircraft. The UAE company’s acquisition of Irish lessor AWAS, which closed on 20 August, is the main reason for this jump in ranking. The deal was one of the biggest aviation M&A transactions of the past decade, with DAE taking on an extra $7.5 billion in aircraft assets.
DAE tapped the unsecured markets to help fund the acquisition, issuing $2.3 billion of senior notes in July as part of a three-tranche offering. Morgan Stanley was the sole arranger of the transaction. Through its DAE Funding subsidiary, the lessor priced $500 million 4% notes due in 2020, $800 million 4.5% bonds due in 2022 and $1 billion 5% bonds due in 2024. The notes are fully and unconditionally guaranteed by DAE.
Reflecting on the past year, its chief executive officer, Firoz Tarapore, says: “2017 was a record year for DAE. We priced our inaugural ABS [asset-backed securities] transaction in February 2017. We announced the acquisition of AWAS in April 2017 and closed the acquisition of AWAS in August 2017. As a result of the acquisition, DAE’s aircraft leasing division has tripled in size and became one of the top-tier lessors.”
The consolidated lessor now has a fleet of about 400 owned, managed and committed aircraft, on lease to 113 lessees. It has an average fleet age of 5.8 years and an orderbook of 23 aircraft. Although its head office remains in Dubai, after the
AWAS acquisition, it can now go to market in six locations: Dubai, Dublin, Singapore, Miami, New York and Bellevue, Washington.
“DAE Capital now needs to secure committed growth and will focus on placing an order with Boeing and/or Airbus for a large number of narrowbody aircraft,” says Tarapore. “DAE Capital will also continue to evaluate and pursue, as appropriate, other channels to grow the portfolio at an appropriate risk-adjusted return.”
Even after the acquisition of AWAS, Tarapore anticipates there being more consolidation in the leasing industry going forward.
“We fully expect further consolidation in the industry as scale is constantly being refined and many smaller players are finding it increasingly difficult to differentiate their offerings and to originate new business,” says Tarapore. “Increasingly, clients want to deal with bigger, strongly capitalised lessors who can sit across the table from them and offer a comprehensive range of solutions to help them grow their business and manage their fleet to adapt to changing market conditions. Consolidation is inevitable as the value propositions of smaller transaction lessors is eroding in a perceptible way.”
7 DAE Capital
DAE Key factsName: Dubai Aerospace Enterprise (DAE) Ltd
Country: United Arab Emirates (with offices in Ireland, US and Singapore)
Founded: 2006
Ownership: Investment Corporation of Dubai (about 96%)
Head office: Dubai, UAE
Number of employees: about 1,050
Size of fleet: about 400 (owned, managed and committed)
Average age of fleet: 5.8 years
Number of lessees: 113
Orderbook: 23
Unsecured credit ratings: Ba2/BB
Total assets ($): about 14 billion
Net income: N/A
DAE top lessees
0
2
4
6
8
10
12
14
16
18
AZ
UL
LIN
HA
S A
ER
EA
S
GA
RU
DA
IND
ON
ES
IA
EM
IRA
TE
S
AE
RO
FLO
T
AE
GE
AN
AIR
LIN
ES
VIV
AA
ER
OB
US
WIZ
Z A
IR
PN
G A
IR
MY
AN
MA
R N
AT
ION
AL
EG
YP
TA
IR
SP
RIN
G A
IRLI
NE
S
ALL
IAN
CE
AIR
ET
HIO
PIA
N A
IRLI
NE
S
WE
ST
JET
Europe
60
Africa 10●
China 19
●
CIS 22●
Latin America
●48
Middle East
38North America
●27
●Northeast Asia
20
South Asia●24
SoutheastAsia50
Oceania 16●
DAE fleet by region of lessee
Source: Airfiance Journal’s Fleet Tracker as of 31 August 2017

Leasing top 50
Airfinance Journal October/November 201768
● Narrowbody 248
● Widebody 46
● Regional jet 5
BOC Aviation fleet by aircraft type
BOC Aviation has made significant headway since its 2016 initial public
offering (IPO) in Hong Kong. The IPO added $550 million of equity
to the Singapore-based lessor’s balance sheet, and the company posted a healthy net profit for the first half of 2017 of $240 million, increasing its profit from $212 million for the same period in 2016.
At the end of 2016, the company put this equity to work, executing some large transactions, including one with Air China for five widebodies. BOC Aviation also took delivery of its 500th Airbus and Boeing aircraft in April 2017 with the delivery of an Airbus A320 to China Eastern. In May, BOC Aviation passed the milestone of having a total of 700 commitments to both manufacturers, counting 500 aircraft “plus effectively 200 aircraft on order or committed purchase and leaseback”.
The lessor expects 2017 to be its “most active year ever”, with 78 aircraft scheduled for delivery.
“If you compare us with the IPO, we’ve grown the net book value of aircraft about 25%, so we’ve had significant growth over the last 12 months,” the company’s chief executive officer Robert Martin tells Airfinance Journal.
One of the few things holding back his company’s rapid growth is industry-
wide manufacturer delays. Late deliveries meant BOC Aviation’s balance sheet growth was close to a billion dollars less than expected in the first half.
“We’re always putting pressure on [them] but, at the end of the day, it’s up to the manufacturers to make sure their supply chain vendors are providing the
right equipment to the right quality. That’s what this comes down to,” says Martin.
He adds: “It’s not just Pratt & Whitney. We are also seeing some smaller delays with CFM engines as well, and I think the speed at which the manufacturers decide to increase their production, not all of the supply chain is keeping up with them.”
8 BOC Aviation
BOC Aviation Key factsName: BOC Aviation Limited
Country: Singapore
Founded: November 1993, as Singapore Aircraft Leasing Enterprise
Ownership: Public company listed on the Hong Kong Stock Exchange
Head office: Singapore
No of employees: 151 (as of 30 June 2017)
Size of fleet: 297 aircraft: 261 owned and 36 managed (as of 30 June 2017)
Average age of owned fleet: 3.1 years
Number of lessees: 75 airlines in 34 countries
Orderbook: 196 (as of 30 June 2017)
Delivery commitments: $9.1 billion from second half 2017
Unsecured credit rating: A- By Fitch and A- by S&P
Total assets (as of 30 June 2017): $14.4 billion
BOC Aviation top lessees
EV
A A
IR
SO
UT
HW
ES
T A
IRLI
NE
S
VIS
TA
RA
JET
ST
AR
AIR
WA
YS
VU
ELI
NG
AIR
LIN
ES
JET
AIR
WA
YS
CH
INA
EA
ST
ER
N
WE
ST
JET
AE
RO
FLO
T
LUC
KY
AIR
0
2
4
6
8
10
12
14
16
Europe
47 ●CIS
●
Latin America
●16Middle East12
●34
●Northeast Asia
South Asia●22
SoutheastAsia29
Africa
China
65
●
35
3
20North America
Oceania ●16
BOC Aviation fleet by region of lessee
Source: Airfiance Journal’s Fleet Tracker as of 31 August 2017

Leasing top 50
www.airfinancejournal.com 69
● Narrowbody 217
● Widebody 59
● Regional jet 2
ALC fleet by aircraft type
With its headquarters in Los Angeles, Air Lease (ALC) was founded by
aircraft leasing industry pioneer Steven Udvar-Hazy in 2010 and went public on the New York Stock Exchange in 2011.
After departing International Lease Finance (ILFC) in 2010, a company he founded in 1973, Hazy teamed up with his long-time ILFC colleague John Plueger to launch ALC.
They have worked together for more than 30 years, and continue their leadership at ALC with Plueger as chief executive officer and Hazy as executive chairman of the board.
ALC’s strategy since inception has been to own young aircraft on long-term leases with a diversified base of customers. As of 30 June 2017, ALC owned 240 aircraft with a weighted average age of 3.6 years and a weighted average remaining lease term of 6.9 years. The company manages an additional 48 aircraft and has rapidly grown its management business through various ventures, including Blackbird Capital and Thunderbolt.
ALC has a $28.5 billion orderbook of 373 aircraft with Boeing and Airbus that stands 90% placed through 2019 as of 30 June. As a result of ongoing customer demand for aircraft in its portfolio, the lessor topped up orders at the Paris air show earlier this year for an additional 26 aircraft.
The company says its strategy and key relationships have driven results that
continue to impress. As of fiscal year end 2016, the company’s revenues exceeded $1.4 billion, with net income of $375 million and pre-tax profit margins north of 40%.
ALC says its operating performance and growth is achieved within the financial targets it set from day one, including debt to equity of 2.5 times.
The company continues to be the highest standalone-rated aircraft lessor with a BBB rating from Standard & Poor’s and Fitch and an A- rating from Kroll. These
ratings have provided the lessor with ongoing access to the investment-grade capital markets.
In June 2017, ALC issued a 2.625% five-year bond to refinance a portion of the 5.625% five-year bond ALC issued in 2012 as an unrated company. As a result of refinancing this legacy debt – together with a ratings improvement and an overall healthy market – the company has driven its composite cost of funds down to about 3% as of 30 June.
9 Air Lease
ALC Key factsName: Air Lease
Country: USA
Founded: 2010
Ownership: Public company listed on the New York Stock Exchange
Head office: Los Angeles, CA, USA
Size of fleet: 240
Average age of fleet: 3.6 years
Number of lessees: 88 Airlines
Orderbook: 373 (as of 30 June 2017)
Delivery commitments: $28.5 billion
Unsecured credit ratings: S&P BBB; Fitch BBB; Kroll A-
Net income (at full-year 2016): $374.9 million
ALC top lessees
0
5
10
15
20
25
CH
INA
SO
UT
HE
RN
AIR
CH
INA
CH
INA
EA
ST
ER
N
KLM
AE
RO
LIN
EA
S A
RG
EN
TIN
AS
SR
ILA
NK
AN
AIR
LIN
ES
TH
OM
AS
CO
OK
AIR
LIN
ES
TR
AN
SA
VIA
AIR
AU
ST
RA
L
AIR
FR
AN
CE
SIC
HU
AN
AIR
LIN
ES
JIN
AIR
WO
W A
IR
Europe
75 ●CIS
●Latin America
●24
Middle East10North America
●16●
Northeast Asia
South Asia●14 Southeast
Asia16
Oceania 6●
Africa
China
62
●
25
15
15
ALC fleet by region of lessee
Source: Airfiance Journal’s Fleet Tracker as of 31 August 2017
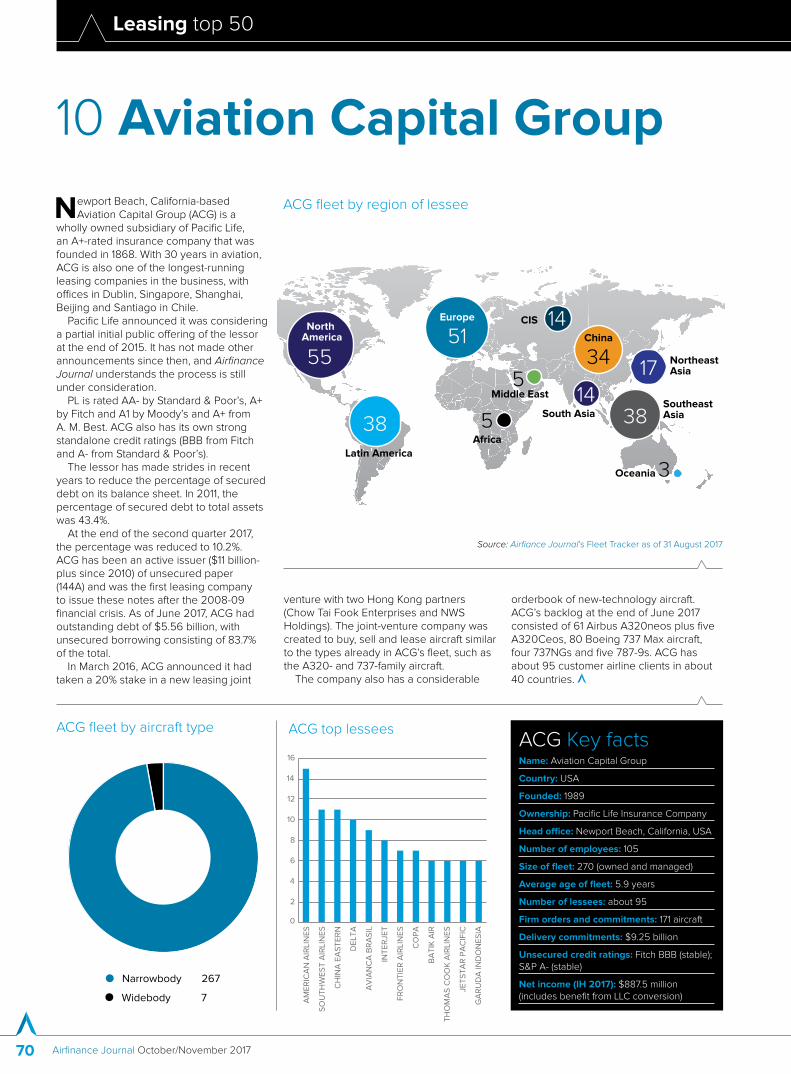
Leasing top 50
Airfinance Journal October/November 201770
● Narrowbody 267
● Widebody 7
ACG fleet by aircraft type
Newport Beach, California-based Aviation Capital Group (ACG) is a
wholly owned subsidiary of Pacific Life, an A+-rated insurance company that was founded in 1868. With 30 years in aviation, ACG is also one of the longest-running leasing companies in the business, with offices in Dublin, Singapore, Shanghai, Beijing and Santiago in Chile.
Pacific Life announced it was considering a partial initial public offering of the lessor at the end of 2015. It has not made other announcements since then, and Airfinance Journal understands the process is still under consideration.
PL is rated AA- by Standard & Poor’s, A+ by Fitch and A1 by Moody’s and A+ from A. M. Best. ACG also has its own strong standalone credit ratings (BBB from Fitch and A- from Standard & Poor’s).
The lessor has made strides in recent years to reduce the percentage of secured debt on its balance sheet. In 2011, the percentage of secured debt to total assets was 43.4%.
At the end of the second quarter 2017, the percentage was reduced to 10.2%. ACG has been an active issuer ($11 billion-plus since 2010) of unsecured paper (144A) and was the first leasing company to issue these notes after the 2008-09 financial crisis. As of June 2017, ACG had outstanding debt of $5.56 billion, with unsecured borrowing consisting of 83.7% of the total.
In March 2016, ACG announced it had taken a 20% stake in a new leasing joint
venture with two Hong Kong partners (Chow Tai Fook Enterprises and NWS Holdings). The joint-venture company was created to buy, sell and lease aircraft similar to the types already in ACG’s fleet, such as the A320- and 737-family aircraft.
The company also has a considerable
orderbook of new-technology aircraft. ACG’s backlog at the end of June 2017 consisted of 61 Airbus A320neos plus five A320Ceos, 80 Boeing 737 Max aircraft, four 737NGs and five 787-9s. ACG has about 95 customer airline clients in about 40 countries.
10 Aviation Capital Group
ACG Key factsName: Aviation Capital Group
Country: USA
Founded: 1989
Ownership: Pacific Life Insurance Company
Head office: Newport Beach, California, USA
Number of employees: 105
Size of fleet: 270 (owned and managed)
Average age of fleet: 5.9 years
Number of lessees: about 95
Firm orders and commitments: 171 aircraft
Delivery commitments: $9.25 billion
Unsecured credit ratings: Fitch BBB (stable); S&P A- (stable)
Net income (IH 2017): $887.5 million (includes benefit from LLC conversion)
ACG top lessees
AM
ER
ICA
N A
IRLI
NE
S
SO
UT
HW
ES
T A
IRLI
NE
S
CH
INA
EA
ST
ER
N
DE
LTA
AV
IAN
CA
BR
AS
IL
INT
ER
JET
FR
ON
TIE
R A
IRLI
NE
S
CO
PA
BA
TIK
AIR
TH
OM
AS
CO
OK
AIR
LIN
ES
JET
ST
AR
PA
CIF
IC
GA
RU
DA
IND
ON
ES
IA
0
2
4
6
8
10
12
14
16
Europe
51 ●CIS
Latin America●38
Middle East5●55 ●Northeast
Asia
South Asia●14 Southeast
Asia38
Oceania 3●
Africa
China
34
●17
5
14North America
ACG fleet by region of lessee
Source: Airfiance Journal’s Fleet Tracker as of 31 August 2017
More fl ights, more revenue. That’s great for business. Utilization defi ned.
More uptime,less downtime.
CFM International is a 50/50 joint company between GE and Safran Aircraft Engines
www.cfmaeroengines.com
C39298.015_CFM_UTILUPTIME_AirFinJnl_Aug17_285x210_v1.indd 1 11/08/2017 11:01