leasing top 50 2021 - airfinancejournal.com
TRANSCRIPT

News analysis
www.airfinancejournal.com 1
Leasing Top 50 2021
An Airfinance Journal
special supplement
Leasing top 50
Airfinance Journal November/December 20212
FOR MORE INFORMATION:Email: accountmanager@airfi nancejournal.comPhone: +44 (0) 20 7779 8203 (Asia) | +44 (0) 20 7779 8274 (Rest-of-the-World)
Your fast track to empowered decision making. WE HELP YOU NAVIGATE THE RAPID MARKET SHIFTS AND NEGOTIATE THE NEW AIRLINE LANDSCAPE.
The Airline Analyst provides unparalleled specialist and trusted intelligence to help you manage risk and identify opportunities in the airline sector. With decades of airline banking industry expertise, all types of companies involved in aviation fi nance rely on The Airline Analyst data.
And in the latest iteration of The Airline Analyst, we have created an API solution, fast-tracking the delivery of essential data right into your workfl ow.
THE AIRLINE ANALYST
Unparalleled fi nancial and performance data of 300 airlines at your fi ngertips. Learn more at https://www.airfi nancejournal.com/Home/TheAirlineAnalyst
provides unparalleled specialist and trusted
expertise, all types of companies involved in aviation fi nance rely
, we have created an API solution, fast-tracking the delivery of essential data right
Fast with DataAccess trusted data relied upon by the biggest names in the aviation market, freeing up your time for better analysis.
API for e� cient workfl owsPlug data via our easy-to-use API solution to fuel your models, and streamline and simplify your credit evaluation process.
Most comprehensive intelligence Specifi c ratio and derived metrics across 220 airlines (increasing shortly to 300+), provides clear, unbiased evidence of the fi nancial positions of even private airlines and airlines not available elsewhere.
Trusted experienceAll data goes through a rigorous maker-and-checker validation process to maintain data integrity
www.airfinancejournal.com 3
Editor’s letter
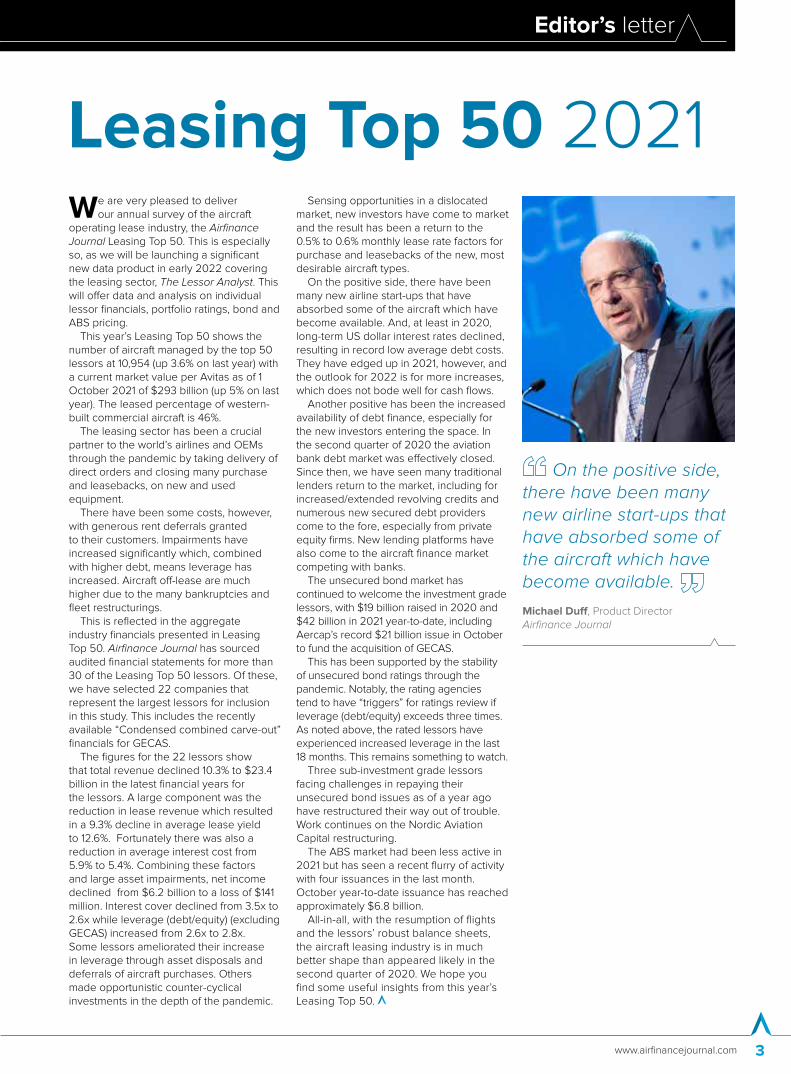
We are very pleased to deliver our annual survey of the aircraft
operating lease industry, the Airfinance Journal Leasing Top 50. This is especially so, as we will be launching a significant new data product in early 2022 covering the leasing sector, The Lessor Analyst. This will offer data and analysis on individual lessor financials, portfolio ratings, bond and ABS pricing.
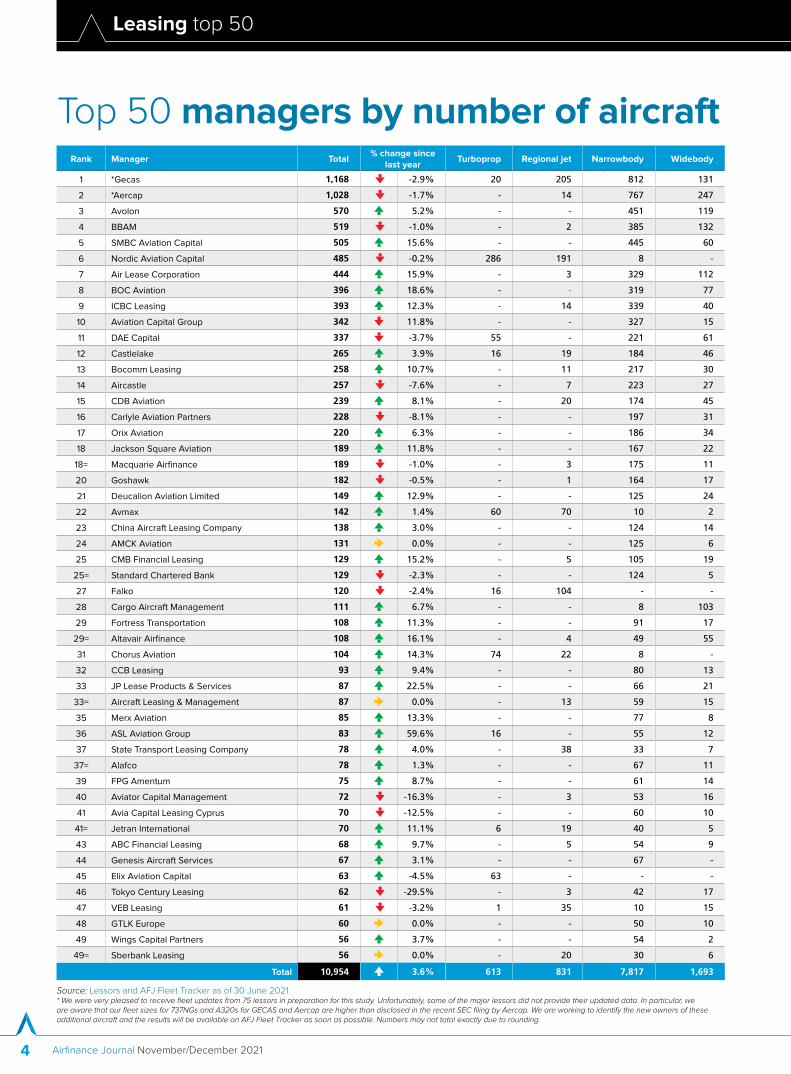
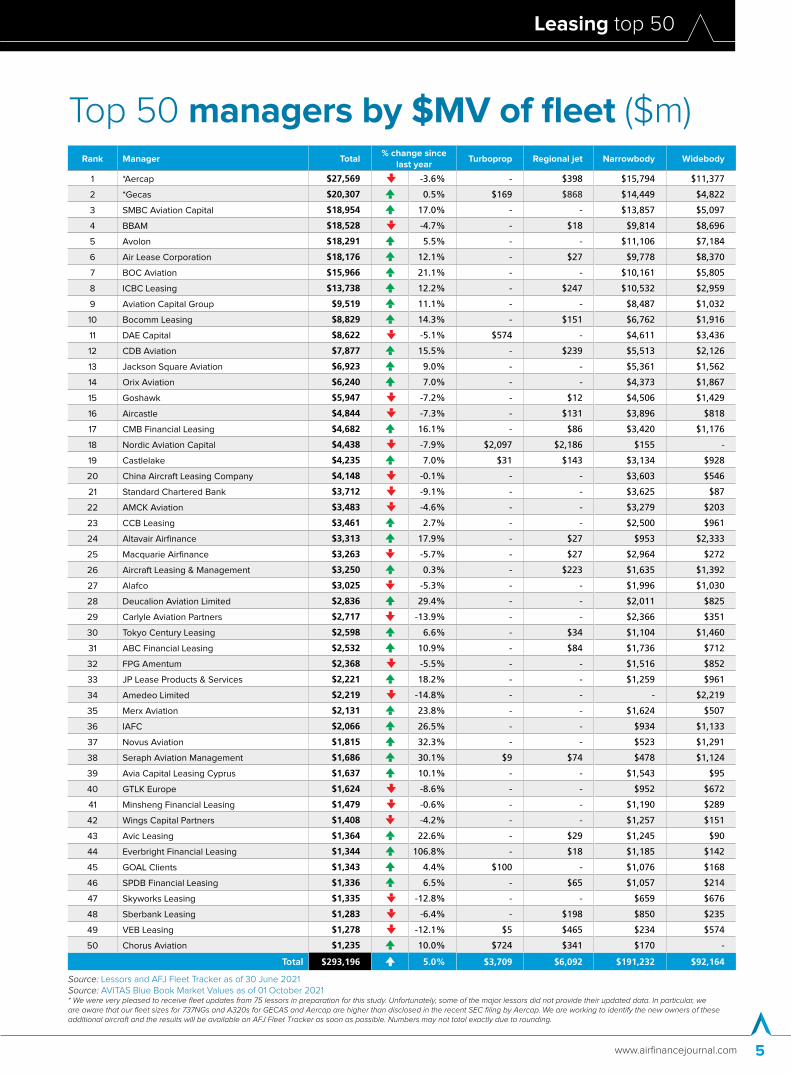
This year’s Leasing Top 50 shows the number of aircraft managed by the top 50 lessors at 10,954 (up 3.6% on last year) with a current market value per Avitas as of 1 October 2021 of $293 billion (up 5% on last year). The leased percentage of western-built commercial aircraft is 46%.
The leasing sector has been a crucial partner to the world’s airlines and OEMs through the pandemic by taking delivery of direct orders and closing many purchase and leasebacks, on new and used equipment.
There have been some costs, however, with generous rent deferrals granted to their customers. Impairments have increased significantly which, combined with higher debt, means leverage has increased. Aircraft off-lease are much higher due to the many bankruptcies and fleet restructurings.
This is reflected in the aggregate industry financials presented in Leasing Top 50. Airfinance Journal has sourced audited financial statements for more than 30 of the Leasing Top 50 lessors. Of these, we have selected 22 companies that represent the largest lessors for inclusion in this study. This includes the recently available “Condensed combined carve-out” financials for GECAS.
The figures for the 22 lessors show that total revenue declined 10.3% to $23.4 billion in the latest financial years for the lessors. A large component was the reduction in lease revenue which resulted in a 9.3% decline in average lease yield to 12.6%. Fortunately there was also a reduction in average interest cost from 5.9% to 5.4%. Combining these factors and large asset impairments, net income declined from $6.2 billion to a loss of $141 million. Interest cover declined from 3.5x to 2.6x while leverage (debt/equity) (excluding GECAS) increased from 2.6x to 2.8x. Some lessors ameliorated their increase in leverage through asset disposals and deferrals of aircraft purchases. Others made opportunistic counter-cyclical investments in the depth of the pandemic.
Sensing opportunities in a dislocated market, new investors have come to market and the result has been a return to the 0.5% to 0.6% monthly lease rate factors for purchase and leasebacks of the new, most desirable aircraft types.
On the positive side, there have been many new airline start-ups that have absorbed some of the aircraft which have become available. And, at least in 2020, long-term US dollar interest rates declined, resulting in record low average debt costs. They have edged up in 2021, however, and the outlook for 2022 is for more increases, which does not bode well for cash flows.
Another positive has been the increased availability of debt finance, especially for the new investors entering the space. In the second quarter of 2020 the aviation bank debt market was effectively closed. Since then, we have seen many traditional lenders return to the market, including for increased/extended revolving credits and numerous new secured debt providers come to the fore, especially from private equity firms. New lending platforms have also come to the aircraft finance market competing with banks.
The unsecured bond market has continued to welcome the investment grade lessors, with $19 billion raised in 2020 and $42 billion in 2021 year-to-date, including Aercap’s record $21 billion issue in October to fund the acquisition of GECAS.
This has been supported by the stability of unsecured bond ratings through the pandemic. Notably, the rating agencies tend to have “triggers” for ratings review if leverage (debt/equity) exceeds three times. As noted above, the rated lessors have experienced increased leverage in the last 18 months. This remains something to watch.
Three sub-investment grade lessors facing challenges in repaying their unsecured bond issues as of a year ago have restructured their way out of trouble. Work continues on the Nordic Aviation Capital restructuring.
The ABS market had been less active in 2021 but has seen a recent flurry of activity with four issuances in the last month. October year-to-date issuance has reached approximately $6.8 billion.
All-in-all, with the resumption of flights and the lessors’ robust balance sheets, the aircraft leasing industry is in much better shape than appeared likely in the second quarter of 2020. We hope you find some useful insights from this year’s Leasing Top 50.
Leasing Top 50 2021
On the positive side, there have been many new airline start-ups that have absorbed some of the aircraft which have become available.
Michael Duff, Product DirectorAirfinance Journal
FOR MORE INFORMATION:Email: accountmanager@airfi nancejournal.comPhone: +44 (0) 20 7779 8203 (Asia) | +44 (0) 20 7779 8274 (Rest-of-the-World)
Your fast track to empowered decision making. WE HELP YOU NAVIGATE THE RAPID MARKET SHIFTS AND NEGOTIATE THE NEW AIRLINE LANDSCAPE.
The Airline Analyst provides unparalleled specialist and trusted intelligence to help you manage risk and identify opportunities in the airline sector. With decades of airline banking industry expertise, all types of companies involved in aviation fi nance rely on The Airline Analyst data.
And in the latest iteration of The Airline Analyst, we have created an API solution, fast-tracking the delivery of essential data right into your workfl ow.
THE AIRLINE ANALYST
Unparalleled fi nancial and performance data of 300 airlines at your fi ngertips. Learn more at https://www.airfi nancejournal.com/Home/TheAirlineAnalyst
provides unparalleled specialist and trusted
expertise, all types of companies involved in aviation fi nance rely
, we have created an API solution, fast-tracking the delivery of essential data right
Fast with DataAccess trusted data relied upon by the biggest names in the aviation market, freeing up your time for better analysis.
API for e� cient workfl owsPlug data via our easy-to-use API solution to fuel your models, and streamline and simplify your credit evaluation process.
Most comprehensive intelligence Specifi c ratio and derived metrics across 220 airlines (increasing shortly to 300+), provides clear, unbiased evidence of the fi nancial positions of even private airlines and airlines not available elsewhere.
Trusted experienceAll data goes through a rigorous maker-and-checker validation process to maintain data integrity
Leasing top 50
Airfinance Journal November/December 20214
Rank Manager Total % change since
last year Turboprop Regional jet Narrowbody Widebody
1 *Gecas 1,168 -2.9% 20 205 812 131
2 *Aercap 1,028 -1.7% - 14 767 247
3 Avolon 570 5.2% - - 451 119
4 BBAM 519 -1.0% - 2 385 132
5 SMBC Aviation Capital 505 15.6% - - 445 60
6 Nordic Aviation Capital 485 -0.2% 286 191 8 -
7 Air Lease Corporation 444 15.9% - 3 329 112
8 BOC Aviation 396 18.6% - - 319 77
9 ICBC Leasing 393 12.3% - 14 339 40
10 Aviation Capital Group 342 11.8% - - 327 15
11 DAE Capital 337 -3.7% 55 - 221 61
12 Castlelake 265 3.9% 16 19 184 46
13 Bocomm Leasing 258 10.7% - 11 217 30
14 Aircastle 257 -7.6% - 7 223 27
15 CDB Aviation 239 8.1% - 20 174 45
16 Carlyle Aviation Partners 228 -8.1% - - 197 31
17 Orix Aviation 220 6.3% - - 186 34
18 Jackson Square Aviation 189 11.8% - - 167 22
18= Macquarie Airfinance 189 -1.0% - 3 175 11
20 Goshawk 182 -0.5% - 1 164 17
21 Deucalion Aviation Limited 149 12.9% - - 125 24
22 Avmax 142 1.4% 60 70 10 2
23 China Aircraft Leasing Company 138 3.0% - - 124 14
24 AMCK Aviation 131 0.0% - - 125 6
25 CMB Financial Leasing 129 15.2% - 5 105 19
25= Standard Chartered Bank 129 -2.3% - - 124 5
27 Falko 120 -2.4% 16 104 - -
28 Cargo Aircraft Management 111 6.7% - - 8 103
29 Fortress Transportation 108 11.3% - - 91 17
29= Altavair Airfinance 108 16.1% - 4 49 55
31 Chorus Aviation 104 14.3% 74 22 8 -
32 CCB Leasing 93 9.4% - - 80 13
33 JP Lease Products & Services 87 22.5% - - 66 21
33= Aircraft Leasing & Management 87 0.0% - 13 59 15
35 Merx Aviation 85 13.3% - - 77 8
36 ASL Aviation Group 83 59.6% 16 - 55 12
37 State Transport Leasing Company 78 4.0% - 38 33 7
37= Alafco 78 1.3% - - 67 11
39 FPG Amentum 75 8.7% - - 61 14
40 Aviator Capital Management 72 -16.3% - 3 53 16
41 Avia Capital Leasing Cyprus 70 -12.5% - - 60 10
41= Jetran International 70 11.1% 6 19 40 5
43 ABC Financial Leasing 68 9.7% - 5 54 9
44 Genesis Aircraft Services 67 3.1% - - 67 -
45 Elix Aviation Capital 63 -4.5% 63 - - -
46 Tokyo Century Leasing 62 -29.5% - 3 42 17
47 VEB Leasing 61 -3.2% 1 35 10 15
48 GTLK Europe 60 0.0% - - 50 10
49 Wings Capital Partners 56 3.7% - - 54 2
49= Sberbank Leasing 56 0.0% - 20 30 6
Total 10,954 3.6% 613 831 7,817 1,693
Top 50 managers by number of aircraft
Source: Lessors and AFJ Fleet Tracker as of 30 June 2021* We were very pleased to receive fleet updates from 75 lessors in preparation for this study. Unfortunately, some of the major lessors did not provide their updated data. In particular, we are aware that our fleet sizes for 737NGs and A320s for GECAS and Aercap are higher than disclosed in the recent SEC filing by Aercap. We are working to identify the new owners of these additional aircraft and the results will be available on AFJ Fleet Tracker as soon as possible. Numbers may not total exactly due to rounding.
Leasing top 50
www.airfinancejournal.com 5
Rank Manager Total % change since
last year Turboprop Regional jet Narrowbody Widebody
1 *Aercap $27,569 -3.6% - $398 $15,794 $11,377
2 *Gecas $20,307 0.5% $169 $868 $14,449 $4,822
3 SMBC Aviation Capital $18,954 17.0% - - $13,857 $5,097
4 BBAM $18,528 -4.7% - $18 $9,814 $8,696
5 Avolon $18,291 5.5% - - $11,106 $7,184
6 Air Lease Corporation $18,176 12.1% - $27 $9,778 $8,370
7 BOC Aviation $15,966 21.1% - - $10,161 $5,805
8 ICBC Leasing $13,738 12.2% - $247 $10,532 $2,959
9 Aviation Capital Group $9,519 11.1% - - $8,487 $1,032
10 Bocomm Leasing $8,829 14.3% - $151 $6,762 $1,916
11 DAE Capital $8,622 -5.1% $574 - $4,611 $3,436
12 CDB Aviation $7,877 15.5% - $239 $5,513 $2,126
13 Jackson Square Aviation $6,923 9.0% - - $5,361 $1,562
14 Orix Aviation $6,240 7.0% - - $4,373 $1,867
15 Goshawk $5,947 -7.2% - $12 $4,506 $1,429
16 Aircastle $4,844 -7.3% - $131 $3,896 $818
17 CMB Financial Leasing $4,682 16.1% - $86 $3,420 $1,176
18 Nordic Aviation Capital $4,438 -7.9% $2,097 $2,186 $155 -
19 Castlelake $4,235 7.0% $31 $143 $3,134 $928
20 China Aircraft Leasing Company $4,148 -0.1% - - $3,603 $546
21 Standard Chartered Bank $3,712 -9.1% - - $3,625 $87
22 AMCK Aviation $3,483 -4.6% - - $3,279 $203
23 CCB Leasing $3,461 2.7% - - $2,500 $961
24 Altavair Airfinance $3,313 17.9% - $27 $953 $2,333
25 Macquarie Airfinance $3,263 -5.7% - $27 $2,964 $272
26 Aircraft Leasing & Management $3,250 0.3% - $223 $1,635 $1,392
27 Alafco $3,025 -5.3% - - $1,996 $1,030
28 Deucalion Aviation Limited $2,836 29.4% - - $2,011 $825
29 Carlyle Aviation Partners $2,717 -13.9% - - $2,366 $351
30 Tokyo Century Leasing $2,598 6.6% - $34 $1,104 $1,460
31 ABC Financial Leasing $2,532 10.9% - $84 $1,736 $712
32 FPG Amentum $2,368 -5.5% - - $1,516 $852
33 JP Lease Products & Services $2,221 18.2% - - $1,259 $961
34 Amedeo Limited $2,219 -14.8% - - - $2,219
35 Merx Aviation $2,131 23.8% - - $1,624 $507
36 IAFC $2,066 26.5% - - $934 $1,133
37 Novus Aviation $1,815 32.3% - - $523 $1,291
38 Seraph Aviation Management $1,686 30.1% $9 $74 $478 $1,124
39 Avia Capital Leasing Cyprus $1,637 10.1% - - $1,543 $95
40 GTLK Europe $1,624 -8.6% - - $952 $672
41 Minsheng Financial Leasing $1,479 -0.6% - - $1,190 $289
42 Wings Capital Partners $1,408 -4.2% - - $1,257 $151
43 Avic Leasing $1,364 22.6% - $29 $1,245 $90
44 Everbright Financial Leasing $1,344 106.8% - $18 $1,185 $142
45 GOAL Clients $1,343 4.4% $100 - $1,076 $168
46 SPDB Financial Leasing $1,336 6.5% - $65 $1,057 $214
47 Skyworks Leasing $1,335 -12.8% - - $659 $676
48 Sberbank Leasing $1,283 -6.4% - $198 $850 $235
49 VEB Leasing $1,278 -12.1% $5 $465 $234 $574
50 Chorus Aviation $1,235 10.0% $724 $341 $170 -
Total $293,196 5.0% $3,709 $6,092 $191,232 $92,164
Top 50 managers by $MV of fleet ($m)
Source: Lessors and AFJ Fleet Tracker as of 30 June 2021Source: AVITAS Blue Book Market Values as of 01 October 2021* We were very pleased to receive fleet updates from 75 lessors in preparation for this study. Unfortunately, some of the major lessors did not provide their updated data. In particular, we are aware that our fleet sizes for 737NGs and A320s for GECAS and Aercap are higher than disclosed in the recent SEC filing by Aercap. We are working to identify the new owners of these additional aircraft and the results will be available on AFJ Fleet Tracker as soon as possible. Numbers may not total exactly due to rounding.

Leasing top 50
Airfinance Journal November/December 20216
Rank Beneficial Owner Total Turboprop Regional jet Narrowbody Widebody
1 *Gecas 1,043 17 118 793 115
2 *Aercap 992 - 14 727 251
3 Avolon 524 - - 411 113
4 Nordic Aviation Capital 485 286 191 8 -
5 ICBC Leasing 403 - 14 349 40
6 BOC Aviation 377 - - 299 78
7 Air Lease Corporation 355 - 2 252 101
8 SMBC Aviation Capital 328 - - 307 21
9 Aviation Capital Group 295 - - 284 11
10 DAE Capital 282 53 - 174 55
11 Castlelake 280 10 21 199 50
12 Aircastle 255 - 7 221 27
13 CDB Aviation 238 - 20 175 43
14 Carlyle Aviation Partners 228 - - 197 31
15 Bocomm Leasing 220 - 7 189 24
16 NBB Leasing Clients 215 - - 130 85
17 Macquarie Airfinance 189 - 3 175 11
18 Jackson Square Aviation 188 - - 168 20
19 Goshawk 162 - - 148 14
20 Avmax 139 59 68 10 2
21 AMCK Aviation 130 - - 124 6
22 China Aircraft Leasing Company 112 - - 100 12
23 Cargo Aircraft Management 111 - - 8 103
24 Standard Chartered Bank 110 - - 105 5
25 JP Lease Products & Services 106 - - 78 28
26 Chorus Aviation 104 74 22 8 -
27 Regional One 98 16 82 - -
28 Falko 96 16 80 - -
29 KKR Aviation Funds 92 - 4 40 48
30 CCB Leasing 89 - - 77 12
30= Fortress Transportation 89 - - 72 17
32 CMB Financial Leasing 81 - - 75 6
33 Fly Leasing 79 - - 70 9
34 State Transport Leasing Company 78 - 38 33 7
34= Alafco 78 - - 67 11
36 Deucalion Aviation Funds 75 - - 59 16
37 Aviator Capital Management 72 - 3 53 16
38 VTB Leasing 70 - - 60 10
38= Jetran International 70 6 19 40 5
40 Genesis Aircraft Services 67 - - 67 -
41 **Merx Aviation 66 - - 63 3
42 Elix Aviation Capital 63 63 - - -
43 Horizon Aviation 61 - - 61 -
44 VEB Leasing 59 1 35 8 15
45 Sberbank Leasing 56 - 20 30 6
46 IAFC 55 - - 30 25
47 Fuyo General Lease 54 - 5 44 5
48 GTLK Europe 53 - - 46 7
50 Truenoord 52 17 34 - 1
50= Incline Aviation 52 - - 45 7
Total 9,575 618 807 6,679 1,471
Top 50 beneficial owners by number of aircraft
Source: Lessors and AFJ Fleet Tracker as of 30 June 2021* We were very pleased to receive fleet updates from 75 lessors in preparation for this study. Unfortunately, some of the major lessors did not provide their updated data. In particular, we are aware that our fleet sizes for 737NGs and A320s for GECAS and Aercap are higher than disclosed in the recent SEC filing by Aercap. We are working to identify the new owners of these additional aircraft and the results will be available on AFJ Fleet Tracker as soon as possible.** Orix Aviation and Merx Aviation got credit for 50% each of the Kornerstone aircraft
Leasing top 50
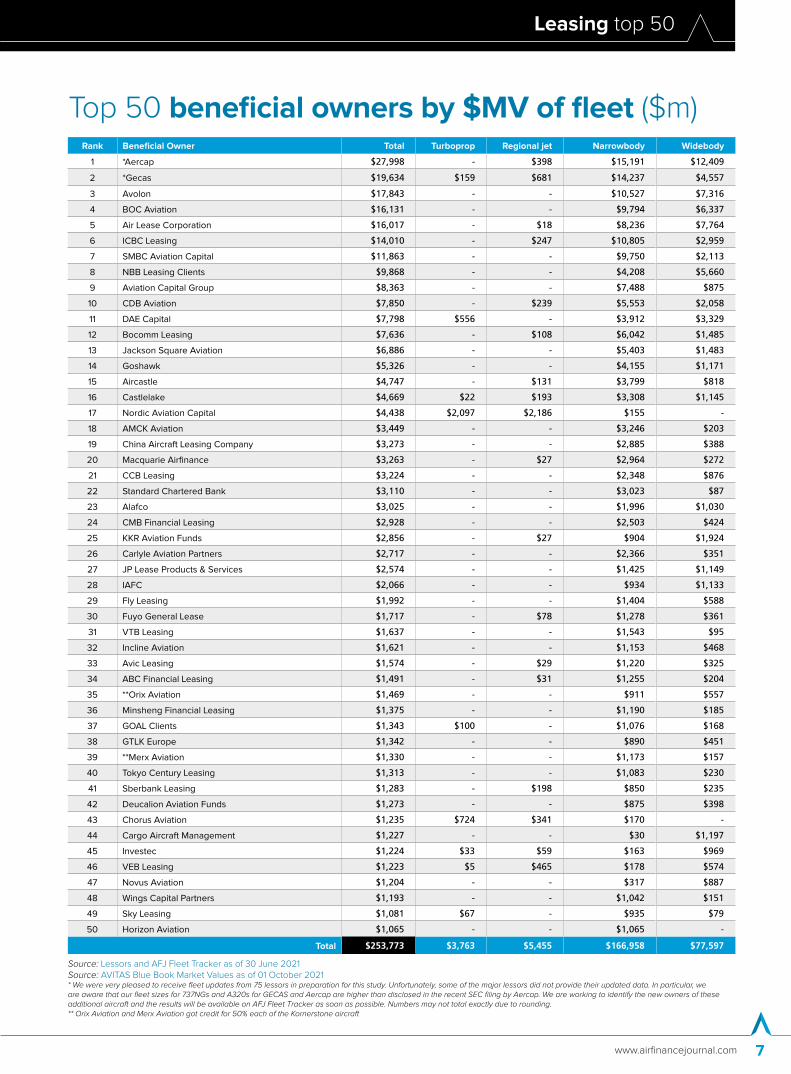
www.airfinancejournal.com 7
Source: Lessors and AFJ Fleet Tracker as of 30 June 2021Source: AVITAS Blue Book Market Values as of 01 October 2021* We were very pleased to receive fleet updates from 75 lessors in preparation for this study. Unfortunately, some of the major lessors did not provide their updated data. In particular, we are aware that our fleet sizes for 737NGs and A320s for GECAS and Aercap are higher than disclosed in the recent SEC filing by Aercap. We are working to identify the new owners of these additional aircraft and the results will be available on AFJ Fleet Tracker as soon as possible. Numbers may not total exactly due to rounding.** Orix Aviation and Merx Aviation got credit for 50% each of the Kornerstone aircraft
Rank Beneficial Owner Total Turboprop Regional jet Narrowbody Widebody
1 *Aercap $27,998 - $398 $15,191 $12,409
2 *Gecas $19,634 $159 $681 $14,237 $4,557
3 Avolon $17,843 - - $10,527 $7,316
4 BOC Aviation $16,131 - - $9,794 $6,337
5 Air Lease Corporation $16,017 - $18 $8,236 $7,764
6 ICBC Leasing $14,010 - $247 $10,805 $2,959
7 SMBC Aviation Capital $11,863 - - $9,750 $2,113
8 NBB Leasing Clients $9,868 - - $4,208 $5,660
9 Aviation Capital Group $8,363 - - $7,488 $875
10 CDB Aviation $7,850 - $239 $5,553 $2,058
11 DAE Capital $7,798 $556 - $3,912 $3,329
12 Bocomm Leasing $7,636 - $108 $6,042 $1,485
13 Jackson Square Aviation $6,886 - - $5,403 $1,483
14 Goshawk $5,326 - - $4,155 $1,171
15 Aircastle $4,747 - $131 $3,799 $818
16 Castlelake $4,669 $22 $193 $3,308 $1,145
17 Nordic Aviation Capital $4,438 $2,097 $2,186 $155 -
18 AMCK Aviation $3,449 - - $3,246 $203
19 China Aircraft Leasing Company $3,273 - - $2,885 $388
20 Macquarie Airfinance $3,263 - $27 $2,964 $272
21 CCB Leasing $3,224 - - $2,348 $876
22 Standard Chartered Bank $3,110 - - $3,023 $87
23 Alafco $3,025 - - $1,996 $1,030
24 CMB Financial Leasing $2,928 - - $2,503 $424
25 KKR Aviation Funds $2,856 - $27 $904 $1,924
26 Carlyle Aviation Partners $2,717 - - $2,366 $351
27 JP Lease Products & Services $2,574 - - $1,425 $1,149
28 IAFC $2,066 - - $934 $1,133
29 Fly Leasing $1,992 - - $1,404 $588
30 Fuyo General Lease $1,717 - $78 $1,278 $361
31 VTB Leasing $1,637 - - $1,543 $95
32 Incline Aviation $1,621 - - $1,153 $468
33 Avic Leasing $1,574 - $29 $1,220 $325
34 ABC Financial Leasing $1,491 - $31 $1,255 $204
35 **Orix Aviation $1,469 - - $911 $557
36 Minsheng Financial Leasing $1,375 - - $1,190 $185
37 GOAL Clients $1,343 $100 - $1,076 $168
38 GTLK Europe $1,342 - - $890 $451
39 **Merx Aviation $1,330 - - $1,173 $157
40 Tokyo Century Leasing $1,313 - - $1,083 $230
41 Sberbank Leasing $1,283 - $198 $850 $235
42 Deucalion Aviation Funds $1,273 - - $875 $398
43 Chorus Aviation $1,235 $724 $341 $170 -
44 Cargo Aircraft Management $1,227 - - $30 $1,197
45 Investec $1,224 $33 $59 $163 $969
46 VEB Leasing $1,223 $5 $465 $178 $574
47 Novus Aviation $1,204 - - $317 $887
48 Wings Capital Partners $1,193 - - $1,042 $151
49 Sky Leasing $1,081 $67 - $935 $79
50 Horizon Aviation $1,065 - - $1,065 -
Total $253,773 $3,763 $5,455 $166,958 $77,597
Top 50 beneficial owners by $MV of fleet ($m)

Leasing top 50
Airfinance Journal November/December 20218
Rank Beneficial Owner Total Turboprop *Regional Jet Narrowbody Widebody
1 Air Lease Corporation 340 - - 277 63
2 Aercap 275 - 36 218 21
3 China Aircraft Leasing Company 274 - 30 244 -
4 Avolon 239 - - 217 22
5 Gecas 235 - - 219 16
6 SMBC Aviation Capital 222 - - 222 -
7 Bocomm Leasing 136 - - 136 -
8 ICBC Leasing 119 - 53 66 -
9 BOC Aviation 113 - - 105 8
10 CDB Aviation 111 - - 111 -
11 Ilyushin Finance Corporation 93 - 27 65 1
12 Avia Capital Services 85 - - 85 -
13 Alafco 71 - - 70 1
14 Nordic Aviation Capital 68 48 - 20 -
15 Aviation Capital Group 59 - - 57 2
16 Macquarie Airfinance 51 - - 51 -
17 China Huarong Financial Leasing 50 - 20 30 -
18 ABC Financial Leasing 45 - - 45 -
19 Goshawk 40 - - 40 -
20 Timaero Ireland 35 - - 35 -
21 Everbright Financial Leasing 30 - - 30 -
22 VEB Leasing 27 - 2 25 -
23 Aircastle 24 - 24 - -
24 Jackson Square Aviation 23 - - 23 -
25 Accipiter 20 - - 20 -
25= Lease Corporation International 20 - - 20 -
27 777 Partners 19 - - 19 -
28 Sberbank Leasing 14 - - 14 -
28= State Transport Leasing Company 14 - 14 - -
28= DAE Capital 14 - - 14 -
31 Aerolease Aviation 10 - 10 - -
32 Hong Kong Int. Av. Leasing 6 - - - 6
32= Willis Lease Finance 6 - 6 - -
34 SPDB Financial Leasing 5 - - 5 -
34= CIB Leasing 5 - 5 - -
36 Middle East Leasing 4 - - 4 -
37 Acia Aero 3 3 - - -
37= Minsheng Financial Leasing 3 - 3 - -
37= CIAF Leasing 3 - 3 - -
37= GTLK Europe 3 - - 3 -
41 Aerostar Leasing 2 2 - - -
42 Pearl Aircraft Corporation 1 - 1 - -
42= CMB Financial Leasing 1 - - 1 -
Total 2,918 53 234 2,491 140
Top 50 lessors’ orderbooks
Source: Lessors and AFJ Fleet Tracker as of 30 June 2021Source: as per OEMs` input and press releases*Includes 10 MRJ aircraft. Mitsubishi MRJ program has been suspended indefinitely and is likely to be cancelled
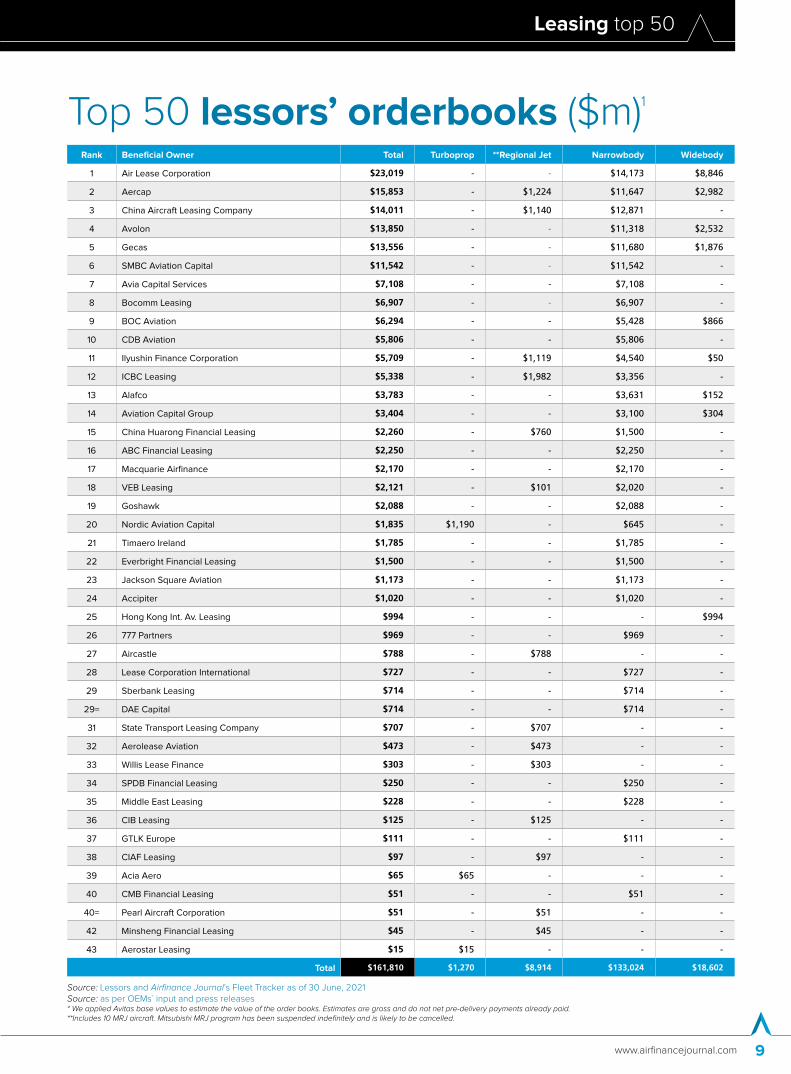
Leasing top 50
www.airfinancejournal.com 9
Rank Beneficial Owner Total Turboprop **Regional Jet Narrowbody Widebody
1 Air Lease Corporation $23,019 - - $14,173 $8,846
2 Aercap $15,853 - $1,224 $11,647 $2,982
3 China Aircraft Leasing Company $14,011 - $1,140 $12,871 -
4 Avolon $13,850 - - $11,318 $2,532
5 Gecas $13,556 - - $11,680 $1,876
6 SMBC Aviation Capital $11,542 - - $11,542 -
7 Avia Capital Services $7,108 - - $7,108 -
8 Bocomm Leasing $6,907 - - $6,907 -
9 BOC Aviation $6,294 - - $5,428 $866
10 CDB Aviation $5,806 - - $5,806 -
11 Ilyushin Finance Corporation $5,709 - $1,119 $4,540 $50
12 ICBC Leasing $5,338 - $1,982 $3,356 -
13 Alafco $3,783 - - $3,631 $152
14 Aviation Capital Group $3,404 - - $3,100 $304
15 China Huarong Financial Leasing $2,260 - $760 $1,500 -
16 ABC Financial Leasing $2,250 - - $2,250 -
17 Macquarie Airfinance $2,170 - - $2,170 -
18 VEB Leasing $2,121 - $101 $2,020 -
19 Goshawk $2,088 - - $2,088 -
20 Nordic Aviation Capital $1,835 $1,190 - $645 -
21 Timaero Ireland $1,785 - - $1,785 -
22 Everbright Financial Leasing $1,500 - - $1,500 -
23 Jackson Square Aviation $1,173 - - $1,173 -
24 Accipiter $1,020 - - $1,020 -
25 Hong Kong Int. Av. Leasing $994 - - - $994
26 777 Partners $969 - - $969 -
27 Aircastle $788 - $788 - -
28 Lease Corporation International $727 - - $727 -
29 Sberbank Leasing $714 - - $714 -
29= DAE Capital $714 - - $714 -
31 State Transport Leasing Company $707 - $707 - -
32 Aerolease Aviation $473 - $473 - -
33 Willis Lease Finance $303 - $303 - -
34 SPDB Financial Leasing $250 - - $250 -
35 Middle East Leasing $228 - - $228 -
36 CIB Leasing $125 - $125 - -
37 GTLK Europe $111 - - $111 -
38 CIAF Leasing $97 - $97 - -
39 Acia Aero $65 $65 - - -
40 CMB Financial Leasing $51 - - $51 -
40= Pearl Aircraft Corporation $51 - $51 - -
42 Minsheng Financial Leasing $45 - $45 - -
43 Aerostar Leasing $15 $15 - - -
Total $161,810 $1,270 $8,914 $133,024 $18,602
Top 50 lessors’ orderbooks ($m)1
Source: Lessors and Airfinance Journal’s Fleet Tracker as of 30 June, 2021Source: as per OEMs` input and press releases* We applied Avitas base values to estimate the value of the order books. Estimates are gross and do not net pre-delivery payments already paid.**Includes 10 MRJ aircraft. Mitsubishi MRJ program has been suspended indefinitely and is likely to be cancelled.

Leasing top 50
Airfinance Journal November/December 202110
●
●
●
●
Narrowbody
Regional jet
Widebody
Turboprop
Total2,821
53
140
263
2,365
Lessor firm ordersFigure 1: Firm orders by body type
Figure 3: Firm orders by manufacturer
Figure 5: Firm orders by country of lessor
Figure 2: Firm orders by value by body type ($m)
Figure 4: Firm orders by value by manufacturer ($m)
Figure 6: Firm orders by value by country of lessor ($m)
●
●
●
●
Narrowbody
Regional jet
Widebody
Turboprop
$126,586
$10,016 $1,270
$18,602
Total$156.5bn
1,574Total2,821
711
386
209
74 48
1,393
Airbus
Boeing
Other
United Aircraft Corporation
Embraer
ATR
●
●
●
●
●
●
Airbus
Boeing
Other
United Aircraft Corporation
Embraer
ATR
●
●
●
●
●
●
$43,407
$17,490
$15,353 $2,426 $1,190
$76,608
Total$156.5bn
Total2,821
694
295
271
245 216
●
●
●
●
●
●
China
United States
Ireland
Russia
Japan
Other
1,100 Total$156.5bn
$42,563
$18,255
$16,579
$12,715
$8,907
●
●
●
●
●
●
China
United States
Ireland
Russia
Japan
Other
$57,455
Source: Manufacturers and Avitas as of 30 June, 2021* Calculated as of 2021 market list prices and Avitas Base Values**Includes 10 MRJ aircraft. Mitsubishi MRJ program has been suspended indefinitely and is likely to be cancelled.

Leasing top 50
www.airfinancejournal.com 11
Airfinance Journal has sourced audited financial statements for more than 90
lessors and leasing entities, including more than 30 of the Leasing Top 50 lessors. Of these, we have selected 22 companies that represent the largest lessors for inclusion in this study. These are shown in table 1. Notably, we have full consolidated “Combined Carve-out” financial statements for GECAS for the first time as released in Aercap’s October 2021 6-K. The “as-of” dates for the financials range from 31 December 2020 to 30 June 2021.
Trend analysis – Global aircraft leasing companies’ financial performance
Count Leasing entityParent/country of
operationDate of most recent
annual financialsTotal Assets
($ bn)Net Income ($ m)
1 AerCap Holdings N.V. Netherlands/Ireland 31-Dec-20 42.0 -298.6
2 AerDragon Aviation Partners Limited Ireland 31-Dec-20 1.3 26.0
3 Air Lease Corporation USA 31-Dec-20 25.2 500.9
4 Aircastle Limited Japan/USA 31-Dec-20 7.7 -333.2
5 Amedeo Air Four Plus Limited UK 31-Mar-21 1.9 -223.7
6 Aviation Capital Group LLC Japan/USA 31-Dec-20 12.4 104.0
7 Avation PLC UK/Singapore 30-Jun-21 1.3 -84.9
8 Avolon Holdings Limited China/Ireland 31-Dec-20 30.8 -36.6
9 Banc of America Leasing Ireland Co., Limited USA/Ireland 31-Dec-20 2.3 60.3
10 BOC Aviation Limited China/Singapore 31-Dec-20 23.6 509.8
11 CCB Aviation Corporation Limited China/Ireland 31-Dec-20 2.2 -41.8
12 CDB Aviation Lease Finance DAC China/Ireland 31-Dec-20 9.0 -101.3
13 Clover Aircraft Leasing Company Limited China & Japan/Ireland 31-Dec-20 0.8 -1.6
14 Dubai Aerospace Enterprise (DAE) Ltd UAE 31-Dec-20 12.7 228.9
15 FLY Leasing Limited Ireland 31-Dec-20 3.2 -64.5
16 GECAS Combined Carve-out Financial Statements1 USA/Ireland 31-Dec-20 38.3 -162.5
17 Goshawk Aviation Limited China/Ireland 31-Dec-20 8.1 4.6
18 Jackson Square Aviation Ireland Limited Japan/Ireland 31-Dec-20 3.8 -8.0
19 Macquarie AirFinance Limited Australia/UK 31-Mar-21 5.0 -211.2
20 Merx Aviation Finance Assets Ireland Limited USA/Ireland 31-Mar-21 1.7 -79.6
21 ORIX Aviation Systems Limited Japan/Ireland 31-Mar-21 4.4 0.6
22 SMBC Aviation Capital Limited Japan/Ireland 31-Mar-21 16.0 13.6
Table 1: The leasing entities included in the industry aggregates
Note all financial statements are consolidated, except for ORIX Aviation Systems Limited1 As published in AerCap 6-K, October 2021
BOC Aviation Limited had a net income of $509.8 million

Leasing top 50
Airfinance Journal November/December 202112
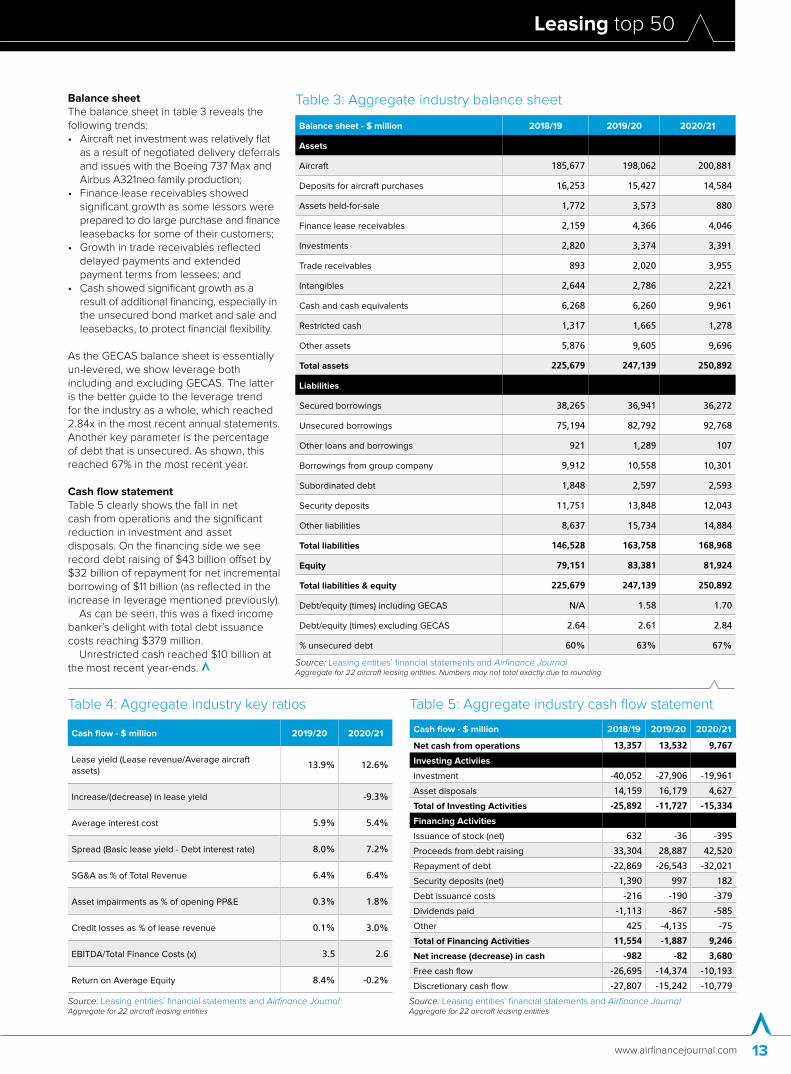
Income statementTable 2 shows the key aggregate income statement figures for these lessors. The main takeaways resulting from the pandemic are:• Lease revenue and gains on disposal of
aircraft were down in the latest year as a result of renegotiations, deferrals of rentals and moving to cash accounting for certain lessees;
• Asset impairments increased to $3.5 billion (1.8% of opening Aircraft assets); and
• Net income fell from $6.2 billion to a small loss.
Table 4 shows the trend in lease yield, average interest cost and net spread.
Income statement - $ million 2018/19 2019/20 2020/21
Revenue
Lease revenue 21,203 22,920 21,535
Gain (loss) on disposal of aircraft 1,130 1,421 542
Interest and other income 1,464 1,742 1,311
Total Revenue 23,798 26,082 23,388
Operating expenses
Aircraft lease rental expense (178) (239) (147)
Aircraft maintenance and transition costs (510) (397) (444)
Asset impairment (219) (489) (3,508)
Financial asset impairment 1 (32) (625)
Goodwill impairment - - (156)
Selling, general, admin and staff expenses (1,625) (1,670) (1,506)
Other operating income 67 82 64
Other operating expenses (173) (295) (231)
Total operating expenses excluding depreciation (2,637) (3,040) (6,553)
EBITDA 21,161 23,042 16,836
Depreciation & amortisation (8,606) (9,492) (10,030)
EBIT from continuing operating activities 12,554 13,550 6,805
Non-recurring gains and losses (6) 27 (322)
EBIT after non-recurring gains and losses 12,548 13,577 6,483
Total finance costs (5,768) (6,645) (6,474)
Profit before tax (PBT) 6,780 6,932 9
Income tax expense (771) (812) (180)
Profit from continuing operations 6,010 6,120 (171)
Net income 6,082 6,232 (141)
Table 2: Aggregate industry income statement
Source: Leasing entities’ financial statements and Airfinance JournalAggregate for 22 aircraft leasing entities. Numbers may not total exactly due to rounding.
Aircraft net investment was relatively flat as a result of negotiated delivery deferrals and issues with the Boeing 737 Max
Leasing top 50
www.airfinancejournal.com 13
Cash flow - $ million 2018/19 2019/20 2020/21
Net cash from operations 13,357 13,532 9,767
Investing Activiies
Investment -40,052 -27,906 -19,961
Asset disposals 14,159 16,179 4,627
Total of Investing Activities -25,892 -11,727 -15,334
Financing Activities
Issuance of stock (net) 632 -36 -395
Proceeds from debt raising 33,304 28,887 42,520
Repayment of debt -22,869 -26,543 -32,021
Security deposits (net) 1,390 997 182
Debt issuance costs -216 -190 -379
Dividends paid -1,113 -867 -585
Other 425 -4,135 -75
Total of Financing Activities 11,554 -1,887 9,246
Net increase (decrease) in cash -982 -82 3,680
Free cash flow -26,695 -14,374 -10,193
Discretionary cash flow -27,807 -15,242 -10,779
Table 5: Aggregate industry cash flow statement
Source: Leasing entities’ financial statements and Airfinance JournalAggregate for 22 aircraft leasing entities
Balance sheetThe balance sheet in table 3 reveals the following trends:• Aircraft net investment was relatively flat
as a result of negotiated delivery deferrals and issues with the Boeing 737 Max and Airbus A321neo family production;
• Finance lease receivables showed significant growth as some lessors were prepared to do large purchase and finance leasebacks for some of their customers;
• Growth in trade receivables reflected delayed payments and extended payment terms from lessees; and
• Cash showed significant growth as a result of additional financing, especially in the unsecured bond market and sale and leasebacks, to protect financial flexibility.
As the GECAS balance sheet is essentially un-levered, we show leverage both including and excluding GECAS. The latter is the better guide to the leverage trend for the industry as a whole, which reached 2.84x in the most recent annual statements. Another key parameter is the percentage of debt that is unsecured. As shown, this reached 67% in the most recent year.
Cash flow statementTable 5 clearly shows the fall in net cash from operations and the significant reduction in investment and asset disposals. On the financing side we see record debt raising of $43 billion offset by $32 billion of repayment for net incremental borrowing of $11 billion (as reflected in the increase in leverage mentioned previously).
As can be seen, this was a fixed income banker’s delight with total debt issuance costs reaching $379 million.
Unrestricted cash reached $10 billion at the most recent year-ends.
Balance sheet - $ million 2018/19 2019/20 2020/21
Assets
Aircraft 185,677 198,062 200,881
Deposits for aircraft purchases 16,253 15,427 14,584
Assets held-for-sale 1,772 3,573 880
Finance lease receivables 2,159 4,366 4,046
Investments 2,820 3,374 3,391
Trade receivables 893 2,020 3,955
Intangibles 2,644 2,786 2,221
Cash and cash equivalents 6,268 6,260 9,961
Restricted cash 1,317 1,665 1,278
Other assets 5,876 9,605 9,696
Total assets 225,679 247,139 250,892
Liabilities
Secured borrowings 38,265 36,941 36,272
Unsecured borrowings 75,194 82,792 92,768
Other loans and borrowings 921 1,289 107
Borrowings from group company 9,912 10,558 10,301
Subordinated debt 1,848 2,597 2,593
Security deposits 11,751 13,848 12,043
Other liabilities 8,637 15,734 14,884
Total liabilities 146,528 163,758 168,968
Equity 79,151 83,381 81,924
Total liabilities & equity 225,679 247,139 250,892
Debt/equity (times) including GECAS N/A 1.58 1.70
Debt/equity (times) excluding GECAS 2.64 2.61 2.84
% unsecured debt 60% 63% 67%
Table 3: Aggregate industry balance sheet
Source: Leasing entities’ financial statements and Airfinance JournalAggregate for 22 aircraft leasing entities. Numbers may not total exactly due to rounding.
Cash flow - $ million 2019/20 2020/21
Lease yield (Lease revenue/Average aircraft assets)
13.9% 12.6%
Increase/(decrease) in lease yield -9.3%
Average interest cost 5.9% 5.4%
Spread (Basic lease yield - Debt interest rate) 8.0% 7.2%
SG&A as % of Total Revenue 6.4% 6.4%
Asset impairments as % of opening PP&E 0.3% 1.8%
Credit losses as % of lease revenue 0.1% 3.0%
EBITDA/Total Finance Costs (x) 3.5 2.6
Return on Average Equity 8.4% -0.2%
Table 4: Aggregate industry key ratios
Source: Leasing entities’ financial statements and Airfinance JournalAggregate for 22 aircraft leasing entities
Leasing top 50
Airfinance Journal November/December 202114
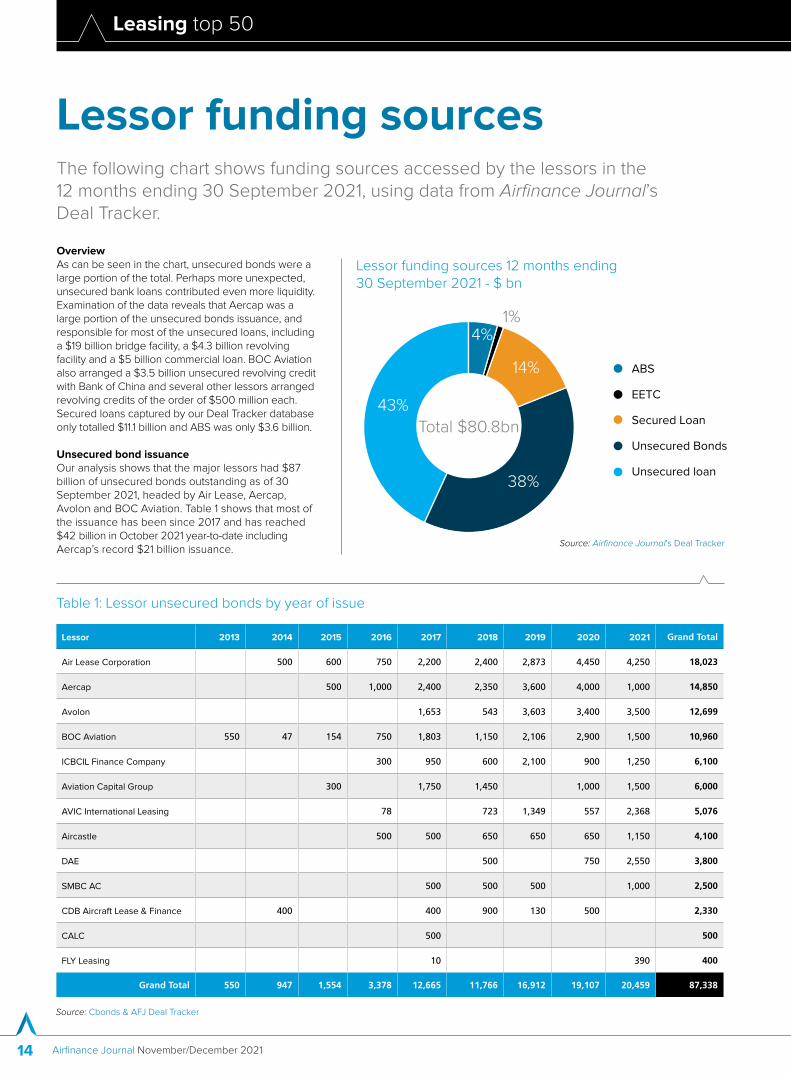
Lessor funding sources The following chart shows funding sources accessed by the lessors in the 12 months ending 30 September 2021, using data from Airfinance Journal’s Deal Tracker.
Lessor 2013 2014 2015 2016 2017 2018 2019 2020 2021 Grand Total
Air Lease Corporation 500 600 750 2,200 2,400 2,873 4,450 4,250 18,023
Aercap 500 1,000 2,400 2,350 3,600 4,000 1,000 14,850
Avolon 1,653 543 3,603 3,400 3,500 12,699
BOC Aviation 550 47 154 750 1,803 1,150 2,106 2,900 1,500 10,960
ICBCIL Finance Company 300 950 600 2,100 900 1,250 6,100
Aviation Capital Group 300 1,750 1,450 1,000 1,500 6,000
AVIC International Leasing 78 723 1,349 557 2,368 5,076
Aircastle 500 500 650 650 650 1,150 4,100
DAE 500 750 2,550 3,800
SMBC AC 500 500 500 1,000 2,500
CDB Aircraft Lease & Finance 400 400 900 130 500 2,330
CALC 500 500
FLY Leasing 10 390 400
Grand Total 550 947 1,554 3,378 12,665 11,766 16,912 19,107 20,459 87,338
Table 1: Lessor unsecured bonds by year of issue
Source: Cbonds & AFJ Deal Tracker
Lessor funding sources 12 months ending 30 September 2021 - $ bn
●
●
●
●
●
ABS
EETC
Secured Loan
Unsecured Bonds
Unsecured loan
4%1%
14%
38%
43%
Total $80.8bn
Source: Airfinance Journal’s Deal Tracker
OverviewAs can be seen in the chart, unsecured bonds were a large portion of the total. Perhaps more unexpected, unsecured bank loans contributed even more liquidity. Examination of the data reveals that Aercap was a large portion of the unsecured bonds issuance, and responsible for most of the unsecured loans, including a $19 billion bridge facility, a $4.3 billion revolving facility and a $5 billion commercial loan. BOC Aviation also arranged a $3.5 billion unsecured revolving credit with Bank of China and several other lessors arranged revolving credits of the order of $500 million each. Secured loans captured by our Deal Tracker database only totalled $11.1 billion and ABS was only $3.6 billion.
Unsecured bond issuanceOur analysis shows that the major lessors had $87 billion of unsecured bonds outstanding as of 30 September 2021, headed by Air Lease, Aercap, Avolon and BOC Aviation. Table 1 shows that most of the issuance has been since 2017 and has reached $42 billion in October 2021 year-to-date including Aercap’s record $21 billion issuance.

Leasing top 50
www.airfinancejournal.com 15
$ million 2021 2022 2023 2024 2025 2026 2027 2028 2029 2030 2031 2079 Perpetual Grand Total
Air Lease Corporation 2,500 2,450 2,873 2,300 3,400 1,000 1,000 500 1,400 600 18,023
AerCap 700 2,100 2,450 2,550 2,650 1,500 1,600 550 750 14,850
Avolon 1,136 1,423 2,490 1,100 3,150 2,650 750 12,699
BOC Aviation 1,047 2,100 2,297 1,858 1,308 803 798 750 10,960
ICBCIL Finance Company 1,400 600 1,850 900 850 250 250 6,100
Aviation Capital Group 1,000 650 1,300 800 1,500 750 6,000
AVIC International Leasing 878 1,661 559 1,515 462 5,076
Aircastle 1,150 500 650 650 750 400 4,100
DAE 500 1,300 500 750 750 3,800
SMBC AC 500 500 500 500 500 2,500
CDB Aircraft Lease & Finance
400 1,000 530 400 2,330
CALC 300 200 500
FLY Leasing 400 400
Grand Total 2,478 11,644 12,882 18,305 10,758 13,608 7,453 4,300 1,298 2,150 250 750 1,462 87,338
Table 3: Lessor unsecured bonds by year of maturity
Source: Cbonds & AFJ Deal Tracker
Source: Cbonds & AFJ Deal Tracker
CouponsShown in table 2 is the (simple) average coupon paid by each lessor for all issues that remain outstanding. This clearly shows the declining coupons over the last three years with ICBCIL Finance Company with the lowest historic average coupon followed by BOC Aviation, SMBC Aviation Capital and Air Lease.
Aercap doesn’t feature too well on the “lifetime” average but their year-to
September 2021 average coupon of 1.75% and successful execution of the $21 billion financing of the GECAS acquisition in October deserves recognition. Other lessors have also had outstanding success in the last 10 months in achieving significantly reduced coupons compared to 2020.
MaturitiesBut bonds need to be paid back and/or refinanced! Table 3 shows the unsecured
bond maturities as of 30 September 2021.As can be seen there was $2.5 billion of
maturities scheduled in the fourth quarter of 2021, stepping up to $12 billion in 2022, $13 billion in 2023 and then peaking at $18.3 billion in 2024. Note this excludes Aercap’s record $21 billion issuance.
Just to quantify the potential exposure, a 2% increase in average coupons on $87 billion of debt would cost these lessors an additional $1.7 billion annually in interest expense.
Lessor 2013 2014 2015 2016 2017 2018 2019 2020 2021 Grand Total
ICBCIL Finance Company 3.63 3.38 3.70 1.75 1.88 2.80
BOC Aviation 4.34 3.88 3.08 2.06 3.50 2.81 1.69 2.95
SMBC AC 3.00 4.13 3.55 2.10 2.98
Air Lease Corporation 4.25 3.75 3.00 3.16 3.81 3.38 2.94 1.77 2.99
CDB Aircraft Lease & Finance 4.25 3.50 3.00 2.87 1.50 3.02
DAE 5.25 3.75 2.29 3.03
AVIC International Leasing 4.63 3.48 3.43 1.70 3.07
Aviation Capital Group 4.88 3.19 4.13 5.50 1.95 3.67
AerCap 4.63 3.95 3.55 3.94 4.51 4.69 1.75 4.11
Avolon 5.00 5.31 4.49 3.97 2.47 4.15
Aircastle 5.00 4.13 4.40 4.25 5.25 4.05 4.45
CALC 5.10 5.10
FLY Leasing 5.25 7.00 6.13
Grand Total 4.34 4.25 4.42 3.89 3.71 3.89 3.92 3.55 2.31 3.49
Table 2: Lessor unsecured bonds - average coupon by year of issue
Leasing top 50
Airfinance Journal November/December 202116
Analysis of the global leased fleet
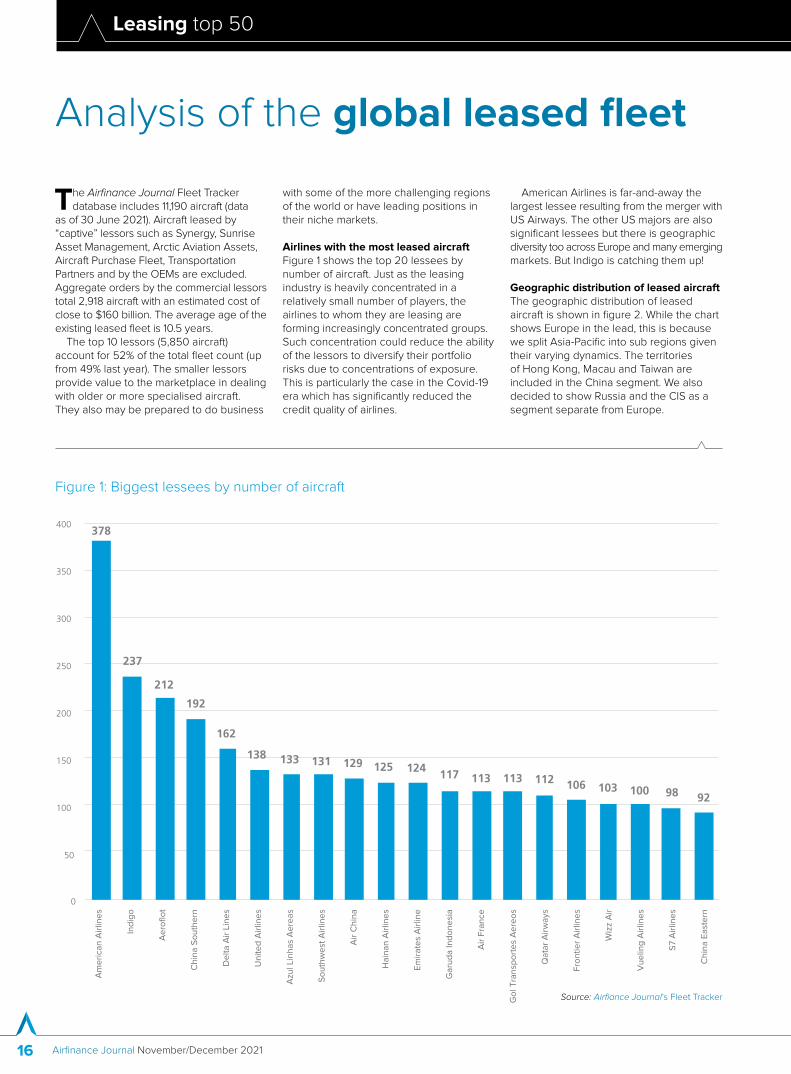
The Airfinance Journal Fleet Tracker database includes 11,190 aircraft (data
as of 30 June 2021). Aircraft leased by “captive” lessors such as Synergy, Sunrise Asset Management, Arctic Aviation Assets, Aircraft Purchase Fleet, Transportation Partners and by the OEMs are excluded. Aggregate orders by the commercial lessors total 2,918 aircraft with an estimated cost of close to $160 billion. The average age of the existing leased fleet is 10.5 years.
The top 10 lessors (5,850 aircraft) account for 52% of the total fleet count (up from 49% last year). The smaller lessors provide value to the marketplace in dealing with older or more specialised aircraft. They also may be prepared to do business
with some of the more challenging regions of the world or have leading positions in their niche markets.
Airlines with the most leased aircraftFigure 1 shows the top 20 lessees by number of aircraft. Just as the leasing industry is heavily concentrated in a relatively small number of players, the airlines to whom they are leasing are forming increasingly concentrated groups. Such concentration could reduce the ability of the lessors to diversify their portfolio risks due to concentrations of exposure. This is particularly the case in the Covid-19 era which has significantly reduced the credit quality of airlines.
American Airlines is far-and-away the largest lessee resulting from the merger with US Airways. The other US majors are also significant lessees but there is geographic diversity too across Europe and many emerging markets. But Indigo is catching them up!
Geographic distribution of leased aircraftThe geographic distribution of leased aircraft is shown in figure 2. While the chart shows Europe in the lead, this is because we split Asia-Pacific into sub regions given their varying dynamics. The territories of Hong Kong, Macau and Taiwan are included in the China segment. We also decided to show Russia and the CIS as a segment separate from Europe.
Am
eri
can
Air
line
s
Ind
igo
Ae
roflo
t
Ch
ina
So
uth
ern
De
lta
Air
Lin
es
Un
ite
d A
irlin
es
Azu
l Lin
ha
s A
ere
as
So
uth
we
st A
irlin
es
Air
Ch
ina
Ha
ina
n A
irlin
es
Em
ira
tes
Air
line
Ga
rud
a In
do
ne
sia
Air
Fra
nce
Go
l Tra
nsp
ort
es
Ae
reo
s
Qa
tar
Air
wa
ys
Fro
nti
er
Air
line
s
Wiz
z A
ir
Vu
elin
g A
irlin
es
S7 A
irlin
es
Ch
ina
Ea
ste
rn
378
237
212
192
162
138 133 131 129 125 124 117 113 113 112 106 103 100 98 92
0
50
100
150
200
250
300
350
400
Figure 1: Biggest lessees by number of aircraft
Source: Airfiance Journal’s Fleet Tracker

Leasing top 50
www.airfinancejournal.com 17
Breakdown of Leased FleetFigure 3 shows a breakdown of the leased fleet by body-type of aircraft. A full 70% of the leased fleet is in the narrowbody category split mostly between the A320 and 737 families. Only 16% is widebody, though in value terms their share would be much more significant, especially with the A350 and 787 finding a lot of favour among lessors. A total of 82 delivered 737 Max aircraft are included in the lessors’ fleets and 693 remain in the lessors’ orderbooks even after 320 cancellations during 2021.
Europe
2,570 ●●
Latin America
●969Middle East 700
North America●1,751
●Northeast Asia
434
681South Asia
● SoutheastAsia1,158
Oceania 171 ●Africa 351●
CIS 861
China 1,544
Figure 2: Geographic distribution of leased aircraft
● Narrowbody 7,853
● Widebody 1,744
● Regional jet 817
● Turboprop 776
70%
16%
7%
7%
Figure 3: Leased aircraft body type
By contrast, a total of 54 A320neo family aircraft have been delivered to lessors during 2021. The lessors’ fleets include a total of 375 dedicated freighters.
Regional JetsNordic Aviation Capital is now top of this list, having taken over GECAS’ long-standing number one position. Falko Regional Aircraft, Avmax, STLC, VEB Leasing and Truenoord Regional Aircraft Leasing are the next largest players in this segment.
TurbopropsTurboprops are a significant niche market, dominated by one lessor, Nordic Aviation Capital. However, other lessors have a presence, as shown in figure 5, attracted by historically higher yields. Leading the way in terms of new investment are Chorus Aviation Capital, Truenoord and Elix Aviation Capital. The other major players in the segment are shown on the chart.
Figure 4: Top 10 lessors of regional jets
Source: Lessors and Airfinance Journal’s Fleet Tracker
Figure 5: Top turboprop lessors
0
50
100
150
200
250
No
rdic
Avi
ati
on
Ca
pit
al
Ch
oru
s A
via
tio
n
DA
E C
ap
ita
l
Avm
ax
Elix
Avi
ati
on
Ca
pit
al
Jets
tre
am
Avi
ati
on
Ca
pit
al
Ava
tio
n
Aci
a A
ero
Tru
en
oo
rd
Ge
cas
Fa
lko
Larg
us
Avi
ati
on
Source: Airfinance Journal’s Fleet Tracker as of 30 June, 2021
0
20
40
60
80
100
120
140
160
180
No
rdic
Avi
ati
on
Ca
pit
al
Ge
cas
Fa
lko
Avm
ax
Sta
te T
ran
spo
rtLe
asi
ng
Co
mp
an
y
VE
B L
ea
sin
g
Tru
en
oo
rd
Acu
me
n A
via
tio
n
Ch
oru
s A
via
tio
n
CD
B A
via
tio
n
Sb
erb
an
k L
ea
sin
g
Source: Lessors and Airfinance Journal’s Fleet Tracker

Leasing top 50
Airfinance Journal November/December 202118
● Narrowbody 812
● Regional jet 205
● Turboprop 20
69%
2%
18%
11%
● Widebody 131
GECAS fleet by aircraft type
1 GECAS
GECAS top lessees
Europe
209 ●CIS
●Latin America●85
43●431 ●Northeast Asia
South Asia●31 Southeast
Asia67
Oceania ●
Africa
China
96
●38
25
54
MiddleEast
North America
13O�-lease/transition●76
GECAS fleet by region of lessee
Source: Airfinance Journal’s Fleet Tracker as of 30 June, 2021
American AirlinesUnited Airlines
Endeavor AirJetblue
Skywest AirlinesSouthwest Airlines
EurowingsHainan Airlines
Azul Linhas AereasS7 AirlinesAir Canada
0 20 40 60 80 100 120
● Narrowbody 767
● Widebody 247
● Regional jet 14
74.6%
1.4%
24.0%
Aercap fleet by aircraft type
2 Aercap
Aercap top lessees
Europe
226 ●●
Latin America
●88Middle East
42North America
●221
●Northeast Asia
25
South Asia 25●
SoutheastAsia42
Oceania ●Africa 25
●
CIS 106
China 170
12O�-lease/transition●46
Aercap fleet by region of lessee
Source: Airfinance Journal’s Fleet Tracker as of 30 June, 2021
American AirlinesChina Southern
Air FranceSouthwest Airlines
United AirlinesAzul Linhas Aereas
S7 AirlinesSichuan Airlines
Spirit AirlinesVolaris
Air Transat
0 20 40 60 80 100*We were very pleased to receive fleet updates from 75 lessors in preparation for this study. Unfortunately, some of the major lessors did not provide their updated data. In particular, we are aware that our fleet sizes for 737NGs and A320s for GECAS and AerCap are higher than disclosed in the recent SEC filing by AerCap. We are working to identify the new owners of these additional aircraft and the results will be available on AFJ Fleet Tracker as soon as possible.
Leasing top 50
www.airfinancejournal.com 19
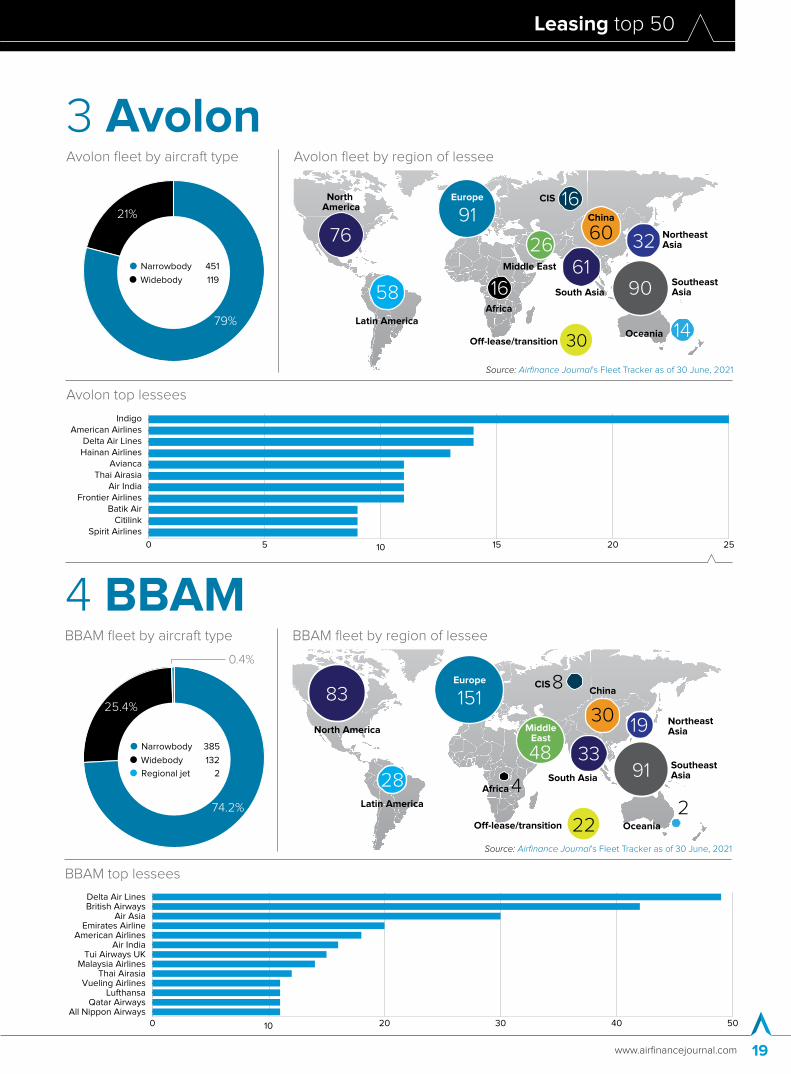
● Narrowbody 451
● Widebody 119
79%
21%
Avolon fleet by aircraft type
3 Avolon
Avolon top lessees
Europe
91 ●CIS
Latin America
●58
Middle East
26●76 ●Northeast Asia
South Asia●61
SoutheastAsia90
●Africa
China
60
●32
16North America
Oceania 14O�-lease/transition●30
●16
Avolon fleet by region of lessee
Source: Airfinance Journal’s Fleet Tracker as of 30 June, 2021
IndigoAmerican Airlines
Delta Air LinesHainan Airlines
AviancaThai Airasia
Air IndiaFrontier Airlines
Batik AirCitilink
Spirit Airlines
0 5 10 15 20 25
● Narrowbody 385
● Widebody 132
● Regional jet 2
74.2%
0.4%
25.4%
BBAM fleet by aircraft type
4 BBAM
BBAM top lessees
Europe
151
●CIS
●
Latin America
●28
48
North America
●83
● Northeast Asia
South Asia●33
SoutheastAsia91
Oceania ●
Africa
China
30
●
19
4
8
MiddleEast
2O�-lease/transition●22
BBAM fleet by region of lessee
Source: Airfinance Journal’s Fleet Tracker as of 30 June, 2021
Delta Air LinesBritish Airways
Air AsiaEmirates Airline
American AirlinesAir India
Tui Airways UKMalaysia Airlines
Thai AirasiaVueling Airlines
LufthansaQatar Airways
All Nippon Airways0 10 20 30 40 50

Leasing top 50
Airfinance Journal November/December 202120
● Narrowbody 445
● Widebody 60
88.1%
11.9%
SMBC Aviation Capital fleet by aircraft type
5 SMBC Aviation Capital
SMBC Aviation Capital top lessees
Europe
149
●●
Latin America
●86
27North America
●42
●Northeast
Asia
South Asia●16 Southeast
Asia34
Oceania
Africa
China
38●
45
1
35
MiddleEast
18
CIS
O�-lease/transition●14
SMBC Aviation Capital fleet by region of lessee
Source: Airfinance Journal’s Fleet Tracker as of 30 June, 2021
CopaTurkish Airlines
AeroflotAviancaQantas
Southwest AirlinesWizz Air
LufthansaPeach Aviation
S7 AirlinesAll Nippon Airways
Viva Aerobus
0 5 10 15 20
● Turboprop 286
● Regional jet 191
● Narrowbody 8 59%
2%
39%
Nordic Aviation Capital fleet by aircraft type
6 Nordic Aviation Capital
Nordic Aviation Capital top lessees
Europe
155
●
CIS
●Latin America
●61
1North America●28
South Asia●15 Southeast
Asia57
Oceania ●
Africa
China
3●
31
19
Middle East
5O�-lease/transition●110
Nordic Aviation Capital fleet by region of lessee
Source: Airfinance Journal’s Fleet Tracker as of 30 June, 2021
Garuda IndonesiaLOT
Air BalticAeromexico Connect
Azul Linhas AereasHop!
AirlinkAlitalia Cityliner
Air NostrumOlympic Air
TAP ExpressJazz Air
0 5 10 15 20 25 30
Leasing top 50
www.airfinancejournal.com 21
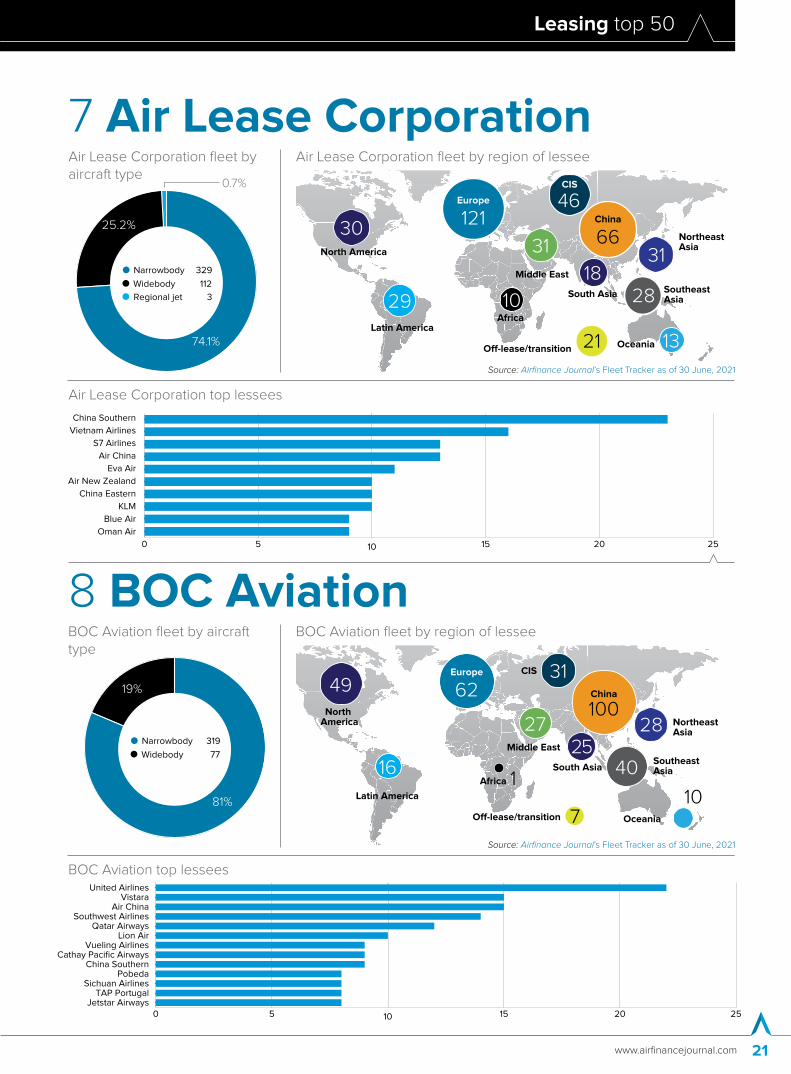
● Narrowbody 329
● Widebody 112
● Regional jet 3
74.1%
0.7%
25.2%
Air Lease Corporation fleet by aircraft type
7 Air Lease Corporation
Air Lease Corporation top lessees
Europe
121 ●●
Latin America
●29
Middle East
North America●30
●Northeast Asia
South Asia●18
SoutheastAsia28
●Africa
China
66
●31
10
46
●31
Oceania 13O�-lease/transition●21
CIS
Air Lease Corporation fleet by region of lessee
Source: Airfinance Journal’s Fleet Tracker as of 30 June, 2021
China Southern
Vietnam Airlines
S7 Airlines
Air China
Eva Air
Air New Zealand
China Eastern
KLM
Blue Air
Oman Air
0 5 10 15 20 25
● Narrowbody 319
● Widebody 77
81%
19%
BOC Aviation fleet by aircraft type
8 BOC Aviation
BOC Aviation top lessees
Europe
62 ●CIS
●
Latin America
●16Middle East
27 Northeast Asia
South AsiaSoutheastAsia40
Africa
China
100
●25
1
31
North America
Oceania ●
●25●28
●49
10O�-lease/transition●7
BOC Aviation fleet by region of lessee
Source: Airfinance Journal’s Fleet Tracker as of 30 June, 2021
United AirlinesVistara
Air ChinaSouthwest Airlines
Qatar AirwaysLion Air
Vueling AirlinesCathay Pacific Airways
China SouthernPobeda
Sichuan AirlinesTAP Portugal
Jetstar Airways0 5 10 15 20 25
Leasing top 50
Airfinance Journal November/December 202122
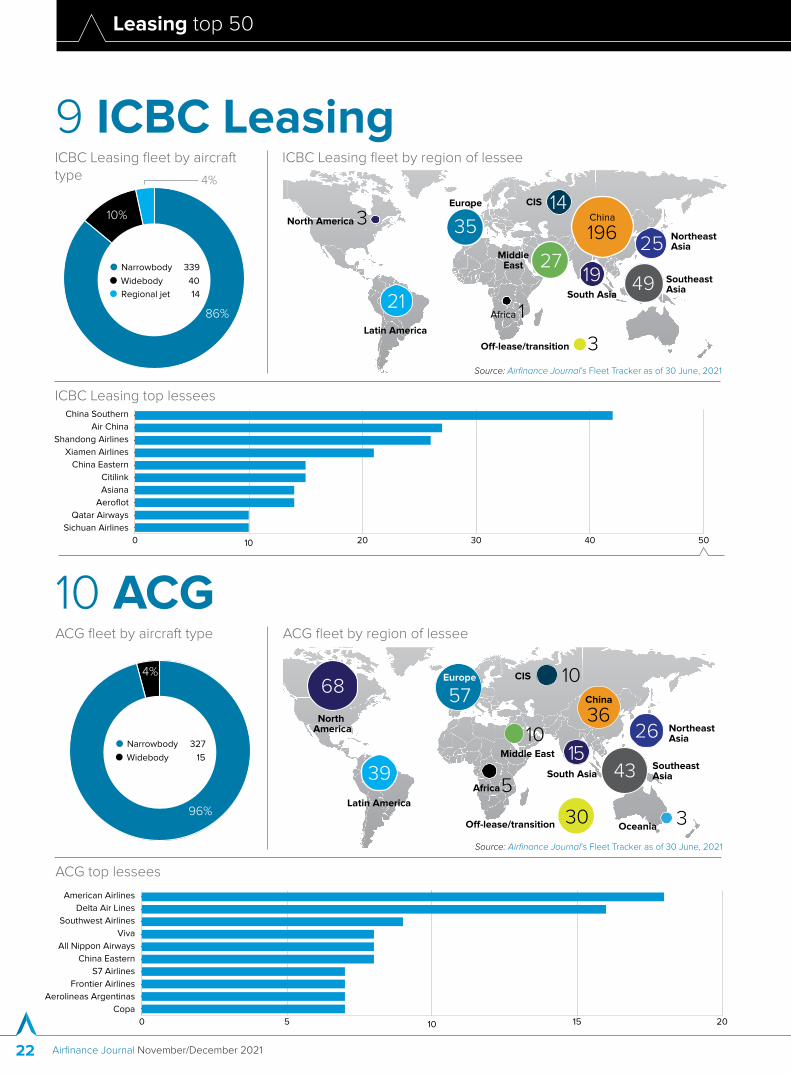
● Narrowbody 327
● Widebody 15
96%
4%
ACG fleet by aircraft type
10 ACG
ACG top lessees
Europe
57 ●CIS
●
Latin America
●39Middle East
10 Northeast Asia
South AsiaSoutheastAsia43
Africa
China
36
●
25
5
10
North America
Oceania●
●15 ●26
●68
3O�-lease/transition●30
ACG fleet by region of lessee
Source: Airfinance Journal’s Fleet Tracker as of 30 June, 2021
American Airlines
Delta Air Lines
Southwest Airlines
Viva
All Nippon Airways
China Eastern
S7 Airlines
Frontier Airlines
Aerolineas Argentinas
Copa
0 5 10 15 20
● Narrowbody 339
● Widebody 40
● Regional jet 14
86%
4%
10%
ICBC Leasing fleet by aircraft type
9 ICBC Leasing
ICBC Leasing top lessees
ICBC Leasing fleet by region of lessee
Source: Airfinance Journal’s Fleet Tracker as of 30 June, 2021
China Southern
Air China
Shandong Airlines
Xiamen Airlines
China Eastern
Citilink
Asiana
Aeroflot
Qatar Airways
Sichuan Airlines
0 10 20 30 40 50
Europe
35 ●CIS
Latin America
●21
27 ● Northeast Asia
South Asia●19 Southeast
Asia49
Africa 1
China
196●
25
14
MiddleEast
North America 3●
●
O�-lease/transition ●3

Leasing top 50
www.airfinancejournal.com 23
If you are interested in hosting a webinar or would like to discuss further, please contact Charlie Avent on [email protected]
airfinance_journal@AirfinanceNews Airfinance Journalevents.airfinancejournal.com
� webinars
Aviation finance amid Covid-19 - an update from the Asia Pacific
What are the Capital Markets trying to tell us?
Cash Burn & Liquidity Webinar
Webinars On-Demand
To watch our previous webinars, please scan the QR code or visit: www.airfinancejournal.com/webinars
Discover several on-demand webinars that provide you with key insights into constantly changing industry trends.

ACQUIRE THE KNOWLEDGE YOU NEED ANYWHERE, ANYTIME AND ON ANY DEVICE
✔ Access a continuously growing library of 450+ interactive videos, all made with the
highest-quality production and post-production values
✔ Structure your learning through 32 curated pathways
✔ Learn from 90+ industry experts with 1,000+ years combined experience
✔ Earn CPD points as you learn and share your progress on LinkedIn with course completion certifi cates
✔ Track progress and compare usage across teams with a suite of real-time analytics
Introducing the world’s fi rst on-demand video learning platform built by fi nance professionals, for fi nance professionals.Euromoney Learning On-Demand is a comprehensive, premium quality and engaging videolearning platform that covers all areas of banking and fi nance from fundamental concepts to advanced theory.
Join the future of fi nancial learning: ondemand.euromoney.com