lasting improvement in manufacturing performance: …
TRANSCRIPT

"LASTING IMPROVEMENT IN MANUFACTURINGPERFORMANCE: In Search•of
New Theory"
byKasra FERDOWS*
Arnoud DE MEYER**
N° 89 / 04
* Kasra FERDOWS, Associate Professor of Production and OperationsManagement, INSEAD, Fontainebleau, France
** Arnoud DE MEYER, Associate Professor of Technology Management,INSEAD, Fontainebleau, France
Director of Publication :
Charles WYPLOSZ, Associate Deanfor Research and Development
Printed at INSEAD,Fontainebleau, France

LASTING IMPROVEMENT IN MANUFACTURING PERFORMANCE:
In Search of a New Theory
Kasra FerdowsArnoud De Meyer
The European Institute of Business Administration (INSEAD)Boulevard de Constance
77305 Fontainebleau, France
Telephone: 33-1 60 72 40 14
January 1989
-1-
LASTING IMPROVEMENT IN MANUFACTURING PERFORMANCE:
In Search of a Nev Theory
Abstract
The fundamental premise of production management is one of focus. To be
successful, a manufacturer has to choose between the capabilities of cost
efficiency, quality, dependability and flexibility, and focus all its
attention and resources on pursuing this capability. Yet one sees more and
more world class manufacturers who seem to be successful by pursuing a
strategy based on a combination of two or more of these capabilities. How
can one explain this divergence between the prevailing paradigm and
practice. It is our contention that the nature of the trade-offs among
manufacturing capabilities is more complex than has been assumed. Ve
propose an alternative theory, namely that those manufacturers who create
deep and lasting manufacturing capabilities follow a pattern of allocation
of efforts and resources that is built on the assumption that these
capabilities are cumulative: lasting capabilities are not built at the
expense of each other, but upon each other, following a specific pattern of
quality, followed by dependability, then reaction speed and finally cost
efficiency. If one accepts this then we should re-examine traditional
managerial approaches for improving manufacturing performance and the long-
term role of manufacturing in the competitive strategy of the firm. The
belief that costs can corne down quickly and at the same time lastingly has

-2-
to be reviewed. Lasting cost efficiency is ot a prerequisite to the other
manufacturing capabilities but is the result of improvement in the other
capabilities.
-3-
LASTING IMPROVEMENT IN MANUFACTURING PERFORMANCE:
In Search of a New Theory
Some manufacturers seem to be able to defy the commonly accepted production
logic. Compared to their competitors, they have better quality, are more
dependable, respond faster to changing market requirements and, in spite of
all that, achieve louer costs. How do they manage to do that? The
prevailing production management paradigm, set forth by Skinner (1966) and
refined by scholars who followed him, seem to imply that this should not be
possible. Achieving competitive strength along one of these yardsticks
should corne at the expense of the rest.
Yet increasingly we are witnessing the emergence of manufacturers who seem
not to have traded off one capability to develop another. Many companies
engaged in quality improvement programmes report also louer costs. Deming
(1982), Juran, Gryna and Bingham (1974), Crosby (1979), Garvin (1987), and
many others including Skinner himself (1986), have offered explanations of
how and why this occurs. They show that improvements in cost efficiency and
quality are not necessarily mutually exclusive, but that better cost
efficiency can, in fact, be a consequence of investment in quality
improvement programmes. Interestingly enough, this does not seem to work in
reverse--i.e., increasing cost efficiency does not seem to improve quality.
So the trade-off seems to work in one way but not the other.
-4-
New insights about the relationship between other capabilities are more
scarce. The practitioner's literature describes many examples of cases
where a high variety of end products can be offered without becoming
inefficient. Examples of automobile companies such as Toyota or the Ford
Motor Company in Europe, which have for all practical purposes lot size of
one in final assembly corne to mind. But conclusive results which show that
flexibility can be obtained without trading in efficiency are not yet
available. Jaikumar (1986) offers some indication for the relationship
between flexiblity and dependability of the production process. His
comparison of flexible machining systems in the United States and Japan
revealed that higher flexibility was associated with greater dependability:
those companies that had made their production systems more reliable--
essentially through increasing the level of knowledge about the production
process in the company--could run their machines more flexibly. Again, the
reverse does not appear to be true; that is, increasing flexibility does not
seem to make the process more dependable.
In our own research in the last six years, comparing manufacturing practices
of large companies in Europe, North America, and Japan (Ferdows, Miller,
Nakane & Vollmann (1986), De Meyer, Nakane, Miller & Ferdows (1989), Miller,
Amano, De Meyer, Ferdows, Nakane, Roth (1989)), we have noted that
manufacturers use a multitude of different approaches for developing similar
capabilities. Many of the Japanese manufacturers, in particular, seem to
follow a distinct sequence of improvement programmes which aim at building
one capability upon, and not instead of, another.

-5-
In short, we see growing evidence that the nature of tradeoffs among
manufacturing capabilities is more complex than has been assumed. Even the
fundamental premise of existence of tradeoffs under all conditions should be
re-examined. We need a new theory to explain these observations. Our
purpose in this paper is to propose one.
It will be our conclusion that those who create deep and lasting
manufacturing capabilities follow a pattern of allocation of efforts and
resources which instead of assuming a tradeoff between these capabilities,
consider them to be cumulative. That lasting capabilities are not built at
the expense of each other but upon each other following a specific pattern.
If we are right, then many current systems, procedures, and most important,
mindsets in the management of manufacturing need to be revised. The very
foundation of what is commonly considered as "common sense" in production is
put under question. New theories of such scope are seldom "proved" quickly,
and we do not claim to have done that in this paper. Our work here should
be regarded as exploratory and our conclusion as a set of propositions.
However, we hope we can convince you that these propositions merit careful
attention.

-6-
The Research Base
To develop our arguments we use selected data available through the European
Manufacturing Futures Project.1Administered at INSEAD since 1983, this
is a project in which a sample of large European manufacturing companies are
surveyed once a year through a mailed questionnaire. For this paper, we
have used the results of the 1988 survey (see Appendix 1 for a description
of the sample). It should be mentioned that the sample is biased towards
large, well performing manufacturing units and is not representative of
Europe's manufacturing industry.
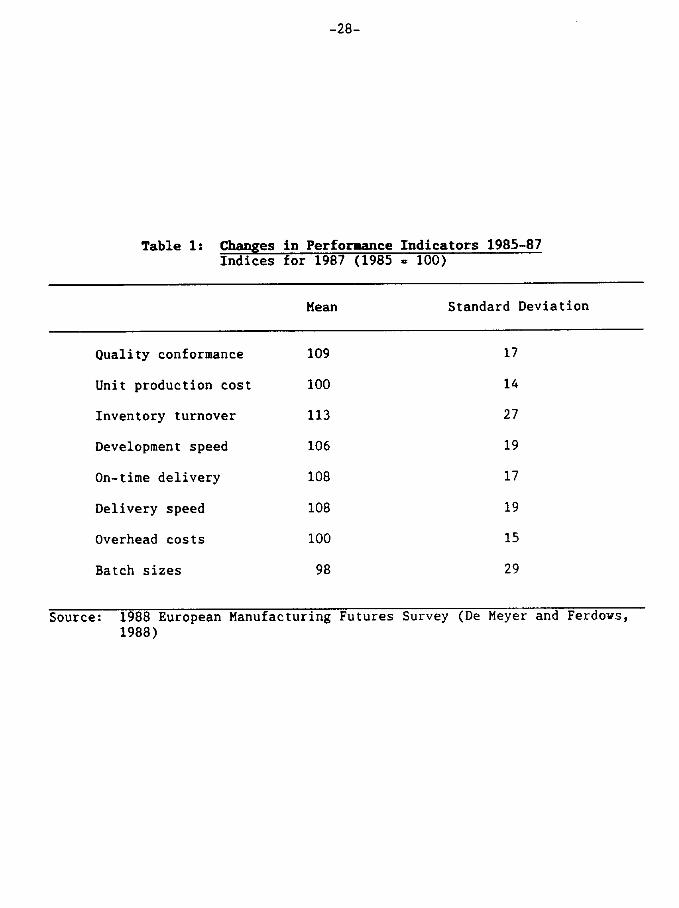
Two specific sets of data from this survey are analyzed here. The first set
is the change in eight performance indicators between 1985 and 1987. The
respondents were asked to take 1985 as a base year for each of the
performance indicators listed in Table 1 and give their perception of how
much it changed by the end of 1987. Table 1 shows the sample means and
standard deviations for each of the eight. For example, a score of 109 for
quality (conformance to design) means that from 1985 to 1987 quality was
perceived to have improved by 9%. In total 167 respondents filled out this
question.
1. The European Manufacturing Futures project is part of a larger project,the "Global Manufacturing Futures Project", administered in NorthAmerica by J.G. Miller and A. Roth (Boston University), in Japan by J.Nakane (Waseda University, Tokyo), and in Europe by K. Ferdows and A. DeMeyer (INSEAD, Fontainebleau).
-7-
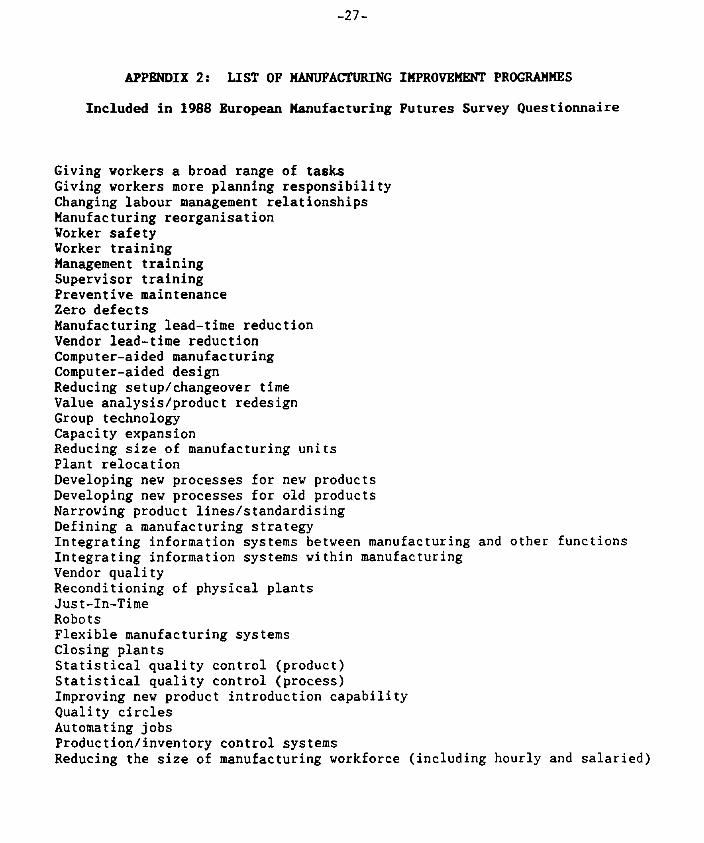
Second, we used the data on specific improvement programmes in manufacturing
recently implemented by the respondents. A list of 39 specific improvement
programmes was given in the questionnaire and the respondents were asked to
indicate the ones which they had greatly emphasized in the previous year.
The full list of these programmes is shown in Appendix 2.
The Tradeoff Modal
As mentioned earlier, most of the literature on the development of strategic
manufacturing capabilities is based on the paradigm of necessity to focus on
a particular capability out of the many possible. The generic capabilities
often mentioned in the early works of Skinner (1966, 1978), Hayes &
Wheelwright (1984), Schmenner (1987), among others, have been cost
efficiency, quality, dependability, and flexibility. More recent authors
have redefined or expanded the list of alternative capabilities, but the
necessity to choose and to focus one's efforts and resources on a limited
set of capabilities (essentially one of the generic four) has remained
unchanged.
According to this paradigm, the high performing manufacturing companies
would obtain a higher improvement for one of the manufacturing capabilities,
while remaining at a stable level (or an even deteriorated level) for the
rest. For example, a well performing manufacturing company which opts for a
strategy based on flexibility, would improve its flexibility, eventually to
the detriment of its cost efficiency or its delivery dependability.
Similarly, an emphasis on quality would lead to an improvement on a quality
indicator, but might work out negatively when it coures to design or volume
flexibility.

If this "tradeoff theory" is correct, then one should find most
manufacturers improving only one type of capability and smaller numbers two
or more. More specifically, the frequency of the number of performance
indicators simultaneously improved should follow a negative exponentiel
distribution.
To test this hypothesis, we turn to the data on the change of eight
performance indicators in 1985-87 (Table 1). The first thing to do is to
translate these eight measure to the four generic capabilities. This turns
out to be a rather straightforward task because we find that performance
indicators within the four broad categories are indeed highly correlated
(Table 2). Improvements in delivery speed and delivery dependability, for
example, are highly correlated. The same is true for improvements in unit
cost and overhead cost. One would expect companies which have focused on
cost efficiency as their key manufacturing capability to have improved on
both unit cost and overhead costs. The rest of the correlations can be seen
in Table 2.
Insert Tables 1 & 2 here
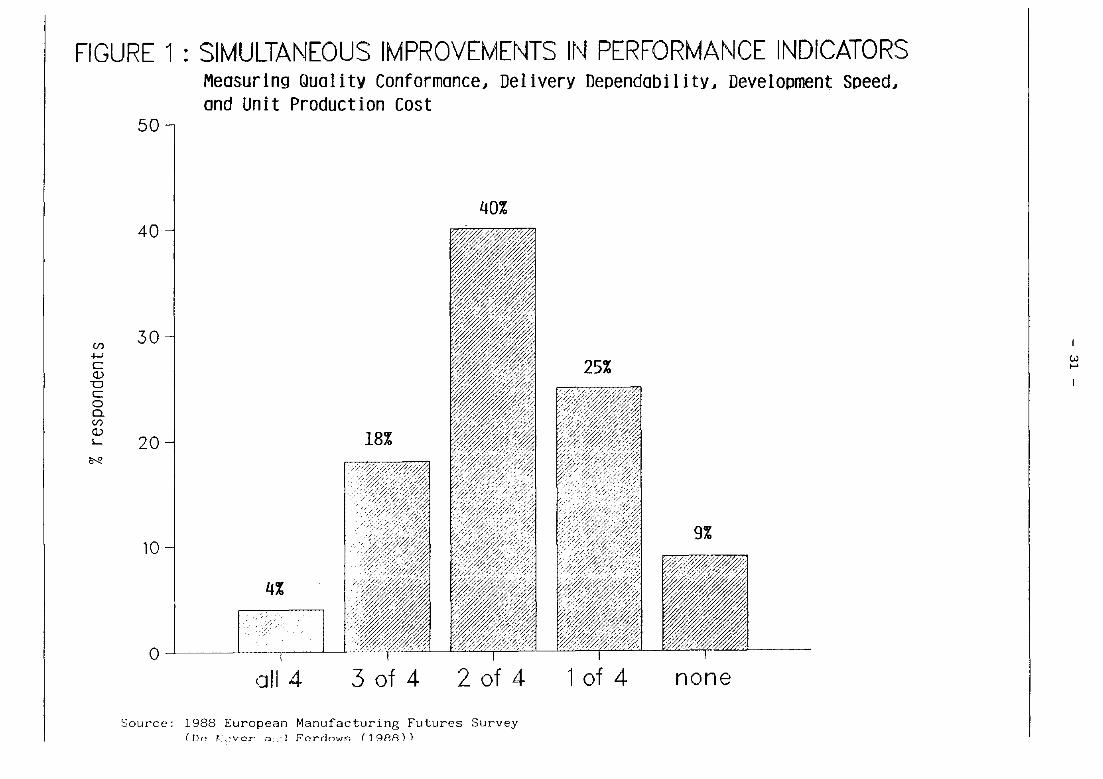
So to test the hypothesis derived from the "trade-off theory", we chose four
mutually independent indicators which represent the total group of eight
indicators, and which are also close to the traditional four categories of
cost efficiency, quality, flexibility and delivery dependability. The four
were unit manufacturing cost, quality conformance, speed of new product
introduction, and delivery dependability.

-9-
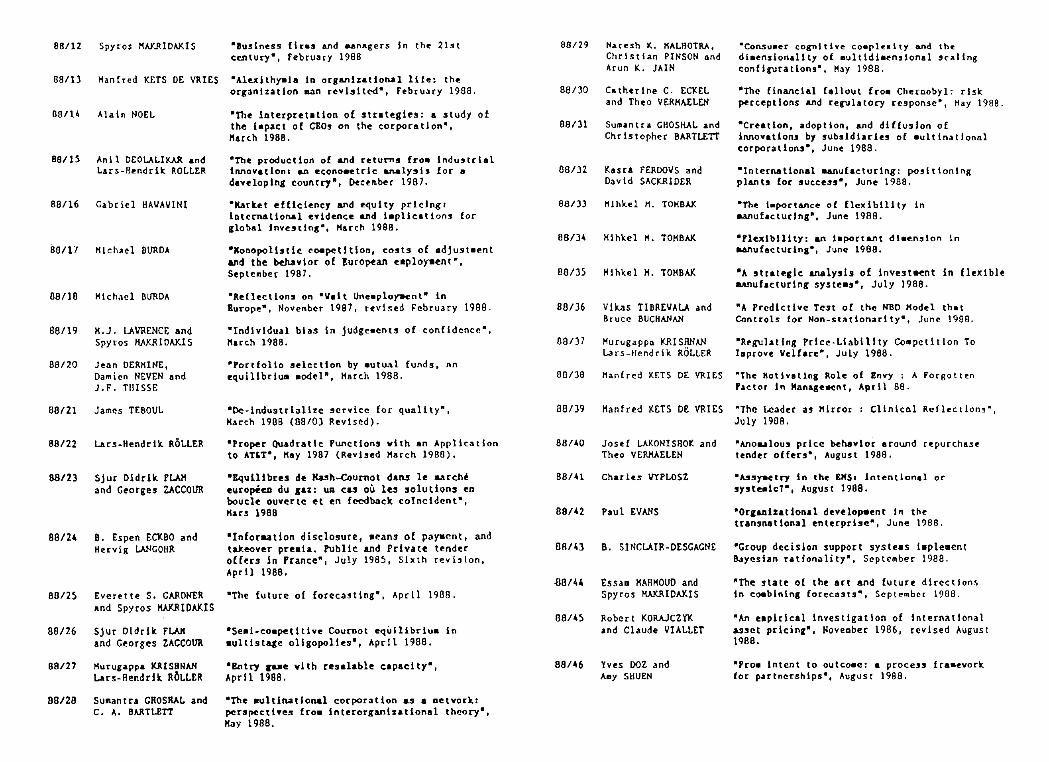
Figure 1 shows the number of respondents corresponding to improvement in
none, one, two, three or all four of these performance indicators. If we
leave out the category of companies which improved none of the four
indicators, the tradeoff theory would have predicted that the group of
companies which have improved on one out of four measures would be the most
numerous. This hypothesis has to be rejected! Indeed, a large majority
(62%) improved on more than one indicator, most of them having ameliorated
their performance on two of the mutually independent indicators.
Insert Figure 1 about here
We can see two possible explanations for these results. Either the
companies which improved performance on more than one measure are paying for
that elsewhere (and we are not capturing where in our analysis), or the
trade off theory itself has to be modified. The first explanation does not
fit the rest of the data. As it is clear from Appendix 1, the companies
which participate in the survey tend to be biased towards the better
performing companies in terms of growth and profits. Their departure from
conventional practices should raise new questions and not be written off
against unknown or unmeasured factors. So it would be prudent to question
the trade-off theory itself.
-10-
The Cumulative Model
A few years ago Jinichiro Nakane proposed that the Japanese manufacturers
follow a rather specific sequence for building manufacturing capabilities
(Nakane (1986)): "In general, if some [Japanese] companies want to offer
'Fiexibility' as a competitive priority, it is necessary that at least they
have already qualified for a minimum level of abilities on quality,
dependability and cost improvement. If they have not such an ability, they
get a chaos condition and end tragically." On the basis of his experience
with Japanese companies and a survey similar to the European Manufacturing
Futures administered in Japan, he suggested a cumulative model with quality
improvement as the basis of all other improvements, followed by
dependability (see also Ferdows, et al (1986)). Accordingly to this model,
one should only improve on dependability if the quality level in the company
has reached a critical level. Mis sequence continues by asserting that
quality and dependability improvements are pre-conditions to cost efficiency
improvements; cost efficiency becomes almost a consequence of quality and
dependability improvements; finally, flexibility improvements can only be
obtained if a company has its quality, dependability and cost efficency
under control. This model has been documented further in De Meyer, et al
(1989).
In our own research, we have modified this model. Though we accept that
cost improvements will remain the ultimate goal of most manufacturers, we
see these cost improvements also as an ultimate consequence of resources and
management efforts invested in the improvement of quality, dependability and
reaction speed of the company. The sequence we see is the following. A pre-
condition to all lasting improvements are improvements in the quality
performance of the company. Once the company has reached a critical level
of improvement in quality, it can tackle issues of dependability. However,

this should not constrain further improvements in quality. In other words,
improvements in dependability will require continuous improvement in
quality. Once a critical level of dependability is reached, the company can
attempt to improve its manufacturing reaction speed. This reaction speed is
to us the symptom of a company's flexibility. It can be the company's
ability to react quickly to new customer requirements, change production
volumes rapidly, introduce new products faster, etc. Again, investments of
management efforts and resources in reaction speed should not lead to a loss
of attention in the areas of quality and dependability. Improvements in
speed should be built cumulatively upon the foundations of quality and
dependability. Once, and only once, the company has obtained a critical
mass of improvements in these three areas, can it improve in a lasting way
its cost positions. Lasting cost improvement programmes ultimately should
and can only be built upon improvements in the other areas.
;le have sometimes depicted this cumulative model as a sandcone with
different layers (Figure 2). The sand is, in this case, a stand-in for
management effort and resources. To obtain a stable sandcone, one has to
create first a stable foundation of quality improvements. Upon such a
foundation, one can put layers of dependability, speed and cost
improvements. This analogy helps us explain two characteristics of our
model. It shows the cumulative character of the capabilities: one can build
only a second layer if the foundation is there. It also clarifies the fact
that working on speed or cost efficiency does not reduce the need to work on
quality. Indeed, to improve cost efficiency (i.e. building a higher cone),
it is necessary to put a lot more resources at the base capabilities.
Insert Figure 2 here
-12-
An obvious criticism of this model is that we seem to throw overboard all
contingencies. The model seems to suggest that there is only one best way
to achieve a multiple set of manufacturing capabilities. To some extent,
this is indeed our belief. Our model is based on the general theory that
manufacturing capabilities can be developed cumulatively, and when they do
they are more lasting. We propose that there is a preferred sequence of
allocating resources to achieve that. This may seem to be calling for too
much uniformity in managing manufacturing, but the concepts of quality
(Garvin, 1987), flexibility (Swamidass and Newell, 1987) or dependability
(Jaikumar, 1986) are so broad that the individuel company can clearly
differentiate itself from its competitors by choosing its own combination of
quality, dependability, speed and cost efficiency programmes.
Applying the Sandcone Model
If our sandcone model is true, then the programmes for improvement of
quality should be associated with improvements in the largest number of
performance indicators--not only with those directly related to quality
itself, but also those related to dependability, flexibility and cost
efficiency. The programmes related to improving the dependability of the
production process--making deliveries more reliable, learning more about the
process and generally making the production more reliable and predictable--
should have the second most, and so on with the cost improvement programmes
to show only results in improved cost efficiency and not the other
capabilities.
To test this hypothesis, for each performance indicator we first compared
the improvement programmes undertaken by two groups of companies: those
which had achieved above average improvement for that indicator, with those

-13-
who had not improved performance along that indicator at all. (To sharpen
the analysis, we excluded the middle group, i.e., those companies which had
improved performance on the indicator below sample average.)
Let us take the quality conformance as an example. The first group
consisted of those companies who had a 1987 rating of above 109 (average);
the second group consisted of those with 1987 conformance indicator of equal
or less than 100. (The excluded group consisted of companies with ratings
hetween 100 and 109).
Turning to the second set of data described earlier, we then examined the
recent improvement programmes undertaken by each group. The objective was
to identify along which of the 39 specific improvement programmes (list in
Appendix 2) the two groups differed. And this was to be done for each of
the eight performance indicators.
Insert Table 3 here
Table 3 shows for each performance indicator the list of the programmes in
which the two groups had significant differences. By "significant" we mean
a confidence level of at least 95% that each of these programmes had been
emphasized by one group more than the other (as shown). It is reasonable to
assume that better or worse performance on the specific indicator was
(partly) due to the emphasis (or its lack) of the particular programmes
listed in Table 3. These are the programmes which "made a difference".

-14-
Careful reading of Table 3 provides support for the cumulative theory. The
programme which shows an impact on the largest number of performance
indicators is the "zero defect". The "better-than-average" performers in
quality conformance, in on-time delivery, in speed of new product
development, and in inventory turnover have all emphasised zero-defect
programmes significantly more than the "worse-than-before" group. The
effect of this clearly quality improvement programme is not just in
improving quality conformance, but also in a dimension of dependability (on-
time delivery), and flexibility (development speed, and one may include
inventory turnover here as well as a measure somewhere between flexibility
and cost efficiency).
Other quality improvement programmes also exhibit the same multiple impact,
although not as much as zero-defect. Statistical quality control of process
not only improves quality conformance (as one would expect) but it also
improves unit production cost. Programmes for improving vendor quality, not
only improve quality conformance, but also the speed of new product
development.
These are evidence that the quality improvement programmes have far reaching
effects; they allow the company to achieve better performance along several
measures--some of which, like improving development speed, could have been
considered as unlikely according to the tradeoff theory.

-15-
Our evidence for the remaining layers, unfortunately, is scant. This is
partly due to the fact that our questionnaire vas not really designed for
testing our cumulative model; most of the other 39 improvement programmes
listed there can be interpreted to aim for a hybrid of quality,
dependability, flexibility, and cost-efficiency. A second problem is that
there may be a long time lag between embarking on some of the improvement
programmes and the Lime they show actual performance improvements.
Nevertheless, certain patterns can still be discerned. For example, "giving
workers more planning responsibility" can be argued to aim at a hybrid of
quality and dependability. The results in Table 3 show that both quality
and on-time delivery improve when this programme is emphasized, but
interestingly enough, not the unit production cost. This may look
disappointing, unless we take the interpretation offered by our model
According to this interpretation, giving the workers more planning
responsibilities has more immediate effects on quality and dependability
(two adjacent base layers of our model), but it will be a while before it
works its way up to cost efficiency. This interpretation implies that chose
who are emphasizing this programme are doing so, not because they have
accepted a bit of inefficiency in costs, but because they are convinced that
in the long-run costs will corne down.
Another pair of programmes in Table 3, "integration of information systems
in manufacturing" and "integration of information systems across functions",
deserve attention. Emphasis of the former seems to improve the speed of new
product introduction; emphasis of the latter seems to reduce delivery speed
and inventory turnover.

-16-
How can this be explained? Why should delivery speed and inventory
turnover, which are usually a more direct aim of such programmes, be
decreased and speed of new product introduction, which is a more indirect
aim, be increased? Ve can try many explanations ranging from poor project
management and irrational choice of computerized systems--resulting in
information overload and confusion in certain areas--to attributing the
oddity of these observations to the limitations inherent in questionnaire
surveys and small semples. But a partial explanation--albeit that is has
small plausibility--can also be provided by our sandcone model. Perhaps what
we are observing is an indication that the average company in our semple
engaged in implementation of these information systems, having achieved some
flexibility (i.e. faster introduction of new products), must now avait for
cost efficiency results (proxied by inventory turnover ratio) to improve.
If one accepts this explanation, there is an interesting corollary. Though
performance improvements are cumulative, it does not mean that they are
simultaneous. To see the cumulative effects of improvements in quality or
dependability or reaction speed on cost efficiency, one needs time. One
needs to have some tolerance for the cost efficiency improvement to come
through.
The interested reader might make other observations from Table 3, some of
which may not be directly relevant to the thesis of this paper. Our own
conclusion is that, although we are far short of "proving" the universal
applicability of our sandcone model, there is enough evidence to justify
questioning the existing tradeoff paradigm and searching for a new
cumulative theory in the direction we are suggesting.
-17-
New Perspective on Manufacturing Performance
The cumulative theory provides a new perspective with which to judge
achievements in manufacturing performance. Let us examine two cases as
examples. First, if a company reports better manufacturing costs but worse
quality, delivery dependability and/or flexibility, our sandcone model
suggests, a priori, that this cost reduction has not been due to lasting
improvements in the manufacturing capabilities of the company. It suggests
that the cost reduction may have been due to other reasons such as increased
out-sourcing, benefits from foreign exchange fluctuations, temporary cuts in
overheads and investment programmes, "milking" the existing resources
without rejuvenating them, or changes in accounting practices. Ail these
have essentially little to do with how well production is managed in the
company. The trade-off theory, in contrast, would raise no such questions a
priori.
Second, assume two companies report faster introduction of new products
through manufacturing; one does that with lover production costs but poorer
quality, and the other with better quality but poorer costs. Everything
else is the same for the two companies. Which one is building more lasting
manufacturing capabilities? Our sandcone model suggests the latter, whereas
the tradeoff model takes no position, a priori. Again, the reason is in the
specific sequence of improvements proposed in the model.
These examples are illustrations of many other situations where the same
observation interpreted by the tradeoff or cumulative theories can lead to
almost opposite conclusions.

-18-
We realise that what we are asserting is fairly radical. Therefore, to
avoid any possible confusion, perhaps it is useful to point out once again
exactly what our sandcone model proposes. To begin with, it does not deny
existence of tradeoff among generic manufacturing capabilities; all it
suggests is that the nature of tradeoff relationships is contingent upon the
approach. For example, cost and quality are traded off against each other
if the attention is put on the cost; however, they both improve if the
attention is put on quality.
Next, with our sandcone model we suggest a specific pattern of capability
enhancement which changes the traditional tradeoffs among the generic
manufacturing capabilities--in Tact, reverses them. Indeed, if one goes
back to some of the older paradigms of production management, or "common
sense" theories in management, one will discover that implicitly cost
efficiency was often seen as a prerequisite to allowing investments in
quality, dependability or flexibility. Our sandcone model proposes
precisely that lasting cost improvements can only be the result of
cumulative improvements in the other areas. By reversing the order of
cumulative manufacturing capabilities, deeper, more lasting manufacturing
capabilities are built up.
Finally, our model is dynamic in nature. It focuses on continuous changes
in the performance and not on the base value. Even if a company might be
producing already at a high quality, to continue to enhance its
manufacturing capability, it will have to continue to improve its quality
performance. The model suggests that for every increase in cost efficiency
or flexibility, a supplementary effort in quality will be needed. Regardless
of its level, for every lasting marginal improvement in one capability, a
similar improvement in the underlying capabilities will be required.

-19-
In practice, probably only a few companies follow the pattern of resource
allocation prescribed by our sandcone model exactly. Even the performing
manufacturing companies, such as the respondents to our 1988 European
Manufacturing Futures Survey (Appendix 1), are probably following a hybrid
of various patterns. Using our model as a gauge, we can make a rough
assessment of the build up of lasting manufacturing capabilities.
To illustrate this point, we performed another analysis on the first set of
data from the 1988 European Manufacturing Futures Survey. We vent back to
the four mutually independent'performance measures described earlier. These
four were quality conformance, delivery dependability, speed of new
production development, and unit manufacturing cost. You may recall that we
chose these four because they represented the available eight performance
indicators well and because each corresponded rather closely to the generic
manufacturing capabilities of quality, dependability, flexibility and cost
efficiency.
For our analysis, we chose to examine the group of respondents who had
reported improvement in performance for at least two of the four quality,
delivery, speed, and cost indicators. This group consisted of 102 companies
(62% of the semple). We then calculated the frequency which each of the
four indicators happened to be among those improved. If quality was the
most frequent, followed by delivery, followed by speed, and with cost
improvements the least frequent, then this semple of European companies
would be building up lasting manufacturing capabilities according to our
model.
Insert Figure 3 here

-20-
The results are shown in Figure 3. Cost and Delivery happen to be more
frequently the measures improved and in fact quality the least frequent.
Looking at this positively, one may conclude that at least some work towards
the build up of lasting capabilities by companies in this sample is going
on; however, viewing it negatively, one has to conclude that until the
proportions change--with quality improving more frequently than the rest,
etc., many of the achievements are not based on deep and lasting enhancement
of manufacturing capabilities.
CONCLUSION
If we accept that the development of one manufacturing capability need not
be necessarily at the expense of another, then we should re-examine a)
traditional managerial approaches for improving manufacturing performance,
and b) the long-term role of manufacturing in the competitive strategy of
the firm.
Most of the traditional managerial approaches for improving manufacturing
performance is based on the tradeoff theory. We are suggesting the tradeoff
theory does not apply in all cases. Certain approaches change the tradeoff
relationship into a cumulative one--i.e., one capability is built upon
another, not in its place.
Moreover, we are suggesting that under these conditions, every layer of
capability requires continuous attention; one never leaves the necessity of
investing in the "basics" of production. In fact, the higher and fancier
the capability sought, the more enhancement from the bottom layer of
capability up is required. (It is like building up bigger sandcones by
pouring on more sand).

-21-
Ail this stands even if we have erred on the last part of what our model
prescribes. We suggest that the approach which avoids tradeoffs and ensures
cumulative buildup of manufacturing capabilities in the long run is one
which in broad terras focuses on quality first, then quality and
dependability, then quality, dependability and flexibility, and finally on
all three plus cost efficiency. This sequence builds up lasting and deep
manufacturing capabilities.
Applying this model requires a long-terra approach, tolerance, and patience.
It requires believing that costs will eventually corne down. The important
thing is to have bench-marks to check whether the company is on the right
track. Our model is rather specific in this respect. If performance in the
generic capabilities of quality, delivery, flexibility and cost efficiency
is progressively improving (i.e., none of the earlier ones regress or stay
stagnant when a later one improves), then the company is on the right track
in building lasting manufacturing strength.
Capabilities built in this way become formidable competitive weapons; they
cannot be easily or quickly matched by competitors. Embarking on this
course requires a commitment to expand the role of manufacturing in the
competitive strategy of the company.

-22-
REFERENCES
Crosby, P.B. Quality is Free. New York: McGraw-Hill, 1979.
De Meyer A., K. Ferdows. "Quality Up, Technology Down." INSEAD Working
Series No. 88/65, 1988.
De Meyer A., J. Nakane, J.G. Miller, K. Ferdows. "Flexibility, the Next
Competitive Battle." Strategic Management Journal (forthcoming 1989).
Deming, W.E. Quality, Productivity and Competitive Position, Cambridge: MIT
Center for Advanced Engineering Study, 1982.
Ferdows K., J.G. Miller, J. Nakane, T.E. Vollmann. "Evolving Global
Manufacturing Strategies: Projections into the 1990's." International
Journal of Operations and Production Management, vol. 6, no. 4, 1986, 6-16.
Garvin D. Managing Quality. New York: Free Press, 1987.
Hayes R.H., S.C. Wheelwright. Restoring our Competitive Edge: Competing
Through Manufacturing. New York: John Wiley, 1984.
Jaikumar R. "Postindustrial Manufacturing." Harvard Business Review, vol.
64, no. 6, November-December 1986, 69-76.
Juran J.M., F.M. Gryna, R.S. Bingham. Quality Control Handbook. New York:
McGraw Hill, 1974.

-23-
Miller J.G., A. Amano, A. De Meyer, K. Ferdows, J. Nakane, A. Roth. "Closing
the Competitive Gaps." In Ferdows K., Managing International Manufacturing,
Amsterdam: North Holland, 1989.
Nakane J. Manufacturing Futures Survey in Japan, a Comparative Survey 1983-
1986. Tokyo: Waseda University, System Science Institute, May 1986.
Schmenner R.W. Production/Operations Management. 3rd ed. Chicago: Science
Research Associates, 1987.
Skinner W. "Production under Pressure." Harvard Business Review, vol. 44,
no. 6, November-December 1966, 139-145.
Skinner W. Manufacturing in the Corporate Strategy. New York: John Wiley,
1985.
Skinner W. "The Productivity Paradox." Harvard Business Review, vol. 64,
no. 4, July-August 1986, 55-59.
Swamidass P.M., W.I. Newell. "Manufacturing Strategy, Environmental
Uncertainty and Performance: a Path Analytic Model." Management Science,
vol. 33, no. 4, April 1987.

-24-
APPENDIX 1: DESCRIPTION OF THE SANPLE
In 1988, we received 187 answers out of 850 questionnaires mailed. The 187
responding companies are from 14 European countries, and, on the basis of a
two-digit Standard Industrial Code, can be classified in 19 industrial
groups. The responding semple is therefore from a large variety of
industries and countries but it is not biased towards a particular industry
nor geographical region.
The unit of analysis (called "business unit"), for which most of the
questions were answered, was chosen by the respondents: 39% answered for an
entire company, 41% for a division or group and 20% for a plant.
The average European respondent is from a large, profitable, growing,
internationally operating business unit which tends to be the market leader
for its primary product or product family (Table Al).
Not all respondents were profitable and growing; 6% reported a loss for the
last fiscal year, and 8% a negative growth.
The typical business unit makes 55% of its sales through its primary product
or product family. A large share of its total sales, 28%, is coming from
products which are on offer for less than two years; in three years' time
this proportion is expected to reach 33%.

-25-
Manufacturing is important to the respondents: on the average, the current
manufacturing cost is 65% of the business unit's sales. The medians of the
components of these costs are shown in Table A2. (We show the medians to
minimise the bias caused by the "outliers").
The average total number of people employed by the business units is 4 585.
The distribution of this number is highly skewed. The median is only 840.
This median is expected to rise to 943 in two years' time. Since we assume
that this does not reflect a trend towards a reduction of the capital
intensity of the business units, this must be an indication of the intention
to grow, and perhaps of a general impression of optimism which characterises
the average manufacturer in our sample this year. The median direct labour
component of the workforce is 300 or 36% of the total labour force.
Ail these numbers tend to indicate that the average respondent is a large,
profitable and growing business unit, for which the manufacturing function
plays an important role nov and is expected to do so in the future. It is
depending primarily on its internai resources to introduce more nev products
and expand its market share. In general, it is fairly optimistic about
future growth and markets.

-26-
Table Al: Characteristics of the respondents
Median of annual sales revenues ECU 1,219,929,000
Average pre-tax return on assets 16.4%
Average pre-tax profit as a Z of sales 7.8%
Average market share of primary product 26.5%
Average market share of main competition 22.8 %
Average growth rate (units sold) 11.3%
Average number of countries in which therespondent has plants 2.3
Table A2: Median current and expected cost structure
Current Expected in2 years' time
Total manufacturing costs as a % of sales 65% 62%
R&D expenses as a of sales 3%
Allocation of manufacturing costs to:
- materials 58% 56%- direct labour 15% 15%- energy 3% 3%- manufacturing overheads
of which:20% 20%
- indirect salaries, wages, fringes 50%- depreciation & facilities expenses 20%- corporate allocations 15%- other 16%
Note: Since these numbers are the medians, they do not necessarily add upto 100.
-27--
APPENDIX 2: LIST OF MANUFACTURING IMPROVEMENT PROGRAMMES
Included in 1988 European Manufacturing Futures Survey Questionnaire
Giving workers a broad range of tasksGiving workers more planning responsibilityChanging labour management relationshipsManufacturing reorganisationWorker safetyWorker trainingManagement trainingSupervisor trainingPreventive maintenanceZero defectsManufacturing lead-time reductionVendor lead-time reductionComputer-aided manufacturingComputer-aided designReducing setup/changeover timeValue analysis/product redesignGroup technologyCapacity expansionReducing size of manufacturing unitsPlant relocationDeveloping new processes for new productsDeveloping new processes for old productsNarrowing product lines/standardisingDefining a manufacturing strategyIntegrating information systems between manufacturing and other functionsIntegrating information systems within manufacturingVendor qualityReconditioning of physical plantsJust-In-TimeRobotsFlexible manufacturing systemsClosing plantsStatistical quality control (product)Statistical quality control (process)Improving new product introduction capabilityQuality circlesAutomating jobsProduction/inventory control systemsReducing the size of manufacturing workforce (including hourly and salaried)
-28-
Table 1: Changes in Performance Indicators 1985-87Indices for 1987 (1985 . 100)
Mean Standard Deviation
Quality conformance 109 17
Unit production cost 100 14
Inventory turnover 113 27
Development speed 106 19
On-time delivery 108 17
Delivery speed 108 19
Overhead costs 100 15
Batch sizes 98 29
Source: 1988 European Manufacturing Futures Survey (De Meyer and Ferdows,1988)

Table 2: Correlation betveen the performance indices
Unit
Inventory Development On-tics Delivery
Overhead
BatchProduction Turnover Speed
Delivery Speed
Costs Sires
.04Quality conformance
Unit production cost
Inventory turnover
Development speed
On-time delivery
Delivery speed
Overheed costs
.08 .19** .17* .09 .06I
-.01 -.08 -0.14 -.10 .28** -.0 IV(0
- .01 .21** .22** .08 I
- .29** .27** .05 .1
- .51** .02 .0
- .03 .1
- .0
** p < 0.01* p <0.05
Source: 1988 European Manufacturing Futures Survey (De Meyer L Ferdovs, 1988)
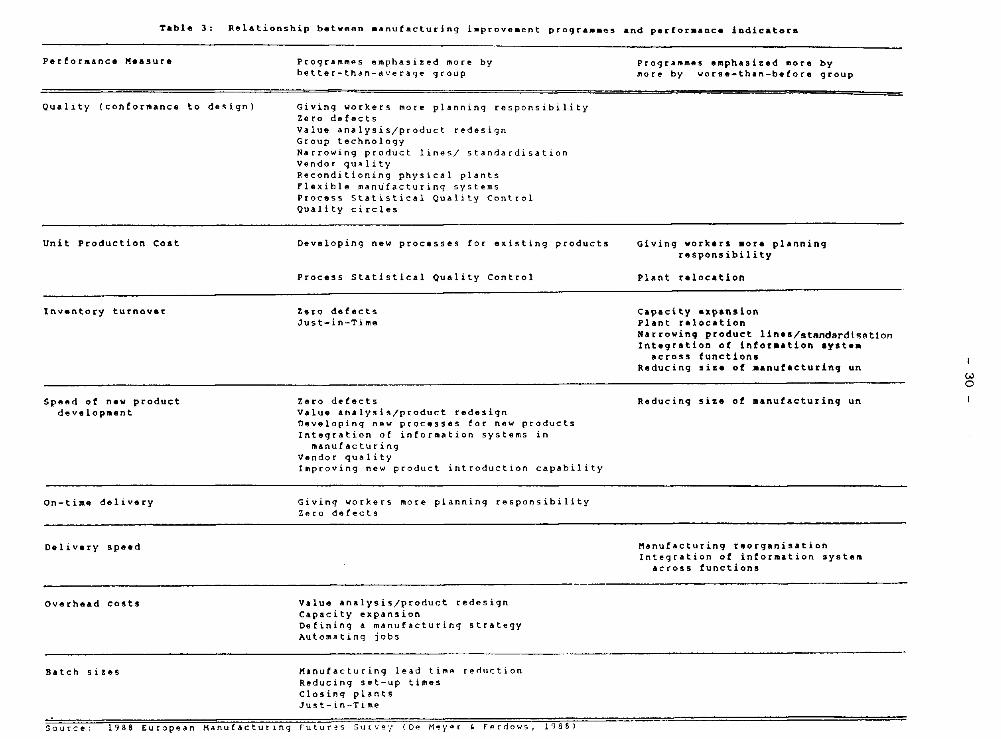
Table 3: Relationship between ■enufacturing improvement programmes and performance indicatora
Performance Measure
Programmes emphasized more by Programmes emphasized more bybetter-than-average group more by worse-than-before group
Quality (conformante to design) Giving workers more planning responsibility
Zero defects
Value analysis/product redesign
Group technology
Narrowing product lines/ standardisation
Vendor quality
Reconditioning physical plants
Flexible manufacturing systems
Process Statistical Quality Control
Quality circles
Unit Production Cost
Developing new processes for existing products Giving workers more planningresponsibility
Process Statistical Quality Control Plant relocation
Inventory turnover Zero defects
Jus t-in-Time
capacity expansionPlant relocationNarrowing product Unes/standardisationIntegration of information syste■across functions
Reducing sise of manufacturing unÇaO
Speed of new product
development
Zero defects Reducing size of manufacturing unValue analysis/product redesign
Developing new processes for new products
Integration of information systems in
manufacturing
Vendor quality
Improving new product introduction capability
On-time delivery Giving workers more planning responsibility
Zero defects
Delivery speed
Manufacturing réorganisation
Integration of information systemacross functions
Overhead comte
Value analysis/product redesign
Capacity expansion
Defining a manufacturing strategy
AutomatIng jobs
Batch sites
Manufacturing lead time reduction
Reducing set-up times
Closing plants
Just-in-TIme
Source: 1988 European Manufacturing Futures Survey (Do Meyer c Ferdows, 19881
all 4 none3 of 4 2 of 4 1 of 4
FIGURE 1 : SIMULTANEOUS IMPROVEMENTS IN PERFORMANCE INDICATORSMeasuring Quality Conformance, Delivery Dependability, Development Speed,
and Unit Production Cost
Source: 1988 European Manufacturing Futures Survey(ne UHver FerdowF: (1002)1
40%
25%
9%

COST EFFICIENCY
w
SPEED
DEPENDABILITY
QUALITY
FIGURE 2: DEVELOPMENT OF LASTING MANUFACTURING CAPABILITIES
THE SANDCONE MODEL

5 151 0 2 520 30 35 %
FIGURE 3 : FREQUENCY OF IMPROVEMENT IN EACH PERFORMANCE INDICATORif at Ieast two measures improved chance of one being
Source: 1988 European Manufacturing Futures Surv.^y(n, m-,,, 110fie711
quality
30%
30%
co s t
speed
delivery
e,7/e/ /zeze,
23%
.e/
"';//,//e:
16%

INSEAD VORKING PAPUS SUIES
1986
86/01 Arnoud DE MEYER
86/02 Philippe A. NAERTMarcel VEVERBERGUand Guido VERSVIJVEL
86/03 Micheel BRIMM
86/04 Spyros MAKRIDAKISand Michèle HIBON
86/05 Charles A. VYPLOSZ
86/06 Francesco CIAVAllI,Jeff R. SUER andCharles A. VYPLOSZ
86/07 Douglas L. MacLACHLANand Spyros MAKRIDAKIS
86/08 José de la TORRE andDavid H. NECKAR
86/09 Philippe C. OASPESLAGH
86/10 R. MOENART,Arnoud D8 MEYER,J. BARBE andD. DESCHOOLMEESTER.
86/11 Philippe A. NAERTand Alain BULTEZ
86/12 Roger BETANCOURTand David GAUTSCHI
86/13 S.P. ANDERSONand Damien J. NEVEN
86/14 Charles VALDMAN
' The R D/Production interface".
"Subjective estimation in integratingcommunication budget and allocationdecisions: • case study", Januery 1986.
' Sponsorship and the diffusion oforganisational Innovation: a preliminary viev'.
*Confidence Intervals: an eapiricalInvestigation for the séries in the M-Coalpetition° .
"A nota on the réduction of the vorkveek",July 1985.
"The vtol 'archange rate and the fiscalaspects of • naturel resource discovery",Revised version: February 1986.
'Judg.antal blases in sales forecasting',February 1986.
"Forecasting political risks forinternational opérations', Second Draft:!farcit 3, 1986.
"Conceptualising the otrategic process indiversified ficus, the rola and nature of thecorporate influence procese, February 1986.
"Analysing the issues concerningtechnological de-maturity".
' From "Lydiametry° to "Pinkhamization":■ isspecifying advertising dynaaics rarelyaffects profitability'.
"The economics of retail firme, RevlsedApril 1986.
'Spatial coepetition à la Cournot'.
°Comparaison internationale des marges brutesdu commerce • , June 1985.
86/16 B. Espen ECKBO andHervig M. LANCOHR
86/17 David B. JEMISON
86/18 James TEBOULand V. MALLERET
86/19 Rob R. VEITZ
86/20 Albert CORHAY,Gabriel HAVAVINIand Pierre A. MICHEL
86/21 Albert CORNAI,Gabriel A. HAVAVINIand Pierre A. MICHEL
86/22 Albert CORHAY,Gabriel A. HAVAVINIand Pierre A. MICHEL
86/23 Arnoud DE MEYER
86/24 David CAUTSCHIand Vlthala R. RAO
86/25 H. Peter GRAYand Ingo VALTER
86/26 Barry EICHENGREENand Charles VYPLOSZ
86/27 Karel COOLand Ingemar DIERICKX
86/28 Manfred KETS DEVRIES and Danny MILLER
86/29 Manfred KETS DE VRIES
86/30 Manfred KETS DE VRIES
86/31 Arnoud DE MEYER
86/31 Arnoud DE MEYER,Jinichiro NAKANE,Jeffrey G. MILLERand Kasra FERDOVS
' Les prises des offres publiques, la noted'information et le marché des transferts decontrôle des sociétés".
"Strategic capability transfer in acquisitionintegration", May 1986.
"Tovards an operational definitlon ofservices', 1986.
"Nostradamus: • knovledge-based forecestingadvisor".
' The pricing of equity on the London stockexchange: seasonality and sise pre■luae,June 1986.
"Risk-preate seasonality in U.S. and Europeanequity intacte, February 1986.
"Seffoonality in the risk-return relationshipssoue international évidence", July 1986.
*An exploratory study on the integration ofinformation systems in manufacturing°,July 1986.
"A methodology for spécification andaggregetion in product concept testing",July 1986.
"Protection*, August 1986.
"The economic consequences of the FrancPoincare, September 1986.
"Megetive riok-return relationships inbusiness strategyt paradox or truis■?",October 1986.
' Interpreting organixational tests.
' Vhy follov the leader?'.
' The succession gamet the real story.
' Flexibility: the next competitive berne',October 1986.
' Fiexibility: the next competitive bettle°,Revised Version: March 1987
86/15 Mihkel TOMBAK andArnoud DE MEYER
"11ov the managerial attitudes of firme vithFMS differ from other aanufacturing tiras:surver results'. lune 2986.
86/32 Karel COOLand Dan SCHENDEL
Performance differences lamons strategic groupmembers", October 1986.

1987
87/01 Manfred KETS DE VRIES "Friaoners of leadership".
87/02 Claude VIALLET
"An eupirical investigation of internationalesset pricing", November 1986.
87/03 David GAUTSCHIend Vithale RAO
87/04 Sumantra CHOSHAL andChristopher BARTLETT
87/05 Arnoud DE MEYERand Rasra PERDONS
oA methodology for apecification andaggregation in product concept testing",Revised Versions January 1987.
"Organizing for innovations: case of themultinational corporation", February 1987.
"Managerial focal points in manufacturingstrategy*, February 1987.
86/33 Ernst BALTENSPERGERand Jean DERMINE
'The role of public policy in insuringfinancial stability: a cross-country,comparative perspective', August 1986, RevisedNovember 1986.
87/06 Arun K. JAIN, 'Customer loyalty as e construct in theChristian PINSON and marketing of banking services", July 1986.Naresh K. MALHOTRA
86/34 Philippe HASPESLAGHand David JEMISON
86/35 Jean DERMINE
86/36 Albert CORRAY andGabriel HAVAVINI
86/37 David GAUTSCHI andRoger BETANCOURT
86/38 Gabriel HAVAVINI
86/39 Gabriel HAVAVINIPierre MICHELand Albert COREA'?
86/40 Charles VYPLOSZ
86/41 Kesra FERDOVSand Vickham SKINNER
86/42 Kasra FERDOVSand Per LINDBERG
86/43 Damien NEVEN
86/44 Ingemar DIERICKXCarmen MATUTESand Damien NEVEN
"Acquisitions: myths and reality",July 1986.
"Measuring the market value of e bank, eprimer", November 1986.
"Seasonality in the risk-return relationshipssonie international evidence, July 1986.
"The evolution of retailing: • suggestedeconaeic interpretation".
oFinancial innovation and recent developmentsin the French capital markets", Updated:September 1986.
*The pricing of coemon stocks on the Brusselsstock rechanges e re-examination of theevidence", November 1986.
"Capital flous liberalization and the EMS, eFrench perspective", December 1986.
oManufacturing in a nev perspective',July 1986.
"FMS as indicator of manufacturing strategy",December 1986.
"On the existence of equilibrium in hotalling'smode", November 1986.
"Value added tax and coepetition",December 1986.
87/07 Rolf BANZ andGabriel HAVAVINI
87/08 Manfred KETS DE VRIES
87/09 Lister VICKERY,Mark PILKINGTONand Paul READ
87/10 André LAURENT
87/11 Robert FILDES andSpyros MAKRIDAKIS
87/12 Fernando BARTOLOMEand André LAURENT
87/13 Sumantra GHOSHALand Nitin NOHRIA
87/14 tandis GABEL
87/15 Spyros MAKRIDAKIS
87/16 Susan SCHNEIDER
and Roger DUNBAR
87/17 André LAURENT andFernando BARTOLOME
87/18 Reinhard ANGELMAR andChristoph LIEBSCHER
87/19 David BEGC andCharles VYPLOSZ
87/20 Spyros MAKRIDAKIS
87/21 Susan SCHNEIDER
87/22 Susan SCHNEIDER
87/23 Roger BETANCOURTDavid GAUTSCHI
*Equity pricing and stock market anomalies",February 1987.
*Leaders vho can't manage", February 1987.
"Entrepreneurial activities of European MIMA",March 1987.
"A cultural viev of organizational change",
March 1987
"Forecasting and lors functions", Match 1987.
"The Janus Head: lemming from the superiorand subordinate faces of the manager's job",April 1987.
"Multinational corporations as differentiatednetvorks", April 1987.
"Froduct Standards and Competitive Strategy: AnAnalysis of the Principles", May 1987.
"METAFORECASTING: Vays of improvingForecasting. Accuracy and Usefulness",May 1987.
"Takeover attempts: vhat does the language tell
us?, June 1987.
"Managers' cognitive maps for upvard anddovnvard relationships", June 1987.
"Patents and the European blotechnology las: astudy of large European pharmaceutical fires",June 1987.
*Vhy the EMS? Dyna•ic gaines and the equilibtluepolicy regime, May 1987.
°A nev approach to statistical forecasting",June 1987.
"Strategy formulation: the impact of nationalculture", Revised: July 1987.
"Conflicting ideologies: structural andmotivational consequences", August 1987.
"The demand for retail prodUcts and thehousehold production model: nev vievs oncomplementarity and substitutebility".
87/30 Jonathan HAMILTONV. Bentley MACLEODand J. F. THISSE
"Spatial competition and the Core', August1987. 1988
87/24 C.B. DERR andAndré LAURENT
87/25 A. K. JAIN,N. K. MALHOTRA andChristian PINSON
87/26 Roger BETANCOURTand David CAUTSCHI
87/27 Michael BURDA
87/28 Gabriel HAVAVINI
87/29 Susan SCHNEIDER andPaul SHRIVASTAVA
"The interne and external careers: atheoretical and cross-cultural perspective",Spring 1987.
"The robustness of KDS configurations in theface of incomplete date, March 1987, Revised:July 1987.
"Deaand complementarities, household productionand retail assortments", July 1987.
"1s there e capital shortage in Europe?",August 1987.
"Controlling the lnterest-rate risk of bonds:an introduction to duration analysis andimmunization strategles", September 1987.
"Interpreting strategic behevior: basicassumptions themes in organisations*, September1987
87/41 Gavriel HAVAVINI andClaude VIALLET
87/42 Damien NEVEN andJacques-F. THISSE
87/43 Jean GABSZEVICZ andJacques-F. TRISSE
87/44 Jonathan HAMILTON,Jacques-F. THISSEand Anita VESKAMP
87/45 Karel COOL,David JEMISON andIngemar DIERICKX
87/46 Ingemar DIERICKXand Karel COOL
"Seasonality, size premtu■ and the relationshipbetveen the risk and the return of Prenchcocon stocks*, November 1987
"Coabining horizontal and verticaldifferentiation: the principle of max-mindifferentiation", December 1987
'Location', December 1987
"Spatial discrimination: Bertrand vs. Cournotin • model of location choice', December 1987
"Business strategy, market structure and rlsk-return relationshipss • causal interpretation",December 1987.
"Asset stock accumulation and sustainabilltyof competitive advantage", December 1987.
87/31 Martine OUINZII andJ. F. THISSE
87/32 Arnoud DE MEYER
87/33 Yves DOZ andAmy SHUEN
87/34 Kasra FERDOVS andArnoud DE MEYER
87/35 P. J. LEDERER andJ. F. TRISSE
87/36 Manfred KETS DE VRIES
87/37 Landis LABEL
87/38 Susan SCHNEIDER
87/39 Manfred KETS DE VRIES1987
87/40 Carmen MATUTES andPierre REGIBEAU
"On the optimality of central places",September 1987.
"German, Prench and British manufacturingstrategies less different than one thinks',September 1987.
"A process fraaevork for analyzing cooperationbetveen tiras", September 1987.
'European manufacturers: the dangers ofcomplacency. Insights from the 1987 Ruropean•anufecturing futures survey, October 1987.
"Competitive location on netvorkm underdiscriminatory pricing', September 1987.
*PrisonerS of leadership', Revised versionOctober 1987.
"Frivatization: its motives and likelyconsequences", October 1987.
"Strategy formulation: the impact of nationalculture', October 1987.
"The dark sicle of CECI succession", November
"Froduct compatibility and the scope of entry",November 1987
88/01 Michael LAVRENCE andSpyros MAKRIDAKIS
88/02 Spyros MAKRIDAKIS
88/03 James TEBOUL
88/04 Susan SCHNEIDER
88/05 Charles VYPLOSZ
88/06 Reinhard ANCELMAR
88/07 Ingemar DIERICKXand Karel COOL
88/08 Reinhard ANCELMARand Susan SCHNEIDER
88/09 Bernard SINCLAIR-DESCAGNé
88/10 Bernard SINCLAIR-DESCAGNé
88/11 Bernard SINCLAIR-DESGAGNé
"Factors affecting judgemental forecasts andconfidence Intervale, January 1988.
"Predicting recessions and other turningpoints", January 1988.
"De-industrialize service for quality", January1988.
"National vs. corporate culture: implicationsfor human resource management", January 1988.
"The svInging dollar: is Europe out of step?",January 1988.
"Les conflits dans les canaux de distribution',January 1988.
"Competitive advantage: a resource basedperspective", January 1988.
"Issues in the study of organizational
cognition", February 1988.
"Price formation and product design throughbidding*, February 1988.
"The robustness of some standard auction gaineforms°, February 1988.
"Vhem stationary strategies are equilibriumbidding strategy: The single-crossingproperty", February 1988.
88/12 Spyros MAKRIDAKIS
88/13 Manfred KETS DE VRIES
88/14 Alain NOEL
88/15 Anil DEOLALIKAR andLars-Hendrik ROLLER
88/16 Gabriel HAVAVINI
88/17 Michael BURDA
08/18 Michael BURDA
88/19 M.J. LAVRENCE andSpyros MAKRIDAKIS
88/20 Jean DERMINE,Damien NEVEN andJ.F. TIIISSE
88/21 James TEBOUL
88/22 Lars-Hendrik RÔLLER
88/23 Sjur Didrik IMAMand Georges ZACCOUR
88/24 8. Espen ECK80 andHervig LANGOHR
88/25 Everette S. GARDNERand Spyros MAKRIDAKIS
88/26 Sjur Didrik FLANand Georges ZACCOUR
88/27 Murugappa KRISHNANLars-Fiendr1k RÔLLER
88/28 Sumantra CROSHAL andC. A. BARTLETT
' Business [ires and managers in the 2lstcentury", February 1988
"Alexithymie In organisation-al lite: theorganisation aan revisited • , February 1988.
' The interpretntion of strategies: a atudy ofthe taquet of C80, on the corporation",Ruth 1988.
'The production of and returna trou industrielinnovations an econoactric analysis for edeveloping country', December 1987.
'Market efficiency and equity pricingsinternational evidence and implications forglobal investing', March 1988.
'Monopolistic coepetition, costs of adjusteentand the behavior of European employaient',September 1987.
"Iteflections on 'Voit Uneaployment" inlur0 134". November 1987, revised February 1988.
"Individuel bics in judgements of confidence',March 1988.
"Portfolio sélection by «tuai funds, nnequilibriun mode", March 1988.
' De-industrialise service for quality',March 1988 (88/03 Revised).
"Proper Ouadratie Functions vith an Applicationto AT&T', May 1987 (Revised March 1988).
"Equilibres de Nash-Cournot dans le marchéeuropéen du gaz: un cas où les solutions enboucle ouverte et en fecdback colncident",Mars 1988
"Information disclosure, Imans of payaient, andtakeover prenia. Public and Private tenderoffers in France', July 1985, Sixth revislon,April 1988.
' The future of forecasting", April 1988.
"Seni-competitive Cournot equilibrium inaultistage oligopolies", April 1988.
"Ferry tue vith resalable capacity',April 1988.
'The multinational corporation as a netvork:perspectives from interorganlzational theory",May 1988.
88/29 Naresh K. MALHOTRA,Christian PINSON andArun K. JAIN
88/30 Catherine C. ECKELand Theo VERMAELEN
88/31 Sumantra GHOSHAL andChristopher BARTLETT
88/32 Kasrà FERDOVS andDavid SACKRIDER
88/33 Mihkel M. TOMBAI(
88/34 Mihkel M. TOMBAI(
88/35 Mihkel M. TOMBAI(
88/36 Vikas TIBREVALA andBruce BUCHANAN
88/37 Murugappa KRISRNANLars-Hendrik ROLLER
80/38 Manfred KETS DE VRIES
88/39 Manfred KETS DE VRIES
88/40 Josef LAXONISMOK andTheo VERMAELEN
88/41 Charles VIPLOSZ
88/42 Paul EVANS
88/43 B. SINCLAIR-DESCACNE
88/44 Essam MAHMOUD andSpyros MAKRIDAKIS
88/45 Robert KORAJCZYKand Claude VIALLET
88/46 Yves DOZ andAmy SHUEN
' Consumer cognitive conplexity end thedinenslonellty of •ultidieensional scalingconfigurations', May 1988.
"The financial fellout froc Chernobyl: riskperceptions and regulatory response', May 1988.
' Creation, adoption, and diffusion ofinnovations by subsidiaries of multinationalcorporations", June 1988.
' International nanufacturing: positioningplants for SUCCeSe, June 1988.
' The importance of flexibility inaanufecturing', June 1988.
"FlexibIlity: an important dimension Inaanufacturing", June 1988.
"A strategic analysis of investirent in flexibleannufacturing systems', July 1988.
' A Fredictive Test of the 148D Model thatControls for Non-stationarity • , Jonc 1988.
'Regulating Price-Liability Coepetition 'roInprove Velfare', July 1988.
' The Motivating Rote of Envy : A PorgottenFactor ln Management, April 88.
"The Leader as Mirror Clinicat Reflections',July 1988.
"Anonalous price behavior eround repurchasetender offers', August 1988.
' Assynetry in the RMS, intentionel orsystemic7", August 1988.
"Organizational developeent In thetransnational enterprise", June 1988.
"Croup decision support systens inpleeentBayesian rationality", September 1988.
'The state of the art and future directionsin coabining forecasts • , September 1988.
' An eapirical investigation of internationalasset pricing", November 1986, revised August1988.
' Pros intent to outcomer a protes, fremevorkfor partnerships", August 1988.

88/47 Alain BULTEZ,Els GIJSBRECHTS,Philippe NAERT andPlet VANDEN ABEELE
88/48 Michael BORDA
88/49 Nathalie DIERKENS
88/50 Rob WEITZ andArnoud DE MEYER
88/51 Rob WEITZ
88/52 Susan SCHNEIDER andReinhard ANCELMAR
88/53 Manfred KETS DE VRIES
88/54 Lars-Hendrik RÔLLERand Mihkel M. TOMBAK
88/55 Peter BOSSAERTSand Pierre HILLION
88/56 Pierre HILLION
88/57 Wilfried VANHONACKERand Lydia PRICE
"Asymmetric cannibalism betveen substituteitems listed by retallers", September 1988.
"Reflections on 'Voit unemployment' inEurope, II", April 1988 revised September 1988.
"Information asymmetry and equity issues",September 1988.
"Managing expert systems: from inceptionthrough updating", October 1987.
"Technology, vork, and the organisation: theimpact of expert systems", July 1988.
"Cognition and organisational analysiez vho's■inding the store?", September 1988.
"Vhatever happened to the philosopher-king: theleader's addiction to pover, September 1988.
"Strategic choice of flexible productiontechnologies and velfare implications",October 1988
"Nethod of moments tests of contingent nainsasset pricing modela", October 1988.
"Size-sorted portfolios and the violation ofthe random valk hypothesis: Additionalempirical evidence and implication for testsof asset pricing models", June 1988.
"Data transferability: estimating the responseeffect of future avents based on historicalanalogy", October 1988.
"Strategic pricing of differentiated consumerdurables in a dynamic duopoly: a numericalanalysis", October 1988.
"Charting strategic roles for internationalfactories", December 1988.
"Quality up, technology dovn", October 1988.
"A discussion of exact measures of informationassymetry: the example of Myers and Kapo(Bodel or the importance of the asset structureof the firme , December 1988.
"The chief technology officer", December 1988.
"The impact of language theories on DSSdialog", January 1989.
"DSS software selection: e multiple criteriadecision methodology", January 1989.
"Negotiation support: the affects of computerintervention and conflict level on bargainingoutcome", January 1989.
88/63 Fernando NASCIMENTOand Wilfried R.VANHONACKER
88/64 Kasra FERDOWS
88/65 Arnoud DE MEYERand Kasra FERDOVS
88/66 Nathalie DIERKENS
88/67 Paul S. ADLER andKasra FERDOVS
1989
89/01 Joyce K. BYRER andTavfik JELASSI
89/02 Louis A. LE BLANCand Tavfik JELASSI
89/03 Beth H. JONES andTavfik JELASSI
88/58 B. SINCLAIR-DESGAGNEand Mihkel M. TOMBAK
88/59 Martin KILDUFF
88/60 Michael BORDA
88/61 Lars-Hendrik RÔLLER
88/62 Cynthia VAN NULLE,Theo VERMAELEN andPaul DE VOUTERS
"Assessing economic inequality", November 1988.
"The interpersonal structure of decisionmaking: a social comparison approach toorganizational choice", November 1988.
"Is ■ismatch really the problem? Some estimatesof the Chelvood Cote II Bodel vith US data",September 1988.
"Modelling cost structure: the Bell Systemrevisited", November 1988.
"Regulation, taxes and the market for corporatecontrol in Belgium", September 1988.