creating lasting value - sun pharma · manufacturing footprint •45 manufacturing sites across the...
TRANSCRIPT
Creating Lasting Value
Investor Presentation - March 2015
NSE:SUNPHARMA | BSE:524715 | Bloomberg:SUNP IN | Reuters:SUN.BO
WWW.SUNPHARMA.COM
Except for the historical information contained herein, statements in this presentation and
the subsequent discussions, which include words or phrases such as “will”, “aim”, “will likely
result”, “would”, “believe”, “may”, “expect”, “will continue”, “anticipate”, “estimate”, “intend”,
“plan”, “contemplate”, “seek to”, “future”, “objective”, “goal”, “likely”, “project”, “should”,
“potential”, “will pursue” and similar expressions or variations of such expressions may
constitute "forward-looking statements". These forward-looking statements involve a
number of risks, uncertainties and other factors that could cause actual results to differ
materially from those suggested by the forward-looking statements. These risks and
uncertainties include, but are not limited to our ability to successfully implement our
strategy, our growth and expansion plans, obtain regulatory approvals, our provisioning
policies, technological changes, investment and business income, cash flow projections, our
exposure to market risks as well as other risks. Sun Pharmaceutical Industries Limited does
not undertake any obligation to update forward-looking statements to reflect events or
circumstances after the date thereof.
Disclaimer
© Sun Pharmaceutical Industries Limited. All Rights Reserved. 2
Contents
© Sun Pharmaceutical Industries Limited. All Rights Reserved. 3
Sun Pharma at a glance1
Long-term Strategy2
Global Specialty Initiatives3
Revenue Composition, History & Acquisition Track Record4
Business Operations, R&D, Manufacturing5
Corporate Governance6
Financials – P&L, Balance Sheet, Cash Flows & Ratios7
Key Milestones Targeted8
© Sun Pharmaceutical Industries Limited. All Rights Reserved. 4
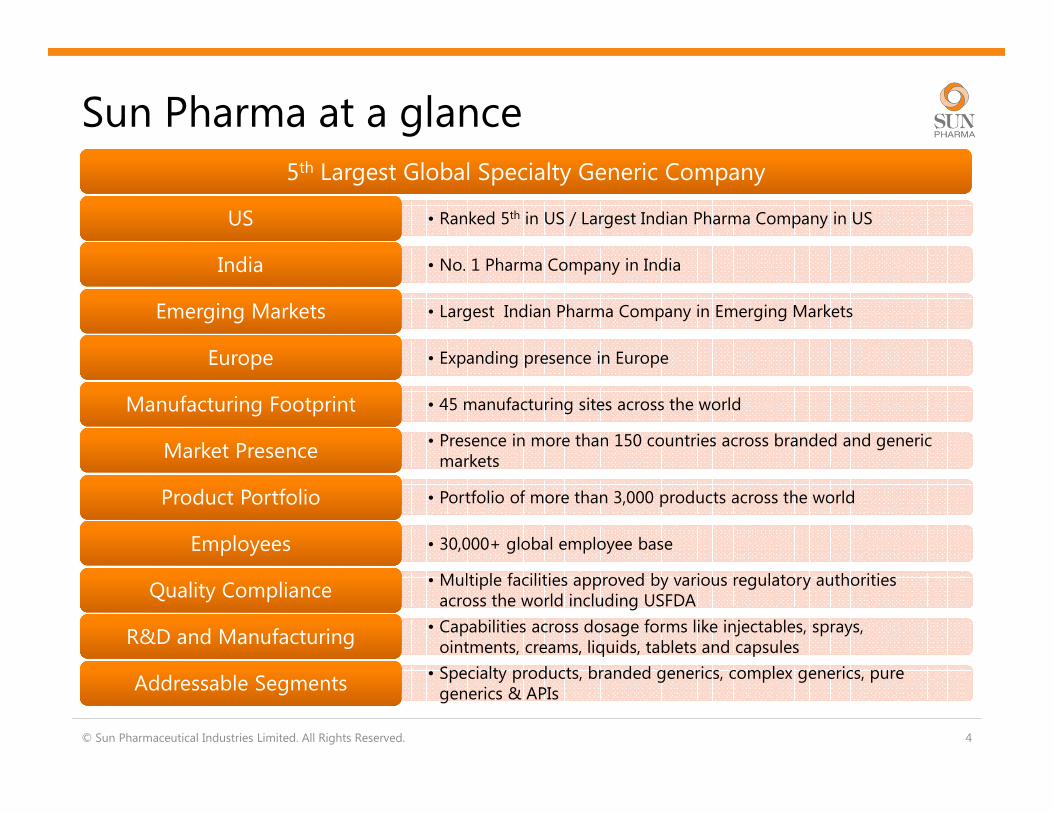
Sun Pharma at a glance5th Largest Global Specialty Generic Company5th Largest Global Specialty Generic Company
• Ranked 5th in US / Largest Indian Pharma Company in USUSUS
• No. 1 Pharma Company in IndiaIndiaIndia
• Largest Indian Pharma Company in Emerging MarketsEmerging MarketsEmerging Markets
• Expanding presence in EuropeEurope Europe
• 45 manufacturing sites across the worldManufacturing FootprintManufacturing Footprint
• Presence in more than 150 countries across branded and generic markets
Market PresenceMarket Presence
• Portfolio of more than 3,000 products across the worldProduct PortfolioProduct Portfolio
• 30,000+ global employee baseEmployeesEmployees
• Multiple facilities approved by various regulatory authorities across the world including USFDA
Quality ComplianceQuality Compliance
• Capabilities across dosage forms like injectables, sprays, ointments, creams, liquids, tablets and capsules
R&D and ManufacturingR&D and Manufacturing
• Specialty products, branded generics, complex generics, pure generics & APIs
Addressable SegmentsAddressable Segments
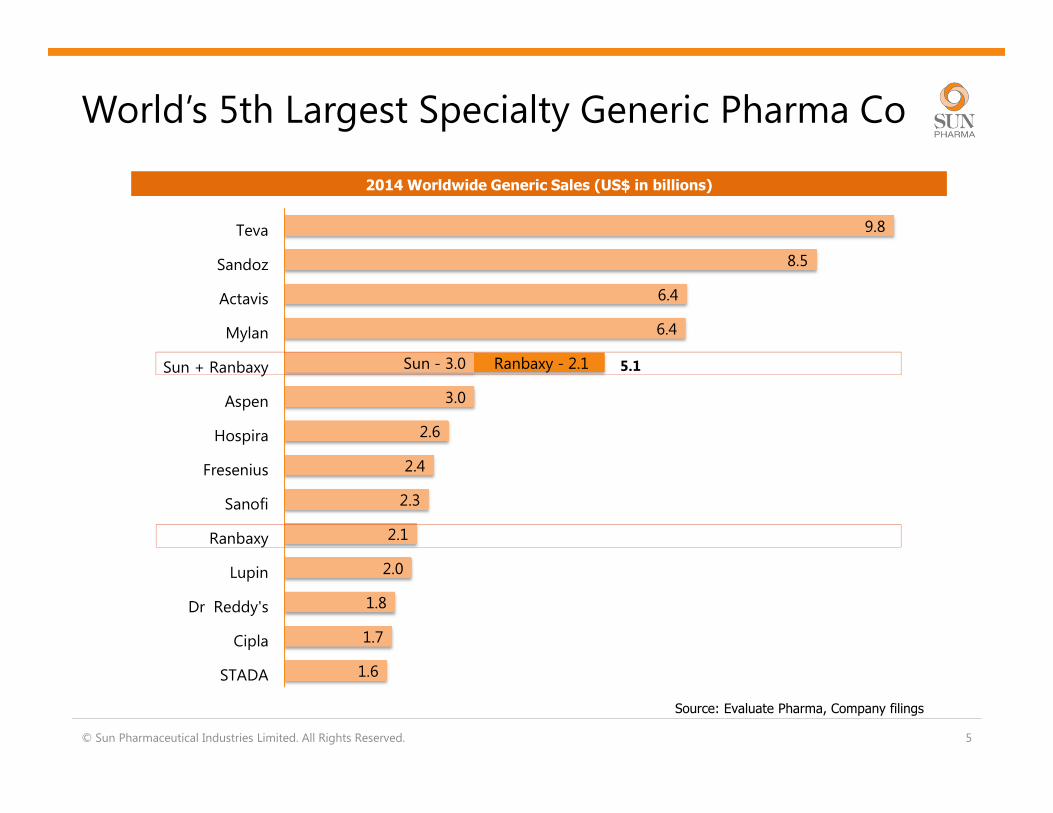
World’s 5th Largest Specialty Generic Pharma Co
1.6
1.7
1.8
2.0
2.1
2.3
2.4
2.6
3.0
Sun - 3.0
6.4
6.4
8.5
9.8
Ranbaxy - 2.1
STADA
Cipla
Dr Reddy's
Lupin
Ranbaxy
Sanofi
Fresenius
Hospira
Aspen
Sun + Ranbaxy
Mylan
Actavis
Sandoz
Teva
5.1
© Sun Pharmaceutical Industries Limited. All Rights Reserved. 5
2014 Worldwide Generic Sales (US$ in billions)
Source: Evaluate Pharma, Company filings
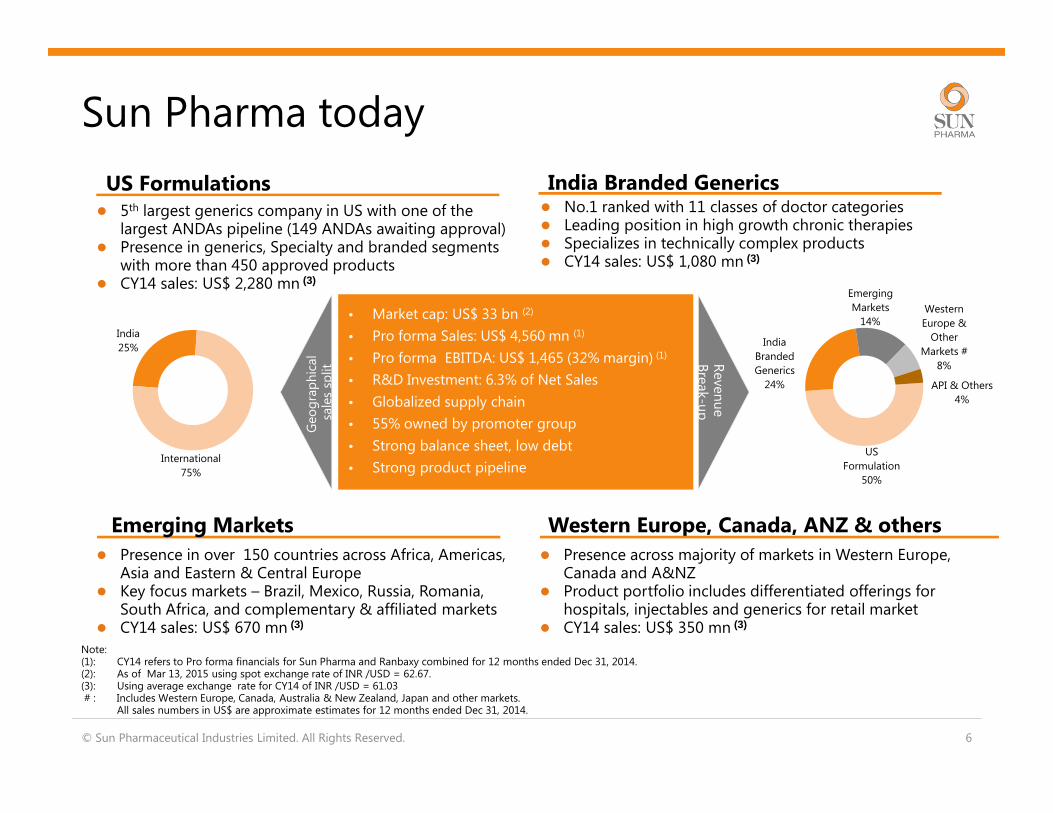
US
Formulation
50%
India
Branded
Generics
24%
Emerging
Markets
14%Western
Europe &
Other
Markets #
8%
API & Others
4%
India
25%
International
75%
Western Europe, Canada, ANZ & others
� 5th largest generics company in US with one of the largest ANDAs pipeline (149 ANDAs awaiting approval)
� Presence in generics, Specialty and branded segments with more than 450 approved products
� CY14 sales: US$ 2,280 mn (3)
© Sun Pharmaceutical Industries Limited. All Rights Reserved. 6
Sun Pharma today
• Market cap: US$ 33 bn (2)
• Pro forma Sales: US$ 4,560 mn (1)
• Pro forma EBITDA: US$ 1,465 (32% margin) (1)
• R&D Investment: 6.3% of Net Sales
• Globalized supply chain
• 55% owned by promoter group
• Strong balance sheet, low debt
• Strong product pipeline
Note:(1): CY14 refers to Pro forma financials for Sun Pharma and Ranbaxy combined for 12 months ended Dec 31, 2014. (2): As of Mar 13, 2015 using spot exchange rate of INR /USD = 62.67.(3): Using average exchange rate for CY14 of INR /USD = 61.03 # : Includes Western Europe, Canada, Australia & New Zealand, Japan and other markets.
All sales numbers in US$ are approximate estimates for 12 months ended Dec 31, 2014.
� Presence in over 150 countries across Africa, Americas, Asia and Eastern & Central Europe
� Key focus markets – Brazil, Mexico, Russia, Romania, South Africa, and complementary & affiliated markets
� CY14 sales: US$ 670 mn (3)
� Presence across majority of markets in Western Europe, Canada and A&NZ
� Product portfolio includes differentiated offerings for hospitals, injectables and generics for retail market
� CY14 sales: US$ 350 mn (3)
� No.1 ranked with 11 classes of doctor categories� Leading position in high growth chronic therapies� Specializes in technically complex products� CY14 sales: US$ 1,080 mn (3)
Geo
gra
ph
ical
sa
les
split
Reve
nu
e
Bre
ak-up
India Branded GenericsUS Formulations
Emerging Markets
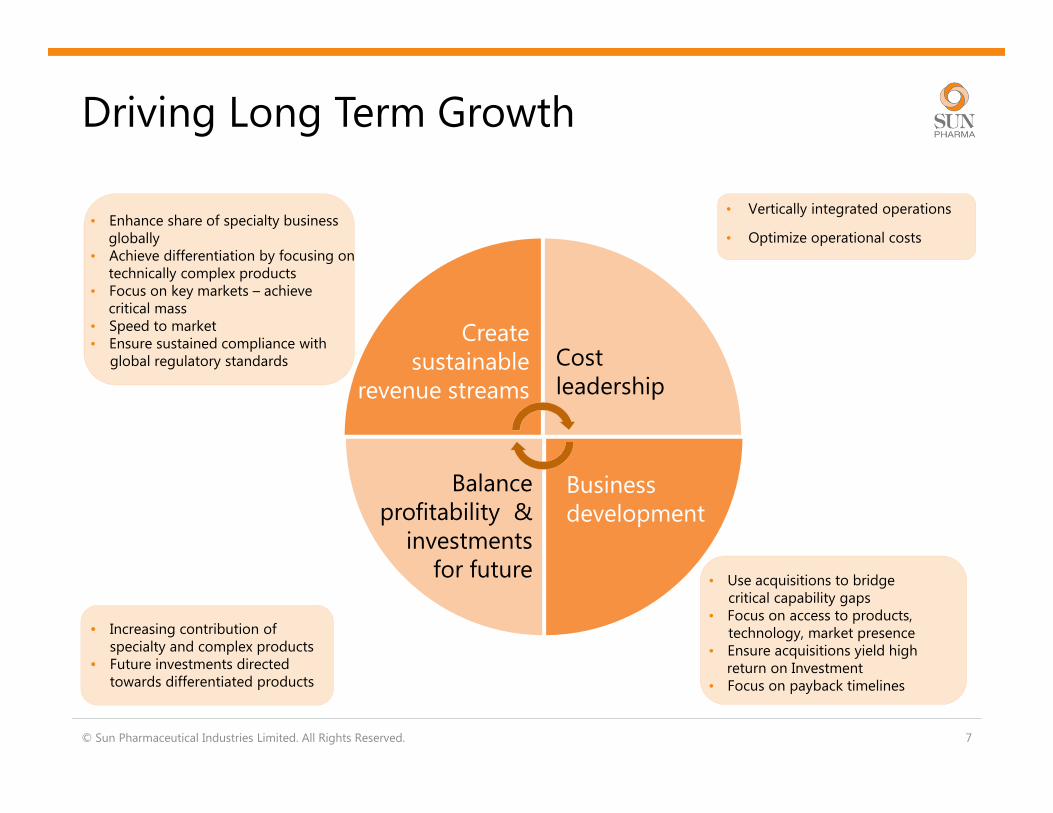
• Increasing contribution of specialty and complex products
• Future investments directed towards differentiated products
Cost leadership
Create sustainable
revenue streams
Driving Long Term Growth
© Sun Pharmaceutical Industries Limited. All Rights Reserved. 7
Business development
• Enhance share of specialty business globally
• Achieve differentiation by focusing on technically complex products
• Focus on key markets – achieve critical mass
• Speed to market• Ensure sustained compliance with
global regulatory standards
• Vertically integrated operations
• Optimize operational costs
• Use acquisitions to bridgecritical capability gaps
• Focus on access to products,technology, market presence
• Ensure acquisitions yield high return on Investment
• Focus on payback timelines
Balance profitability &
investments for future
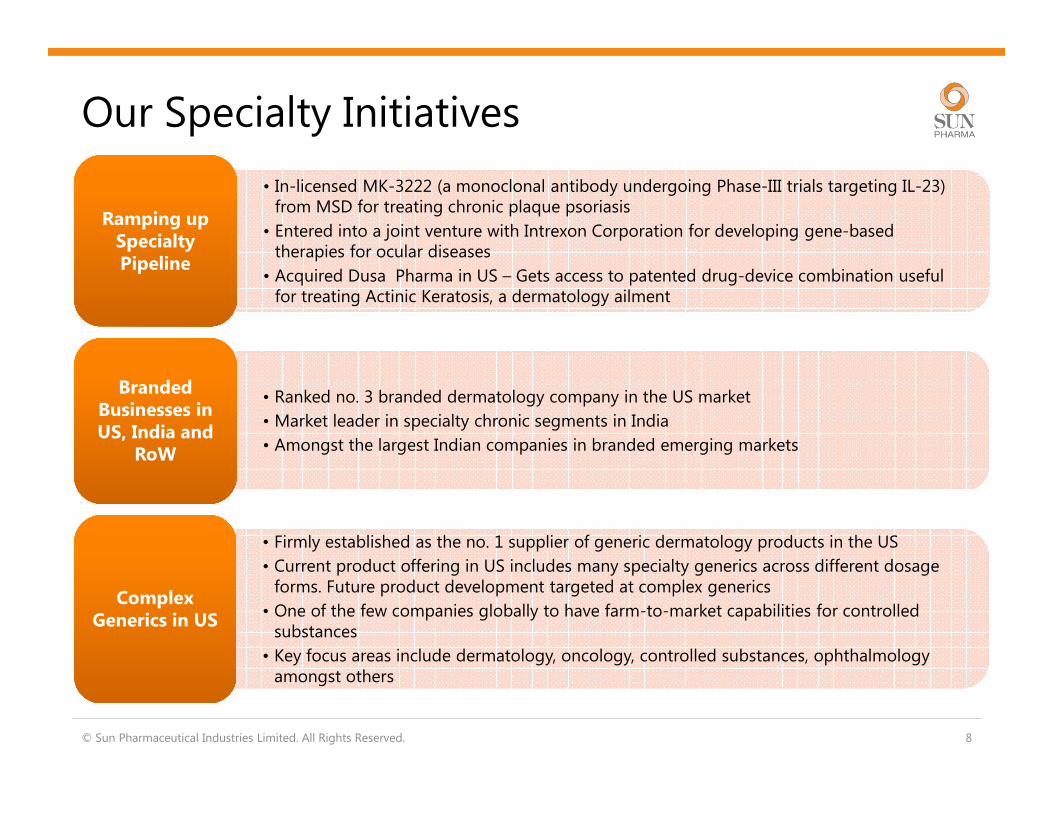
Our Specialty Initiatives
© Sun Pharmaceutical Industries Limited. All Rights Reserved. 8
• In-licensed MK-3222 (a monoclonal antibody undergoing Phase-III trials targeting IL-23) from MSD for treating chronic plaque psoriasis
• Entered into a joint venture with Intrexon Corporation for developing gene-based therapies for ocular diseases
• Acquired Dusa Pharma in US – Gets access to patented drug-device combination useful for treating Actinic Keratosis, a dermatology ailment
Ramping up Specialty Pipeline
Ramping up Specialty Pipeline
• Ranked no. 3 branded dermatology company in the US market
• Market leader in specialty chronic segments in India
• Amongst the largest Indian companies in branded emerging markets
Branded Businesses in US, India and
RoW
Branded Businesses in US, India and
RoW
• Firmly established as the no. 1 supplier of generic dermatology products in the US
• Current product offering in US includes many specialty generics across different dosage forms. Future product development targeted at complex generics
• One of the few companies globally to have farm-to-market capabilities for controlled substances
• Key focus areas include dermatology, oncology, controlled substances, ophthalmology amongst others
Complex Generics in US
Complex Generics in US
© Sun Pharmaceutical Industries Limited. All Rights Reserved. 9
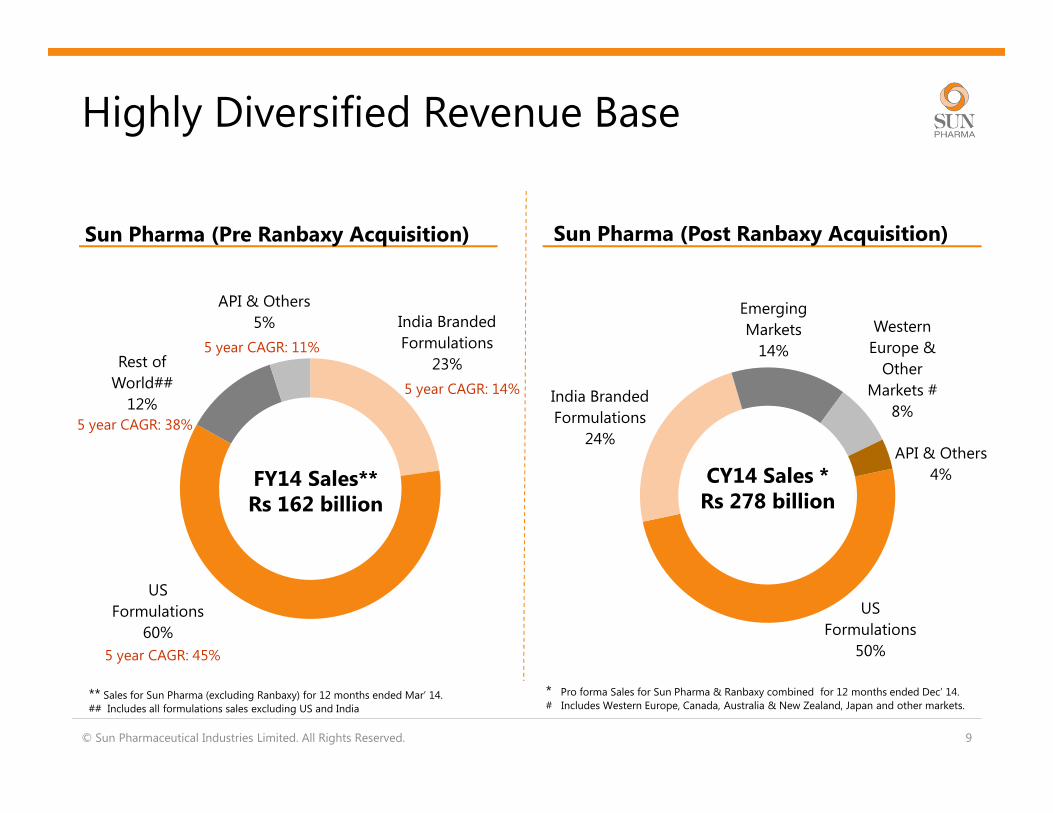
Highly Diversified Revenue Base
India Branded
Formulations
23%
US
Formulations
60%
Rest of
World##
12%
API & Others
5%
US
Formulations
50%
India Branded
Formulations
24%
Emerging
Markets
14%
Western
Europe &
Other
Markets #
8%
API & Others
4%
5 year CAGR: 45%
5 year CAGR: 38%
5 year CAGR: 11%
5 year CAGR: 14%
* Pro forma Sales for Sun Pharma & Ranbaxy combined for 12 months ended Dec’ 14.# Includes Western Europe, Canada, Australia & New Zealand, Japan and other markets.
FY14 Sales** Rs 162 billion
CY14 Sales * Rs 278 billion
Sun Pharma (Pre Ranbaxy Acquisition) Sun Pharma (Post Ranbaxy Acquisition)
** Sales for Sun Pharma (excluding Ranbaxy) for 12 months ended Mar’ 14.## Includes all formulations sales excluding US and India
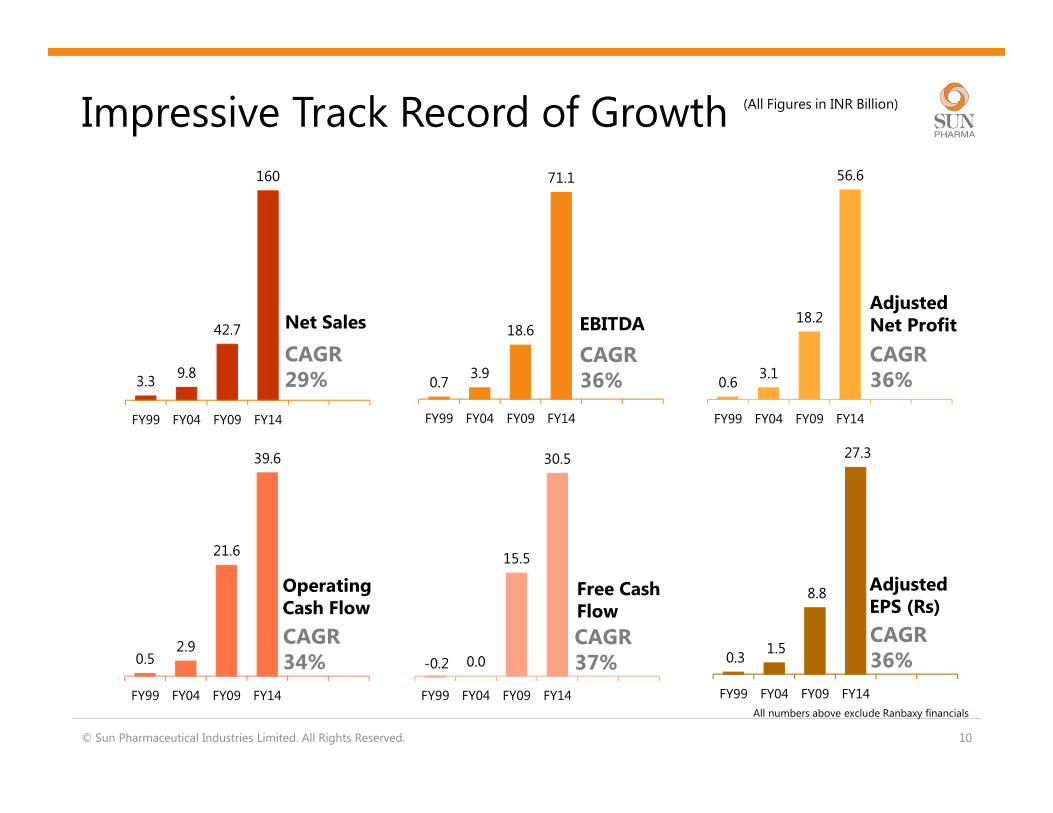
3.39.8
42.7
160
FY99 FY04 FY09 FY14
0.3 1.5
8.8
27.3
FY99 FY04 FY09 FY14
-0.2 0.0
15.5
30.5
FY99 FY04 FY09 FY14
0.52.9
21.6
39.6
FY99 FY04 FY09 FY14
© Sun Pharmaceutical Industries Limited. All Rights Reserved. 10
Impressive Track Record of Growth
Net Sales
0.73.9
18.6
71.1
FY99 FY04 FY09 FY14
0.63.1
18.2
56.6
FY99 FY04 FY09 FY14
CAGR29%
CAGR36%
CAGR36%
CAGR34%
CAGR37%
CAGR36%
EBITDAAdjusted Net Profit
Operating Cash Flow
Free Cash Flow
Adjusted EPS (Rs)
(All Figures in INR Billion)
All numbers above exclude Ranbaxy financials
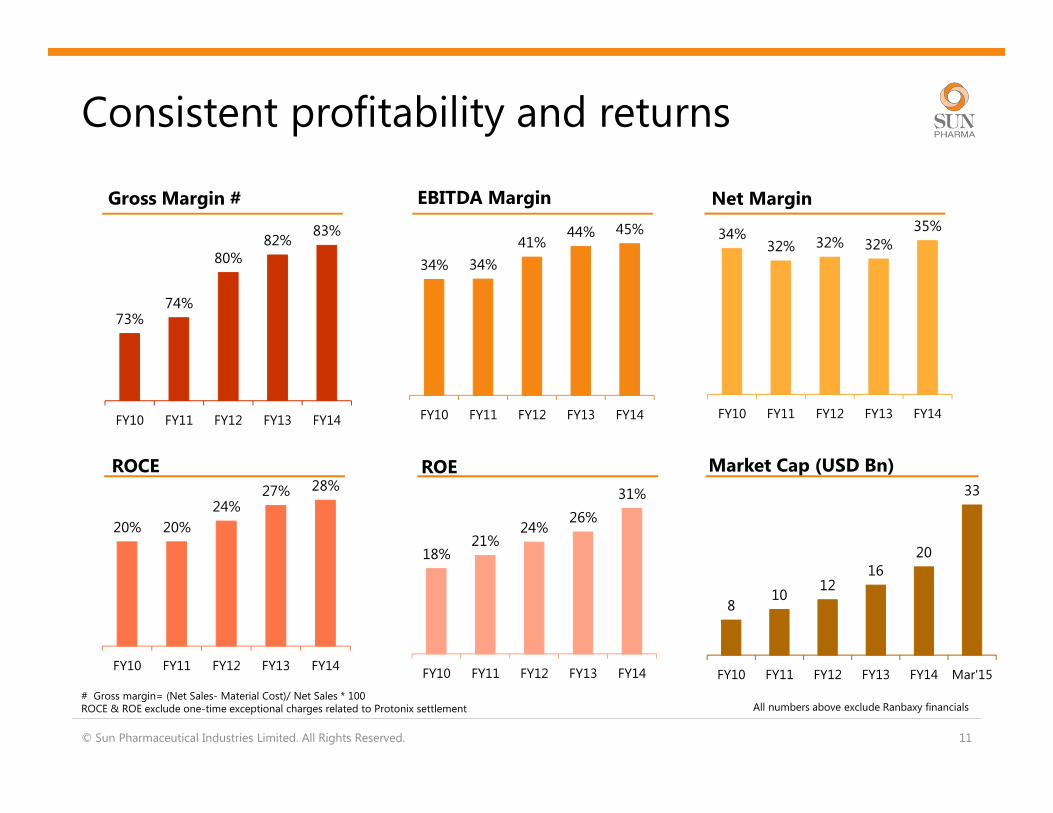
20% 20%
24%27% 28%
FY10 FY11 FY12 FY13 FY14
73%74%
80%82%
83%
FY10 FY11 FY12 FY13 FY14
810
1216
20
33
FY10 FY11 FY12 FY13 FY14 Mar'15
18%21%
24%26%
31%
FY10 FY11 FY12 FY13 FY14
© Sun Pharmaceutical Industries Limited. All Rights Reserved. 11
Consistent profitability and returns
34% 34%
41%44% 45%
FY10 FY11 FY12 FY13 FY14
34%32% 32% 32%
35%
FY10 FY11 FY12 FY13 FY14
Gross Margin # EBITDA Margin Net Margin
ROCE ROE Market Cap (USD Bn)
# Gross margin= (Net Sales- Material Cost)/ Net Sales * 100ROCE & ROE exclude one-time exceptional charges related to Protonix settlement All numbers above exclude Ranbaxy financials
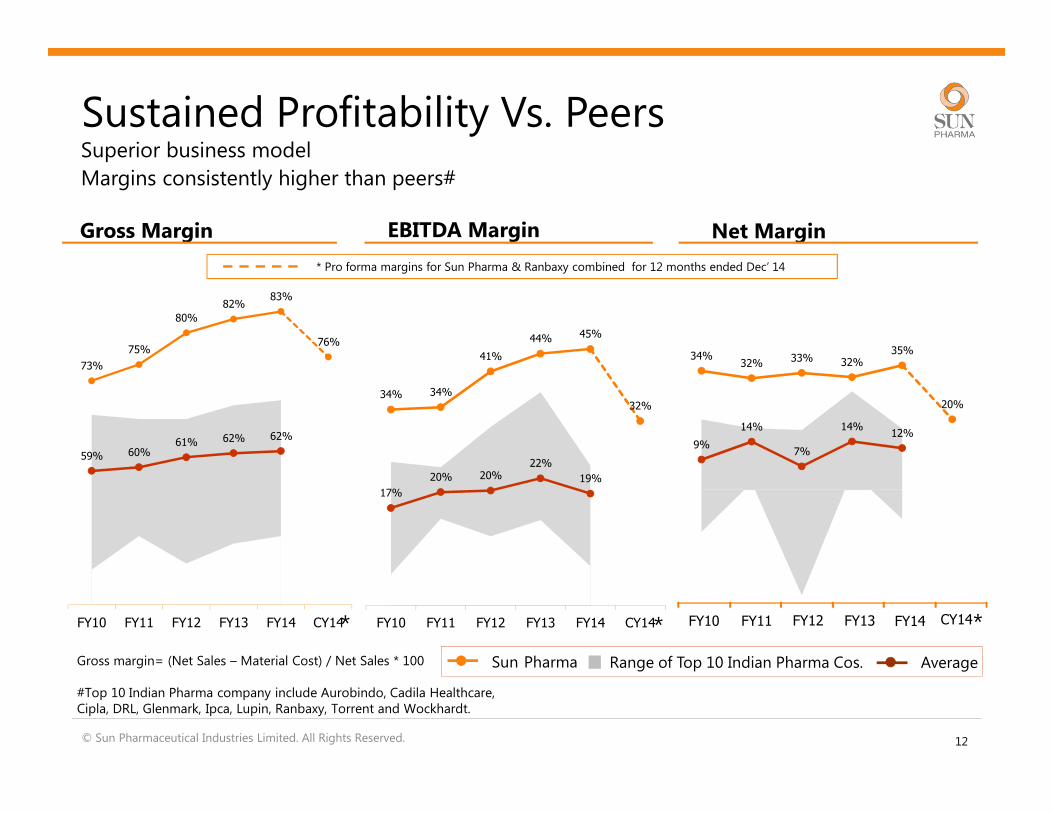
34% 34%
41%
44% 45%
32%
17%
20% 20%22%
19%
FY10 FY11 FY12 FY13 FY14 CY14
73%
75%
80%
82%83%
76%
59% 60%61% 62% 62%
FY10 FY11 FY12 FY13 FY14 CY14
34%32%
33% 32%35%
20%
9%
14%
7%
14%12%
Gross margin= (Net Sales – Material Cost) / Net Sales * 100
#Top 10 Indian Pharma company include Aurobindo, Cadila Healthcare, Cipla, DRL, Glenmark, Ipca, Lupin, Ranbaxy, Torrent and Wockhardt.
Sustained Profitability Vs. PeersSuperior business model
Margins consistently higher than peers#
Sun Pharma Range of Top 10 Indian Pharma Cos. Average
Gross Margin Net Margin
12
EBITDA Margin
© Sun Pharmaceutical Industries Limited. All Rights Reserved.
FY10 FY11 FY12 FY13 FY14 CY14* * *
* Pro forma margins for Sun Pharma & Ranbaxy combined for 12 months ended Dec’ 14
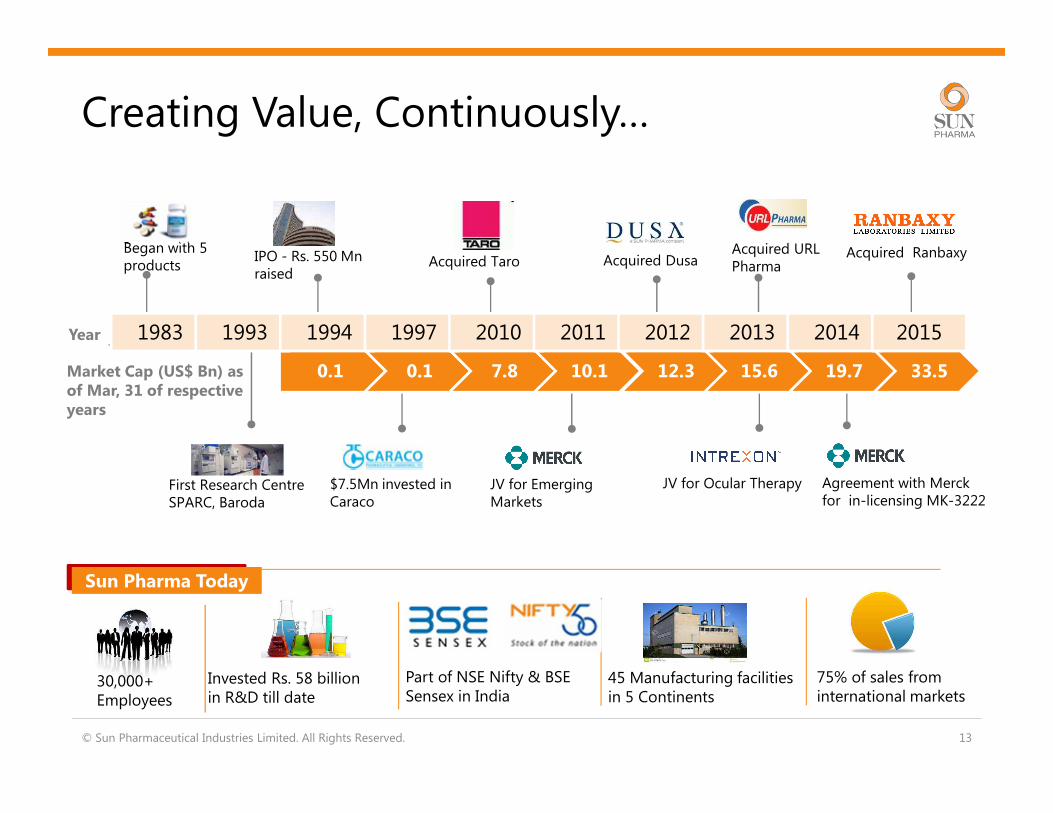
Market Cap (US$ Bn) as of Mar, 31 of respective years
Began with 5 products
First Research CentreSPARC, Baroda
Acquired Taro
JV for Emerging Markets
Acquired DusaAcquired URL Pharma
Creating Value, Continuously…
© Sun Pharmaceutical Industries Limited. All Rights Reserved. 13
IPO - Rs. 550 Mn raised
$7.5Mn invested in Caraco
JV for Ocular Therapy
Acquired Ranbaxy
30,000+ Employees
Sun Pharma Today
Invested Rs. 58 billion in R&D till date
Part of NSE Nifty & BSE Sensex in India
45 Manufacturing facilities in 5 Continents
75% of sales from international markets
Year
Agreement with Merck for in-licensing MK-3222
0.1 0.1 7.8 10.1 12.3 15.6 19.7 33.5
1983 1993 1994 1997 2010 2011 2012 2013 2014 2015
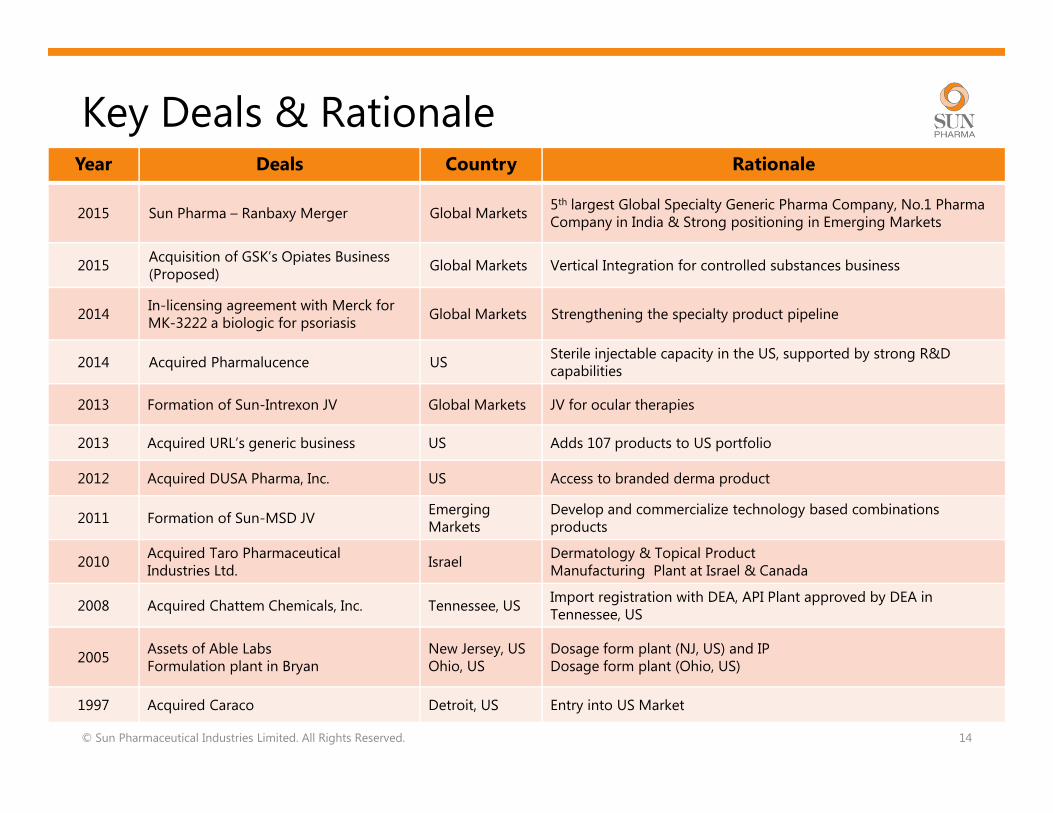
Key Deals & Rationale
© Sun Pharmaceutical Industries Limited. All Rights Reserved. 14
Year Deals Country Rationale
2015 Sun Pharma – Ranbaxy Merger Global Markets5th largest Global Specialty Generic Pharma Company, No.1 Pharma Company in India & Strong positioning in Emerging Markets
2015Acquisition of GSK’s Opiates Business (Proposed)
Global Markets Vertical Integration for controlled substances business
2014In-licensing agreement with Merck for MK-3222 a biologic for psoriasis
Global Markets Strengthening the specialty product pipeline
2014 Acquired Pharmalucence USSterile injectable capacity in the US, supported by strong R&D capabilities
2013 Formation of Sun-Intrexon JV Global Markets JV for ocular therapies
2013 Acquired URL’s generic business US Adds 107 products to US portfolio
2012 Acquired DUSA Pharma, Inc. US Access to branded derma product
2011 Formation of Sun-MSD JVEmerging Markets
Develop and commercialize technology based combinations products
2010Acquired Taro Pharmaceutical Industries Ltd.
IsraelDermatology & Topical ProductManufacturing Plant at Israel & Canada
2008 Acquired Chattem Chemicals, Inc. Tennessee, USImport registration with DEA, API Plant approved by DEA in Tennessee, US
2005Assets of Able LabsFormulation plant in Bryan
New Jersey, USOhio, US
Dosage form plant (NJ, US) and IPDosage form plant (Ohio, US)
1997 Acquired Caraco Detroit, US Entry into US Market
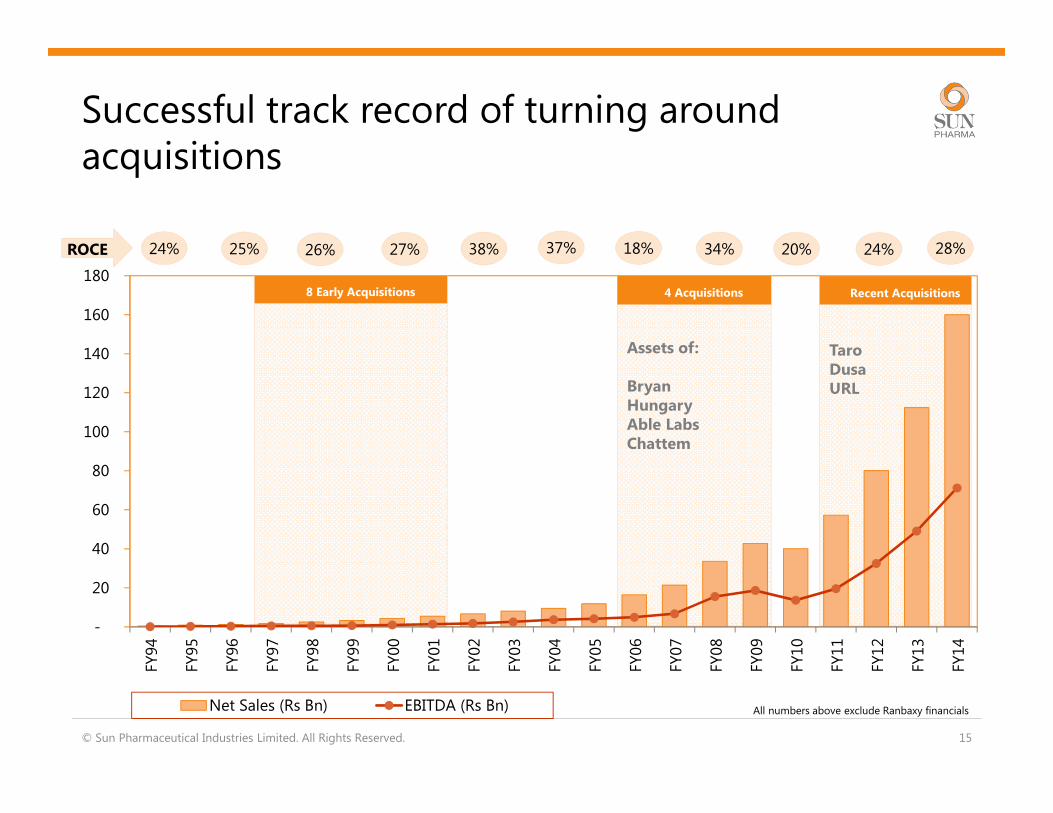
-
20
40
60
80
100
120
140
160
180
FY94
FY95
FY96
FY97
FY98
FY99
FY00
FY01
FY02
FY03
FY04
FY05
FY06
FY07
FY08
FY09
FY10
FY11
FY12
FY13
FY14
Net Sales (Rs Bn) EBITDA (Rs Bn)
Successful track record of turning around acquisitions
© Sun Pharmaceutical Industries Limited. All Rights Reserved. 15
8 Early Acquisitions 4 Acquisitions Recent Acquisitions
Taro Dusa URL
Assets of:
BryanHungary Able LabsChattem
ROCE 28%24%20%34%18%37%38%27%26%25%24%
All numbers above exclude Ranbaxy financials
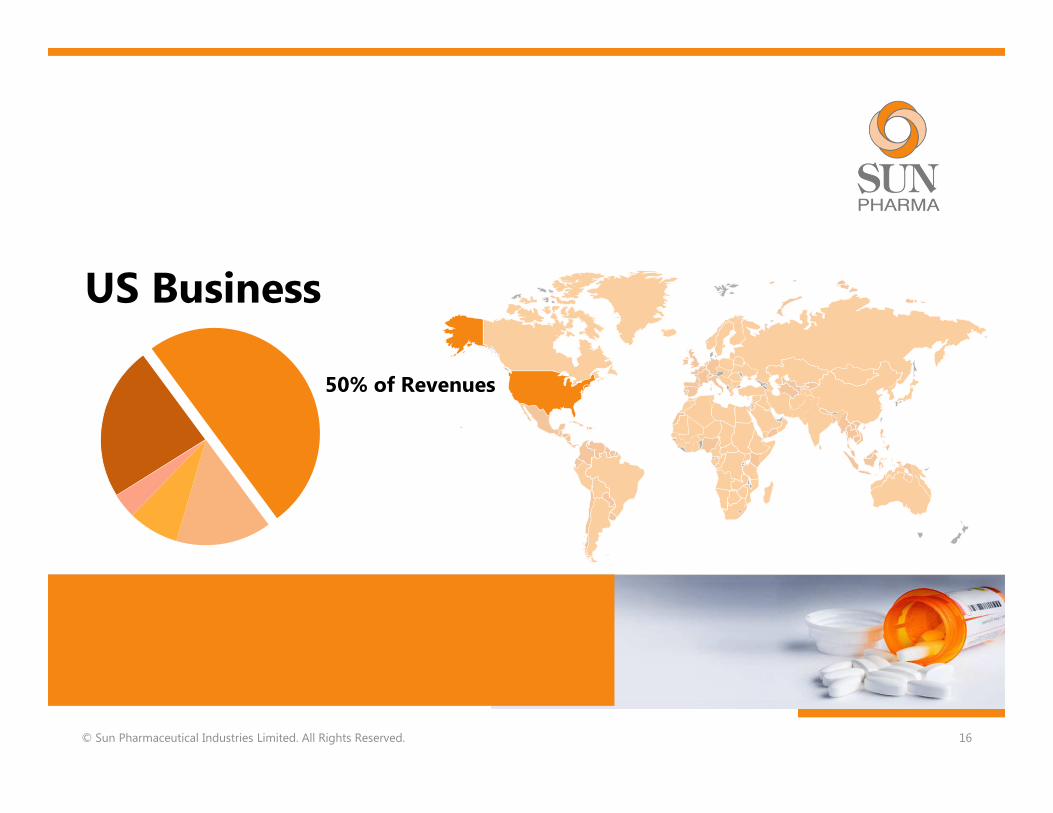
US Business
© Sun Pharmaceutical Industries Limited. All Rights Reserved. 16
50% of Revenues
© Sun Pharmaceutical Industries Limited. All Rights Reserved. 17
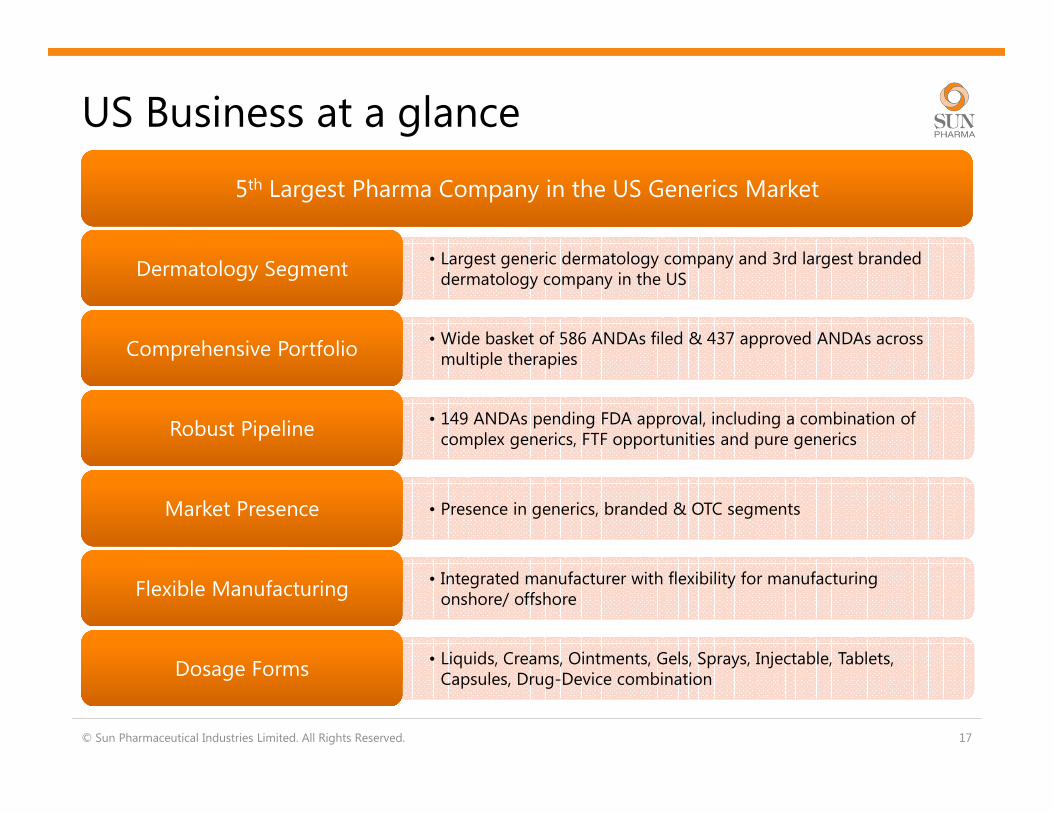
US Business at a glance
5th Largest Pharma Company in the US Generics Market5th Largest Pharma Company in the US Generics Market
• Largest generic dermatology company and 3rd largest branded dermatology company in the US
Dermatology Segment Dermatology Segment
• Wide basket of 586 ANDAs filed & 437 approved ANDAs across multiple therapies
Comprehensive PortfolioComprehensive Portfolio
• 149 ANDAs pending FDA approval, including a combination of complex generics, FTF opportunities and pure generics
Robust Pipeline Robust Pipeline
• Presence in generics, branded & OTC segmentsMarket PresenceMarket Presence
• Integrated manufacturer with flexibility for manufacturing onshore/ offshore
Flexible Manufacturing Flexible Manufacturing
• Liquids, Creams, Ointments, Gels, Sprays, Injectable, Tablets, Capsules, Drug-Device combination
Dosage Forms Dosage Forms
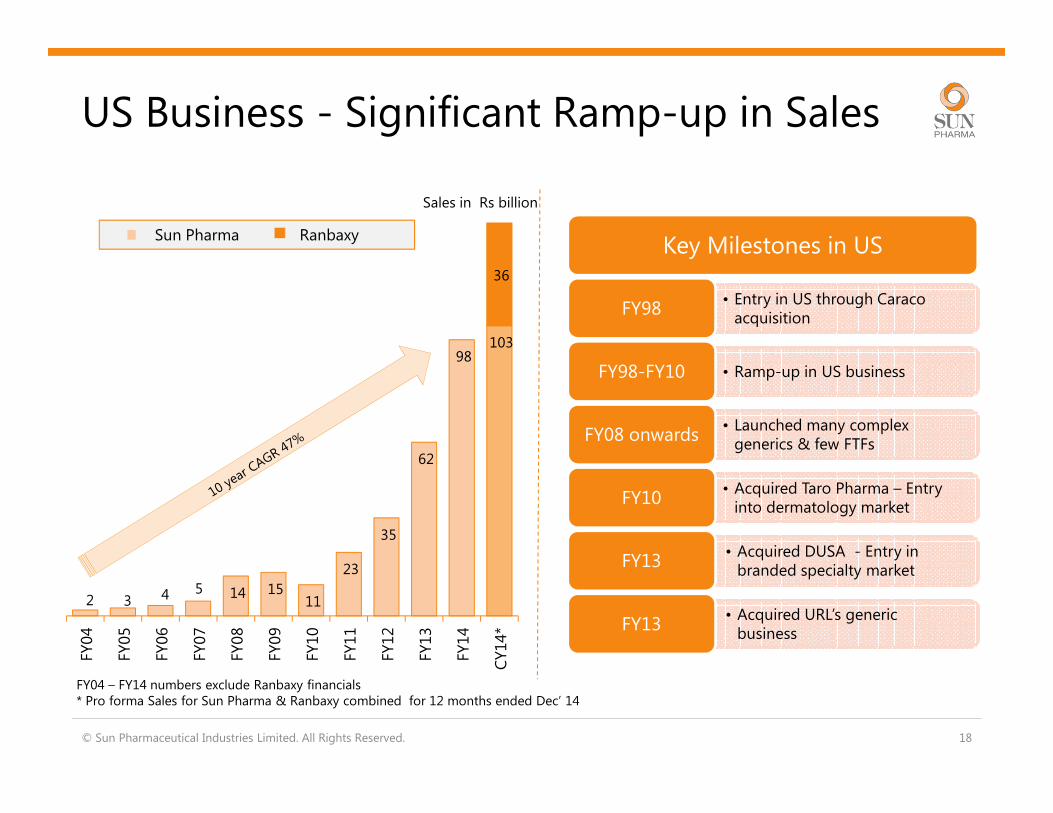
US Business - Significant Ramp-up in Sales
© Sun Pharmaceutical Industries Limited. All Rights Reserved. 18
2 3 4 5 14 15 11
23
35
62
98 103
36
FY04
FY05
FY06
FY07
FY08
FY09
FY10
FY11
FY12
FY13
FY14
CY
14*
FY04 – FY14 numbers exclude Ranbaxy financials* Pro forma Sales for Sun Pharma & Ranbaxy combined for 12 months ended Dec’ 14
Key Milestones in US
• Entry in US through Caraco acquisition
FY98
• Ramp-up in US businessFY98-FY10
• Launched many complex generics & few FTFs
FY08 onwards
• Acquired Taro Pharma – Entry into dermatology market
FY10
• Acquired DUSA - Entry in branded specialty market
FY13
• Acquired URL’s generic business
FY13
Sales in Rs billion
Sun Pharma Ranbaxy
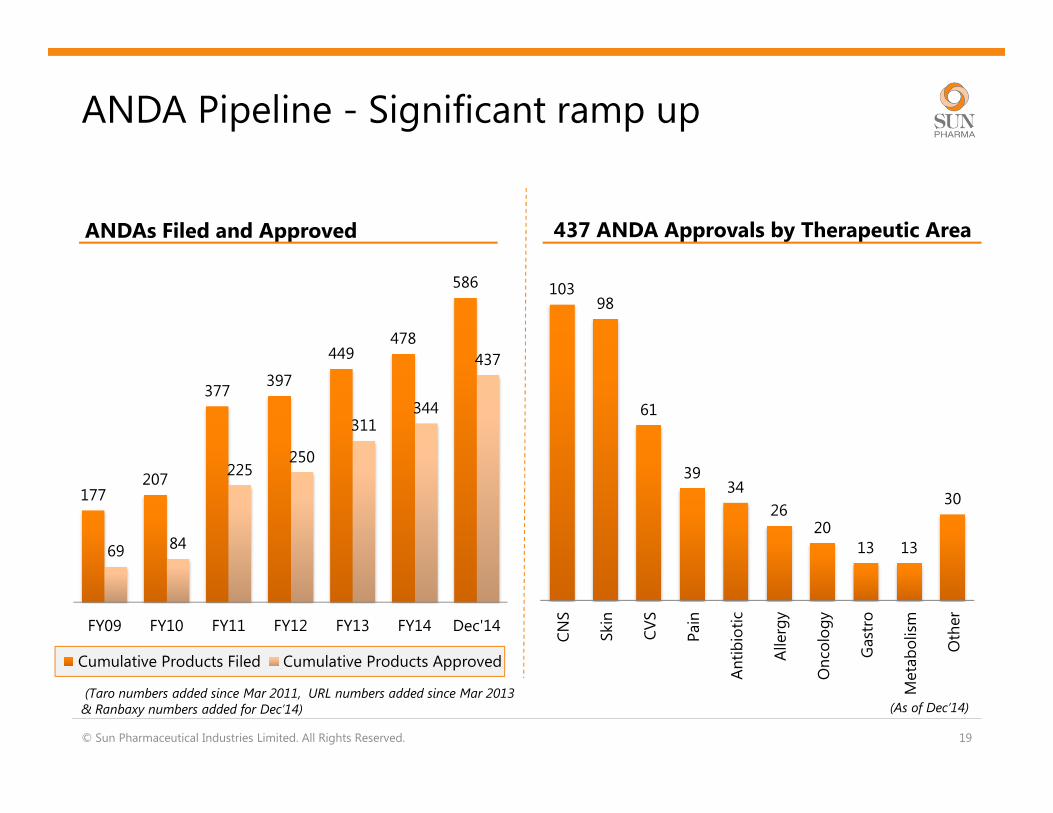
ANDA Pipeline - Significant ramp up
177207
377397
449478
586
69 84
225250
311344
437
FY09 FY10 FY11 FY12 FY13 FY14 Dec'14
Cumulative Products Filed Cumulative Products Approved
© Sun Pharmaceutical Industries Limited. All Rights Reserved. 19
(Taro numbers added since Mar 2011, URL numbers added since Mar 2013 & Ranbaxy numbers added for Dec’14)
10398
61
3934
2620
13 13
30
CN
S
Ski
n
CV
S
Pai
n
An
tib
ioti
c
Alle
rgy
On
colo
gy
Gas
tro
Meta
bo
lism
Oth
er
ANDAs Filed and Approved 437 ANDA Approvals by Therapeutic Area
(As of Dec’14)
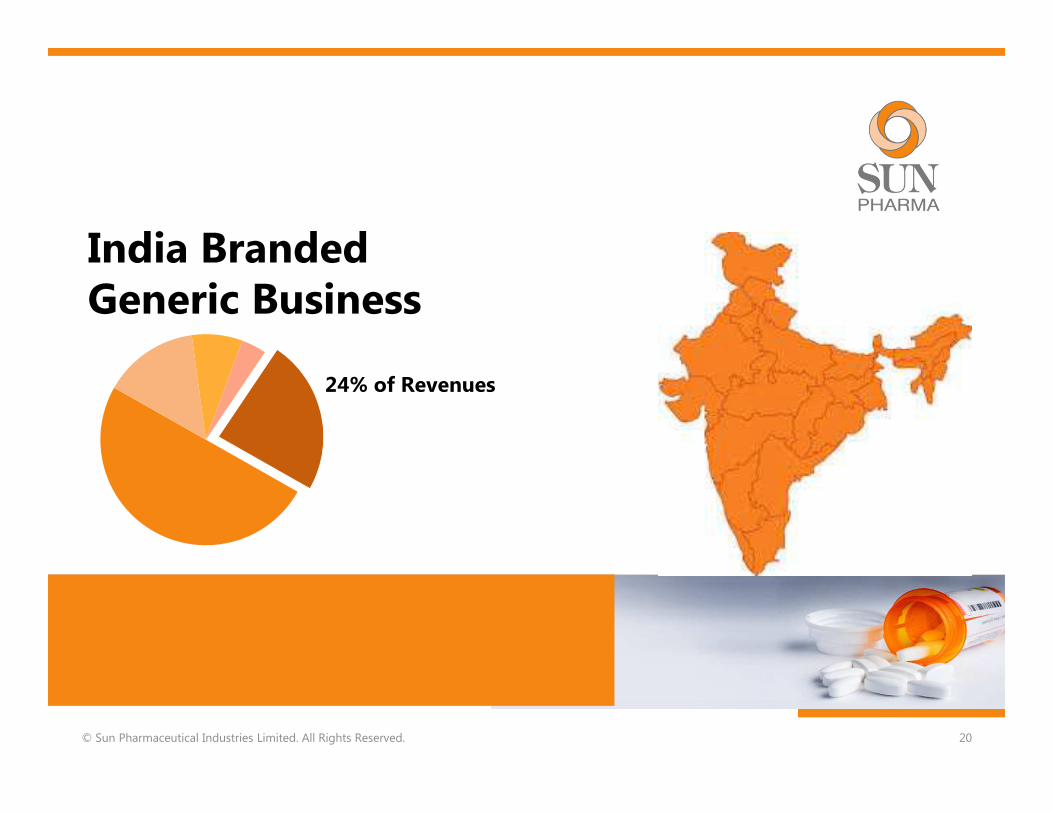
India Branded Generic Business
© Sun Pharmaceutical Industries Limited. All Rights Reserved. 20
24% of Revenues
© Sun Pharmaceutical Industries Limited. All Rights Reserved. 21
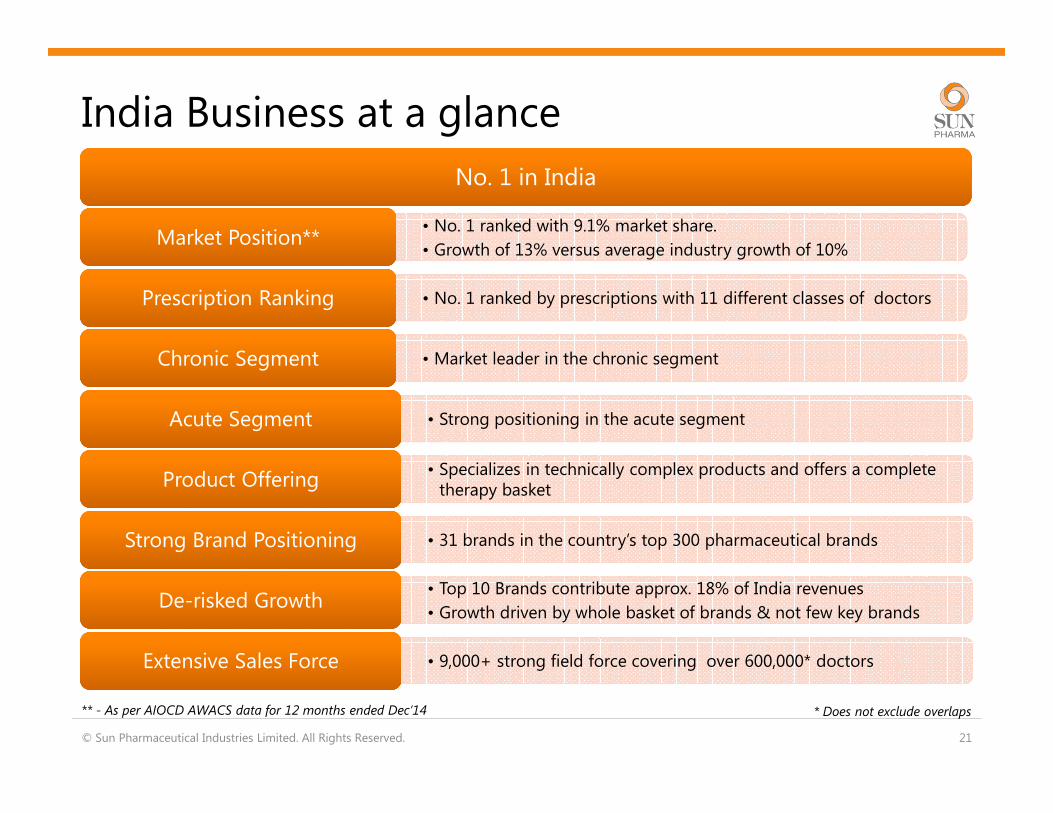
India Business at a glance
No. 1 in IndiaNo. 1 in India
• No. 1 ranked with 9.1% market share.
• Growth of 13% versus average industry growth of 10% Market Position** Market Position**
• No. 1 ranked by prescriptions with 11 different classes of doctorsPrescription RankingPrescription Ranking
• Market leader in the chronic segmentChronic Segment Chronic Segment
• Strong positioning in the acute segmentAcute Segment Acute Segment
• Specializes in technically complex products and offers a complete therapy basket
Product OfferingProduct Offering
• 31 brands in the country’s top 300 pharmaceutical brandsStrong Brand Positioning Strong Brand Positioning
• Top 10 Brands contribute approx. 18% of India revenues
• Growth driven by whole basket of brands & not few key brands De-risked GrowthDe-risked Growth
• 9,000+ strong field force covering over 600,000* doctorsExtensive Sales Force Extensive Sales Force
** - As per AIOCD AWACS data for 12 months ended Dec’14 * Does not exclude overlaps
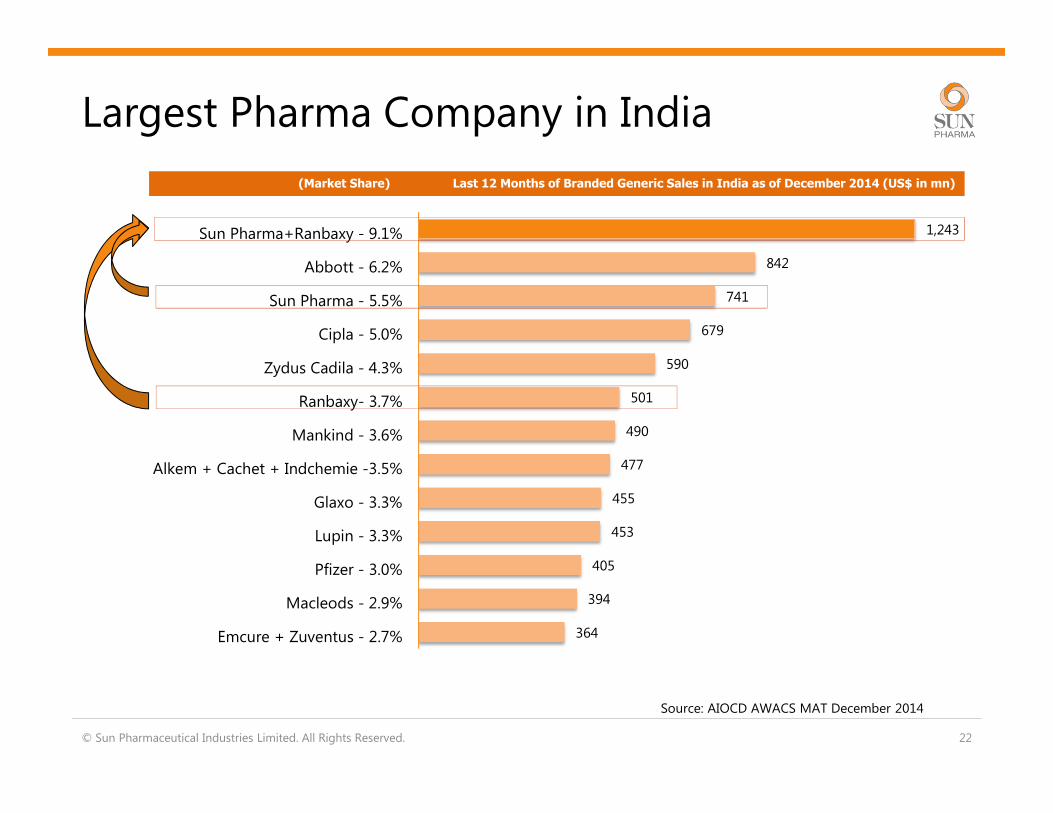
Largest Pharma Company in India
364
394
405
453
455
477
490
501
590
679
741
842
1,243
Emcure + Zuventus - 2.7%
Macleods - 2.9%
Pfizer - 3.0%
Lupin - 3.3%
Glaxo - 3.3%
Alkem + Cachet + Indchemie -3.5%
Mankind - 3.6%
Ranbaxy- 3.7%
Zydus Cadila - 4.3%
Cipla - 5.0%
Sun Pharma - 5.5%
Abbott - 6.2%
Sun Pharma+Ranbaxy - 9.1%
© Sun Pharmaceutical Industries Limited. All Rights Reserved. 22
(Market Share) Last 12 Months of Branded Generic Sales in India as of December 2014 (US$ in mn)
Source: AIOCD AWACS MAT December 2014
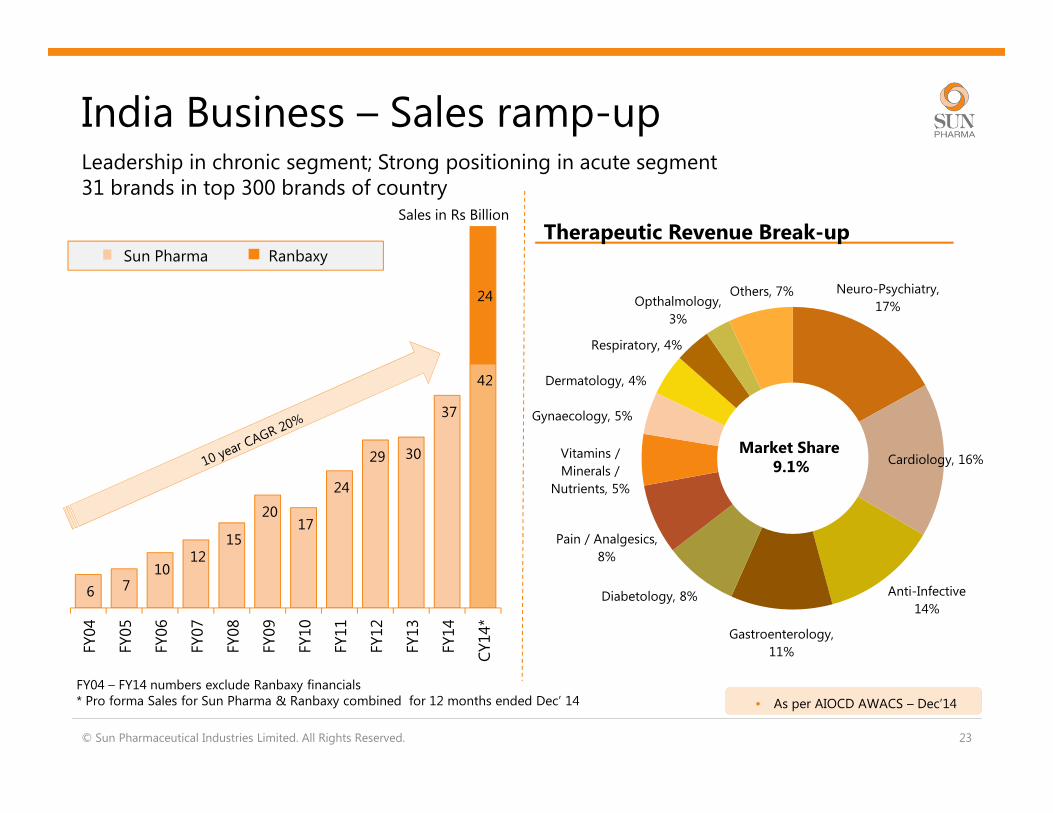
Neuro-Psychiatry,
17%
Cardiology, 16%
Anti-Infective
14%
Gastroenterology,
11%
Diabetology, 8%
Pain / Analgesics,
8%
Vitamins /
Minerals /
Nutrients, 5%
Gynaecology, 5%
Dermatology, 4%
Respiratory, 4%
Opthalmology,
3%
Others, 7%
Market Share 9.1%
India Business – Sales ramp-up
© Sun Pharmaceutical Industries Limited. All Rights Reserved. 23
6 7 10
12 15
20 17
24
29 30
37
42
24
FY04
FY05
FY06
FY07
FY08
FY09
FY10
FY11
FY12
FY13
FY14
CY
14*
• As per AIOCD AWACS – Dec’14
Leadership in chronic segment; Strong positioning in acute segment31 brands in top 300 brands of country
Sales in Rs Billion
Sun Pharma Ranbaxy
Therapeutic Revenue Break-up
FY04 – FY14 numbers exclude Ranbaxy financials* Pro forma Sales for Sun Pharma & Ranbaxy combined for 12 months ended Dec’ 14
0
50
100
150
200
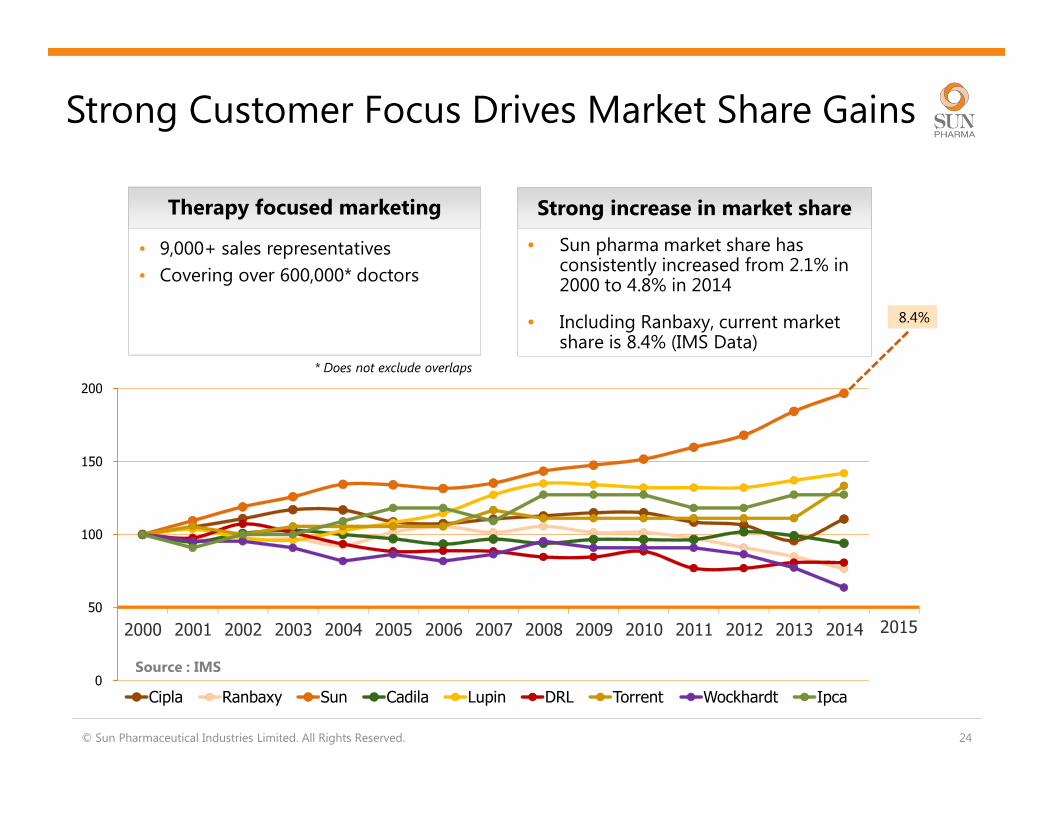
2000 2001 2002 2003 2004 2005 2006 2007 2008 2009 2010 2011 2012 2013 2014
Cipla Ranbaxy Sun Cadila Lupin DRL Torrent Wockhardt Ipca
• Sun pharma market share has consistently increased from 2.1% in 2000 to 4.8% in 2014
• Including Ranbaxy, current market share is 8.4% (IMS Data)
• 9,000+ sales representatives
• Covering over 600,000* doctors
© Sun Pharmaceutical Industries Limited. All Rights Reserved. 24
Strong Customer Focus Drives Market Share Gains
Therapy focused marketing Strong increase in market share
8.4%
Source : IMS
2015
* Does not exclude overlaps
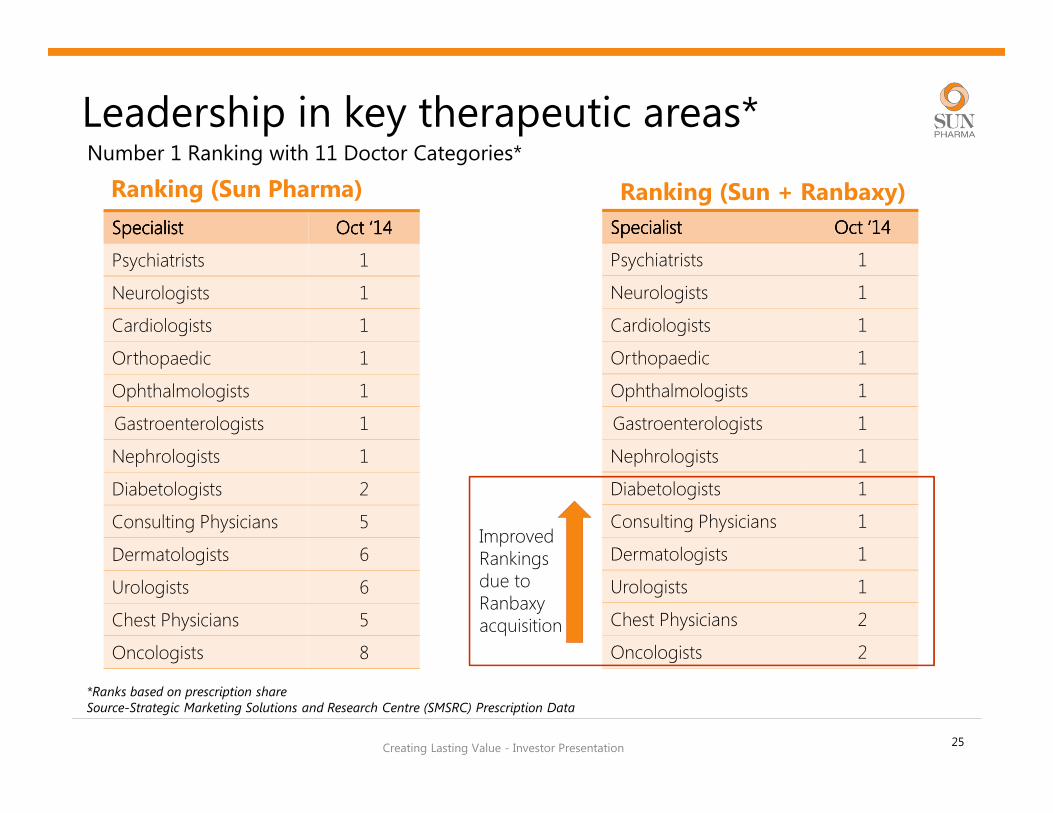
Creating Lasting Value - Investor Presentation 25
Ranking (Sun Pharma)
*Ranks based on prescription shareSource-Strategic Marketing Solutions and Research Centre (SMSRC) Prescription Data
Ranking (Sun + Ranbaxy)
Number 1 Ranking with 11 Doctor Categories*
SpecialistSpecialistSpecialistSpecialist Oct ‘14Oct ‘14Oct ‘14Oct ‘14
Psychiatrists 1
Neurologists 1
Cardiologists 1
Orthopaedic 1
Ophthalmologists 1
Gastroenterologists 1
Nephrologists 1
Diabetologists 1
Consulting Physicians 1
Dermatologists 1
Urologists 1
Chest Physicians 2
Oncologists 2
Improved Rankings due to Ranbaxy acquisition
SpecialistSpecialistSpecialistSpecialist Oct ‘14Oct ‘14Oct ‘14Oct ‘14
Psychiatrists 1
Neurologists 1
Cardiologists 1
Orthopaedic 1
Ophthalmologists 1
Gastroenterologists 1
Nephrologists 1
Diabetologists 2
Consulting Physicians 5
Dermatologists 6
Urologists 6
Chest Physicians 5
Oncologists 8
Leadership in key therapeutic areas*
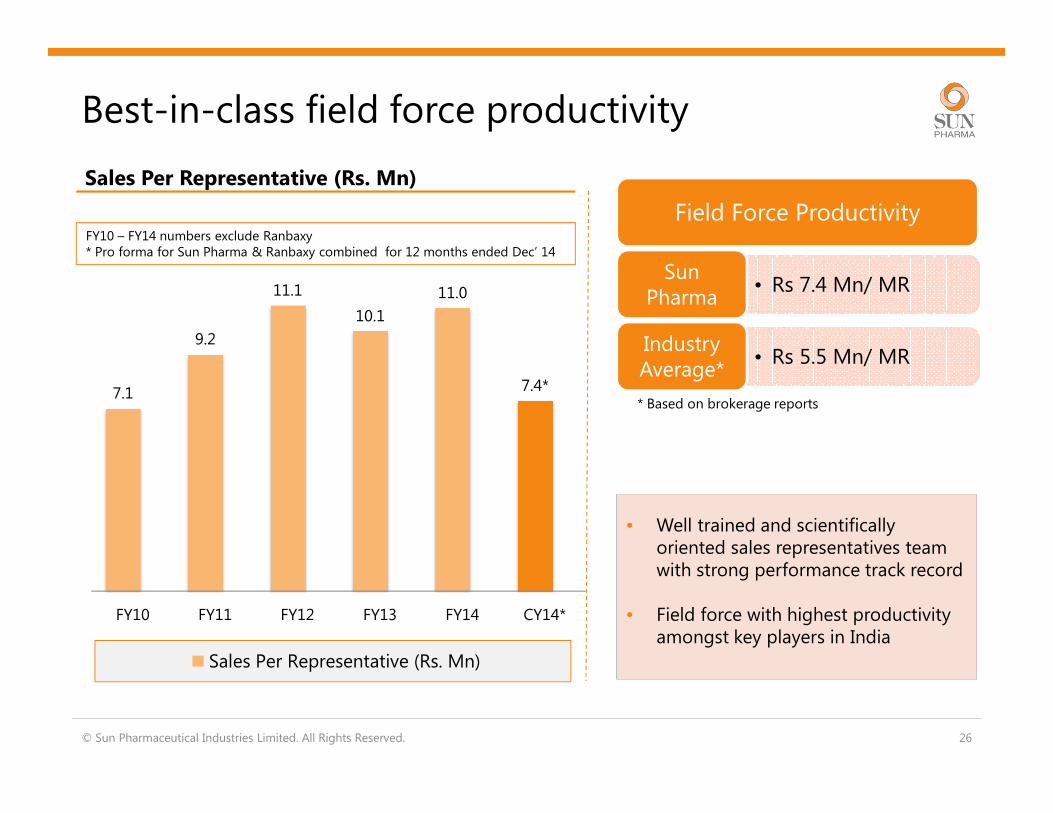
7.1
9.2
11.1
10.1
11.0
7.4*
FY10 FY11 FY12 FY13 FY14 CY14*
Sales Per Representative (Rs. Mn)
Best-in-class field force productivity
© Sun Pharmaceutical Industries Limited. All Rights Reserved. 26
Field Force Productivity
• Rs 7.4 Mn/ MRSun
Pharma
• Rs 5.5 Mn/ MRIndustry Average*
• Well trained and scientifically oriented sales representatives team with strong performance track record
• Field force with highest productivity amongst key players in India
Sales Per Representative (Rs. Mn)
* Based on brokerage reports
FY10 – FY14 numbers exclude Ranbaxy* Pro forma for Sun Pharma & Ranbaxy combined for 12 months ended Dec’ 14
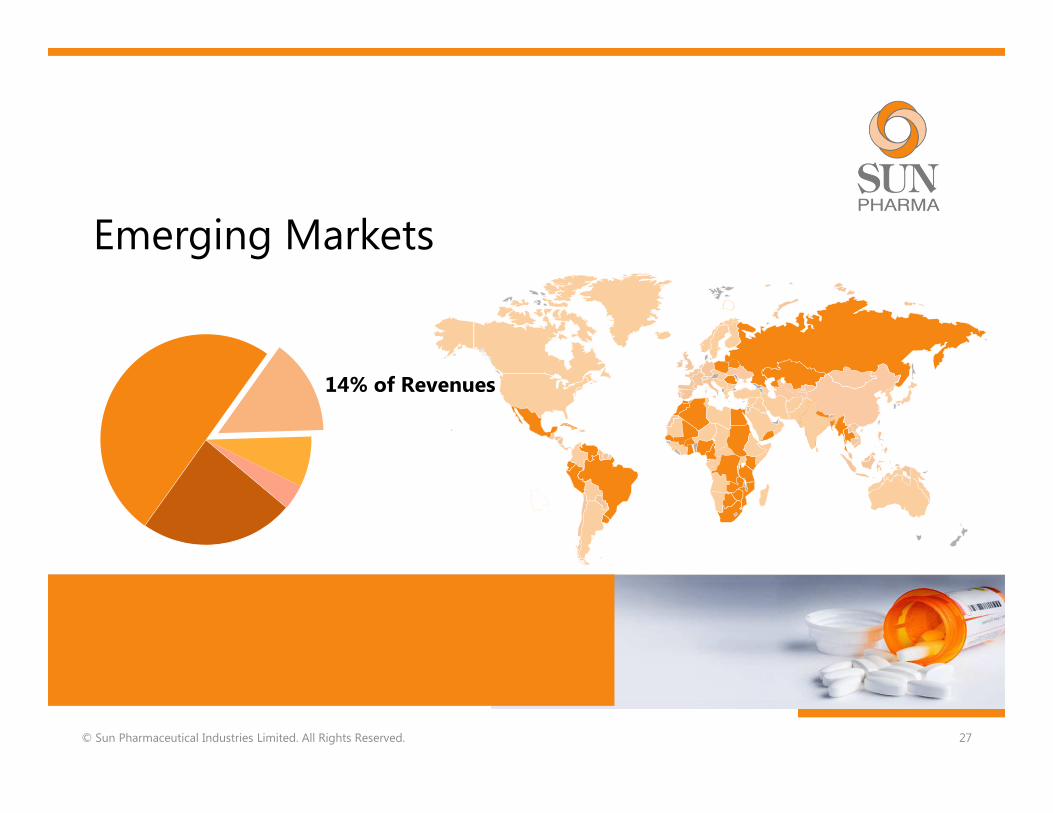
Emerging Markets
© Sun Pharmaceutical Industries Limited. All Rights Reserved. 27
14% of Revenues
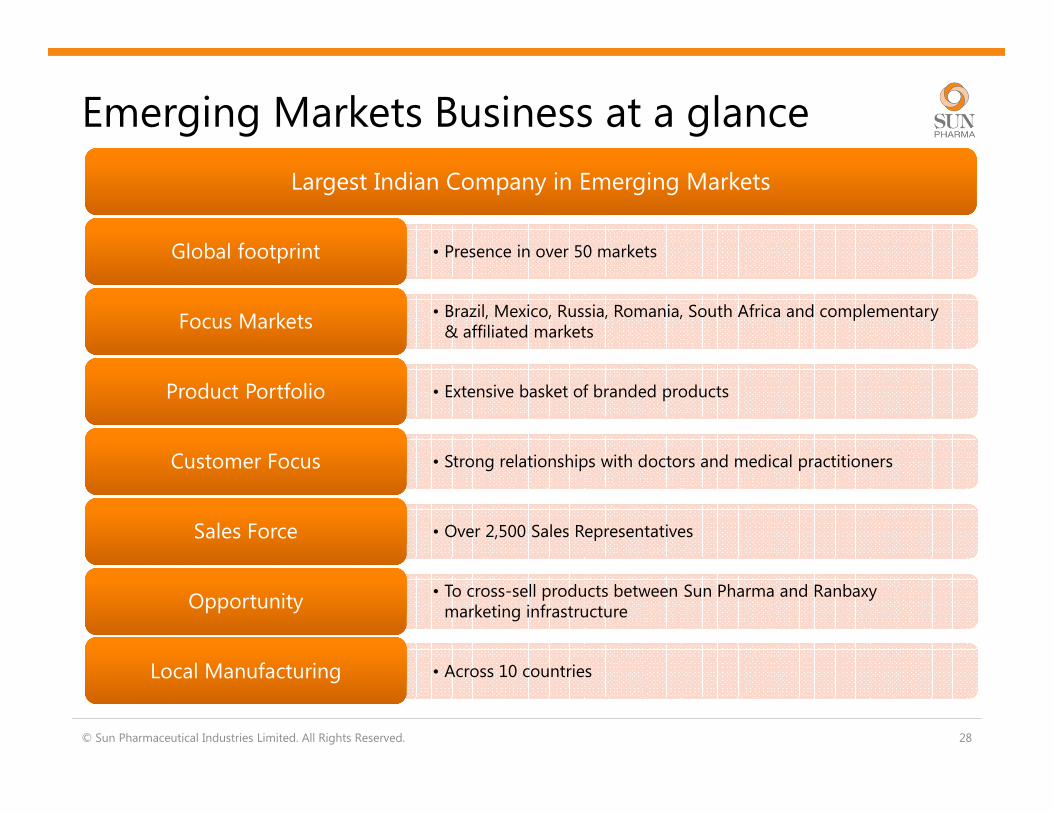
© Sun Pharmaceutical Industries Limited. All Rights Reserved. 28
Emerging Markets Business at a glance
Largest Indian Company in Emerging MarketsLargest Indian Company in Emerging Markets
• Presence in over 50 marketsGlobal footprintGlobal footprint
• Brazil, Mexico, Russia, Romania, South Africa and complementary & affiliated markets
Focus MarketsFocus Markets
• Extensive basket of branded productsProduct PortfolioProduct Portfolio
• Strong relationships with doctors and medical practitionersCustomer FocusCustomer Focus
• Over 2,500 Sales RepresentativesSales ForceSales Force
• To cross-sell products between Sun Pharma and Ranbaxy marketing infrastructure
OpportunityOpportunity
• Across 10 countriesLocal ManufacturingLocal Manufacturing
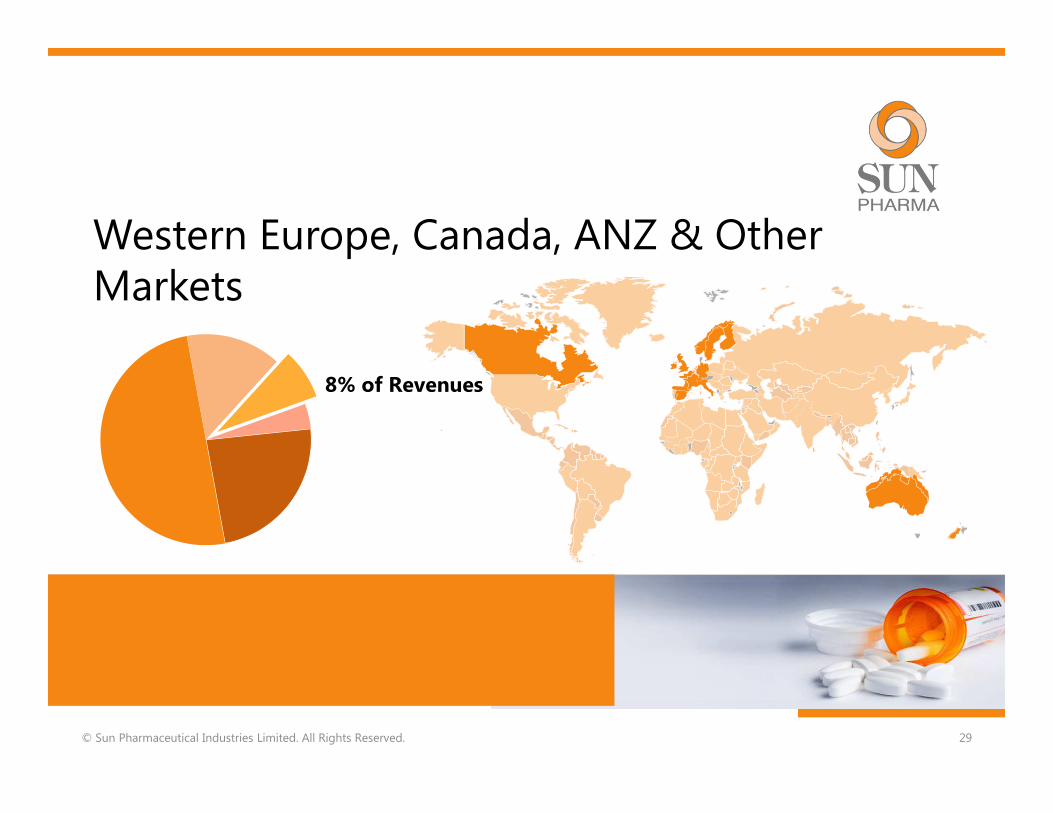
Western Europe, Canada, ANZ & Other Markets
© Sun Pharmaceutical Industries Limited. All Rights Reserved. 29
8% of Revenues
© Sun Pharmaceutical Industries Limited. All Rights Reserved. 30
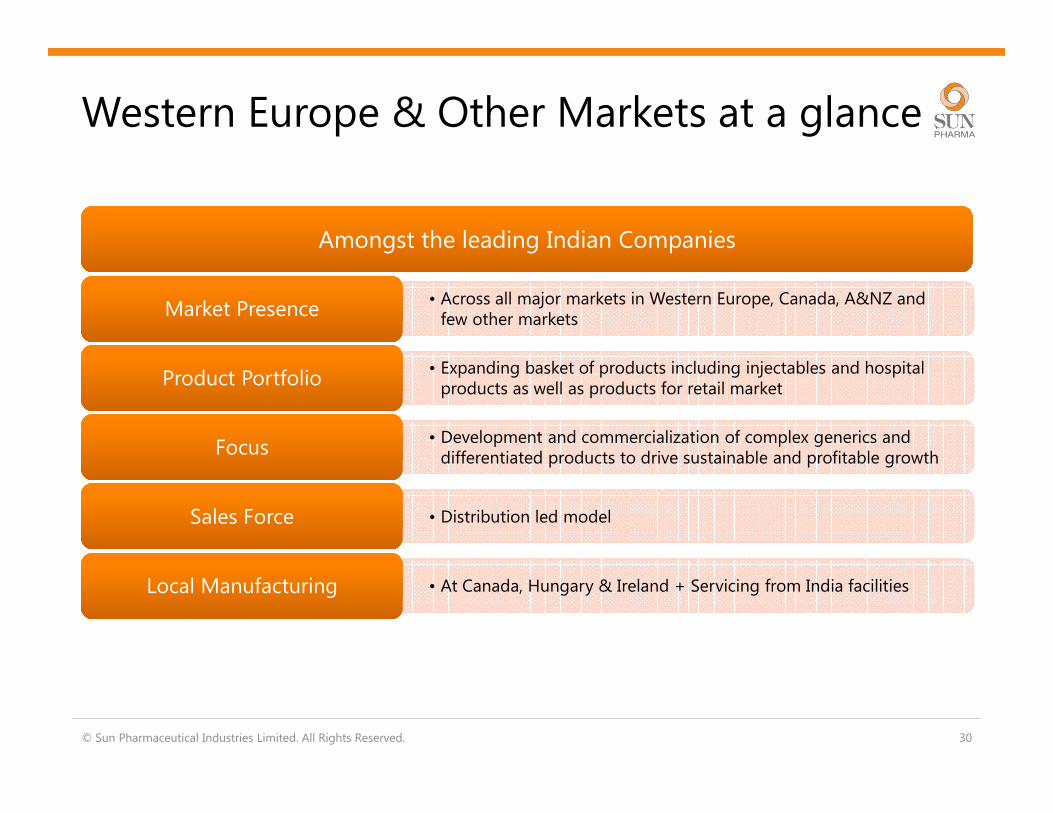
Western Europe & Other Markets at a glance
Amongst the leading Indian CompaniesAmongst the leading Indian Companies
• Across all major markets in Western Europe, Canada, A&NZ and few other markets
Market PresenceMarket Presence
• Expanding basket of products including injectables and hospital products as well as products for retail market
Product PortfolioProduct Portfolio
• Development and commercialization of complex generics and differentiated products to drive sustainable and profitable growth
Focus Focus
• Distribution led modelSales Force Sales Force
• At Canada, Hungary & Ireland + Servicing from India facilitiesLocal ManufacturingLocal Manufacturing
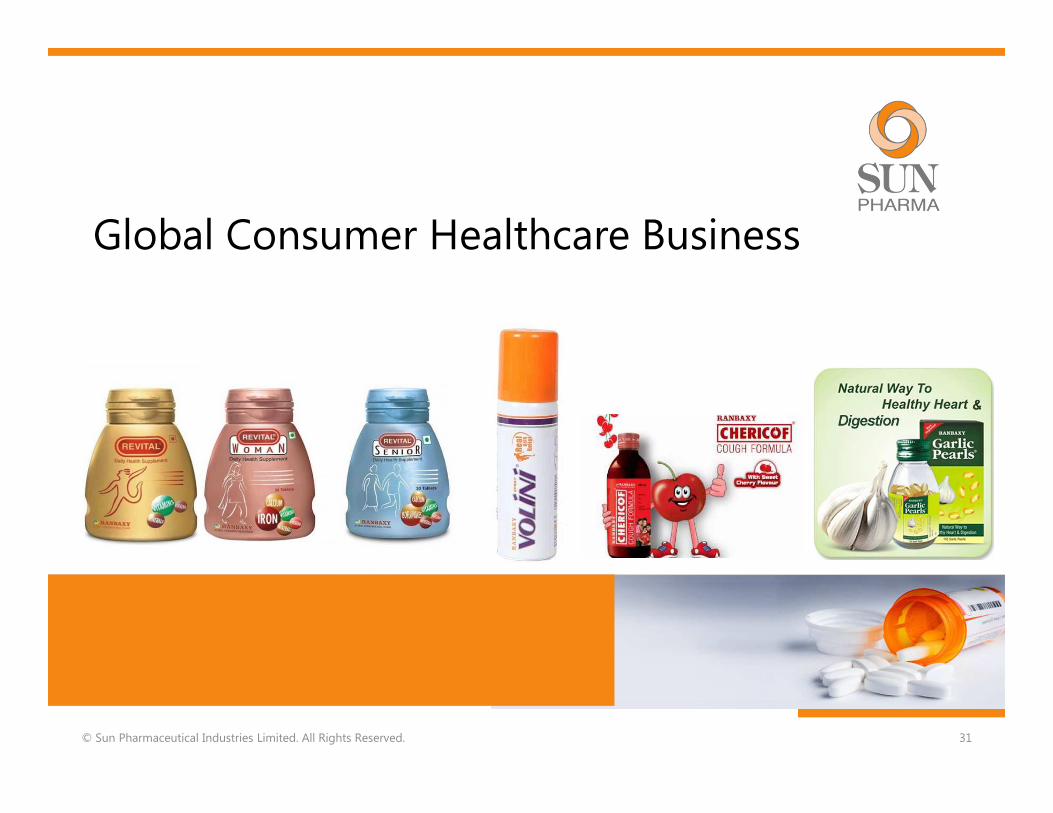
Global Consumer Healthcare Business
© Sun Pharmaceutical Industries Limited. All Rights Reserved. 31
© Sun Pharmaceutical Industries Limited. All Rights Reserved. 32
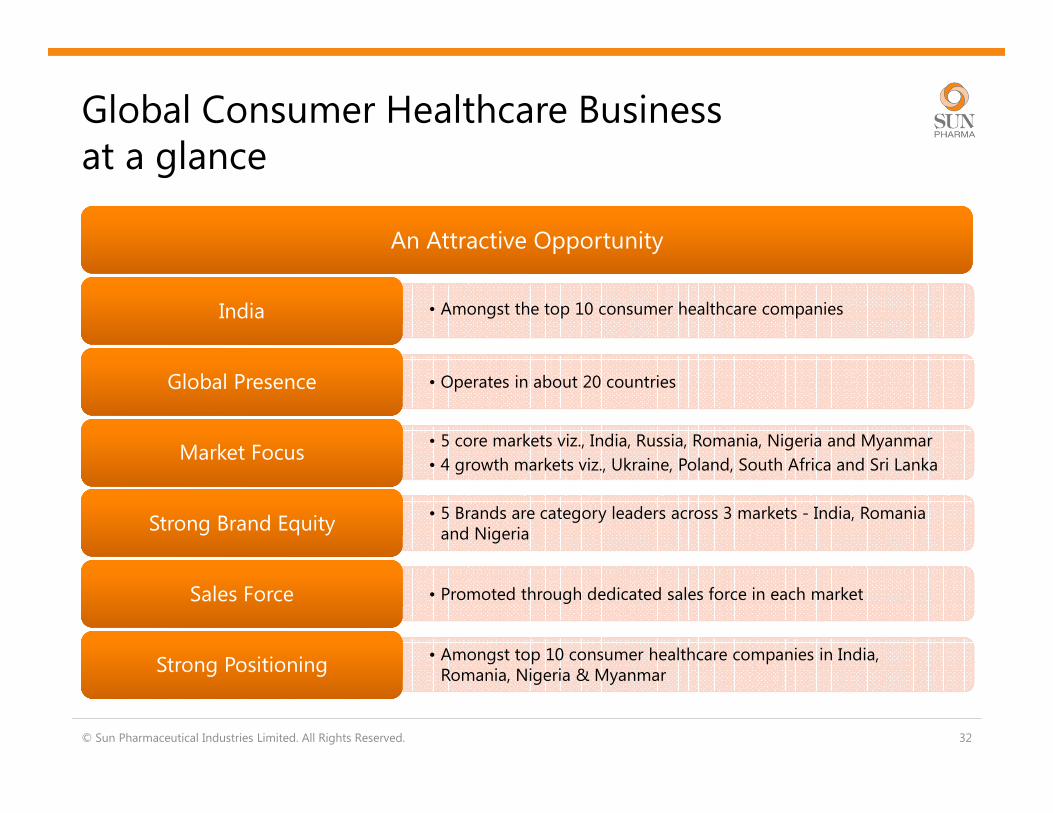
Global Consumer Healthcare Businessat a glance
An Attractive OpportunityAn Attractive Opportunity
• Amongst the top 10 consumer healthcare companiesIndiaIndia
• Operates in about 20 countriesGlobal PresenceGlobal Presence
• 5 core markets viz., India, Russia, Romania, Nigeria and Myanmar
• 4 growth markets viz., Ukraine, Poland, South Africa and Sri LankaMarket FocusMarket Focus
• 5 Brands are category leaders across 3 markets - India, Romania and Nigeria
Strong Brand EquityStrong Brand Equity
• Promoted through dedicated sales force in each marketSales Force Sales Force
• Amongst top 10 consumer healthcare companies in India, Romania, Nigeria & Myanmar
Strong PositioningStrong Positioning
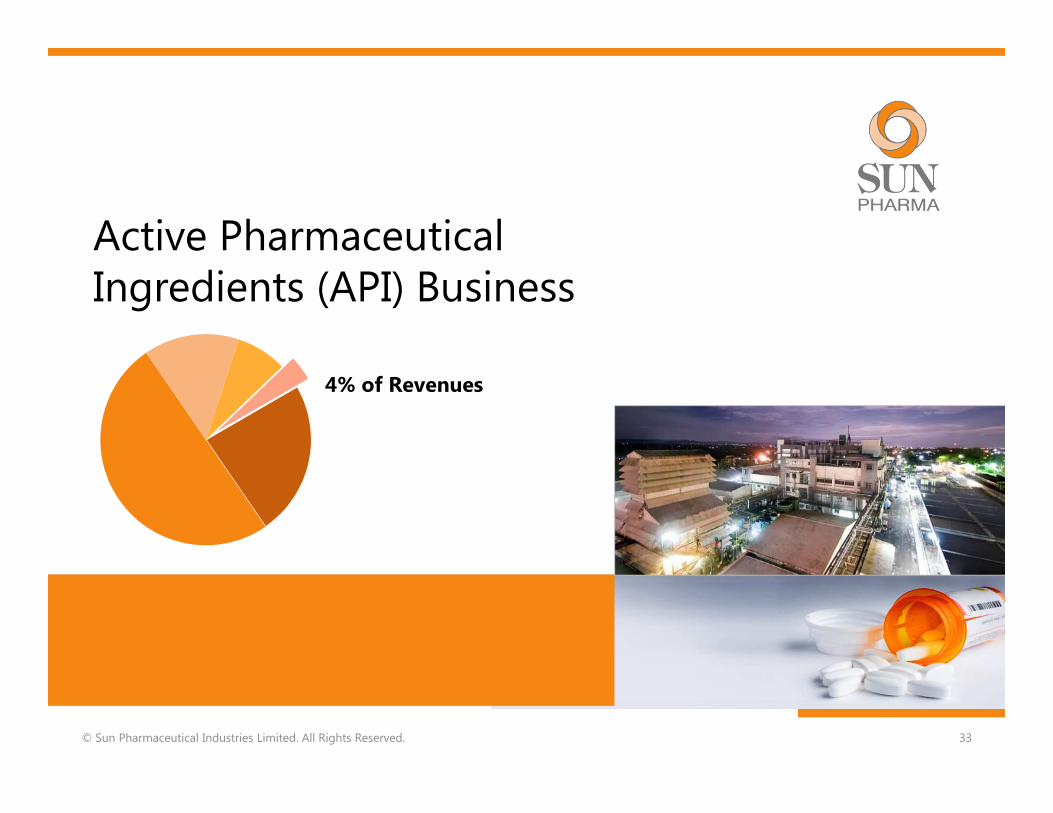
Active Pharmaceutical Ingredients (API) Business
© Sun Pharmaceutical Industries Limited. All Rights Reserved. 33
4% of Revenues
API Business
© Sun Pharmaceutical Industries Limited. All Rights Reserved. 34
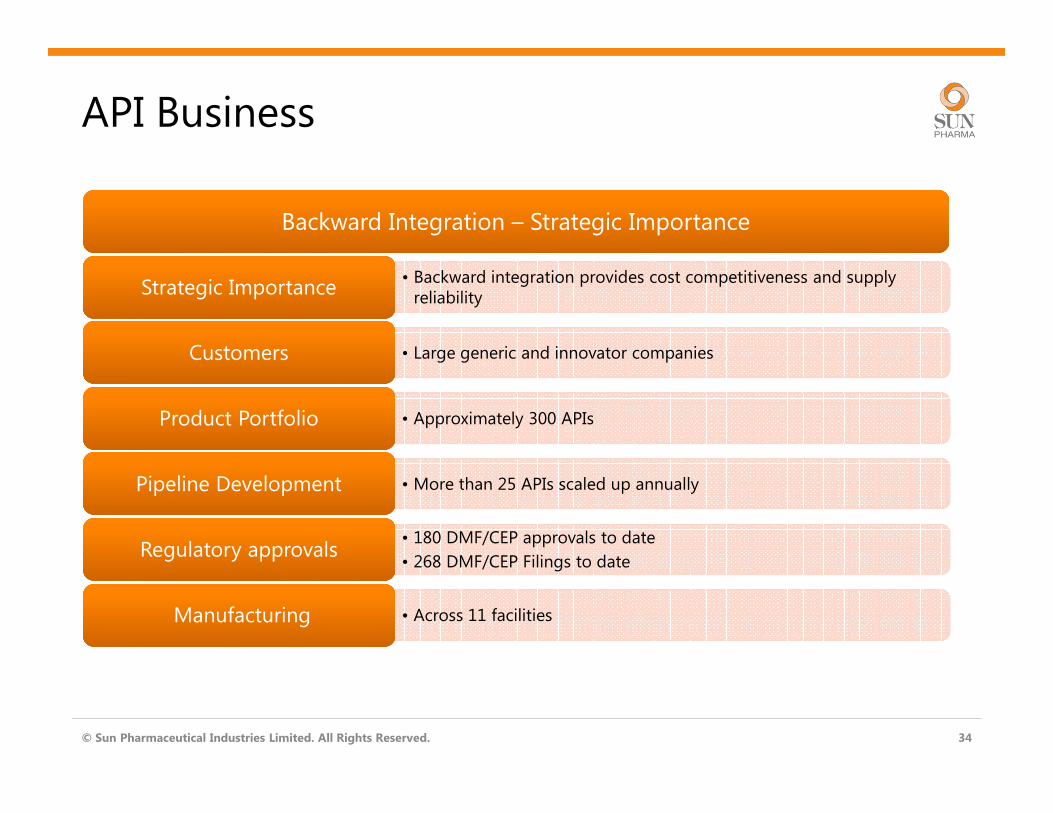
Backward Integration – Strategic ImportanceBackward Integration – Strategic Importance
• Backward integration provides cost competitiveness and supply reliability
Strategic ImportanceStrategic Importance
• Large generic and innovator companiesCustomersCustomers
• Approximately 300 APIsProduct PortfolioProduct Portfolio
• More than 25 APIs scaled up annuallyPipeline DevelopmentPipeline Development
• 180 DMF/CEP approvals to date
• 268 DMF/CEP Filings to dateRegulatory approvalsRegulatory approvals
• Across 11 facilitiesManufacturingManufacturing
Research & Development
© Sun Pharmaceutical Industries Limited. All Rights Reserved. 35

© Sun Pharmaceutical Industries Limited. All Rights Reserved. 36
Research & Development
Cumulative R&D Spend of Rs 58 billion to dateCumulative R&D Spend of Rs 58 billion to date
• R&D spend at 6.3% of Net Sales for CY14*
• Strong cash flows & large scale to support R&D investments R&D Spend R&D Spend
• Strong research teams in generics, finished dosage development, biological support, chemistry
CapabilitiesCapabilities
• 1,800 scientists globally with capabilities across dosage forms like orals, liquids, ointments, gels, sprays, injectables
OrganizationOrganization
• Strong team of intellectual property experts supporting R&D (internal and external lawyers)
IPR SupportIPR Support
• Developing non infringing formulations and development of specialty/complex products
FocusFocus
* Based on Pro forma sales for Sun Pharma and Ranbaxy combined for 12 months ended Dec 31, 2014

3.32.5
3.34.4
7.0
10.4
17.4
FY09 FY10 FY11 FY12 FY13 FY14 CY14*
R&D Expenses (Rs Bn) R&D Exp (% of Net Sales)
489
358
97
79
Filed Approved
R&D Investments
© Sun Pharmaceutical Industries Limited. All Rights Reserved. 37
As of Dec 31, 2014
7.8% 5.8% 5.6% 6.3% 6.5% 6.3%6.2%
266
178
2
2
Filed Approved
586
345
1060
531
Filed Granted
Sun Pharma Ranbaxy
ANDA DMF/CEP Patents
R&D Expenditure Filings and Approvals
FY09 – FY14 numbers exclude Ranbaxy financials* Pro forma Expenditure for Sun Pharma & Ranbaxy combined for 12 months ended Dec’ 14
586
437
268
280
1646
876

Global Manufacturing Presence
© Sun Pharmaceutical Industries Limited. All Rights Reserved. 38

© Sun Pharmaceutical Industries Limited. All Rights Reserved. 39
Global Manufacturing Presence
World Class Manufacturing InfrastructureWorld Class Manufacturing Infrastructure
• 45 manufacturing facilities across India, the Americas, Asia, Africa and Europe
Extensive Global FootprintExtensive Global Footprint
• Vertically integrated network across four continents enabling high quality, low cost and a quick market entry across the geographies
Integrated Network Integrated Network
• One of the few companies that has set up completely integrated manufacturing capability for the production of oncology, hormones, peptides, controlled substances and steroidal drugs
CapabilitiesCapabilities
• High quality manufacturing facilities. Many of the plants have received approvals from US FDA, UK MHRA and various other regulatory authorities
High Quality High Quality
• Ability to manufacture a variety of dosage forms – Orals, Creams, Ointments, Injectables, Sprays, Liquids
Dosage FormsDosage Forms

Formulation Plant API Plant Formulation & API Plant
© Sun Pharmaceutical Industries Limited. All Rights Reserved. 40
Global Manufacturing Footprint
Ahmednagar
Maduranthakam
Jammu
Bangladesh Plant
Sikkim Plant
Halol
Karkhadi
Ankleshwar
Panoli
Silvassa
Dadra
Ontario (Canada)
Aurora
Tennessee
Brayn
Iztapalapa(Mexico)
Wilmington M.A.
Philadelphia
Cranbury
Goiânia (Brazil)
Tiszavasvari(Hungury)
Haifa (Israel)
Toansa
Malanpur
Dewas
Paonta
Goa
Mohali
Batamandi
Baddi-2
Baddi-1
New Jersey(US)
Cashel (Ireland)
Lagos (Nigeria)
Be-Tabs,South Africa)
Kuala Lumpur(Malaysia)
Cluj (Romania)
Rio de Janeiro(Brazil)
Casablanca (Morocco)
Giza, (Egypt)
Ranbaxy’s Manufacturing Facilities
Sun Pharma’s Manufacturing facilities
(US)(US)(US)(US)
(India)(India)(India)(India)
(India)(India)(India)(India)
Billerica, MA

• India : 6, US : 6
• Canada, Brazil, Mexico, Hungary , Israel,
Bangladesh : 1 each
• Capacities available for a variety of
finished dosages
© Sun Pharmaceutical Industries Limited. All Rights Reserved.
41
Finished Dosage Manufacturing
Sun Pharma - 18 Manufacturing sites
� Tablets / Capsules
� Semisolids
� Liquids
� Suppository
� Vials
� Ampoules
� Pre-filled Syringes
� Gels
� Lyophilized Units
� Dry powder
� Eye drops
� MDI
� Aerosols
� Creams
� Ointments
Injectables / Sterile Orals
• India : 7, US : 1
• Ireland, South Africa, Malaysia,
Romania, Brazil, Morocco, Egypt and
Nigeria : 1 each
Ranbaxy - 16 Manufacturing sites
Topicals

• Controlled substances
manufacture
• India : 5, Israel : 1, US : 1, Hungary : 1
© Sun Pharmaceutical Industries Limited. All Rights Reserved.
42
API Manufacturing
Sun Pharma - 8 locations
• International regulatory
approvals: USFDA,
European
• Stand alone units for
peptides, anti-cancer,
steroids, sex hormones
Panoli & Ahmednagar (both India)
APIKey Plants
Hungary &
Tennessee (US)
• India : 3
Ranbaxy - 3 locations

Hasmukh Shah
Former Chairman of
Gujarat Gas & Former
Chairman & Managing
Director, IPCL
. © Sun Pharmaceutical Industries Limited. All Rights Reserved. 43
Corporate Governance
Our philosophy on corporate governance envisages
working towards high levels of transparency,
accountability and consistent value systems across all
facets of operations
Chairman
Israel Makov
Former President
& CEO of Teva
Pharma. Industries Ltd.
Independent Director
Ashwin Dani
Non-Executive Vice
Chairman,
Asian Paints Ltd.
.
Rekha Sethi
Director General
All India Management
Association (AIMA)
Independent Directors & Members of Audit Committee
Keki Mistry
Vice Chairman
& CEO, HDFC Ltd.
.
S. Mohanchand
Dadha
Former Chairman &
Managing Director, TDPL
.

Financials
© Sun Pharmaceutical Industries Limited. All Rights Reserved. 44

FY11FY11FY11FY11 YoYYoYYoYYoY FY12FY12FY12FY12 YoYYoYYoYYoY FY13FY13FY13FY13 YoYYoYYoYYoY FY14FY14FY14FY14 YoYYoYYoYYoY CY14*CY14*CY14*CY14*
P&L SummaryP&L SummaryP&L SummaryP&L Summary
Net Sales 57,229 43% 80,057 40% 112,389 40% 160,044 42% 276,145
Gross Profit 42,577 46% 63,644 49% 91,592 44% 132,250 44% 208,811
EBITDA 19,518 43% 32,507 67% 49,063 51% 71,141 45% 89,406
Net Profit 18,161 34% 26,567 46% 29,830 12% 31,415 5% 54,261
Net Profit (Adjusted) 18,161 34% 26,567 46% 35,666 34% 56,589 59% 54,261
R&D Spend 3,313 26% 4,449 34% 7,042 58% 10,418 48% 17,441
BS SummaryBS SummaryBS SummaryBS Summary Mar'11Mar'11Mar'11Mar'11 YoYYoYYoYYoY Mar'12Mar'12Mar'12Mar'12 YoYYoYYoYYoY Mar'13Mar'13Mar'13Mar'13 YoYYoYYoYYoY Mar'14Mar'14Mar'14Mar'14 YoYYoYYoYYoY Sept'14Sept'14Sept'14Sept'14
Shareholders Funds 94,833 21% 122,358 29% 149,897 23% 185,250 24% 220,086
Loan Funds 3,651 113% 2,650 -27% 1,982 -25% 24,890 3,139
Net Fixed Assets 27,568 64% 32,742 19% 50,771 55% 58,242 15% 66,601
Investments 22,298 -30% 22,129 -1% 24,116 9% 27,860 16% 25,177
Cash and Bank Balances 22,046 333% 33,672 53% 40,587 21% 75,902 87% 63,659
Inventory 14,895 39% 20,870 40% 25,778 24% 31,230 21% 33,416
Sundry Debtors 11,049 -6% 20,787 88% 24,122 16% 22,004 -9% 34,918
Sundry Creditors 6,454 102% 9,927 54% 10,580 7% 13,283 26% 16,321
© Sun Pharmaceutical Industries Limited. All Rights Reserved. 45
FinancialsMarket Capitalisation Rs. 2,100 billion / US$ 33 billion
Exchange Rate : For Market Capitalisation US$1 = Rs 62.67 (As on 13 Mar 2015)
# Adjusted for Rs 5.83 bn provision related to generic Protonix settlement for the year 2012-13 andAdjusted for Rs 25.17 bn provision related to generic Protonix settlement for the year 2013-14
# #
All figures from FY11 to FY14 exclude Ranbaxy aqcuisition which is effective from 01 April 2014All Balance Sheet figures excludes Ranbaxy* Pro forma Sales for Sun Pharma & Ranbaxy combined for 12 months ended Dec’ 14

© Sun Pharmaceutical Industries Limited. All Rights Reserved. 46
Sales Break-up
17 24 29 30 37
6611
2335
62
98
139
6
6
11
15
19
62
65
6
8
8
11
FY10 FY11 FY12 FY13 FY14 CY14*
India Formulations US Formulations Rest of World API+Others
Taro Consolidation
URL & Dusa part-consolidation
Full year consolidation for URL & Dusa
546 611
1085
1132
1620
2282
281
316
1022
140
135
175
FY13 FY14 CY14*
40 58 81 114 162 278 2,099 2,682Gross Sales
*Exchange Rate : US$1 = Rs 54.36 (for FY13)US$1 = Rs 60.41 (for FY14)US$1 = Rs 61.03 (for CY14)
4,564
Rest of world includes all formulations sales excluding US & India
In INR Billion In USD Million
FY10 – FY14 numbers exclude Ranbaxy financials* Pro forma Sales for Sun Pharma & Ranbaxy combined for 12 months ended Dec’ 14

© Sun Pharmaceutical Industries Limited. All Rights Reserved. 47
EBITDA Trend
34% 34%41% 44% 44%
32%
27% 26%
24%24% 25%
28%
12% 14%15%
14% 13%
16%
27% 26%21% 19% 17%
24%
FY10 FY11 FY12 FY13 FY14 CY14*
EBITDA Other Expenditure Personnel Costs Material Costs
% of Net Sales
39 57 80 112 160 276Net Sales
Key drivers include Taro, generic Doxil, Doxycycline & other low competition products in US
Impact of Ranbaxy acquisition
In INR Billion
FY10 – FY14 numbers exclude Ranbaxy financials* Pro forma Sales for Sun Pharma & Ranbaxy combined for 12 months ended Dec’ 14

© Sun Pharmaceutical Industries Limited. All Rights Reserved. 48
Cash Flow
8
24 22
34
40
FY10 FY11 FY12 FY13 FY14
5
19
15
25
31
FY10 FY11 FY12 FY13 FY14
Net Cash From Operating Activities (Rs Bn) Free Cash Flow (Rs Bn)
All numbers above exclude Ranbaxy financials

FY11FY11FY11FY11 FY12FY12FY12FY12 FY13FY13FY13FY13 FY14FY14FY14FY14
Growth (%)Growth (%)Growth (%)Growth (%)
Net Sales 42.8 39.9 40.4 42.4
Gross Profit 46.3 49.5 43.9 44.4
EBITDA 43.2 66.5 50.9 45.0
Net Profit 34.4 46.3 12.3 5.3
Net Profit (Adjusted) 34.4 46.3 34.3 58.7
Margins (%)Margins (%)Margins (%)Margins (%)
Gross Margin 74.4 79.5 81.5 82.6
EBITDA Margin (%) 34.1 40.6 43.7 44.5
Net Margin 31.7 33.2 26.5 19.6
Net Margin (Adjusted) 31.7 33.2 31.7 35.4
Return (%)Return (%)Return (%)Return (%)
ROCE 20.3 23.8 26.7 27.6
ROE 21.0 23.8 25.7 30.9
OthersOthersOthersOthers
Debt / Equity 0.04 0.02 0.01 0.13
Fully Diluted EPS (Rs) Post bonus 8.8 12.8 14.4 15.2
Fully Diluted EPS (Rs) Post bonus (Adjusted) 8.8 12.8 17.2 27.3
R&D Spend % of Net SalesR&D Spend % of Net SalesR&D Spend % of Net SalesR&D Spend % of Net Sales 5.8 5.6 6.3 6.5
Revenue 5.4 5.1 5.9 6.2
Capital 0.4 0.5 0.4 0.3
© Sun Pharmaceutical Industries Limited. All Rights Reserved. 49
Financial Ratios
* Adjusted for Rs 5.83 bn provision related to generic Protonix settlement for the year 2012-13.# Adjusted for Rs 25.17 bn provision related to generic Protonix settlement for the year 2013-14.All numbers above exclude Ranbaxy financials
*
*
*
#
#
#

Key Milestones targeted for future
© Sun Pharmaceutical Industries Limited. All Rights Reserved. 50
• Enhance share of specialty/branded business
• Continue to focus on complex generics and high entry barrier segments
• Ensure broad product offering to customers across multiple dosage forms
• Gain critical mass in key therapeutic segments
US Business
US Business
• Improve productivity of India business
• Maintain leadership position in a fiercely competitive market
• Continuously innovate to ensure high brand equity with doctors
India Business
India Business
• Gain critical mass in key emerging markets
• Enhance product basket in emerging markets
• Improve profitability in developed European markets
RoW Business
RoW Business

Key Milestones targeted for future
© Sun Pharmaceutical Industries Limited. All Rights Reserved. 51
• Maintain leadership in existing markets through focus on innovative solutions
• Enhance presence in high growth markets
Global Consumer
Healthcare
Global Consumer
Healthcare
• Develop more products through expanded R&D team for global markets
• Focus on developing complex products across multiple dosage formsR&DR&D
• Ensuring 24x7 compliance to cGMP is imperative for a global business
• Continuously enhance systems, processes, human capabilities to ensure compliance with global regulatory standards
• Ensure resolution of consent decree at Ranbaxy’s facilities
Regulatory/ Quality
Regulatory/ Quality
• Target sustainable and profitable growth
• Deliver on the US$ 250 million synergy benefits from Ranbaxy acquisition by FY18FinancialFinancial

© Sun Pharmaceutical Industries Limited. All Rights Reserved. 52
Sun Pharma at a glance5th Largest Global Specialty Generic Company5th Largest Global Specialty Generic Company
• Ranked 5th in US / Largest Indian Pharma Company in USUSUS
• No. 1 Pharma Company in IndiaIndiaIndia
• Largest Indian Pharma Company in Emerging MarketsEmerging MarketsEmerging Markets
• Expanding presence in EuropeEurope Europe
• 45 manufacturing sites across the worldManufacturing FootprintManufacturing Footprint
• Presence in more than 150 countries across branded and generic markets
Market PresenceMarket Presence
• Portfolio of more than 3,000 products across the worldProduct PortfolioProduct Portfolio
• 30,000+ global employee baseEmployeesEmployees
• Multiple facilities approved by various regulatory authorities across the world including USFDA
Quality ComplianceQuality Compliance
• Capabilities across dosage forms like injectables, sprays, ointments, creams, liquids, tablets and capsules
R&D and ManufacturingR&D and Manufacturing
• Specialty products, branded generics, complex generics, pure generics & APIs
Addressable SegmentsAddressable Segments

Thank YouInvestors:
Nimish Desai
Tel : +91 22 4324 4324, Ext 2778
Tel Direct +91 22 43242778
Mobile : +91 98203 30182
Thank You! For more information please contact:
© Sun Pharmaceutical Industries Limited. All Rights Reserved. 53
© 2015 Sun Pharmaceutical Industries Limited., All Rights Reserved.“SUN Pharma”, The Sun Pharmaceutical Industries Logo are trademarks of Sun Pharmaceutical Industries Limited.
This material was used during an oral presentation; it is not a complete record of the discussion. This work may not be used, sold, transferred, adapted, abridged, copied or reproduced in whole on or in part in any manner or form or in any media without the prior written consent. All product names and company names and logos mentioned herein are the trademarks or registered trademarks of their respective owners.
Media:
Frederick Castro
Tel : +91 22 4324 4324, Ext 2777
Tel Direct : +91 22 43242777
Mobile : +91 99206 65176
Corporate Address:
SUN HOUSE, CTS No. 201 B/1, Western Express Highway, Goregaon (E), Mumbai 400063
NSE:SUNPHARMA, BSE: 524715, Reuters: SUN.BO, Bloomberg: SUNP INCIN: L24230GJ1993PLC019050www.sunpharma.com