lansing central school district district assessment results presentation may 14, 2012 dr. stephen l....
TRANSCRIPT

Lansing Central School District
District Assessment Results PresentationMay 14, 2012
Dr. Stephen L. Grimm, Superintendent District Leadership Team
1
AGENDA
District• State Policy Overview
• Grades 3-8 ELA, Math All Student trends
• Key Findings
Grades 3-8 • Grade 3-8 ELA and Math results• Students with Disabilities
• Students with Economic Disadvantage
• Gender Comparisons
• Key Findings
High School• Regents exam results • Integrated Algebra
• Geometry• Earth Science• Living Environment
• Global Studies• US History• ELA• Advanced Exams
• College Readiness
2
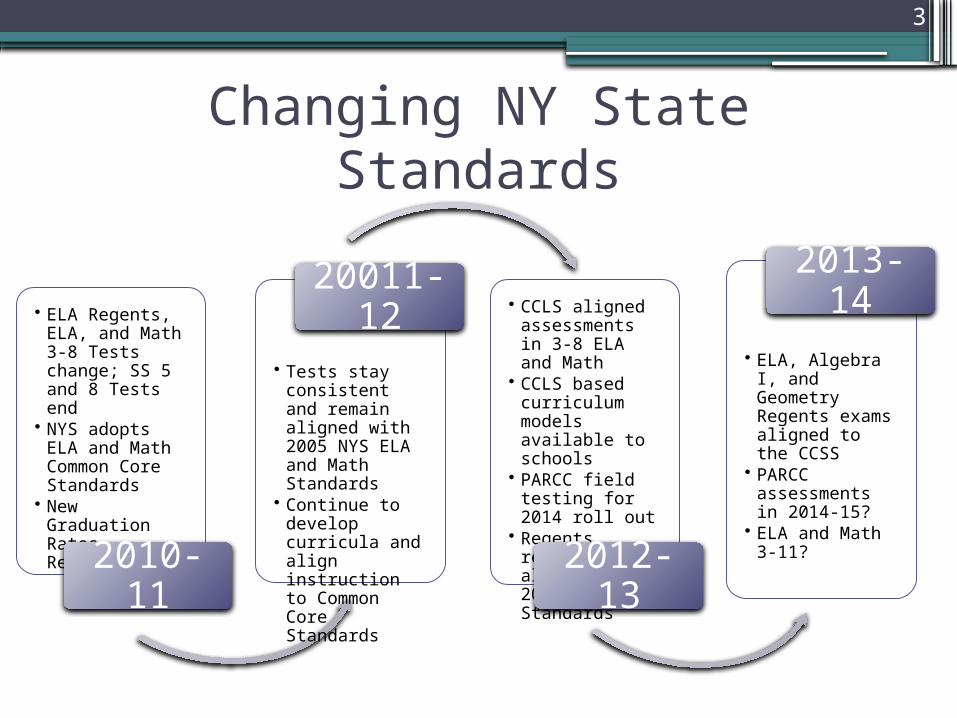
Changing NY State Standards
• ELA Regents, ELA, and Math 3-8 Tests change; SS 5 and 8 Tests end
• NYS adopts ELA and Math Common Core Standards
• New Graduation Rates Required
2010-11
• Tests stay consistent and remain aligned with 2005 NYS ELA and Math Standards
• Continue to develop curricula and align instruction to Common Core Standards
20011-12
• CCLS aligned assessments in 3-8 ELA and Math
• CCLS based curriculum models available to schools
• PARCC field testing for 2014 roll out
• Regents remain aligned to 2005 Standards
2012-13
• ELA, Algebra I, and Geometry Regents exams aligned to the CCSS
• PARCC assessments in 2014-15?
• ELA and Math 3-11?
2013-14
3

Grades 3-8 ELA All Students

Grades 3-8 Math All Students

High School Graduation All Students

District Level Key Findings• Lansing teachers supported 8% (about 50) more
students to proficient levels in 3-8 ELA and Math in 2011.
• All students meet the higher proficiency standards at rates of 73% and 78% in grades 3-8.
• Graduation rates have fluctuated 5 % (5 students) every year, but remain among the highest in the area.
• In grades 3-8, proficiency gaps of 24%-28% persist between students from low income families and all other students.
• In grades 3-8, proficiency gaps of 61-64% persist between students with disabilities and all other students

District Level Next Steps•Summer 2012 and 2012-13 C and I work:
▫Alignment of curriculum and instruction with the NYS Common Core Learning Standards and Instructional Shifts
▫Local and regional assessment development▫Prioritized learning standards ▫Data informed instruction▫Targeted instructional interventions for
students and student groups▫Collaborative and workshop based professional
learning around effective instruction for all students.

AGENDADistrict
Grad
es 3-8
•Grade 3-8 ELA and Math results•Students with Disabilities•Students with Economic Disadvantage•Gender Comparisons
•Key Findings
High Scho
ol
9

Grades 3-8 ELA All Students

Grades 3-8 ELA Students with Disabilities

Grades 3-8 Students from Economically Disadvantaged Families

Grades 3-8 ELA Gender Comparison

Grades 3-8 Math All Students

Grades 3-8 Math Students With Disabilities

Grades 3-8 Math Students from Economically Disadvantaged Families

Grades 3-8 Math Gender Comparisons

RC Buckley Level Key Findings• Our students receive a quality education and we have
excellent teachers.
• RC Buckley students made Adequate Yearly Progress (AYP) and are considered In Good Standing in both ELA and Math (All students, white students and economically disadvantaged students).
• Students who are economically disadvantaged and have a disability tend to score a high 1 or low 2 on both ELA and Math.
• The is a growing gap between students scoring a 3 and a 4.
18

RC Buckley Level Next Steps• Continuous professional development.
• Continuous curriculum improvement and alignment.
• Continued support for programs, materials and supplies to assist our students at risk – morning/ afterschool homework club, school supplies, materials for instruction) clubs and opportunities for students.
• Continued support for enrichment opportunities for our all of our students to be able to reach their potential and beyond.
• Review and update our strategic plan to match our current needs.
19

Middle School Key Findings
•LMS continues to improve in both ELA and math scores for students in all grades.
•“All Students” scores were higher than all schools in the area at all grade levels.
•Scores for low SES students and Special Education students continue to lag behind the rest of our population.

Middle School Next Steps• Continued focus on Professional Development
including district and grant funded opportunities for teachers this summer
• Further development of literacy training and initiatives – Wilson Just Words, Literacy Team, Seven Valleys Writing Project
• Continued development of the After School Program for Identified Students – grant funded
• Establishment of true RTI process with range of full interventions and evaluative tools in place
• Continued development of the Cooperative Co-teaching model

AGENDADistrict
Grad
es 3-8
High Scho
ol
•Regents exam results •Integrated Algebra•Geometry•Earth Science•Living Environment•Global Studies•US History•ELA•Advanced Exams
•College Readiness
22


Lansing HS TST BOCES CNYRIC0%
10%
20%
30%
40%
50%
60%
70%
80%
90%
100%
English
CY 2004CY 2005CY 2006CY 2007CY 2008
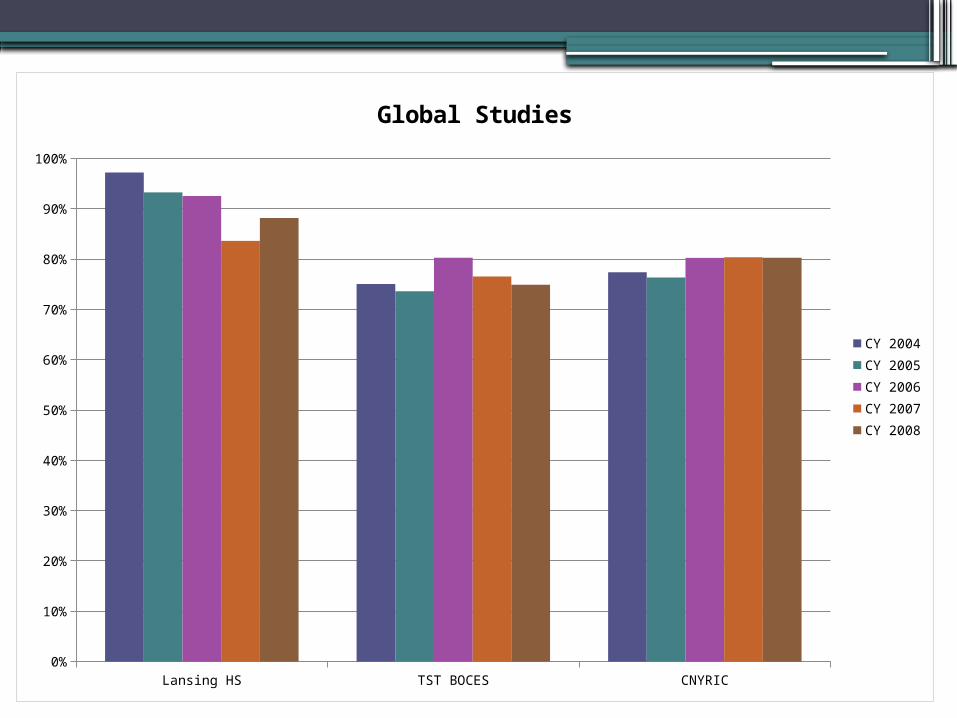
Lansing HS TST BOCES CNYRIC0%
10%
20%
30%
40%
50%
60%
70%
80%
90%
100%
Global Studies
CY 2004CY 2005CY 2006CY 2007CY 2008
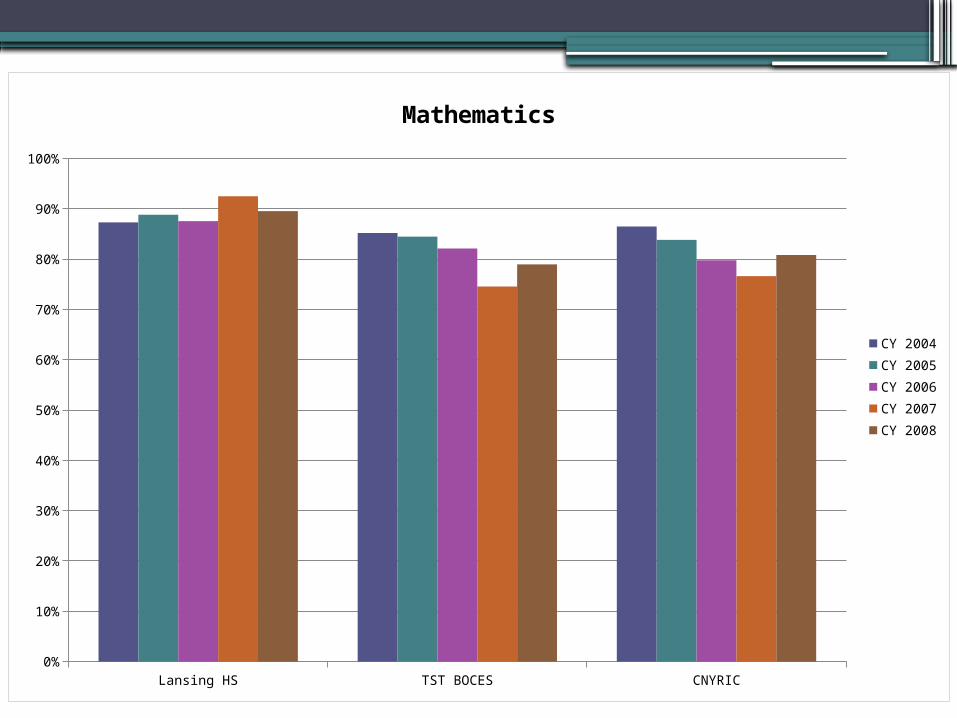
Lansing HS TST BOCES CNYRIC0%
10%
20%
30%
40%
50%
60%
70%
80%
90%
100%
Mathematics
CY 2004CY 2005CY 2006CY 2007CY 2008

Lansing HS TST BOCES CNYRIC0%
10%
20%
30%
40%
50%
60%
70%
80%
90%
100%
Science
CY 2004CY 2005CY 2006CY 2007CY 2008

Lansing HS TST BOCES CNYRIC0%
10%
20%
30%
40%
50%
60%
70%
80%
90%
100%
Second Languages
CY 2004CY 2005CY 2006CY 2007CY 2008

Lansing HS TST BOCES CNYRIC0%
10%
20%
30%
40%
50%
60%
70%
80%
90%
100%
Social Studies
CY 2004CY 2005CY 2006CY 2007CY 2008


High School Key Findings• Lansing NYS Regents scores exceeded scores in
the TST and NYS region.• Lansing mastery level regents scores, 85-100
were above in all areas but one, Chemistry, by 1%.• SAT scores in both Reading and Math have been
on a five year increase.• ACT scores show high % of students that are
ready for college course work. • AP test scores of 3 or more exceed NYS and
country by an average of 30%.• Lansing students are exceeding in all areas of
testing both locally and state wide.

High School Next Steps• Continue to create and maintain small work
group environments for students with academic needs.
• Grow the RTI and SST process to support all students.
• Continue to improve on alternate and cohesive ways of learning including, PLATO, co-teaching, and differentiated instruction.
• Working with the 2012-13 NYS mandates, create and implement, SLO’s and local assessments that help positive student learning.

Conclusions
•Focus•Funding•Opportunity