land use/land cover change detection: a case study of ... · pdf fileidentification,...
TRANSCRIPT

INTERNATIONAL JOURNAL OF GEOMATICS AND GEOSCIENCES Volume 4, No 4, 2014
© Copyright 2010 All rights reserved Integrated Publishing services
Research article ISSN 0976 – 4380
Submitted on February 2014 published on May 2014 600
Land use/land cover change detection: a case study of Usilampatti Block, Madurai District, Tamil Nadu
Pradeep. C1*, Bharadwaj A.K1, Thirumalaivasan.D1
Institute of Remote Sensing, Anna University, Chennai *Corresponding author: [email protected]
ABSTRACT
Land use/ land cover change detection study over the year 1990-2001have been carried out for the study area of “Usilampatti Block” in Madurai district. For this study, the multi-temporal data sets of the years 1990 and 2001 from LANDSAT-5 TM and LANDSAT-7 ETM+ were used. Different land use/landcover features havebeen identified using visual interpretation techniques. The findings are,major part of the study area is Agricultural land, which covers about 105.352 sq. km in 1990 and 115.5683 sq. km in 2001; natural vegetation covers about 86.5 sq. km in 1990 and 67.288 sq. km in 2001; wasteland covers about 68.371 sq. km in 1990 and 76.233 sq. km in 2001, built-up covers about 1.976 sq. km in 1990 and 2.68 sq. km in 2001.
Keywords: Land use/land cover, LANDSAT, Madurai, Visual interpretation.
1. Introduction
Landuse/landcover change is critically linked to the interaction of nature and human and its influences on environment (Prakasam, 2010). Information on existing land use/landcover, its spatial distribution and changes are essential pre-requisite for various planning purposes. Thus land use planning and land management strategies hold a key role for development of any region. The study of land use is necessary for proper utilization of land resources of a region. Application of remote sensing is found to be very useful for land use mapping and monitoring. Remote Sensing and Geographic Information System (GIS) allows us to collect and analyze data at lesser cost and more reliable than the data acquired through conventional method(Kachhwala, 1985). The advantage of using satellite data for temporal change detection is its varying spatial and spectral characteristics by which features can be easily mapped and the rate of change can be obtained (Anderson, 1977). Satellite imagery has been utilized for measuring qualitative and quantitative land-cover changes (Seto et al., 2002: Tamilenthi et al., 2011:Sudhira et al., 2004).To understandthe driving forces of land use inthe past, and modeling the future of natural resources, changes in land use/ land cover information is essential. The information being in GIS is a suitable platform for data analysis, updating andretrieval. The present study is an attempt to use remote sensing data product for the temporal change detection between 1990 and 2001.
2. Methodology and Data Products used
The multi-temporal data of LANDSAT imagery is used. LANDSAT V TM (Thematic Mapper) data acquired on 23rd April 1990 and LANDSAT 7, ETM+ (Enhanced Thematic Mapper plus) data acquired on 15th May 2001 are used for the land use/land cover identification, delineation and mapping (Fig.1). Survey of India (SOI) Toposheets bearing the number 58 F/12, 58 F/16, 58 G/9 and 58G/13 on 1:50000 scale published on 1971-72 are used for the base map preparation.Administrative maps of Madurai district are used as the
Land use/land cover change detection: a case study of Usilampatti Block, Madurai District, Tamil Nadu Pradeep. C, Bharadwaj A.K, Thirumalaivasan.D
International Journal of Geomatics and Geosciences 601 Volume 4 Issue 4, 2014
collateral data. Other statistical data such as data from census data of India 1991, 2001, yearbooks of 2004, other published records, field verificationand soil published soil records, etc., are used for this study.
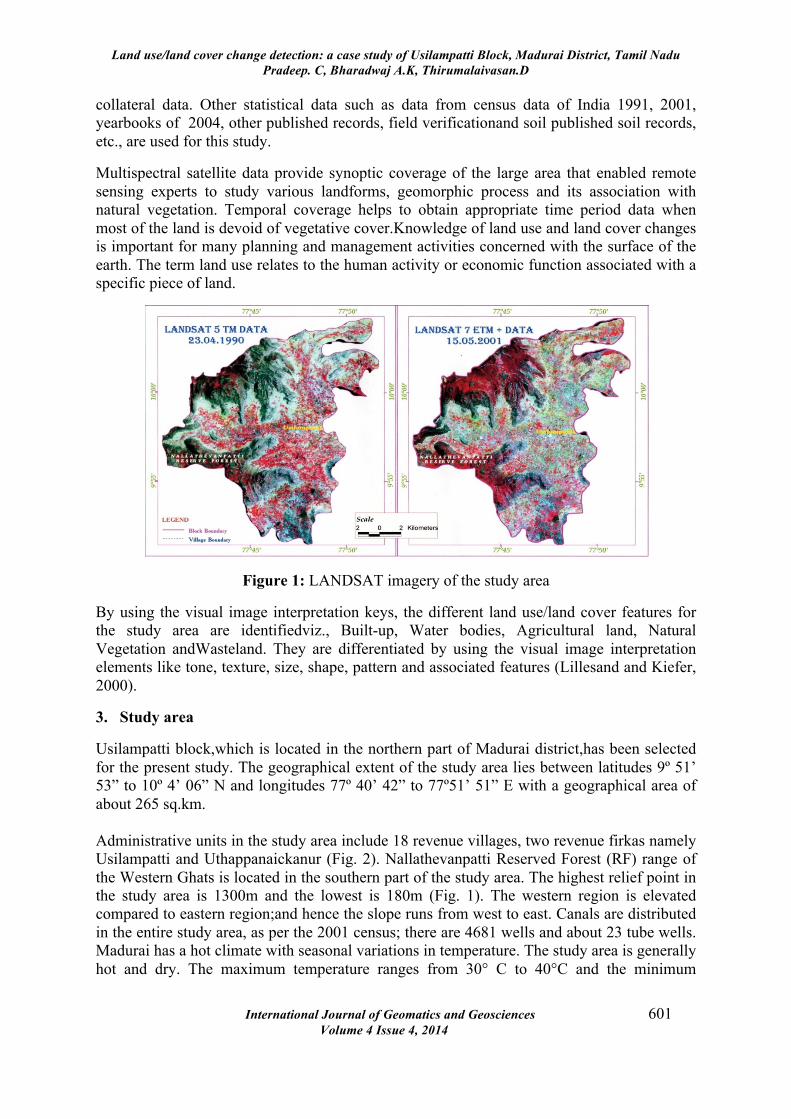
Multispectral satellite data provide synoptic coverage of the large area that enabled remote sensing experts to study various landforms, geomorphic process and its association with natural vegetation. Temporal coverage helps to obtain appropriate time period data when most of the land is devoid of vegetative cover.Knowledge of land use and land cover changes is important for many planning and management activities concerned with the surface of the earth. The term land use relates to the human activity or economic function associated with a specific piece of land.
Figure 1: LANDSAT imagery of the study area
By using the visual image interpretation keys, the different land use/land cover features for the study area are identifiedviz., Built-up, Water bodies, Agricultural land, Natural Vegetation andWasteland. They are differentiated by using the visual image interpretation elements like tone, texture, size, shape, pattern and associated features (Lillesand and Kiefer, 2000).
3. Study area
Usilampatti block,which is located in the northern part of Madurai district,has been selected for the present study. The geographical extent of the study area lies between latitudes 9º 51’ 53” to 10º 4’ 06” N and longitudes 77º 40’ 42” to 77º51’ 51” E with a geographical area of about 265 sq.km. Administrative units in the study area include 18 revenue villages, two revenue firkas namely Usilampatti and Uthappanaickanur (Fig. 2). Nallathevanpatti Reserved Forest (RF) range of the Western Ghats is located in the southern part of the study area. The highest relief point in the study area is 1300m and the lowest is 180m (Fig. 1). The western region is elevated compared to eastern region;and hence the slope runs from west to east. Canals are distributed in the entire study area, as per the 2001 census; there are 4681 wells and about 23 tube wells. Madurai has a hot climate with seasonal variations in temperature. The study area is generally hot and dry. The maximum temperature ranges from 30° C to 40°C and the minimum
Land use/land cover change detection: a case study of Usilampatti Block, Madurai District, Tamil Nadu Pradeep. C, Bharadwaj A.K, Thirumalaivasan.D
International Journal of Geomatics and Geosciences 602 Volume 4 Issue 4, 2014
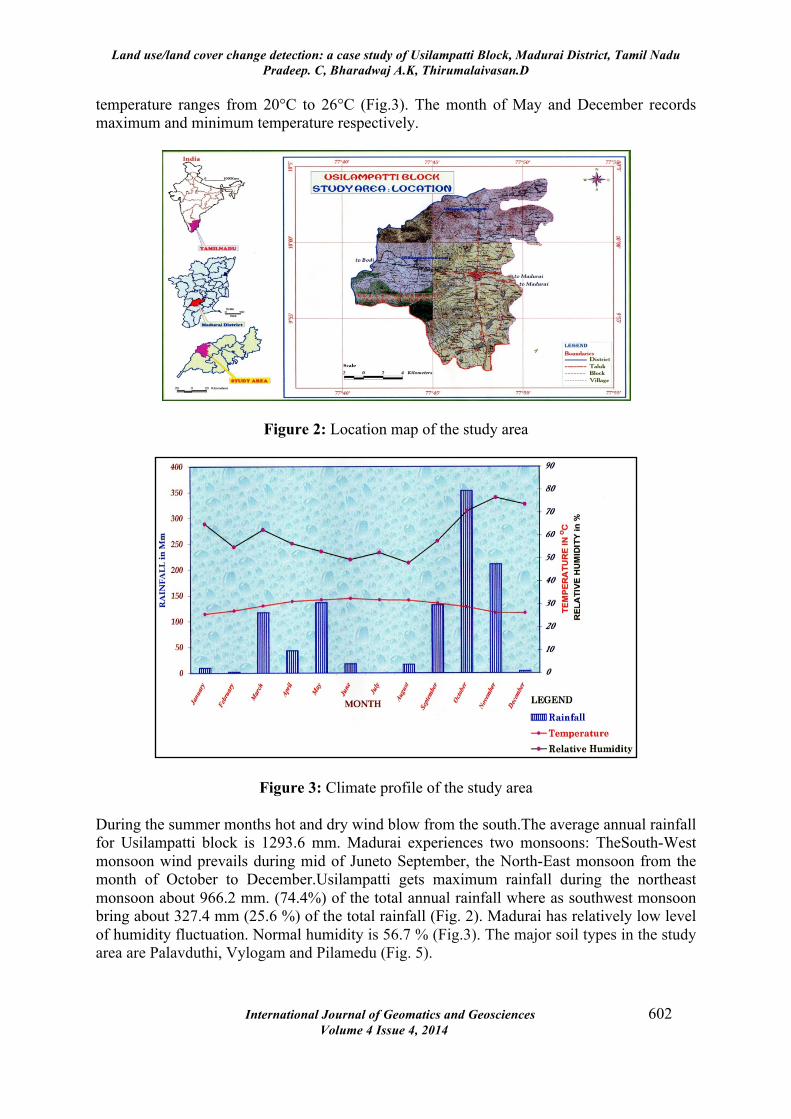
temperature ranges from 20°C to 26°C (Fig.3). The month of May and December records maximum and minimum temperature respectively.
Figure 2: Location map of the study area
Figure 3: Climate profile of the study area
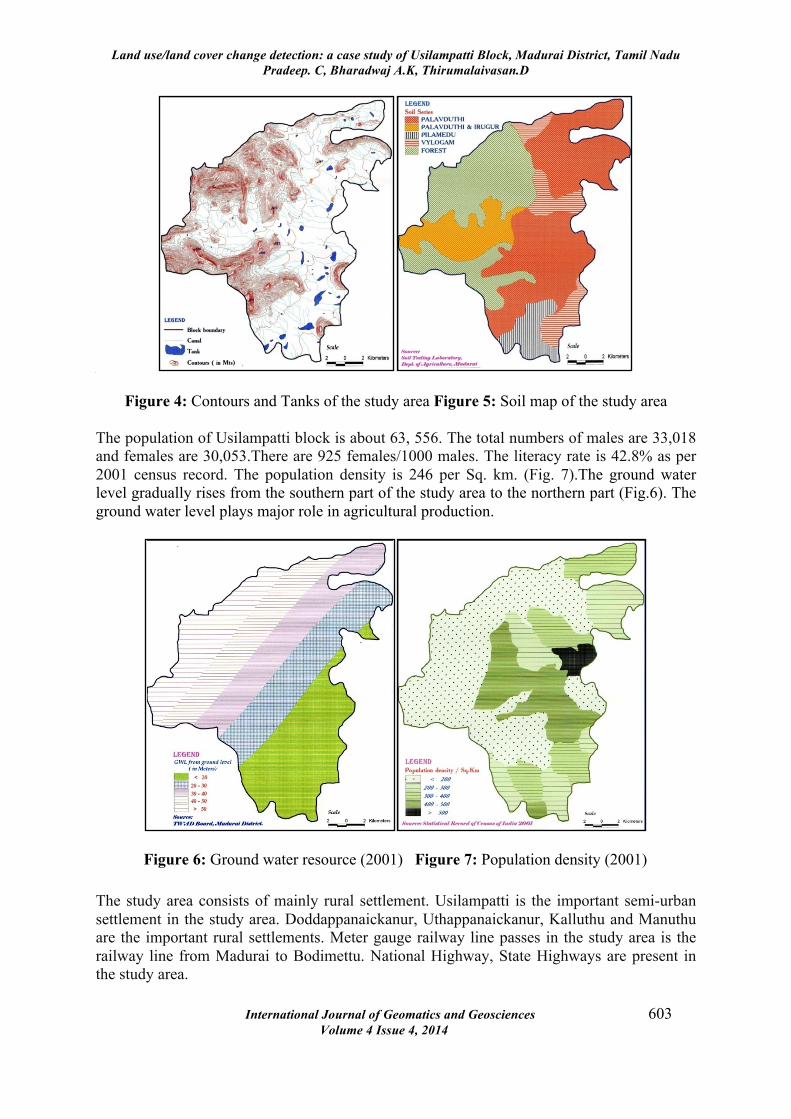
During the summer months hot and dry wind blow from the south.The average annual rainfall for Usilampatti block is 1293.6 mm. Madurai experiences two monsoons: TheSouth-West monsoon wind prevails during mid of Juneto September, the North-East monsoon from the month of October to December.Usilampatti gets maximum rainfall during the northeast monsoon about 966.2 mm. (74.4%) of the total annual rainfall where as southwest monsoon bring about 327.4 mm (25.6 %) of the total rainfall (Fig. 2). Madurai has relatively low level of humidity fluctuation. Normal humidity is 56.7 % (Fig.3). The major soil types in the study area are Palavduthi, Vylogam and Pilamedu (Fig. 5).
Land use/land cover change detection: a case study of Usilampatti Block, Madurai District, Tamil Nadu Pradeep. C, Bharadwaj A.K, Thirumalaivasan.D
International Journal of Geomatics and Geosciences 603 Volume 4 Issue 4, 2014
c
Figure 4: Contours and Tanks of the study area Figure 5: Soil map of the study area The population of Usilampatti block is about 63, 556. The total numbers of males are 33,018 and females are 30,053.There are 925 females/1000 males. The literacy rate is 42.8% as per 2001 census record. The population density is 246 per Sq. km. (Fig. 7).The ground water level gradually rises from the southern part of the study area to the northern part (Fig.6). The ground water level plays major role in agricultural production.
Figure 6: Ground water resource (2001) Figure 7: Population density (2001)
The study area consists of mainly rural settlement. Usilampatti is the important semi-urban settlement in the study area. Doddappanaickanur, Uthappanaickanur, Kalluthu and Manuthu are the important rural settlements. Meter gauge railway line passes in the study area is the railway line from Madurai to Bodimettu. National Highway, State Highways are present in the study area.

Land use/land cover change detection: a case study of Usilampatti Block, Madurai District, Tamil Nadu Pradeep. C, Bharadwaj A.K, Thirumalaivasan.D
International Journal of Geomatics and Geosciences 604 Volume 4 Issue 4, 2014
4. Results
The spatial distribution of land use/land cover of the study area is shown in Fig.8. The detailed distribution of land use and the visual interpretation parameters used to identify them are discussed below.
4.1.Transport accessibility
The transport accessibility study was carried out with the help of buffer with interval of 250 meter from the road network. Built-ups has been developed along the road network this clearly shows that transport is a major factor for development.
Figure 8: Landuse (1990-2001) of the study area
It clearly validates the hypothesis that road are a major factor for the changes in the land cover. From the road accessibility (Fig. 9) the built-ups has developed on the sides of the road network.
Figure 9: Road Accessibility of the study area
Land use/land cover change detection: a case study of Usilampatti Block, Madurai District, Tamil Nadu Pradeep. C, Bharadwaj A.K, Thirumalaivasan.D
International Journal of Geomatics and Geosciences 605 Volume 4 Issue 4, 2014
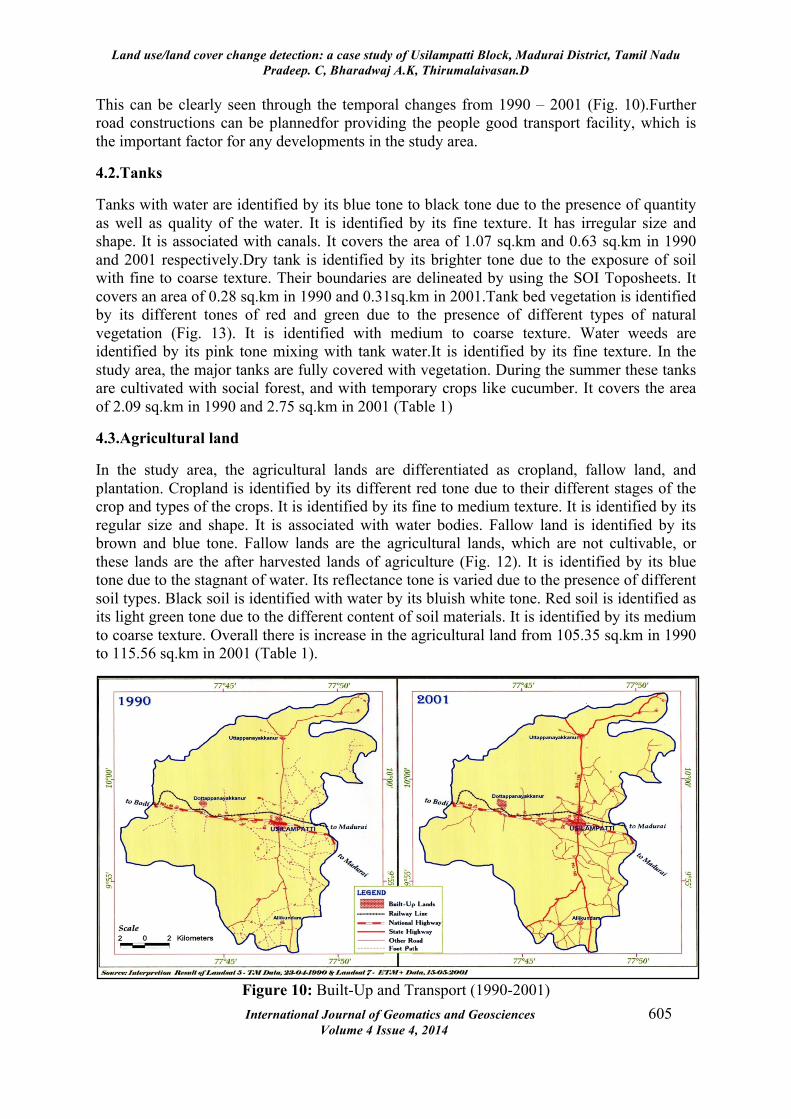
This can be clearly seen through the temporal changes from 1990 – 2001 (Fig. 10).Further road constructions can be plannedfor providing the people good transport facility, which is the important factor for any developments in the study area.
4.2.Tanks
Tanks with water are identified by its blue tone to black tone due to the presence of quantity as well as quality of the water. It is identified by its fine texture. It has irregular size and shape. It is associated with canals. It covers the area of 1.07 sq.km and 0.63 sq.km in 1990 and 2001 respectively.Dry tank is identified by its brighter tone due to the exposure of soil with fine to coarse texture. Their boundaries are delineated by using the SOI Toposheets. It covers an area of 0.28 sq.km in 1990 and 0.31sq.km in 2001.Tank bed vegetation is identified by its different tones of red and green due to the presence of different types of natural vegetation (Fig. 13). It is identified with medium to coarse texture. Water weeds are identified by its pink tone mixing with tank water.It is identified by its fine texture. In the study area, the major tanks are fully covered with vegetation. During the summer these tanks are cultivated with social forest, and with temporary crops like cucumber. It covers the area of 2.09 sq.km in 1990 and 2.75 sq.km in 2001 (Table 1)
4.3.Agricultural land
In the study area, the agricultural lands are differentiated as cropland, fallow land, and plantation. Cropland is identified by its different red tone due to their different stages of the crop and types of the crops. It is identified by its fine to medium texture. It is identified by its regular size and shape. It is associated with water bodies. Fallow land is identified by its brown and blue tone. Fallow lands are the agricultural lands, which are not cultivable, or these lands are the after harvested lands of agriculture (Fig. 12). It is identified by its blue tone due to the stagnant of water. Its reflectance tone is varied due to the presence of different soil types. Black soil is identified with water by its bluish white tone. Red soil is identified as its light green tone due to the different content of soil materials. It is identified by its medium to coarse texture. Overall there is increase in the agricultural land from 105.35 sq.km in 1990 to 115.56 sq.km in 2001 (Table 1).
Figure 10: Built-Up and Transport (1990-2001)

Land use/land cover change detection: a case study of Usilampatti Block, Madurai District, Tamil Nadu Pradeep. C, Bharadwaj A.K, Thirumalaivasan.D
International Journal of Geomatics and Geosciences 606 Volume 4 Issue 4, 2014
4.4.Wasteland
Relief is present in the North-Western portion of the study area; this relief is covered with less vegetation cover. The slopes of the relief are fully covered with the shrub (Fig. 13). People in the nearby village use this forest for their fuel wood collection since it is an open forest. This vegetation cover is dry in the summer season due to lack of rainfall and high temperature. This relief is the origin place for the numerous streams in the study area.
Table 1: Temporal Changes in (1990-2001) Land use/land cover
LANDUSE Area in 1990(sq.km) Area in 2001(sq.km)
1. BUILT-UP 1.98 2.68
2. WATER BODIES 3.44 3.69
2.1 TANK WITH WATER 1.07 0.63
2.2 DRY TANK BED 0.28 0.31
2.3 TANK BED VEGETATION 2.09 2.75
3. AGRICULTURAL LAND 105.35 115.56
3.1 CROP LAND 99.18 88.84
3.2 FALLOW LAND 6.17 26.72
4. NATURAL VEGETATION 86.44 67.29
4.1 RESERVED FOREST 37.53 37.53
4.2 OPEN SHRUB/BUSHES 48.91 29.76
5. WASTE LAND 68.37 76.41
5.1 RELIEF 57.71 57.71
5.2 STRUCTURAL HILL 7.91 7.91
5.3 VACANT LAND 2.75 10.79
The structural hill is scattered in the northern part and the south western part of the study area. The barren rocky exposureis identified by their bluish brown tone. They have irregular size and shape. They are coarse in texture. The rocky outcrop is identified by its brighter tone with medium texture. Vacant land is also classified under wastelands.They are identified by their bright white tone. They have irregular shape and have a coarse texture. Waste lands coveran area of 68.37 sq.km in 1990 and 76.41 sq.km in 2001 (Table 1).
4.5.Natural vegetation
It exhibits coarse texture. In the study area, open scrub is identified as the natural vegetation (Fig. 13) Scrub lands are mostly presented at the bottom of the relief. It covers the area of 48.91 sq.km in 1990 and 29.76 sq.km in 2001 (Table 1). Reserve forest is identified by its

Land use/land cover change detection: a case study of Usilampatti Block, Madurai District, Tamil Nadu Pradeep. C, Bharadwaj A.K, Thirumalaivasan.D
International Journal of Geomatics and Geosciences 607 Volume 4 Issue 4, 2014
dark green with red tone due to the presence of vegetation and different species of trees. These trees are densely covered in the study area (Fig. 13). It covers the area of 37.53 sq.km (Table 1).
Figure 12: Water bodies and Agricultural land use (1990-2001)
Figure 13: Natural vegetation and waste land (1990-2001)
5. Conclusion
Various land features are delineated, compiled and prepared. The areas of each class were estimated and finally general land use maps for both 1990 and 2001 data were prepared. Remote Sensing has changed the way of resource evolution studies with the use of multi-temporal satellite data, it has become increasingly possible to monitor the state of the resource and land use / land cover changes has been successfullymonitored. In the present study various resources were identified,in which the agricultural area is the predominant land use, since most of the built-ups are rural settlements. By proper management of irrigation system agricultural areas can be increased.Check dams can be built in the foothills to
Land use/land cover change detection: a case study of Usilampatti Block, Madurai District, Tamil Nadu Pradeep. C, Bharadwaj A.K, Thirumalaivasan.D
International Journal of Geomatics and Geosciences 608 Volume 4 Issue 4, 2014
preserve water so that the groundwater level will increase in those areas. This will directly help in agricultural production. Government can conduct awareness programs with the help of NGOs to the local villagers in order to develop the wastelands into usable agricultural lands. The agricultural areas need more and immediate attention, since 70% of the county's population depends upon agriculture for its living. The slope area requires attention to take suitable measures for afforestation activities; this will prevent soil erosion and helps the rainwater to percolate in the soil there by increasing the groundwater. LANDSAT imagery, with a resolution of 30 m, is best to identify the agricultural land use but they prove poor in the case of built-ups. The comparative study of LANDSAT5(TM) 1990 and LANDSAT 7 ETM + (2001) give us the picture of how the study area has undergone changes in a period of ten years. These data can be recorded and can be compared with future data to find out the impact of humans on the natural environment and other natural changes.
Acknowledgement The authors express thanks to the Faculty members of the Department of Environmental Remote Sensing and Cartography, Madurai Kamaraj University, Madurai, India, in carrying out the present study. 6. References
1. Anderson, J. R. (1977), Land use and land cover changes. A framework for monitoring. Journal of Research by the Geological Survey, 5, pp 143-153.
2. Kachhwala, TS. (1985), Temporal monitoring of forest land for change detection and
forest cover mapping through satellite remote sensing. In: Proceedings of the 6th Asian Conf. On Remote Sensing. Hyderabad, pp 77–83.
3. Lillesand, T. M. and Kiefer, R.W (2000), Remote Sensing and Image Interpretation.
New York: John Wiley & Sons. 4. Prakasam, C. (2010), Land use and land cover change detection through remote
sensing approach: A case study of Kodaikanal taluk, Tamil Nadu, International Journal of Geomatics and Geosciences, 1(2).
5. Seto, K.C., Woodcock, C.E., Song, C., Huang, X., Lu, J. and Kaufmann, R.K (2002),
Monitoring land-use change in the Pearl River Delta using Landsat TM, International Journal Remote Sensing, 23(10), pp 1985–2004.
6. Sudhira H.S., Ramachandra. T.V., and Jagadeesh K. S, (2004), Urban sprawl: metrics,
dynamics and modelling using GIS, International Journal of Applied Earth Observation and Geoinformation,5, pp 29-39.
7. Tamilenthi, S., Punithavathi, J., Baskaran, R. and ChandraMohan, K, (2011),
Dynamics of urban sprawl, changing direction and mapping: A case study of Salem city, Tamilnadu, India, Achieves of Applied Science Research, 3(1), pp 277-286.