land use land cover changes in detection of water quality: a...
TRANSCRIPT

Research ArticleLand Use Land Cover Changes in Detection of Water QualityA Study Based on Remote Sensing and Multivariate Statistics
Ang Kean Hua
Department of Environmental Sciences Faculty of Environmental Studies Universiti Putra Malaysia (UPM)43400 Serdang Selangor Malaysia
Correspondence should be addressed to Ang Kean Hua angkeanhuayahoocom
Received 6 December 2016 Revised 15 February 2017 Accepted 19 February 2017 Published 9 March 2017
Academic Editor Evelyn O Talbott
Copyright copy 2017 Ang Kean Hua This is an open access article distributed under the Creative Commons Attribution Licensewhich permits unrestricted use distribution and reproduction in any medium provided the original work is properly cited
Malacca River water quality is affected due to rapid urbanization development The present study applied LULC changes towardswater quality detection inMalacca RiverThemethod uses LULC PCA CCA HCA NHCA and ANOVA PCA confirmedDS ECsalinity turbidity TSS DO BOD COD As Hg Zn Fe E coli and total coliform CCA confirmed 14 variables into two variatesfirst variate involves residential and industrial activities and second variate involves agriculture sewage treatment plant and animalhusbandry HCA and NHCA emphasize that cluster 1 occurs in urban area with Hg Fe total coliform and DO pollution cluster 3occurs in suburban area with salinity EC and DS and cluster 2 occurs in rural area with salinity and EC ANOVA between LULCand water quality data indicates that built-up area significantly polluted the water quality through E coli total coliform EC BODCOD TSS Hg Zn and Fe while agriculture activities cause EC TSS salinity E coli total coliform arsenic and iron pollution andopen space causes contamination of turbidity salinity EC and TSS Research finding provided useful information in identifyingpollution sources and understanding LULC with river water quality as references to policy maker for proper management of LandUse area
1 Introduction
Land Use Land Cover (LULC) refers to two separate ter-minologies that are often used interchangeably [1 2] LandCover can be defined as the physical characteristics of theearthrsquos surface which involve vegetation water soil andother physical features created through human activities likesettlements while LandUse refers to land used by humans forhabitats concerning economic activities [1] LULC patternsdepend on human usage in terms of natural and socioe-conomic development through space and time In otherwords Land Use changes have the ability to affect the LandCover and vice versa Shifting into possibility negative impactthrough the LandUse perspective for social activities is affect-ing Land Cover to change especially in biodiversity waterand earth radiation trace gas emission and other processesthat come together to affect the climate and biosphere [2 3]These changes are attributed to only one main factor in termsof size and pattern namely ldquopopulation growthrdquo Increasingpopulation growth directly and indirectly contributes to
LULC changes especially from the perspective of demandfor built-up area agricultural activities and water resourcesEcological expertise is very concerned with LULC changesthat impact biodiversity and aquatic ecosystems [4] LULCchanges in a watershed will affect water quality leading toincreased surface runoff reduced groundwater dischargeand transfer of pollutants [2 4]Therefore LULC informationat the watershed level is important for selection planningmonitoring and management of water resource so that thechanges in Land Use meet the increasing demand for humanneeds and welfare without compromising water quality
Various research studies have been conducted aboutthe change analysis of watersheds which are importantin developing effective management strategies to protectwater resources [1 5ndash7]Watershedmanagement is necessarybecause a watershed is not only a hydrological unit [8] butalso plays an important part in socioecological perspectiveby providing economical food and social security as wellas provision of life support services to local residents [9]LULC changes in the watershed area for urbanization and
HindawiJournal of Environmental and Public HealthVolume 2017 Article ID 7515130 12 pageshttpsdoiorg10115520177515130
2 Journal of Environmental and Public Health
deforestation will continuously have negative impacts onwater quality and indirectly affect the nature of a watershedecosystem Hence understanding of the spatial and temporalvariations that occur in a watershed over time as well asexplanation of the interaction between hydrological compo-nents of the watershed will allow better water conservationstrategies to be formulated [5] Specifically remote sensinghas been widely used to classify and map LULC changeswith different techniques and data sets such as Landsatimages that provide better classification of different landscapecomponents at a large scale [10] Several change detectiontechniques have been developed in remotely sensed imagewith continuous debate on the advantages and disadvantagesof each technique These include unsupervised classificationor clustering supervised classification PCA hybrid classi-fication and fuzzy classification which are all commonlyapplied and used in classification [1 2 11 12] Although vari-ous classification techniques have been proposed supervisedclassification methods are considered as favorable for changedetection analysis More recently researchers have appliedsupervised classification for several LULC change detectionfor several research aims and purpose [1ndash3 13]
TheMalacca River watershed area has been selected for achange detection study because of its uncontrolled urbaniza-tion unmanageable sewage discharge and active soil erosionand tree cutting Apart from these actions pesticide residuesand animal husbandry residues are suspected to becomemajor concerns in the watershed area due to increasingagricultural and poultry farm activities [14] Rapid urbandevelopment in the study area has led to several problemslike fragmentation of aquatic animals soil erosion and riverpollution due to deforestation and discharge of municipalgarbage and industrial waste [15] This study is carried outusing the remote sensing application to differentiate theextent of changes which occurred in the Malacca Riverwatershed for 15 years The objectives of this study are toexamine the potential sources of pollutants in the MalaccaRiver between 2001 2009 and 2015 identify the differentLULC classes and the pattern of changes in watershed from2001 to 2009 and 2009 to 2015 and determine the connectionof LULC changes in contributing to pollutant sources in theMalacca River
2 Materials and Methods
21 Study Area Malacca state is located in the South Westof Peninsular Malaysia The geographical coordinates are2∘231015840160810158401015840N to 2∘241015840522710158401015840N for latitude and 102∘101015840364510158401015840Eto 102∘291015840176810158401015840E for longitude Malacca state can be dividedinto three districts namely Alor Gajah Jasin and MalaccaCentral The catchment areas in Malacca state are approxi-mately 670 km2 and contain an 80 km length of the MalaccaRiver that flows through Alor Gajah and Malacca CentralGenerally the river is formed by 13 subbasins of watershednamely Kampung Ampang Batu Gadek subbasin KampungBalai subbasin Kampung Batu Berendam subbasin Kam-pung Buloh China subbasin Kampung Cheng subbasinKampung Gadek subbasin Kampung Harmoni BelimbingDalam subbasin Kampung Kelemak subbasin Kampung
1 cm = 1 km
0 00125
0025
005
Decimal degrees
sampling_areaMalacca RiverTributary Malacca RiverMalacca Watershed
Sub_Basinltall other valuesgt
SB_AreaKampung Batu Berendam subbasinKampung Cheng subbasinKampung Harmoni Belimbing Dalam subbasinKampung Kelemak subbasinKampung Panchor subbasinKampung Sungai Petai subbasinKampung Tualang subbasin
N
W E
S
Figure 1 Sampling stations and subbasin of the study area
Panchor subbasin Kampung Pulau subbasin Kampung Sun-gai Petai subbasin Kampung Tamah Merah subbasin andKampung Tualang subbasin Only 7 subbasins of 13 wereselected with 9 sampling stations along the river (Figure 1)
Malacca state has a reservoir located between Alor Gajahand Malacca Central This is the Durian Tunggal Reservoirwith a catchment of 20 km2 It acts as a source of waterfor Malacca residents Increasing local population has ledto increasing public facilities such as transport healthcareaccommodation sewage and water supply services [14ndash16]Due to the drastic population growth rapid urban develop-ment in the Strait of Malacca has also increased especiallyfrom a Land Use perspective A majority of residents arecentralized in the city which extends about 10 km to the west10 km to the east and 20 km to the northThe changes in Land
Journal of Environmental and Public Health 3
Use have continuously developed until today which is in linewith the vision and mission of sustainable tourism sectorEventually these actions indirectly contribute to economicgrowth and political changes strengthened cultural andsocial relationships and also impact environmental qualityespecially the water in Malacca River
3 Data Collection
Nine sampling stations were chosen along the Malacca RiverRiver water quality data included samples in year 2015analyzed based on APHA [17] while river water qualitydata for 2001 and 2009 were collected from the Departmentof Environment (DOE) Malaysia The primary data wascollected in 2015 to obtain recent water quality data statusas well as field data verification There are only two methodsof measurements involved in situ analysis and laboratoryanalysis River water quality was analyzed according tophysicochemical parameters that is pH temperature elec-trical conductivity (EC) salinity turbidity total suspendedsolid (TSS) dissolved solids (DS) dissolved oxygen (DO)biological oxygen demand (BOD) chemical oxygen demand(COD) and ammoniacal nitrogen (NH3N) trace elements(ie mercury cadmium chromium arsenic zinc lead andiron) and biological parameters (ie Escherichia coliformand total coliform) as shown in Table 5 Additionally theremote sensing imagery of selected research areas for 20012009 and 2015 was obtained from ARSM and downloadedfrom the USGS Earth Explorer of the selected research areain Malacca state Landsat 5 TM data were obtained for 2001and 2009 while Landsat 8 data was obtained for 2015
4 Data Analysis
41 River Water Data
411 Water Quality Analysis Water samples were analyzedbased on in situ measurement and laboratory analysis Insitu measurement involves pH testing using a SevenGoDuo pro probe (Mettler Toledo AG) turbidity test usinga portable turbidity meter (Handled Turbidimeter Hach2100) and multiparameter probe (Orion Star Series PortableMeter) tests on temperature EC DS salinity and DOMeanwhile laboratory analysis involves measurement onNH3N using a spectrophotometer based Hach Method 8038COD parameter using APHA 5220B open reflux techniqueBOD parameter measure using APHA 5210B (Hach Method8043) TSS measure using APHA 2540D method E coliand coliform test using membrane filtration method basedAPHA 9221B and trace metal test using an inductive coupledplasma-mass spectrometry (ICP-MS ELAN DRC-e PerkinElmer) Each sample underwent the tests in triplicate beforecalculating the mean value and standard deviation (SD) wasused as an indication of the precision of each parametermeasured with less than 20
412 Statistical Analysis The analysis results are then inputinto Statistical Package for Social Science (SPSS) version 23for statistical analysis using principal component analysis
(PCA) canonical correlation analysis (CCA) hierarchicalcluster analysis (HCA) and nonhierarchical cluster analysis(NHCA) and analysis of variance (ANOVA) GenerallyPCA can be expressed through (1) original data reduced todominant components of factors (source of variation) thatinfluence the observed data variance and (2) the whole dataset extracted to produce eigenvalue and eigenvectors [18]Only eigenvalues greater than 1 are considered significant[19] to perform new group variable Varimax Factor (VFs)A VFs coefficient with 06 is considered ldquomoderaterdquo and willbe taken into account as factor loadings PCA is applied inthis study to define possibility of pollutant sources in theMalacca River Continuously the components of PCA will beextracted into CCA for further analysis CCA have an abilityto investigate relationship between the two groups In otherwords (1) CCA will seek for vectors of a and b in randomvariables of 120572119883 and 120573119884 to maximize the correlation of 120588 =corr(120572119883 120573119884) (2) random variable of 119880 = 120572119883 and 119881 = 120573119884will be constructed to perform new sets of canonical variatesthat are linear combinations from the original variables withsimple correlation between 119880 and V (3) then other vectors119880 and 119881 having maximal correlation subject but beinguncorrelated with the first canonical variate will be producedas the second canonical variates [20] CCA is applied in thisstudy to determine accurately and precisely pollutant sourcesin the river HCA is able to sort different objects into the samegroup based on similarity between objects which involve(1) Wardrsquos methods using variance analysis to minimizebetween any two clusters [18 21] (2) measuring the similaritythrough Euclidean distance between two samples [18 21] and(3) a dendogram to provide the results for high similaritywith small distances between clusters in a group [12] Thisstudy employedHCA to determine possible area contributingto pollution in the study area Unlike HCA NHCA withthe involvement of 119870-means method is used to obtain thecorrect classification of pollutant sources based on the PCAcomponents provided Lastly ANOVAwill be used to analyzebetween Land Use classes of LULC changes analysis withwater quality from factor loadings of PCA analysisThemainpurposes of using ANOVA are to determine and to provethe existing of LULC classes that react as pollutant sourcesto impact the water quality and cause contamination in theMalacca River
42 Remote Sensing Data
421 Image Preprocessing LULC Classification and ChangeDetection Analysis Satellite images required preprocessingto ensure that the primary object could be established into amore direct affiliation between acquired data and biophysicalphenomena [1] The preprocessing was accomplished usingArcGIS version 100 for georeferencing mosaicking andsubsetting of the image for the Area of Interest (AOI)Landsat 8 images underwent spatial sharpening using thepanchromatic bands which resulted in images with a 15mresolution Meanwhile Landsat 5 TM images for 2001 and2009 were in an original 30m resolution Further imageprocessing analysis was carried out using ENVI 50 Theimage was displayed in natural color composite using a band
4 Journal of Environmental and Public Health
Table 1 Classes delineated on the basis of supervised classification
Class name DescriptionVegetation Including all agricultural and forest landsBuilt-up area Including all residential commercial industrial and transportationWater Including all water bodies (river lakes gravels stream canals and reservoirs)Open space Including all land areas that exposed soil and barren area influenced by human
Table 2 Magnitude and percentage of LULC change from 2001ndash2009ndash2015
ClassTotal area and percentage Magnitude of change
2001 2009 2015 2001ndash2009 2009ndash2015Km2 Km2 Km2 Km2 Km2
Built-up area 196 293 245 366 337 503 +49 +73 +92 +137Vegetation 271 404 202 301 221 33 minus69 minus103 +19 +29Water 138 206 97 145 30 45 minus41 minus61 minus67 minus10Open space 65 97 126 188 82 122 +61 +91 minus44 minus66Total 670 100 670 100 670 100 0 0 0 0
combination of 3 2 and 1 for Landsat 5 TM and 4 3 and 2for Landsat 8 Maximum likelihood supervised classificationwas performed using several selected regions with Regionsof Interest (ROIs) based on delineated classes of agriculturebuilt-up areas water and open space area (Table 1)
In performing LULC change detection a postclassifi-cation detection method is applied in ENVI 50 whichinvolves two independently classified images used to makecomparisons to produce change information on a pixel basisThe interpretation between images provides changes in ldquo-from -tordquo information Classified images of two different datasets were compared using cross-tabulation in determiningqualitative and quantitative aspects of changes for the periodsfrom 2001 to 2009 and 2009 to 2015Themagnitude of changeand percentage of changes can be expressed in a simpleformula as follows
119870 = 119865 minus 119868
119860 =(119865 minus 119868)
119868times 100
(1)
where119870 is magnitude of changes119860 is percentage of changes119865 is first data and 119868 is reference data [11]
422 Accuracy Assessment Accuracy classification assess-ments for 2001 2009 and 2015 images were carried outto determine the quality of information provided from thedata If classification data is to be used for change detectionanalysis it is important to conduct accuracy assessments forindividual classifications [1] Kappa test is used to performmeasurement of the classification accuracy as the test is ableto account for all elements in confusion matrix includingdiagonal elements [22] A kappa test is a measure calculatedusing predefined producer and user assigned ratings whichcan be expressed as follows
119870 =119875 (119860) minus 119875 (119864)
1 minus 119875 (119864) (2)
where119875(119860) is the number of times the 119896 raters agree and119875(119864)is the number of times the 119896 raters are expected to agree onlyby chance [1 23] Meanwhile user accuracy can be definedas the probability that a pixel in an image actually representsa class on the ground while producerrsquos accuracy indicatesthe probability a pixel being correctly classified and is mainlyused to determine how well an area can be classified [23]As described previously the four categories of classes thathave been delineated should have a minimum of 50 pointsfor each considered category to increase the percentage ofaccuracy assessment [1] Therefore this study indicates theoverall classification accuracies for 2001 2009 and 2015 are8951 8849 and 9221 with kappa statistics of 087 085and 090 respectively According toWeng [24] theminimumlevel for accuracy assessment in identification of Land Useand LULC classes in remote sensing data should be at least85
5 Results and Discussions
51 Magnitude and Percentage of LULC Changes between2001ndash2009 and 2009ndash2015 The magnitude and percentageof LULC changes from 2001 to 2009 and 2009 to 2015 aresummarized in Table 2 The results indicate Land Use typein 2001 for built-up area is 196 km2 (293) agriculture is271 km2 (404) water is 138 km2 (206) and open spaceis 65 km2 (97) In 2009 only built-up area and open spacehad increased by about 49 km2 (73) and 61 km2 (91) tobecome the total of 245 km2 (366) and 126 km2 (188)respectively However agriculture and water are reduced byabout 103 and 61 which resulted in the total area of202 km2 and 97 km2 Lastly built-up areas have continuouslyincreased by about 137 to provide a total area of 337 km2and agricultural land also increases for 29 to performtotal area of 221 km2 Nevertheless open space areas havedecreased about 44 km2 to end up total area of 82 km2(122) and water coverage continues to decrease by 10 or67 km2 to result in the total area of 30 km2 (145) Generally
Journal of Environmental and Public Health 5
Table 3 Cross-tabulation of LULC classes between 2001 and 2009 in (km2)
Class Built-up area Agriculture Water Open space TotalBuilt-up area 196 27 22 0 245Vegetation 0 136 66 0 202Water 0 46 35 16 97Open space 0 62 15 49 126Total 196 271 138 65 670
Table 4 Cross-tabulation of LULC classes between 2009 and 2015 in (km2)
Class Built-up area Agriculture Water Open space TotalBuilt-up area 245 62 12 18 337Vegetation 0 140 40 41 221Water 0 0 11 19 30Open space 0 0 34 48 82Total 245 202 97 126 670
cross-tabulation is used in this study to determine quantitiesof conversions from a particular Land Cover to another LandCover category from a particular later date The magnitudesof LULC class changes from agricultural land and water intoopen space and built-up area from 2001 to 2009 are tabulatedin Table 3 In other words themajority of the water body areais reduced and converted into open space and agriculturalland including certain areas that already transformed intobuilt-up (Figures 3(a) and 3(b)) Meanwhile Table 4 showsthe LULC class changes from water and open space areainto built-up area and agricultural land as built-up areas arecontinuously increasing from open space and water coverageis transformed into agricultural land from 2009 to 2015(Figures 3(b) and 3(c))
52 Water Quality Assessment Based on Determination ofPollutant Sources PCA was applied to compare compositionpatterns between water quality parameters and to determinethe factors influenced by the identified regions in Malaccastate According to Table 6 there are 7 PCs identified througheigenvalues larger than 1 with 69 of total variance Principalcomponent (PC) 1 loadings with 153 of total variance havepositive loadings for dissolved solids electrical conductivityand salinity which are connected to agricultural activitiesand contribute to nonpoint source pollution through surfacerunoff [18] Salinity pollution exists due to pesticide usage inoil palm and rubber plantations as well as animal husbandry(chickens cows and goats) carried out by some local resi-dents along the Malacca River Apart from that erosion ofriverbank due to dredging activity in the river is contributedto electrical conductivity pollution in the river PC 2 explainspositive loadings of turbidity and total suspended solidwith total variance of 103 This condition could happenwhen there are interruptions of human activities in terms ofhydrologicmodifications like dredging water diversions andchannelization causing disruption in the Malacca River [16]On the other hand increasing population growth leadingto land clearing increase for urban development [18 19]and surface runoff cause road edge erosion [19] to happen
within residential areas adjacent to the river Next PC 3 showpositive loading on BOD and COD with the total of varianceof 101 which can be related to anthropogenic sourceshaving high possibility of coming from sewage treatmentplant that contributed as point sources pollution [19]
PC 4 loadings with 10 of total variance have positiveloadings on zinc and iron Zinc pollution exists due to largenumbers of houses and building development in urban andrural area that uses metallic roofs coated with zinc where itcan be mobilized into the atmosphere and waterways whencontacting with acid rain or smog [19] while iron pollutionhappens because of agricultural activities in most parts of therural area [18] and originating from industrial effluents inurban area [19] PC 5 indicated positive loading of arsenicwith total variance of 85 showing that the pollutions arestrong possibility of involving with the agricultural land [25]PC 6 loadings with 80 of total variance have positiveloadings on E coli and total coliform while negative loadingsare dissolved oxygen The presence of E coli and totalcoliform pollution in the river is strongly connected withraw and municipal sewage from domestic and poultry farmmainly in rural and urban area In addition to this surfacerunoff and discharge from wastewater treatment plants fromurban areas as well as dissolved oxygen pollution may beimpacted by high levels of dissolved organic matter thatconsume large amounts of oxygen [19] and are suspected tocome from agriculture activities and forest areas which arethe dominant Land Use type in rural regions Lastly PC 7resulted in positive loading of mercury with total varianceof 68 highly suspected to link with chemical industrialwastewater [25] that the majority occur at middle-streamand downstream of Malacca River Therefore the mostlikely sources of pollutants in terms of physicochemical andbiological parameters are agriculture residential activitiesseptic tank and sewage treatment plant activities animalhusbandry industrial activities and open space activitieswhich have an important role in specifying changes in LULC
Continuously CCA is carried out on the sets of dataobtained from 7 PCs There are 14 variables in the response
6 Journal of Environmental and Public HealthTa
ble5Mean(and
stand
arddeviation)
values
ofwater
quality
dataalon
gtheM
alacca
Riverfor
years2
0012009and
2015
(119899=20)
Category
Unit
MeanSD
S1S2
S3S4
S5S6
S7S8
S9
pHmdash
695
054
671
034
660 031
669
043
673
029
674
037
716
057
679
046
671
041
Temp
∘C
2816
139
2839 162
2810
149
2783
150
2769
133
2772
127
2847
110
2912
170
2843
109
Sal
1558
1062
322
484
138
265
019
033
004
003
004
002
1589
1169
022 019
004
003
EC120583Scm
1967585
1540
451
6690
880415
7519
1115324
1498
412893
1312
68443
9481
3887
2144
005
1739275
57597
45225
4216
75978
7
TSS
mgl
8722
9809
5044
5581
9231
6005
1378
91270
417225
17629
16811
15676
1031
19885
3825
1456
11061
9965
DS
mgl
1159637
987423
49624
5477
036715
48824
13613
16828
5387
2344
5505
2250
634273
914348
7415
5255764
10286
11534
Tur
NTU
11593
1374
77232
7514
29837
35698
17026
19622
22029
22755
18042
15613
5786
6115
12063
14648
17435
1916
7
BOD
mgl
536
342
714
349
483
237
394 182
397 159
411
145
561
186
864 182
469 235
COD
mgl
4086
2379
3953
1964
3172
1246
2456
1260
2683
1146
2194
493
3386
1644
4169
1647
2536
836
DO
mgl
303 161
317
154
394 174
526 132
582 111
604
095
421
125
435
243
596 074
NH3N
mgl
191
195
264 168
154
111
042
033
032
027
038
033
195
186
364 217
048
026
Asmgl
000
000
000
000
000
000
000
000
000
000
000
000
000
000
000
000
000
000
Hg
mgl
000
000
000
000
000
000
000
000
000
000
000
000
000
000
000
000
000
000
Cd
mgl
000
000
000
000
000
000
000
000
000
000
000
000
000
000
000
000
000
000
Crmgl
000
000
000 001
000
000
000
000
000
000
000
000
000
000
000
000
000
000
Pbmgl
001
000
001
000
001
000
001
000
001
000
001
000
001
000
001
000
001
000
Znmgl
004
003
003
002
004
003
004
003
004
003
004
003
004
002
004
002
004
003
Femgl
023
032
045
038
072
060
100
069
081
059
085
076
021
026
072
054
085 051
Totalcolifo
rmCou
nt10
0ml
41321944
48922447
30818056
253164
67
29564167
39402886
37226389
66599832
24677222
33163634
28090278
30471275
11061111
10613977
15348333
8978751
11304722
871212
7
Ecoli
Cou
nt10
0ml
7332222
6083676
4521111
4241673
2642686
3173522
1195208
1676582
818139
788595
3120278
4825361
1431508
161470
8313319
43570619
221675
03313880
Turm
eans
turbidity
DSmeans
dissolvedsolid
Con
means
electric
alcond
uctiv
itySalmeans
salin
ityTem
pmeans
temperatureD
Omeans
dissolvedoxygenB
ODmeans
biologicaloxygen
demandCO
Dmeans
chem
icaloxygen
demand
TSSmeans
totalsuspend
edsolid
spH
means
acidicor
basic
waterN
H3Nmeans
ammon
iacaln
itrogenE
colim
eans
Escherich
iacoliformC
olim
eans
coliformA
smeans
arsenicHg
means
mercuryC
dmeans
cadm
iumC
rmeans
chromiumP
bmeans
leadZ
nmeans
zincFem
eans
iron
SDmeans
stand
arddeviation
S1to
S9means
Station1toStation9
Journal of Environmental and Public Health 7
Table 6 Varimax rotation PCs for water quality data within Malacca River basin
Variables (unit) Principle component1 2 3 4 5 6 7
Turbidity (NTU) minus084 761 020 162 154 minus087 minus040Dissolved solid (mgl) 806 minus048 016 minus087 093 111 minus021Electrical conductivity (uS) 924 011 045 minus034 minus120 050 003Salinity (ppt) 913 minus018 010 minus014 064 031 007Temperature (∘C) 024 minus290 318 minus370 minus525 011 minus229Dissolved oxygen (mgl) minus127 254 minus207 minus184 051 minus636 minus095Biological oxygen demand (mgl) minus070 minus154 806 minus074 089 053 minus014Chemical oxygen demand (mgl) 233 186 781 087 minus005 083 041Total suspended solid (mgl) 056 816 minus061 minus005 minus181 minus184 minus033Acidityalkalinity (pH) 454 minus009 198 minus396 minus546 minus084 minus023Ammoniacal nitrogen (mgl) minus149 minus291 549 minus275 minus124 385 minus301E coli (cfu100ml) 113 minus133 076 000 105 679 minus047Coliform (cfu100ml) minus001 minus188 minus019 178 500 602 497Arsenic (mgl) 130 minus017 217 minus124 763 048 minus155Mercury (mgl) minus001 minus009 068 minus065 minus064 minus013 870Chromium (mgl) minus079 507 minus092 minus113 008 015 minus062Zinc (mgl) 089 080 014 855 059 056 106Iron (mgl) minus319 023 minus056 746 018 minus008 minus173Initial eigenvalue 3297 2797 2357 2061 1856 1821 1535 of variance 15539 10310 10115 10024 8526 8088 6852Cumulative 15539 25849 35964 45987 54514 62602 69455lowastThe bold values are factor loadings above 06 that were taken after Varimax rotation is performed
data set namely biological parameter with E coli and totalcoliform and physicochemical parameter including turbidityDS EC salinity DO BOD COD TSS As Hg Zn and Fe(Table 7) Table 7 represents the results of CCA for biologicaland physicochemical variables Correlation coefficients forcanonical variates 1 and 2 were 0841 and 0660 respectivelyindicating both are statistically significant (119901 lt 0000) Thetest statistic for canonical variates 1 and 2 is found to be11990921 = 620 with 24 degrees of freedom and 1199092
2 = 311with 11 degrees of freedom This result indicates that bothvariates of 1 and 2 are having strong relationship with highcorrelation between the response and predictor sets of dataonly variate 2 is higher than variate 1 The dominant variablein first canonical variate for biological variables (1198801) is Ecoli while the dominant variables in 1198811 (physicochemicalparameters) are DS EC DO BOD COD Hg and ZnNext the second canonical variates indicating the predictorvariables are E coli and total coliform while the responsevariables have the result of turbidity EC salinity TSS Asand Fe Considering the mentioned results a regular patterncan be seen From the first canonical variate it is indicatedthat residential and industrial activities have high percentageto cause pollutant sources while second canonical variateindicates that agriculture sewage treatment plant includingseptic tank and animal husbandry activities proved to causeas pollutant sources and to react as nonpoint source pollutionin the river
Further analysis is carried out in hierarchical cluster anal-ysis (HCA) and nonhierarchical cluster analysis (NHCA) aswell as ANOVA between the LULC classes changes with river
water quality dataThe analysis of HCA usingWardrsquos methodindicates the results of three cluster areas which can bedivided into C1 with S7 S8 and S9 C2 with S1 and S2 and C3with S3 S4 S5 and S6 (Figure 2(a)) The result provided willbe further analyzed using nonhierarchical cluster analysis toobtain the correct classification of pollutant sources based onthePCAcomponents in the location area involvedAccordingto Table 8 NHCA confirmed four samples detected incluster 1 with 275 cases involved to produce Hg Fe totalcoliform and DO cluster 2 has only 5 cases to producetwo samples with salinity and EC and cluster 3 detectedthree samples in 44 cases to produce salinity EC and DSIn other words cluster 1 is significantly subjected to beinvolved with the industrial and residential activities as wellas sewage treatment plant [19] while cluster 3 is suspectedto carry out agriculture sewage treatment plant and animalhusbandry activities and cluster 2 is involved with minorimpact caused by agriculture and animal husbandry activities[18] (Figure 2(b)) Therefore cluster 1 is likely to occur inurban area cluster 3 is suburban area and cluster 2 is ruralarea
Lastly as described in statistical analysis analysis ofvariance (ANOVA) is carried out to obtain accurate resultbetween LULC classes with river water quality of 15 yearsAmong the LULC classes built-up areas are having the high-est significance with 9 variables of water quality vegetation isthe second highest to have 8 variables significant with waterquality and the lowest significance is the open space withonly 4 variables of water quality that resulted in ANOVA(Table 9) Built-up area is subjected to cause pollution in E
8 Journal of Environmental and Public Health
Table 7 Canonical correlation analysis of the data set
Canonical variates 1 2Canonical correlation 0841 0660Chi-square 620 311Degree of freedom 24 11Significant level 0000 0000Biological parameter (unit)E coli (cfu100ml) minus0975 minus0276Total coliform (cfu100ml) minus0118 1006Physicochemical parameter (unit)Turbidity (NTU) 0100 0024Dissolved solid (mgl) minus0212 0097Electrical conductivity (uS) 0464 minus0527Salinity (ppt) minus0404 0264Dissolved oxygen (mgl) 0724 0311Biochemical oxygen demand (mgl) minus0211 0037Chemical oxygen demand (mgl) minus0128 minus0092Total suspended solid (mgl) 0118 minus0377Arsenic (mgl) minus0016 0246Mercury (mgl) 0176 0518Zinc (mgl) minus0173 0623Iron (mgl) 0197 minus0098
Table 8 The physicochemical and biological properties classified by the 119870-mean method
Variable (unit) Frequency Cluster 1 Cluster 2 Cluster 3
Turbidity (NTU) Meanrange
minus063minus071simminus055
156307sim005
minus04minus056simminus024
Dissolved solid (mgl) Meanrange
036066sim006
minus033minus037simminus028
071minus032sim173
Electrical conductivity (uS) Meanrange
026055simminus003
minus039minus042simminus036
092minus039sim223
Salinity (ppt) Meanrange
013021sim004
minus042minus048simminus036
093minus041sim226
Dissolved oxygen (mgl) Meanrange
minus077minus071simminus083
049091sim007
minus022minus011simminus033
Biochemical oxygen demand (mgl) Meanrange
016023sim008
minus006minus013sim001
minus011minus013simminus008
Chemical oxygen demand (mgl) Meanrange
054056sim052
027062simminus008
minus053minus151sim046
Total suspended solid (mgl) Meanrange
minus066minus077simminus055
354709simminus001
minus009minus032sim015
Arsenic (mgl) Meanrange
032037sim027
minus033minus061simminus004
006minus012sim024
Mercury (mgl) Meanrange
8671002sim731
minus013minus015simminus011
minus013minus015simminus011
Zinc (mgl) Meanrange
minus051minus104sim002
minus053minus104simminus002
049085sim012
Iron (mgl) Meanrange
minus09minus106simminus074
minus022minus058sim013
079229simminus072
E coli (cfu100ml) Meanrange
minus037minus058simminus016
minus028minus051simminus005
minus007minus048sim035
Total coliform (cfu100ml) Meanrange
062minus044sim168
minus032minus063simminus001
433881simminus016
Number of samples 4 2 3Sampling stations 7 8 9 1 2 3 4 5 6
Journal of Environmental and Public Health 9
Table 9 ANOVA between LULC classes changes with water quality in 2001 2009 and 2015
Parameter (unit) LULC classes (ha) ANOVA resultsBuilt-up area Vegetation Open space DF F 119901 value
E coli (cfu100ml) 18114 8822 4500 2 1343 00001Total coliform (cfu100ml) 21963 8071 5553 2 1448 00000Turbidity (NTU) 6435 2875 710 2 977 00001Dissolved solid (mgl) 11146 5981 1277 2 265 00773Electrical conductivity (uS) 7871 2257 601 2 754 00001Salinity (ppt) 1773 0891 0221 2 233 00243Dissolved oxygen (mgl) 1572 861 222 2 138 01634Biochemical oxygen demand (mgl) 2134 1918 746 2 1171 00000Chemical oxygen demand (mgl) 6847 3221 1859 2 963 00001Total suspended solid (mgl) 5498 4733 1276 2 666 00001Arsenic (mgl) 00015 00007 00005 2 1927 00000Mercury (mgl) 00017 00013 00007 2 2585 00000Zinc (mgl) 00156 00120 00090 2 426 00178Iron (mgl) 034 018 012 2 1016 00000lowastOne-way ANOVA with 119901 lt 005 is significant
0 5 10 15 20 25
3
5
4
6
C3
C1
C2
Rescaled distance cluster combination
1
2
7
9
8
(a) Dendrogram using Ward linkage
VariablesZ score turbidity (NTU)Z score dissolved Solid (mgl)Z score conductivity (uS)Z score salinity (ppt)Z score dissolved oxygen (mgl)Z score biochemical oxygen demand (mgl)Z score chemical oxygen demand (mgl)Z score total suspended solid (mgl)Z score E coli (facel coliform) (cfu100 ml)Z score total coliform (cfu100 ml)Z score arsenic (mgl)Z score mercury (mgl)Z score zinc (mgl)Z score iron (mgl)
Cluster 2 Cluster 3Cluster 1Cluster
minus2
0
2
4
6
8
Valu
es
(b) Final cluster centers
Figure 2 (a) Hierarchical cluster analysis using Wardrsquos methods through Euclidean distance (b) Nonhierarchical cluster analysis through119870-means method
10 Journal of Environmental and Public Health
Build-up areaAgricultureWaterOpen space
1 cm = 1 km0 125 25 5
(Miles)
N
W E
S
2001
(a)
Build-up areaAgricultureWaterOpen space
1 cm = 1 km0 1 2 4
(Miles)
N
W E
S
2009
(b)
Build-up area
AgricultureWaterOpen space
1 cm = 1 km0 1 2 4
(Miles)
2015N
W E
S
(c)
Figure 3 (a) Classifiedmaps ofMalacca River watershed in 2001 (b) Classifiedmaps ofMalacca River watershed in 2009 (c) Classifiedmapsof Malacca River watershed in 2015
coli total coliform EC BOD COD TSS Hg Zn and FeIn this condition residential activities (BOD COD E colitotal coliform and Zn) industrial activities (Hg Zn andFe) and sewage treatment plant (BOD COD E coli andtotal coliform) as well as animal husbandry (E coli totalcoliform) are suspected to become main pollutant sourcesto contaminate the Malacca River as the majority occurin urban and suburban area Meanwhile vegetation areainvolves agriculture activities and forest land is suspectedto cause pollution in river water quality Agriculture activ-ities with high usage of pesticide would cause salinizationpollution and high percentage of fertilizer would cause Ecoli total coliform arsenic and iron pollution Indirectlyagriculture activities could disrupt the soil structure andcause EC as well as TSS in the riverThese activities happen toresult in nonpoint source pollution Continuously althoughDO is suspected to have contaminated in vegetation areahowever the variable is not considered due to no significancein analysis to provide the result of 119865 (df = 2 119901 gt 016)= 138 Probably minor cause of pollution from DO can beconnected with forest land activities Open space activities ofLULC classes can be described as transition area for built-uparea that converted from agriculture as well as several areasfrom forest land into agriculture activities On the other handhydrologic modification like dredging water diversion andchannelization will cause erosion of riverbank to increase thepollution of turbidity salinity EC and TSS
6 Conclusion
Remote sensing is a tool to aid in detecting the magnitudeof LULC change that has taken place in the Malacca River
watershed for river water quality over the span of 15 yearsIt is divided into two parts 2001 to 2009 for 9 years and2009 to 2015 for 7 years This research study has highlightedthe application of remote sensing to develop LULC changesover time for the river water quality pollution based onpollutant sources 7 PCs had been identified through PCAto result in DS EC salinity turbidity TSS DO BOD CODAs Hg Zn Fe E coli and total coliform detected in theriver water quality which contribute possible detection ofpollutant sources as agriculture activities residential activi-ties industrial activities septic tank and sewage treatmentplant activities as well as animal husbandry activities Simul-taneously selected variables from PCA will be applied intoCCA to seek the relationship between the physicochemicalparameters of response data and biological parameters ofpredictor data with the result showing strong relationshipand high correlationTheCCA indicate first canonical variateas E coli DS EC DO BOD COD Hg and Zn to prove theexisting of residential and industrial activities Meanwhilesecond canonical variate produces E coli total coliformturbidity EC salinity TSS As and Fe which resulted asagriculture sewage treatment plant as well as septic tank andanimal husbandry activities are carried out in the MalaccaRiver watershed
Afterwards HCA is applied to determine possible areabased on the pollution which occurred indicating threeclusters that consist of C1 with S7 S8 and S9 C2 with S1 andS2 and C3 with S3 S4 S5 and S6 Next NHCA is used toobtain the correct classification of pollutant sources basedon HCA cluster and PCA components which defined thatcluster 1 produces Hg Fe total coliform and DO cluster 2
Journal of Environmental and Public Health 11
produces salinity and EC and cluster 3 produces salinity ECand DS Overall HCA and NHCA emphasize that cluster 1occurs in urban area cluster 3 is suburban area and cluster 2is rural area Lastly ANOVAbetween LULC andwater qualitydata showed built-up area having contamination of E colitotal coliform EC BOD COD TSS Hg Zn and Fe whichhighlighted the residential activities industrial activities andsewage treatment plant as well as animal husbandry thatoccur in urban and suburban area Meanwhile vegetationarea of agriculture activities is suspected to cause EC TSSsalinity E coli total coliform arsenic and iron pollutionwhile forest land has minor impact to contaminate the riverby DO pollution Most of vegetation area occurs in suburbanand rural area Lastly open space activities have pollution ofturbidity salinity EC and TSS due to hydrologic modifica-tion such as dredging water diversion and channelizationOverall these research findings offer an effective solution towater quality management when large complex water qualitydata is involved provided useful information in identifyingpollution sources and understanding the river water qualitywith LULC change detection information providing refer-ences to policy maker in proper management of Land Usearea
Conflicts of Interest
The author declares that there are no conflicts of interestregarding the publication of this paper
Acknowledgments
The author would like to thank the Department of Envi-ronment (DOE) Malaysia Department of Irrigation andDrainage (JPS) Malaysia Department of Town and Coun-try Planning (JPBD) Malaysia Malaysian Remote Sens-ing Agency (ARSM) and United States Geological Survey(USGS) for providing the base data for water quality riverGIS-map based maps including Land Use activities andremote sensing imageries
References
[1] J S Rawat and M Kumar ldquoMonitoring land usecover changeusing remote sensing and GIS techniques a case study ofHawalbagh block district Almora Uttarakhand Indiardquo TheEgyptian Journal of Remote Sensing and Space Science vol 18no 1 pp 77ndash84 2015
[2] A Butt R Shabbir S S Ahmad and N Aziz ldquoLand usechange mapping and analysis using remote sensing and GIS acase study of simly watershed Islamabad Pakistanrdquo EgyptianJournal of Remote Sensing and Space Science vol 18 no 2 pp251ndash259 2015
[3] M S Boori and V Vozenilek ldquoLand cover disturbance due totourism in Jeseniky mountain region a remote sensing and GISbased approachrdquo in Earth Resources and Environmental RemoteSensingGIS Applications V 92450T vol 9245 of Proceedings ofSPIE International Society for Optics and Photonics Amster-dam The Netherlands September 2014
[4] C K Wright and M C Wimberly ldquoRecent land use changein the Western Corn Belt threatens grasslands and wetlandsrdquoProceedings of the National Academy of Sciences of the UnitedStates of America vol 110 no 10 pp 4134ndash4139 2013
[5] A Ashraf Changing Hydrology of the Himalayan WatershedInTech Rijeka Croatia 2013
[6] S Gajbhiye and S K Sharma ldquoLand use and land cover changedetection of Indra river watershed through remote sensingusing multi-temporal satellite datardquo International Journal ofGeomatics and Geosciences vol 3 no 1 p 89 2013
[7] H-B Hu H-Y Liu J-F Hao and J An ldquoAnalysis of landuse change characteristics based on remote sensing and GIS inthe Jiuxiang River watershedrdquo International Journal on SmartSensing and Intelligent Systems vol 5 no 4 pp 811ndash823 2012
[8] P Singh A Gupta and M Singh ldquoHydrological inferencesfrom watershed analysis for water resource management usingremote sensing andGIS techniquesrdquoEgyptian Journal of RemoteSensing and Space Science vol 17 no 2 pp 111ndash121 2014
[9] A Fernald V Tidwell J Rivera et al ldquoModeling sustainabilityof water environment livelihood and culture in traditionalirrigation communities and their linked watershedsrdquo Sustain-ability vol 4 no 11 pp 2998ndash3022 2012
[10] M C Hansen and T R Loveland ldquoA review of large areamonitoring of land cover change using Landsat datardquo RemoteSensing of Environment vol 122 pp 66ndash74 2012
[11] A Mahmud and A S Achide ldquoAnalysis of land useland coverchanges tomonitor urban sprawl inKeffi-NigeriardquoEnvironmen-tal Research Journal vol 6 no 2 pp 129ndash134 2012
[12] N M Gazzaz M K Yusoff M F Ramli A Z Aris andH Juahir ldquoCharacterization of spatial patterns in river waterquality using chemometric pattern recognition techniquesrdquoMarine Pollution Bulletin vol 64 no 4 pp 688ndash698 2012
[13] I R Hegazy and M R Kaloop ldquoMonitoring urban growth andland use change detection with GIS and remote sensing tech-niques in Daqahlia governorate Egyptrdquo International Journal ofSustainable Built Environment vol 4 no 1 pp 117ndash124 2015
[14] A K Hua ldquoLaw enforcement and water resources of theMalacca river a case study of public perceptionrdquo InternationalJournal of Scientific Research in Science amp Technology vol 3 no1 pp 111ndash116 2015
[15] A K Hua ldquoAn indication of policy study towards waterresources in Malacca state a case study of Malacca riverMalaysiardquo International Research Journal of Social Sciences vol4 no 6 pp 15ndash20 2015
[16] S N Rosli A Z Aris and N M Majid ldquoSpatial variationassessment of malacca river water quality using multivariatestatistical analysisrdquoMalaysian Applied Biology vol 44 no 1 pp13ndash18 2015
[17] American Public Health Association (APHA) Standard Meth-ods for the Examination of Water and Wastewater AmericanWater Works Association Water Environment FederationWashington DC USA 21st edition 2005
[18] A Z Aris S M Praveena N M Isa et al ldquoApplication ofenvironmetric methods to surface water quality assessment oflangkawi geopark (Malaysia)rdquo Environmental Forensics vol 14no 3 pp 230ndash239 2013
[19] H Juahir S M Zain M K Yusoff et al ldquoSpatial water qualityassessment of Langat River Basin (Malaysia) using environ-metric techniquesrdquo Environmental Monitoring and Assessmentvol 173 no 1-4 pp 625ndash641 2011
12 Journal of Environmental and Public Health
[20] R Noori M S Sabahi A R Karbassi A Baghvand andH T Zadeh ldquoMultivariate statistical analysis of surface waterquality based on correlations and variations in the data setrdquoDesalination vol 260 no 1-3 pp 129ndash136 2010
[21] I A Najar and A B Khan ldquoAssessment of water quality andidentification of pollution sources of three lakes in KashmirIndia using multivariate analysisrdquo Environmental Earth Sci-ences vol 66 no 8 pp 2367ndash2378 2012
[22] M D Behera S N Borate S N Panda P R Beheraand P S Roy ldquoModelling and analyzing the watersheddynamics using cellular automata (CA)-Markov model-a geo-information based approachrdquo Journal of Earth System Sciencevol 121 no 4 pp 1011ndash1024 2012
[23] R G Pontius Jr and M Millones ldquoDeath to Kappa birth ofquantity disagreement and allocation disagreement for accu-racy assessmentrdquo International Journal of Remote Sensing vol32 no 15 pp 4407ndash4429 2011
[24] Q Weng ldquoThermal infrared remote sensing for urban climateand environmental studies methods applications and trendsrdquoISPRS Journal of Photogrammetry and Remote Sensing vol 64no 4 pp 335ndash344 2009
[25] W Y Lim A Z Aris and S M Praveena ldquoApplication of thechemometric approach to evaluate the spatial variation of waterchemistry and the identification of the sources of pollution inLangat River Malaysiardquo Arabian Journal of Geosciences vol 6no 12 pp 4891ndash4901 2013
Submit your manuscripts athttpswwwhindawicom
Stem CellsInternational
Hindawi Publishing Corporationhttpwwwhindawicom Volume 2014
Hindawi Publishing Corporationhttpwwwhindawicom Volume 2014
MEDIATORSINFLAMMATION
of
Hindawi Publishing Corporationhttpwwwhindawicom Volume 2014
Behavioural Neurology
EndocrinologyInternational Journal of
Hindawi Publishing Corporationhttpwwwhindawicom Volume 2014
Hindawi Publishing Corporationhttpwwwhindawicom Volume 2014
Disease Markers
Hindawi Publishing Corporationhttpwwwhindawicom Volume 2014
BioMed Research International
OncologyJournal of
Hindawi Publishing Corporationhttpwwwhindawicom Volume 2014
Hindawi Publishing Corporationhttpwwwhindawicom Volume 2014
Oxidative Medicine and Cellular Longevity
Hindawi Publishing Corporationhttpwwwhindawicom Volume 2014
PPAR Research
The Scientific World JournalHindawi Publishing Corporation httpwwwhindawicom Volume 2014
Immunology ResearchHindawi Publishing Corporationhttpwwwhindawicom Volume 2014
Journal of
ObesityJournal of
Hindawi Publishing Corporationhttpwwwhindawicom Volume 2014
Hindawi Publishing Corporationhttpwwwhindawicom Volume 2014
Computational and Mathematical Methods in Medicine
OphthalmologyJournal of
Hindawi Publishing Corporationhttpwwwhindawicom Volume 2014
Diabetes ResearchJournal of
Hindawi Publishing Corporationhttpwwwhindawicom Volume 2014
Hindawi Publishing Corporationhttpwwwhindawicom Volume 2014
Research and TreatmentAIDS
Hindawi Publishing Corporationhttpwwwhindawicom Volume 2014
Gastroenterology Research and Practice
Hindawi Publishing Corporationhttpwwwhindawicom Volume 2014
Parkinsonrsquos Disease
Evidence-Based Complementary and Alternative Medicine
Volume 2014Hindawi Publishing Corporationhttpwwwhindawicom
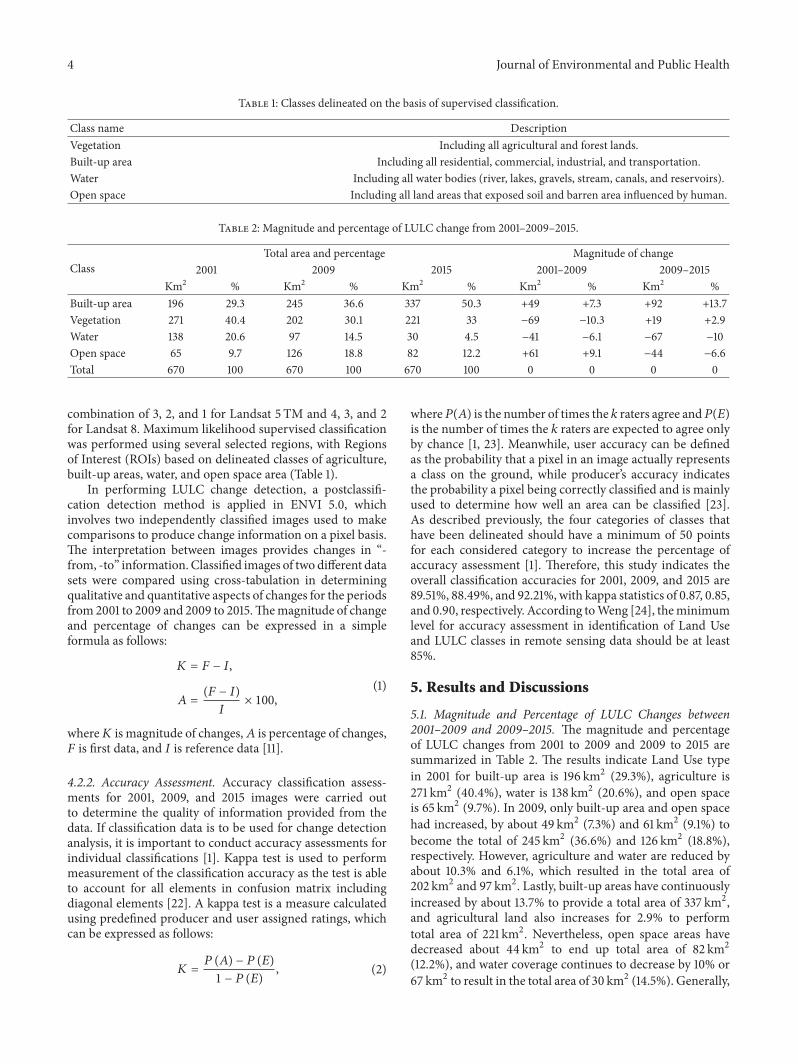
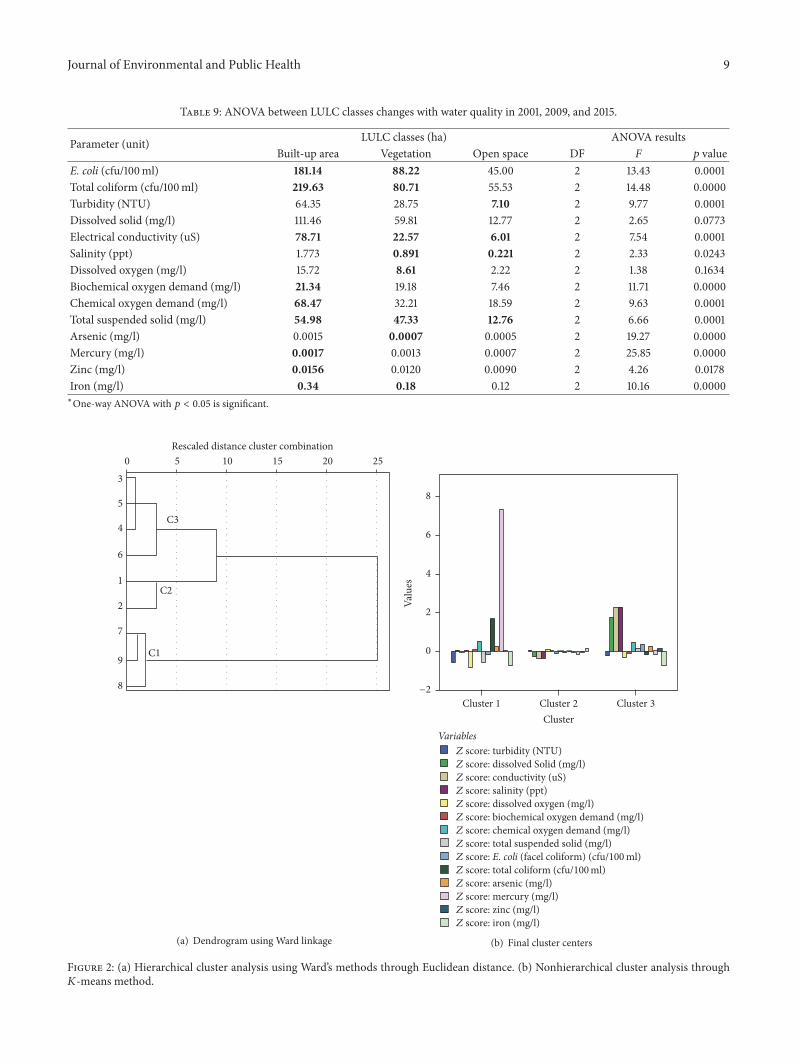