land use scanner introduction - tu berlin · land use scanner introduction glowa elbe ii kick-off...
TRANSCRIPT

Land use Scanner introduction
Glowa Elbe II kick-off Eric Koomen & Jasper Dekkers
Vrije universiteit Amsterdam
November 26th, 2004

Contents
• Characteristics and structure• Application examples• Model components

Land Use Scanner: characteristics
• GIS based (Grid)• integrated (all types of land use)• complete (full LU-description per cell)• exhaustive (200.000 cells of 500 x 500m)• equilibrium principle (balances demand & supply)• satellite structure (external claims)• probability approach (logit model)• cross-sectional (static approach)• policy oriented (applied science)

Land Use Scanner: structure

Simulation examples
Applications normally include preparation and evaluation of policy reports. Various types:• trend analysis• scenario analysis• impact assessment

Trend analysis
What changes will occur when current trends continue, e.g. simulated urbanisation around Lisbon area (Wagtendonk et al 2001):

Scenario analysis
Which developments follow a coherent set of socio-economic conditions, e.g. urban expansion related to restricted areas (MNP 2004)

Impact assessment
What impact can be expected from a specific development, e.g. a possible new national airport(Velde et al.1997)

Land Use Scanner: model basics 1

The model - regional claims
Developments in society, demography, economy, technology influence the spatial claims for:• housing• working• infrastructure• agriculture• nature and recreation

The model - regional claims
Possible “futures” are described in scenariosDIVIDED EUROPE EUROPEAN COORDINATION GLOBAL COMPETITION
GROEI BNP ~1.7 % ~3.0 % ~ 3.3 %
BEVOLKING 16.3 17.7 16.9
HUISHOUDENS 7.5 7.8 8.1
LEVENSTIJL HUIDIG SOLIDAIR/IMMATERIEEL INDIVIDUEEL/CONSUMPTIEF
WERELD STAGNATIE WERELD HANDLESBLOKKEN OPEN WERELDMARKT
EUROPA TRAAG EN WEINING EU IN DE DIEPTE EN MEER SNELHEID IN DE BREEDTE
TECHNOLOGIE MATIGE ONTWIKKELING GROEI MILIEUTECHNOLOGIE STERKE GROEI INFORMATIETECHNOLOGIE

The model - regional claims
Assumptions are made for socio-economic developments for every scenarioe.g. household types in 2020
0
1000000
2000000
3000000
4000000
5000000
6000000
7000000
8000000
9000000
1998 2020 EC 2020 GC 2020 DEJaar en scenario
gezin
paar
alleen

The model - regional claims
Regional claims are derived from sector-specific models, based on the previous assumptions

Land Use Scanner: model basics 2

The model - current land use
Digital maps from different sources (CBS, LGN etc. ) arecombined in a basemap with up to 70 (!) land use types

The model – physical suitability
Physical properties of the land influence the possible land usee.g. the suitability for agricultural land use is based on soil and groundwater conditions

The model - policy maps
Dutch land use is highly planned e.g. ecological network;Nature is constructedhere, urbanisation is not allowed

The model – distance relations
Land use is influenced by its surroundingse.g. companies like to be located near train stations

The model - suitability maps
All components are combined into a single suitability map for a specific land use function (housing, working etc.)
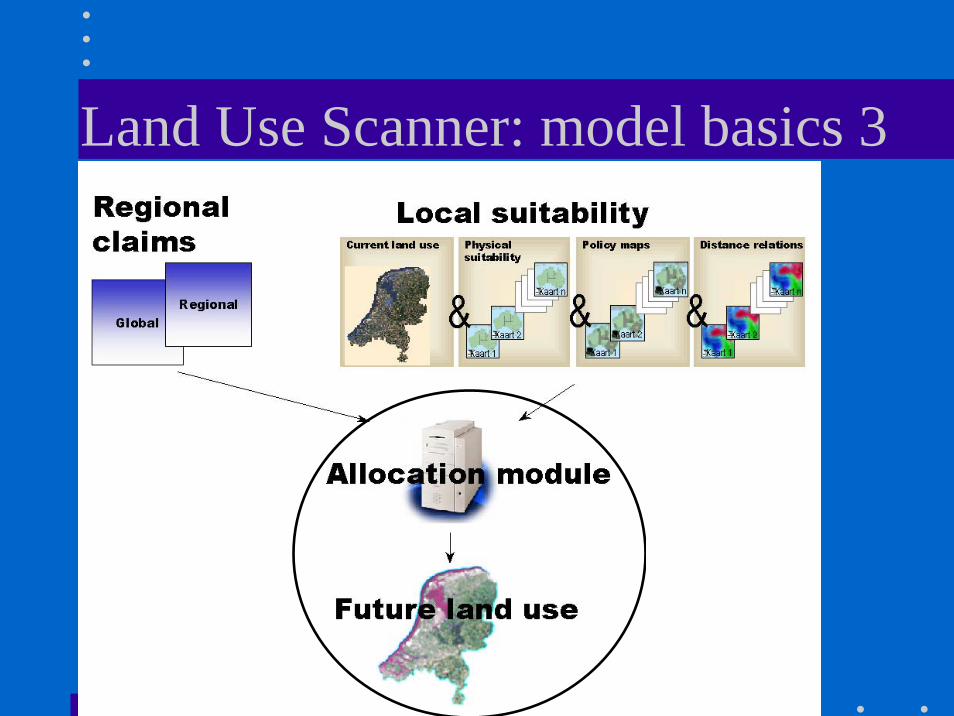
Land Use Scanner: model basics 3

Allocation principle
Doubly constrained logit model:
• allocation balances demand and supply• competing claims start bidding process• economic (land market) analogy
)( cjscjcj ebaM ⋅⋅⋅= β

The model - future landuse

The model - indicators
Increased urban surface area (2030-2000):
Regional Community - Global Economy

The model - indicators
Composition & spatial configuration metrics:
Current land use Global Economy Regional community Total built up area [ha] 464088 700570 612747 Urbanisation degree [%] 11 17 15 Number of urban areas 1380 1413 1208 Mean size of urban areas [ha] 227 331 338

Conclusion
• Complete information system• Powerful integration tool• Flexible instrument for adding base data,
scenario information and indicators• Valuable addition to GLOWA-Elbe?