land use land cover changes and implications for food ... of houses and other non- ... the kenyan...
TRANSCRIPT
Seediscussions,stats,andauthorprofilesforthispublicationat:https://www.researchgate.net/publication/269057487
LandUseLandCoverChangesandImplicationsforFoodProduction:ACaseStudyofKeumbuRegionKisiiCounty,Kenya
Article·October2014
READS
100
2authors,including:
EdwardWaithaka
JomoKenyattaUniversityofAgriculturean…
14PUBLICATIONS14CITATIONS
SEEPROFILE
Allin-textreferencesunderlinedinbluearelinkedtopublicationsonResearchGate,
lettingyouaccessandreadthemimmediately.
Availablefrom:EdwardWaithaka
Retrievedon:14May2016
International Journal of Science and Research (IJSR) ISSN (Online): 2319-7064
Impact Factor (2012): 3.358
Volume 3 Issue 10, October 2014 www.ijsr.net
Licensed Under Creative Commons Attribution CC BY
Land Use Land Cover Changes and Implications for Food Production: A Case Study of Keumbu Region
Kisii County, Kenya
Benard Abere Ogechi1, Waithaka Edward Hunja2
1Department of Geomatic Engineering and Geospatial Information Systems (GEGIS),
Jomo Kenyatta University of Agriculture and Technology, Kenya
Abstract: The study explored land use /cover changes, food production trends and main drivers behind deteriorating agricultural land, relationship between population, land use changes and implications on food production and security. The area experienced a high rate of land use / cover changes affecting food production. Agricultural land fragmentations, population increase and urbanization led to decrease of agricultural land and food production leaving the rural livelihoods food insecure. Land use / cover changes classification and analysis done using Landsat TM image in Erdas Imagine. Soil fertility, Digital Elevation Model (DEM), population density and poverty processed, analyzed and correlated to food production using ArcGIS 10.1 and Statistical Package for Social Sciences (SPSS). Forestland and grassland reduced by 58% and 91%; Cropland and settlements increased by 11% and 0.6% respectively. Population density was 4303 persons per square kilometers, with 65% in absolute poverty. Population growth and settlements had moderate negative relationship with food production while forestland had strong positive correlation relationship. The soil fertility depletion shows a negative trend impacting food production with decrease of 29%. Keywords: Land use/cover, population density, land degradation, food security. 1. Introduction Land use is the process of arranging the activities and inputs people undertake in a certain land cover type to produce, change or maintain it [1]. Land resources are used for a variety of purposes which include agriculture land use, reforestation, settlement, near-surface water and eco-tourism, in a sustainable manner. Food production is the cultivation of food crops with special regard to maximization of the total yield gained per acre in one planting season. The problems of food supply and farming are among the most bewildering, diffuse and frustrating of mankind contemporary dilemmas [2]. Food security refers to the availability of food and one’s access to it while food problem is the apparent inability of the world’s people to feed them adequately and consistently. The ever increasing human population threatens the future food production in Keumbu region [3]. Construction of houses and other non-food uses of agricultural lands have reduced food supply as the area under food crops reduced. The world grain stocks was noted to have dwindled to dangerously low levels, highlighting the fragility of food supplies in a world where the population is expected to rise [4]. Chronic under nutrition persists mainly in countries with low incomes in Africa Kenya and in particular Keumbu region included, most of which depend heavily on agriculture. Eliminating hunger will require a lot of effort to accelerate agricultural and rural development in these very countries. There have been good land use land cover strategies put in place to increase the output of land resources. But there is failure in the relationship between good land use land cover practices, good economic benefits and good nutrition of the population. Rapid population growth has resulted in the scarcity of the most natural resource, soil and water on which agriculture depends [5]. The Kenyan economy is dominated by agriculture regardless of the fact that only 15
to 17 percent of its total land area has sufficient fertility and rainfall to be farmed and only 7 to 8 percent can be classified as first-class land. Most of the land is either arid or Semi-arid. These areas are highly productive with animal husbandry especially when the correct numbers of animals are stocked in a specified area to enable sustainable use of the land as a resource. The 7 to 8 percent which are classified as first class land submits to the economic challenge with their first choice being cash crops rather than food crops [4]. Agricultural sector directly contributes 24% of the Gross Domestic Product (GDP) and 27% of GDP indirectly through linkages with manufacturing, distribution and other service related sectors. Approximately 45% of Government revenue is derived from agriculture and the sector contributes over 75% of industrial raw materials and more than 50% of the export earnings [6]. The rate of population growth, land fragmentations for settlements, culture and norms of land tenure affects land use land cover changes and food production in Keumbu region significantly [7]. Cash crop growing for better incomes and failure to adapt sustainable agriculture e.g. minimum tillage, crop rotation and subsistence farming affects food production [8]. Environmental degradation due to cutting down of a few trees for firewood and timber in the region, interferes with water catchment areas and wetlands [9]. The objectives of the study was to analyze land use land cover changes and implications for food production in Keumbu Region Kisii County, Kenya using GIS and Remote Sensing, food production trends and main drivers behind deteriorating agricultural land, relationship between population, land use changes and implications on food production and security [10].
Paper ID: OCT1499 752

International Journal of Science and Research (IJSR) ISSN (Online): 2319-7064
Impact Factor (2012): 3.358
Volume 3 Issue 10, October 2014 www.ijsr.net
Licensed Under Creative Commons Attribution CC BY
2. Methodology Keumbu region lies on Latitude: 0° 41' 0 N and Longitude: 34° 46' 0 E in the western region of Kenya (newly created Kisii County), covers total land area of 132.3 square kilometers and an elevation of 1700m above sea level. It lies on a highland equatorial climate with rich volcanic soils and experiences two rainfall seasons; Short (September - November) and Long (February - June), of over 1,500mm per annum with temperatures ranging from 16°C to 27°C (Figure 1). The data sources used were topographic map sheets 130/1, 2, 3 and 4 at a scale of 1:50,000, Land sat Tm image of path 170 and of row 60 of 1990, 2000 and 2010, Demographic data for years 1989, 1999 and 2009 and Poverty Index data from the Kenya National Bureau of Statistics, Crop production data from the District Agriculture Officer, Soil and Terrain data from the International Livestock Research Institute (ILRI).The vector and raster data sources were harmonized to the same coordinate system of WGS84 spheroid zone 36S, soil map and DEM developed to determine soil fertility, Landsat TM images processing involved layer stacking, Sub-setting, visual image interpretation, image enhancement. creating training sites, supervised classification, post-classification for change detection and analysis in Erdas Imagine, population, poverty index and food production data were tabulated, maps developed to determine densely populated and poverty stricken areas and correlation analysis done using ArcGIS 10.1, SPSS and Microsoft office computer programmes.
Figure 1: Study Area
3. Results and discussion The region is endowed with deep, well-drained, relatively fertile soils with good rainfall. Most of the farms had soil conservation structures. The main cash crop grown was tea while the food crops included maize, beans and sweet potatoes. The soils were of good fertility and drainage but overused. The poor farmers in the region encountered numerous problems, which contributed to low crop and livestock productivity. These included: continuous cropping on less fertile land, nonuse of the recommended manures, fragile easily erodible soils, poor crop and animal husbandry. Poor soil management practices, use of unimproved low yielding crop varieties and livestock breeds
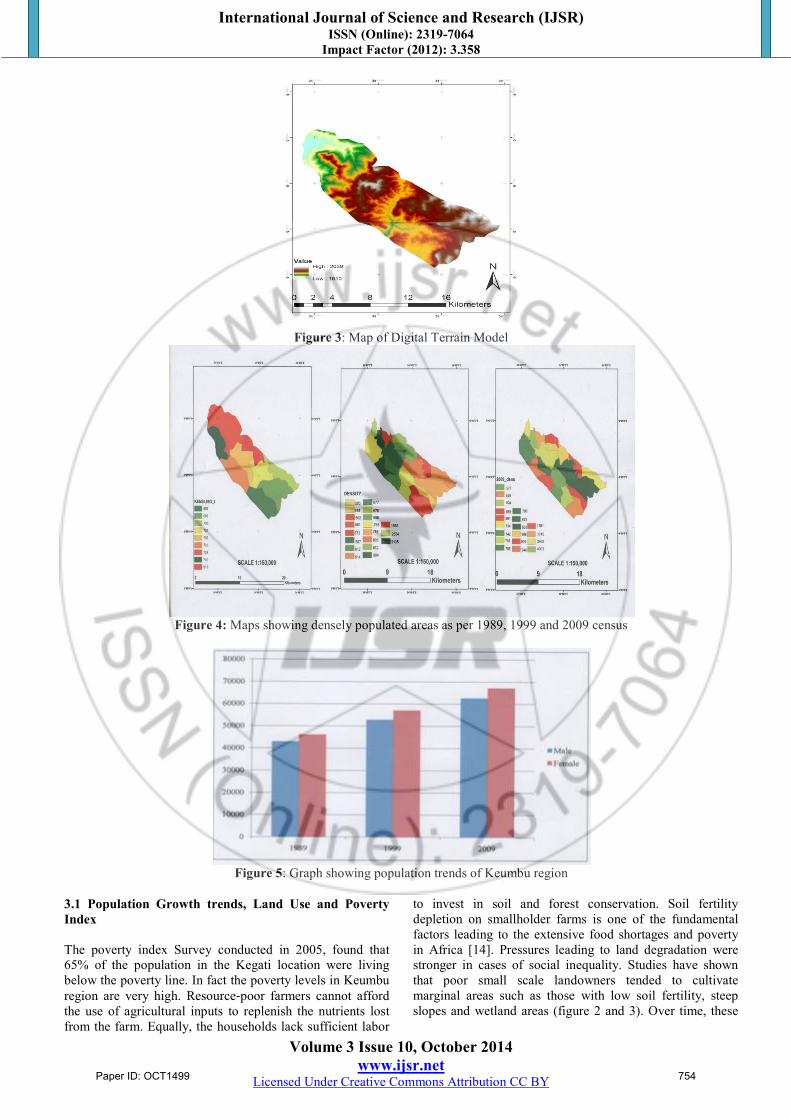
had culminated to low living standard [7]. In order to increase the per capita land productivity artificial fertilizers were used as soil fertility had already depleted [5]. During the 1999 population census Keumbu division which comprises Kisii municipality that time had 109837 people comprising of 52797 males and 57040 females residing in an area of 132.3 square kilometers. The average population density of the division in 1999 was 830 persons per square kilometers, with Nyaura location having an extremely high density of 3135 persons per square kilometers compared with that of 2009 which was 4303 persons per square kilometers (figure 4). Rural densities go up to 950 persons. The average number of persons per household in the division was 4.9, meaning that the average landholding size per family was approximately 0.6 ha only, deducting the town people o.7 ha. In 2006 these low figures were already reduced to 0.45 ha respectively 0.6 ha. This means very intensive agriculture to make a living out of this small piece of land, a very difficult situation [11].High population pressure was the main indirect cause of agricultural land degradation followed by poverty. In 1989, Keumbus’s population was only 88,942 people, but by 2009-20 years later- the population had rose to 129,745 [12]. An increased human population, however, resulted in the shrinking of the farm sizes. Increased food production and consumption was undermined by rapid population growth, unequal land distribution, shrinking landholdings and widespread land degradation [13]. Without expansion areas, the intensity of land use was increased leading to depletion of nutrients. A large population meant higher demand for fuel wood and land for cultivation and settlement, and these impacted on forestland and grassland leading to the degradation of these resources [9].
Figure 2: Soil map
Paper ID: OCT1499 753
International Journal of Science and Research (IJSR) ISSN (Online): 2319-7064
Impact Factor (2012): 3.358
Volume 3 Issue 10, October 2014 www.ijsr.net
Licensed Under Creative Commons Attribution CC BY
Figure 3: Map of Digital Terrain Model
Figure 4: Maps showing densely populated areas as per 1989, 1999 and 2009 census
Figure 5: Graph showing population trends of Keumbu region
3.1 Population Growth trends, Land Use and Poverty Index The poverty index Survey conducted in 2005, found that 65% of the population in the Kegati location were living below the poverty line. In fact the poverty levels in Keumbu region are very high. Resource‐poor farmers cannot afford the use of agricultural inputs to replenish the nutrients lost from the farm. Equally, the households lack sufficient labor
to invest in soil and forest conservation. Soil fertility depletion on smallholder farms is one of the fundamental factors leading to the extensive food shortages and poverty in Africa [14]. Pressures leading to land degradation were stronger in cases of social inequality. Studies have shown that poor small scale landowners tended to cultivate marginal areas such as those with low soil fertility, steep slopes and wetland areas (figure 2 and 3). Over time, these
Paper ID: OCT1499 754
International Journal of Science and Research (IJSR) ISSN (Online): 2319-7064
Impact Factor (2012): 3.358
Volume 3 Issue 10, October 2014 www.ijsr.net
Licensed Under Creative Commons Attribution CC BY
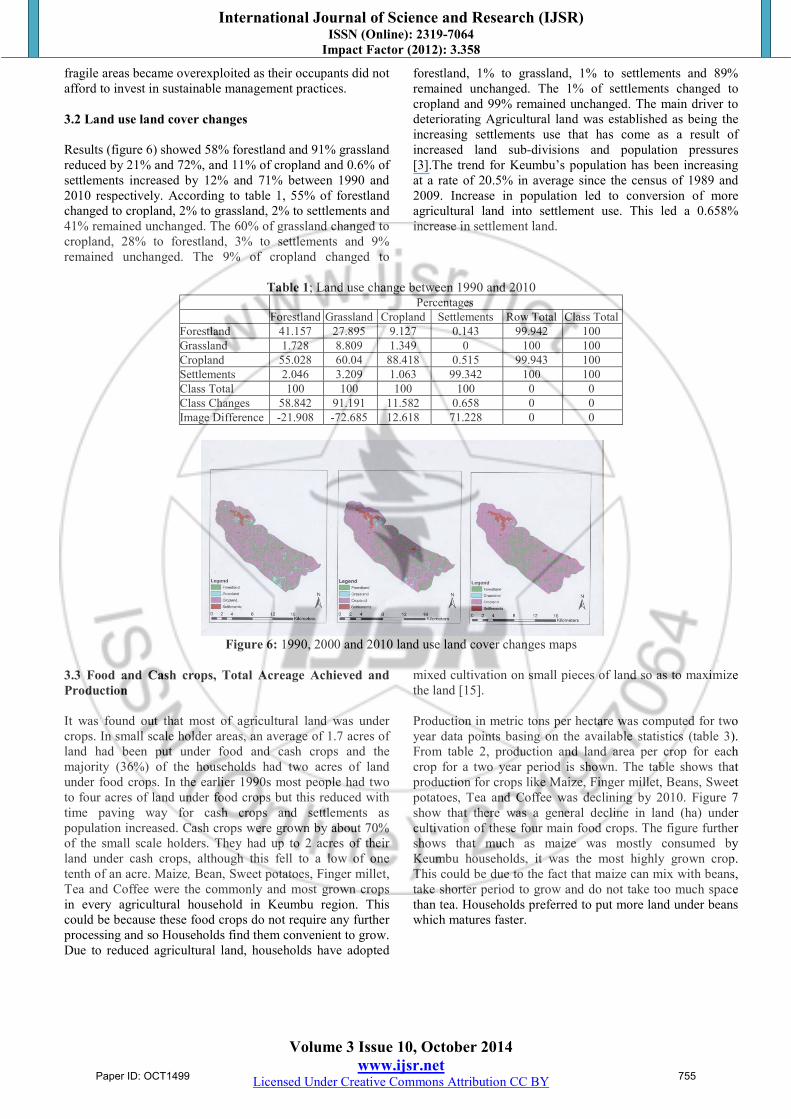
fragile areas became overexploited as their occupants did not afford to invest in sustainable management practices. 3.2 Land use land cover changes Results (figure 6) showed 58% forestland and 91% grassland reduced by 21% and 72%, and 11% of cropland and 0.6% of settlements increased by 12% and 71% between 1990 and 2010 respectively. According to table 1, 55% of forestland changed to cropland, 2% to grassland, 2% to settlements and 41% remained unchanged. The 60% of grassland changed to cropland, 28% to forestland, 3% to settlements and 9% remained unchanged. The 9% of cropland changed to
forestland, 1% to grassland, 1% to settlements and 89% remained unchanged. The 1% of settlements changed to cropland and 99% remained unchanged. The main driver to deteriorating Agricultural land was established as being the increasing settlements use that has come as a result of increased land sub-divisions and population pressures [3].The trend for Keumbu’s population has been increasing at a rate of 20.5% in average since the census of 1989 and 2009. Increase in population led to conversion of more agricultural land into settlement use. This led a 0.658% increase in settlement land.
Table 1; Land use change between 1990 and 2010
Percentages Forestland Grassland Cropland Settlements Row Total Class Total
Forestland 41.157 27.895 9.127 0.143 99.942 100 Grassland 1.728 8.809 1.349 0 100 100 Cropland 55.028 60.04 88.418 0.515 99.943 100 Settlements 2.046 3.209 1.063 99.342 100 100 Class Total 100 100 100 100 0 0 Class Changes 58.842 91.191 11.582 0.658 0 0 Image Difference -21.908 -72.685 12.618 71.228 0 0
Figure 6: 1990, 2000 and 2010 land use land cover changes maps
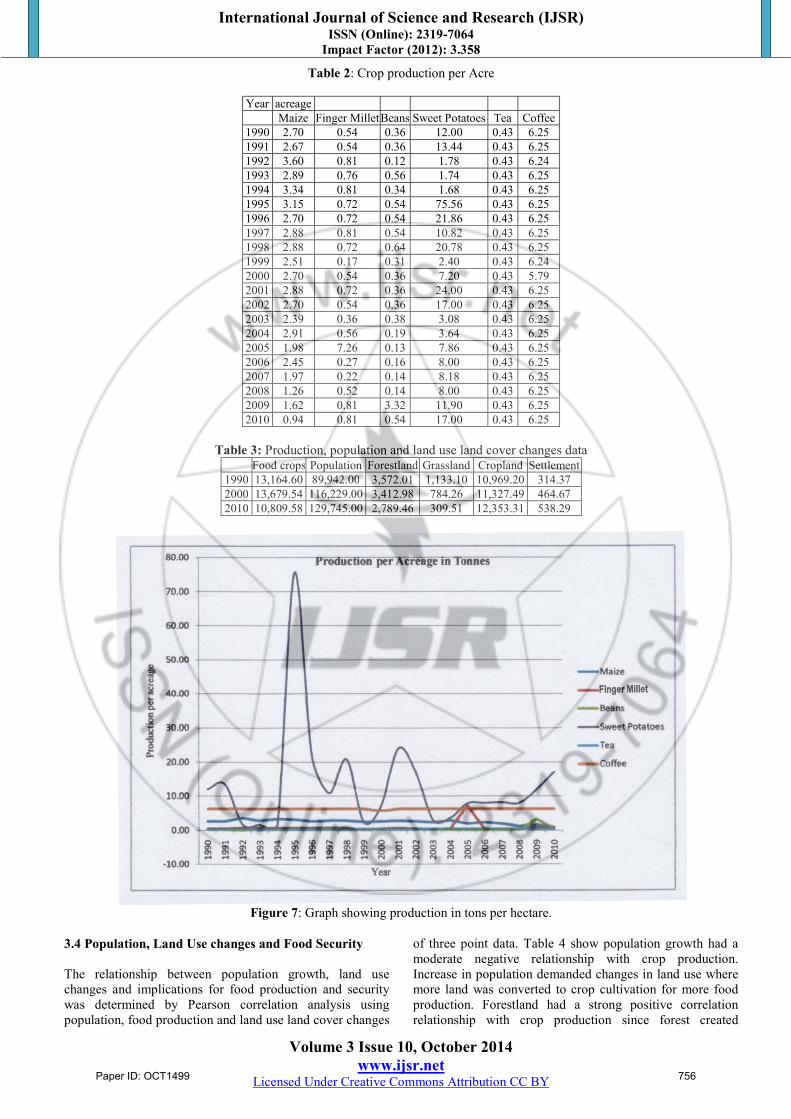
3.3 Food and Cash crops, Total Acreage Achieved and Production It was found out that most of agricultural land was under crops. In small scale holder areas, an average of 1.7 acres of land had been put under food and cash crops and the majority (36%) of the households had two acres of land under food crops. In the earlier 1990s most people had two to four acres of land under food crops but this reduced with time paving way for cash crops and settlements as population increased. Cash crops were grown by about 70% of the small scale holders. They had up to 2 acres of their land under cash crops, although this fell to a low of one tenth of an acre. Maize, Bean, Sweet potatoes, Finger millet, Tea and Coffee were the commonly and most grown crops in every agricultural household in Keumbu region. This could be because these food crops do not require any further processing and so Households find them convenient to grow. Due to reduced agricultural land, households have adopted
mixed cultivation on small pieces of land so as to maximize the land [15]. Production in metric tons per hectare was computed for two year data points basing on the available statistics (table 3). From table 2, production and land area per crop for each crop for a two year period is shown. The table shows that production for crops like Maize, Finger millet, Beans, Sweet potatoes, Tea and Coffee was declining by 2010. Figure 7 show that there was a general decline in land (ha) under cultivation of these four main food crops. The figure further shows that much as maize was mostly consumed by Keumbu households, it was the most highly grown crop. This could be due to the fact that maize can mix with beans, take shorter period to grow and do not take too much space than tea. Households preferred to put more land under beans which matures faster.
Paper ID: OCT1499 755
International Journal of Science and Research (IJSR) ISSN (Online): 2319-7064
Impact Factor (2012): 3.358
Volume 3 Issue 10, October 2014 www.ijsr.net
Licensed Under Creative Commons Attribution CC BY
Table 2: Crop production per Acre
Year acreage Maize Finger Millet Beans Sweet Potatoes Tea Coffee
1990 2.70 0.54 0.36 12.00 0.43 6.25 1991 2.67 0.54 0.36 13.44 0.43 6.25 1992 3.60 0.81 0.12 1.78 0.43 6.24 1993 2.89 0.76 0.56 1.74 0.43 6.25 1994 3.34 0.81 0.34 1.68 0.43 6.25 1995 3.15 0.72 0.54 75.56 0.43 6.25 1996 2.70 0.72 0.54 21.86 0.43 6.25 1997 2.88 0.81 0.54 10.82 0.43 6.25 1998 2.88 0.72 0.64 20.78 0.43 6.25 1999 2.51 0.17 0.31 2.40 0.43 6.24 2000 2.70 0.54 0.36 7.20 0.43 5.79 2001 2.88 0.72 0.36 24.00 0.43 6.25 2002 2.70 0.54 0.36 17.00 0.43 6.25 2003 2.39 0.36 0.38 3.08 0.43 6.25 2004 2.91 0.56 0.19 3.64 0.43 6.25 2005 1.98 7.26 0.13 7.86 0.43 6.25 2006 2.45 0.27 0.16 8.00 0.43 6.25 2007 1.97 0.22 0.14 8.18 0.43 6.25 2008 1.26 0.52 0.14 8.00 0.43 6.25 2009 1.62 0.81 3.32 11.90 0.43 6.25 2010 0.94 0.81 0.54 17.00 0.43 6.25
Table 3: Production, population and land use land cover changes data
Food crops Population Forestland Grassland Cropland Settlement 1990 13,164.60 89,942.00 3,572.01 1,133.10 10,969.20 314.37 2000 13,679.54 116,229.00 3,412.98 784.26 11,327.49 464.67 2010 10,809.58 129,745.00 2,789.46 309.51 12,353.31 538.29
Figure 7: Graph showing production in tons per hectare.
3.4 Population, Land Use changes and Food Security The relationship between population growth, land use changes and implications for food production and security was determined by Pearson correlation analysis using population, food production and land use land cover changes
of three point data. Table 4 show population growth had a moderate negative relationship with crop production. Increase in population demanded changes in land use where more land was converted to crop cultivation for more food production. Forestland had a strong positive correlation relationship with crop production since forest created
Paper ID: OCT1499 756

International Journal of Science and Research (IJSR) ISSN (Online): 2319-7064
Impact Factor (2012): 3.358
Volume 3 Issue 10, October 2014 www.ijsr.net
Licensed Under Creative Commons Attribution CC BY
conducive environment for agriculture as soil fertility was increased due to making the land furrow and adequate rainfall. Settlements had a moderate negative relationship with food crop production as farmland was reduced due to land subdivisions, village settlements, and shopping centers and towns [7]. Results show that by 1990, Keumbu region was already food insecure in terms of available agriculture land degradation. From 1990 onwards as urbanization increased through
increasing population, the agricultural land degradation kept on widening as a result of reducing available land as shown in figure 7. Currently the region is food insecure; to grow food crops for the current population on the already degraded agricultural land is quite impossible. Other conditions remaining constant, figure 7 also shows that available agricultural land in Keumbu region will cease out by the year 2030.
Table 4: Correlation results
Year Population Forestland Grassland Cropland Settlement Pearson Correlation
Year 1.000 .983 -.946 -.996 .963 .981 Population .983 1.000 -.871 -.963 .898 1.000 Forestland -.946 -.871 1.000 .971 -.998 -.865 Grassland -.996 -.963 .971 1.000 -.983 -.960 Cropland .963 .898 -.998 -.983 1.000 .893 Settlement .981 1.000 -.865 -.960 .893 1.000
Sig. (1-tailed) Year . .058 .105 .028 .086 .062 Population .058 . .163 .086 .145 .004 Forestland .105 .163 . .077 .019 .167 Grassland .028 .086 .077 . .058 .090 Cropland .086 .145 .019 .058 . .149 Settlement .062 .004 .167 .090 .149 .
N Year 3 3 3 3 3 3 Population 3 3 3 3 3 3 Forestland 3 3 3 3 3 3 Grassland 3 3 3 3 3 3 Cropland 3 3 3 3 3 3 Settlement 3 3 3 3 3 3
Table 5: Descriptive Statistics for correlation analysis
Mean Std. Deviation N Year 2.0000E3 10.00000 3
Population 1.1197E5 20240.08990 3 Forestland 3.2582E3 413.61259 3 Grassland 7.4229E2 413.39598 3 Cropland 1.1550E4 718.38231 3
Settlement 4.3911E2 114.12724 3 Significance level is 0.05 or 5%. This guide was used to interpret correlation values Pearson’s (r) and Spearman (ρ) are correlation coefficients Range from -1 to 1 -1 = Perfect Negative relationship 0 = No relationship 1 = Perfect Positive relationship As a guide: ± (0.1 – 0.3) = Weak ± (0.4 – 0.7) = Moderate ± (0.7+) = Strong 4. Conclusion Keumbu is food insecure region with agricultural land already degraded and densely populated with high poverty levels. The government and other stakeholders should make small scale farmers adapt good farming practices and land tenure systems that will take care for the growing population and natural resource utilization. This would always check on
how much natural resource is available to sustain the population. In this way, measures combating population growth and resource utilization would be determined. This will reduce the risks ahead of human life in terms of land and food availability. 5. Recommendation Finally, the research has room for improvement when the following factors are considered; 1) Land use land cover data collected should include
farming methods used by farmers in order to map and analyze the land use/ cover changes and implications for food production if the living conditions and standards of rural livelihoods are to be improved and maintained at current levels.
2) The food production data should include livestock products and animal population data in order to map adequately the relationship between land use land cover changes, population growth and food security.
6. Acknowledgement Authors would like to take this opportunity to thank Survey of Kenya (SOK), Kenya National Bureau of Statistics (KNBS) and Regional Centre for Mapping Resources and Development (RCMRD) for provision of the required data for this project.
Paper ID: OCT1499 757
International Journal of Science and Research (IJSR) ISSN (Online): 2319-7064
Impact Factor (2012): 3.358
Volume 3 Issue 10, October 2014 www.ijsr.net
Licensed Under Creative Commons Attribution CC BY
References
[1] FAO (Food and Agricultural Organization of the United Nations) 1999. Uganda Soil Fertility Initiative: Concept Paper. Investment Centre Division Italy, Rome.
[2] Gregory K., and Paul W. 1976. Triumph or Triage? The World Food Problem in Geographical Perspective USA: Association of American Geographers.
[3] Hamza, I. A. and Iyela, A. Land Use Pattern, Climate Change, and Its Implication For Food Security In Ethiopia: A Review, Ethiopian Journal of Environmental Studies and Management Vol. 5 No.1 2012.
[4] FAO (Food and Agricultural Organization) 2009. World Food Report: Rome
[5] Antle, J.M., Stoorvogel, J. J., Jones, J., and Ruane, A. 2012. The Use of Crop Growth Simulation Models to Construct Counterfactuals for Regional Economic Assessment of Climate Change Impacts.
[6] kari.org. (Kenya Agricultural Research Institute) 2013, Report: http://www.kari.org (Accessed 03 February 2013).
[7] Sadik, N. 2002. Population growth and the food crisis, http://www.fao.org (Accessed 04 February 2013).
[8] Joseph. M. Maitima, J.M Olson, S. M. Mugatha, S. Mugisha and I. T. Mutie. Land Use Changes, Impacts and Options for Sustaining Productivity and Livelihoods in the Basin Of Lake Victoria. Journal of Sustainable Development in Africa, Volume 12, No.3, 2010.
[9] Olson, J. M., Misana, S., Cambell, D. J., Mbonile, and Mugisha, S. 2004. “Land Use Change Impacts and Dynamics (LUCID), Project Working Paper 48,” International Livestock Research Institute, Nairobi, Kenya, Pp38.
[10] Schiek, Ben. 2012. “Impacts of Climate Change on Maize-Based Agricultural Systems in Kenya:” Ms. Thesis, Dept. of Agricultural and Resource Economics, Oregon State University.
[11] Butt B and Olson JM 2002. “An approach to dual land use and land cover interpretation of 2001 satellite imagery of the eastern slopes of Mt. Kenya: Land use Change Impacts and Dynamics (LUCID) Project Working Paper 16.” International Livestock Research Institute (ILRI), Nairobi, Kenya.
[12] knbs.or.ke. (Kenya National Bureau of Statistics) 2009, Kenya Population Report. www.eoearth.org.: http://www.knbs.or.ke (Accessed 03 February 2013).
[13] Sirte, Libyan Arab Jamahiriya 2008. “Water for Agriculture and Energy in Africa: the Challenges of Climate Change.” Uganda National Investment Brief.
[14] Buresh, R.J., Sanchez, P.A., and Calhoun, F. edn 1997. Replenishing soil fertility in Africa: Soil society of America, Special Publication No. 51. Madison, USA.
[15] Valdivia, R., Stoorvogel, J., and Antle, J.M. 2012. Economic and environmental Impacts of Climate Change and Socio-Economic Scenarios: A Case Study of a Semi-Subsistence Agricultural System. The International Journal of Climate Change Impacts and Responses.
Paper ID: OCT1499 758