lake monitoring field manual · chapter 1. importance of lake monitoring lake monitoring has become...
TRANSCRIPT

by
Lake Monitoring Field Manual
i
Meredith Becker Nevers and Richard L. Whitman
U.S. Geological Survey
Lake Michigan Ecological Research Station 1100 N. Mineral Springs Rd.
Porter, IN 46304

Acknowledgments: We thank all of those who directly contributed to this document: Tom Horvath, Laurel Last, Stephanie Mahoney, and Maria Goodrich. We also thank Richard Klukas for his guidance on the project and the Indiana Interagency Task Force on E. coli for their contribution.
ii

Table of Contents Chapter 1. Importance of Lake Monitoring ..................................................................... 1
Developing a Monitoring Plan...................................................................................... 2 Chapter 2. Principles of Monitoring Design .................................................................... 3 Chapter 2. Principles of Monitoring Design .................................................................... 4
Sample Design ............................................................................................................ 8 Random Sampling.................................................................................................... 8 Stratified sampling.................................................................................................. 10
Pitfalls of sampling..................................................................................................... 11 Chapter 3. Limnology ................................................................................................... 12
Physical Characteristics............................................................................................. 13 Chemical Characteristics ........................................................................................... 15 Energy Cycling .......................................................................................................... 16 Biological Communities ............................................................................................. 18
Chapter 4. Lake Parameters ........................................................................................ 20 Depth profiles for physical parameters ...................................................................... 20 Secchi disk ................................................................................................................ 22 Water chemistry and chlorophyll a............................................................................. 23 E. coli and other bacteria ........................................................................................... 25 Plankton..................................................................................................................... 26 Benthic macroinvertebrates and sediment chemistry ................................................ 29 Fishes ........................................................................................................................ 32
Chapter 5. Pre-sampling Decisions.............................................................................. 34 Selecting a fixed Sampling Site ................................................................................. 34 Making Preparations.................................................................................................. 35
Contract vs. In-house Laboratory Analysis............................................................. 35 Preservatives ......................................................................................................... 36 Electronic equipment.............................................................................................. 37 Gathering field equipment ...................................................................................... 39 Labeling samples ................................................................................................... 41
Chapter 6. Field Sampling............................................................................................ 42 Sampling Order.......................................................................................................... 42 Field notebooks ......................................................................................................... 43 GPS........................................................................................................................... 44 Secchi disk ................................................................................................................ 44 Depth Profiles ............................................................................................................ 45 Water Chemistry ........................................................................................................ 46 Chlorophyll a.............................................................................................................. 48 E. coli......................................................................................................................... 50 Plankton tow .............................................................................................................. 51 Zooplankton from a discrete depth ............................................................................ 53 Phytoplankton (nanoplankton) ................................................................................... 54 Benthic macroinvertebrates ....................................................................................... 55 Sediment Chemistry .................................................................................................. 57
iii
Chapter 7. After Field Sampling ................................................................................... 58 Preventing the spread of invasive, non-native species .............................................. 58 Storing and Shipping Chemistry Samples ................................................................. 60 Sampling Equipment.................................................................................................. 60 Preserving Biological Samples .................................................................................. 61 Processing Biological Samples.................................................................................. 62
E. coli ..................................................................................................................... 63 Chlorophyll a .......................................................................................................... 66 Phytoplankton ........................................................................................................ 68 Zooplankton and Net Plankton............................................................................... 70 Benthic macroinvertebrates ................................................................................... 71
Data Storage ............................................................................................................. 72 Long-Term Storage.................................................................................................... 73
Sampling equipment .............................................................................................. 73 Storing samples and flammable preservatives....................................................... 73
Chapter 8. Limnology Terms and Concepts ................................................................. 74 Some Helpful Taxonomic References ........................................................................... 84 Equipment and Supplies and Laboratory Contacts ....................................................... 85 References Cited and Consulted .................................................................................. 86 Index ............................................................................................................................. 87 List of Figures and Tables Figure 1. Depth profiles for summer and winter stratification in a dimictic lake ............... 14 Figure 2. Generalized food web design .................................................................................. 17 Figure 3. A multiprobe sonde lowered through the water column can analyze several
variables simultaneously while being monitored from the lake surface. ................... 21 Figure 4. The Van Dorn sampler is effective for discrete depth sampling. ....................... 24 Figure 5. The cone section at the top of a Wisconsin net eliminates some of the water
pressure caused by pulling the net through water and makes for a more accurate sample collection................................................................................................................ 28
Figure 6. The ponar grab (left) is useful for rocky or gravel bottoms, but it can be quite heavy to pull up by hand. The Ekman dredge (right) is a lighter alternative that is widely used. ........................................................................................................................ 30
Table 1. Sampling Equipment Matrix............................................................................. 33
iv

Chapter 1. Importance of Lake Monitoring Lake monitoring has become an essential part of lake management due to increased human populations and the associated increase in pollution threats. The varieties of monitoring techniques are numerous. These range from tests that can be performed occasionally by those with little training to full-scale, professional analyses of the physical, chemical, and biological aspects of a lake ecosystem. Documenting and maintaining the collected data are crucial aspects of an effective monitoring program. Historic collected data may be useful in assessing changes to the ecosystem, provided there was good sampling design and execution. Lake monitoring may provide early warning signs of ecosystem degradation resulting from contaminant inputs, nutrient addition, sediment runoff, and overuse of the resource. By monitoring the physical, chemical, and biological status of a lake, changes to many aspects of the ecosystem can be detected quickly, and hopefully, harmful impacts can be eliminated before their consequences become unmanageable. Sources for these impacts may be far-ranging and include aerial deposition, upstream contamination, industrial or residential development, waste disposal, septic fields, water level control, mining, herbicide use, timber production, building of dams and levees, and non-native species invasions. With such a wide range of potential problems, monitoring a particular lake is certainly the most effective means of keeping track of possible impacts and ecological status. The first step in establishing a monitoring program is to figure out what questions are to be answered; what issues are important for the lake ecosystem? Past research may have uncovered some potential problems or there may be known sources of contamination to the lake. By first determining the goals of the program, resources will not be wasted by excessive or unnecessary sampling. In order for lake monitoring to be effective, information must first be collected on the lake’s status and condition so that changes are recognizable. A baseline inventory can be collected over the course of a year or so, or, if the lake has been studied previously, information from past studies can be gathered to create a picture of the ecosystem. Often, limited data are available, so a monitoring program is established with little background information on the lake. In these cases, the information collected with the monitoring program becomes the baseline data to which later data are compared. With active involvement, data can be collected continuously, and changes in lake status will be recognized in a timely manner. This manual was originally developed for a project examining the status of inland lakes in several National Parks around the Great Lakes. The parks included in the study ranged from essentially an urban park to a designated wilderness area, so a monitoring program for all of these parks had to be adaptable to many lake types. Initially, chemical and biological data from these lakes were collected over the course of two summer seasons plus an additional spring sampling. Using the data collected, monitoring protocols applicable to these lakes were developed. The lakes included in the baseline study now have a significant amount of data available about the chemistry and biology, but information about other lakes in the parks will have to be gleaned from past research or newly collected.
1

Developing a Monitoring Plan
Because of the various monitoring needs of lakes, planning the sampling program should be a high priority. Previous research conducted on the lakes should be reviewed, and if appropriate, trends should be highlighted. If any research has been conducted on a particular lake, it typically has resulted in disjunct data that need condensing. It is worth investing some time in this exercise because the amassed data will assist in later decision-making. Increasing nutrients over the past ten years, for example, would be a good indication that nutrients should be a key aspect of future monitoring. A lake may also have been sampled only once or never before. In these situations, the study lake may need some initial, more intense analysis in order to characterize the ecosystem. The cost involved is a constraint for developing a monitoring program. Costs incurred may include equipment, labor, analysis, and time. Equipment purchased will last for years if properly cared for, but maintenance and additional supplies can be a significant cost for a small budget. While electronic probes and other equipment are faster and far more accurate, replacement parts and service can be fairly expensive. Also, certain supplies must be purchased each year, such as filters and sampling bottles and jars. Labor will typically be the highest cost, particularly because so much work is involved in the sampling and analytical processes. Personnel will be needed for sampling, counting, processing, and analyzing, and some of these steps require training or expertise. If experts are not available, sample processing should be contracted to outside chemistry or biology laboratories, which can be a significant additional cost. When all of the samples have been processed, data must be checked and examined statistically. Furthermore, maintenance of the database for ongoing data entry is critical to a successful monitoring program. Too often, data are scattered in different notebooks and computer files, and important trends go unrecognized. Personnel will also be needed to set up and maintain the data collection. Consider costs and available personnel that will be required before attempting to begin sampling.
2
Costs involved in monitoring program
Time for development Equipment Supplies Personnel
Sample collection Sample processing
Sample analysis Data analysis

When the sampling protocol must be scaled back due to financial constraints, it is important first to address the existing concerns of the lake. Ask what should be sampled and why. If there are not any current, imposing threats, it might be helpful to find out what has been analyzed in the past and choose parameters for study based on previous findings. One option is to sample parameters that have been sampled in the past so that comparisons can be made. It may also be useful to select parameters that have not been studied before and thereby search for previously unknown threats to the lake. Parameters for testing should be selected carefully and with some forethought as to how the data will fit into future research or management plans for the lake. It would be useful also to select parameters that will be manageable in future monitoring. Some parameters are very expensive to test, but due to slow rates of change within lakes, testing occasionally can be less frequent. Planning will have to continue well into the future of the monitoring program in order to avoid the loss or compromise of program integrity. It is a good idea to select a date once a year on which to review the progress and future of the lake monitoring. At such a meeting, sampling schedules, storage, and processing should be reviewed to make decisions on the next steps and to assess the direction for monitoring. Decisions will also have to be made based on available funding and the priorities of the monitoring program. With the funding constraints understood, data should be analyzed to make informed choices about what sampling regimes should be continued. Furthermore, it will be important to be flexible regarding the future of the monitoring program. Often, the parameters selected turn out to be ineffective indicators for the lake’s status, so changes to the monitoring program must be made. Given appropriate consideration, this will not compromise the program’s effectiveness.
Steps for planning a sampling regime • Establish goals for the monitoring program • Research previous studies and data collected on study or nearby lakes • Estimate present or potential threats to the lake • Inventory equipment and personnel capabilities • Consider budget limitations for personnel and analysis • Look at statistical approaches for monitoring • Plan personnel time allocations
3

Chapter 2. Principles of Monitoring Design By Tom Horvath Purpose This section introduces the basic concepts of sampling design. We want you to know (1) why you are taking samples, (2) why you are taking samples from the places you are, and (3) some statistical principles– to let you know, for example, why you need to take three samples from the same site. Let’s begin with a discussion on the difference between a population and a sample. Problem: You want to know how many fish are in Rectangle Lake. Solution A: Catch EVERY fish in the lake and count it. Solution B: Take X samples from the lake and estimate the number of fish in the lake from the number of fish in your samples. Solution A is very straightforward; however, you may run into problems collecting every fish in your lake (especially if your lake is large), not to mention the backlash you will face from your fishing friends after cleaning out their favorite fishing hole. Solution B is a more attractive solution for a number of reasons, including the shorter amount of time you will need to solve your problem and remaining on good terms with your fishing friends. Statistically, a population is all the individual observations existing in a defined space and time. In Solution A, we count all the individual observations (i.e., fish) in the lake (i.e., our defined space at our given time) to know the exact population (i.e., the number of fish in the lake). In Solution B, each sample is an individual observation. A sample is a collection of individual observations selected by a particular procedure. In the above example, the collection (i.e., our X samples) of individual observations (i.e., each sample) can be used to give you an estimate of the number of fish in your lake. The second part of the definition of sample, “selected by a particular procedure” is more difficult to explain. In the example, an individual observation can be a gill net set for 1 hour, 1 throw of a big net, or 1 hour of hook-and-line fishing, etc. Thus, all the fish caught in that gill net, for example, constitute a single sample. Since you probably can’t collect every fish in the lake, you had better stick to Solution B. But how do you translate the data collected by sampling into an estimate of the total population? 4

Let’s say that fish can’t move (I know it’s absurd, but it will make this easier to understand) and your lake is rectangular. Inside the lake, the fish can be distributed in three ways: uniformly, randomly, or clumped (see below). Uniform Clumped Random Let’s also say that your net can catch all the fish in a single square above. Each time you throw your net, your sample is the number of fish in the net. If you know your net is 1/18th the size of the lake, then all you have to do to estimate the number of fish in the lake is to multiply the number of fish in your sample by 18. You can also calculate the fish density if you know the area each net covers (e.g., if each net covers 1 m2 and you catch 4 fish in the net, then you will have 4 fish/m2). We’ll apply these calculations to the three distributions above. Uniform: If you take one sample from anywhere in the lake, you will collect four fish. Now multiply 4 x 18 to get 72 fish in the lake, or you could say that you have 4 fish/m2. Knowing that there are indeed 72 fish in the lake (count for yourself), you have a very good estimate of the population. However, rarely are things distributed uniformly in nature, so let us take a look at the other possibilities. Random: If you take one sample, depending on where you take it, you could end up with 0, 1, 2, 3, or 4 fish in your sample. Multiplying these possibilities by 18, the estimated number of fish would be 0, 18, 36, 54, or 72. Knowing the real number of fish is 27 in this example, you might have a reasonable estimate (18 or 36 fish), but you may also have a very bad estimate (0 or 72 fish)! Clumped: If you take one sample, depending on where you take it, you could end up with 0, 1, 2, 3, 4, or even 5 fish in our sample. Multiplying these possibilities by 18, you would estimate the number of fish to be 0, 18, 36, 54, 72, or 90. Again, you may have a very bad estimate (0 or 90 fish) of the population, knowing that the real population is 37.
5
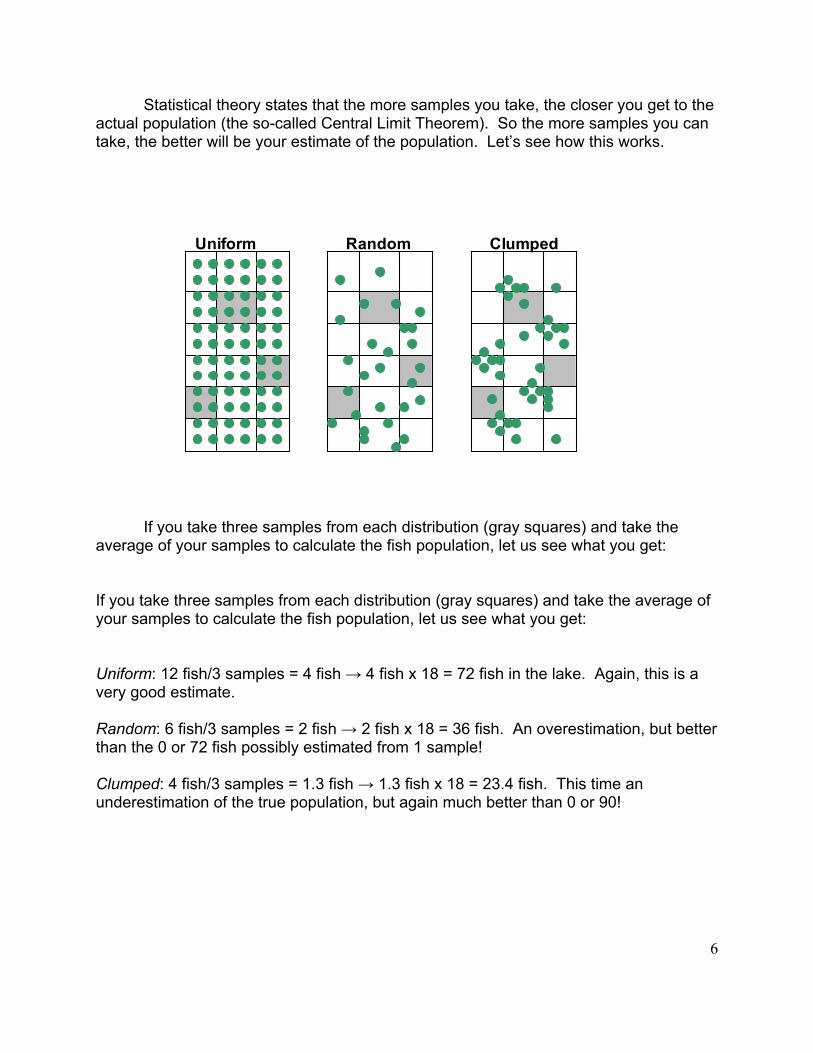
Statistical theory states that the more samples you take, the closer you get to the actual population (the so-called Central Limit Theorem). So the more samples you can take, the better will be your estimate of the population. Let’s see how this works. Uniform Clumped Random If you take three samples from each distribution (gray squares) and take the average of your samples to calculate the fish population, let us see what you get: If you take three samples from each distribution (gray squares) and take the average of your samples to calculate the fish population, let us see what you get: Uniform: 12 fish/3 samples = 4 fish → 4 fish x 18 = 72 fish in the lake. Again, this is a very good estimate. Random: 6 fish/3 samples = 2 fish → 2 fish x 18 = 36 fish. An overestimation, but better than the 0 or 72 fish possibly estimated from 1 sample! Clumped: 4 fish/3 samples = 1.3 fish → 1.3 fish x 18 = 23.4 fish. This time an underestimation of the true population, but again much better than 0 or 90!
6

Now let’s increase the number of samples to 10.
Uniform Clumped Random
Uniform: 40 fish/10 samples = 4 fish → 4 fish x 18 = 72 fish. As you see, with a uniform distribution you will always get a good estimate of the population. Random: 17 fish/10 samples = 1.7 fish → 1.7 fish x 18 = 30.6 fish. A good estimate…much better than when you took 1 and 3 samples. Clumped: 18 fish/10 samples = 1.8 fish → 1.8 fish x 18 = 32.4 fish. Another good estimate. So you can see that you are better off taking more samples when you estimate populations. Time for another definition. A replicate is a repetition of the basic sample or experiment. The term “replicate” is a complex statistical term. For purposes of simplicity we will use “replicate” and “sample” interchangeably instead of replication to avoid conflicts. Increasing the sample size increases the precision of our estimate.
The First Commandment of Statistics: Let n ≥2
Now that you know that you need numerous samples to make good estimates, how do you decide where to take your samples?
7

Sample Design
There are two basic choices for the design of your sampling– random sampling or stratified sampling. Random Sampling Let us return again to our fish in Rectangle Lake. This time you want to know the density of large-mouth bass (LMB) for the whole lake. You’ve been told time and time again by your angler friends (see, they still like you! Good thing you take samples) that LMB like to be in the shallow, weedy areas (clumped distribution). So when you go out to throw your net ten times (n = 10), you choose those nice weedy areas.
Rectangle Lake After counting your ten samples, you conclude that you catch an average of 5.6 fish per net (do the math for fun). This is a very good estimate of LMB density in the shallow weedy areas, but not for the whole lake (your original intention). What you’re
8

unknowingly doing is biasing your sampling towards ideal LMB habitats and consequently overestimating the lake’s LMB population. Random sampling is used to reduce the bias of the sampling/monitoring. But how do you randomize? To choose sampling sites randomly, you have to choose them such that any one site has the exact same chance of being sampled as any other site. For Rectangle Lake, you have divided the lake into 18 equal compartments, and you must randomly choose which compartment to sample. This can be done by assigning each compartment a number from 1-18, then using a table of random numbers, or some random number generator (e.g., pulling numbers out of a hat) to decide which compartment gets sampled.
9

Stratified sampling In addition to random sampling, we can also stratify before sampling. Stratified sampling is a process where a system of interest is divided into non-overlapping parts that together make up the whole. Usually areas are stratified based on some category. In the LMB example above, you began to stratify Rectangle Lake without knowing it. You divided the lake into “good” (shallow, weedy) and “bad” (open waters) habitats. All you needed to do was add the “bad” stratum to make the whole. S
��������������������������������������������������������������������������������������������
�������������������������������������������������������������������������������������������������������������������
��������������������������������������������������������������������������������������������
Rectangle Lake hallow, weedy
sampling sites ��������������������������������������������������������������������
Open waters sampling sites
Above we’ve done just that; the lake is now divided into 1) shallow, weedy and 2) open waters. Because you expect few LMB to be caught in the open waters, you do not need to spend as much effort sampling this area (although you do need to sample it!). You can decide to take seven samples in the shallow, weedy zone and three samples in the open water zone. Again, to avoid any sort of bias, you will randomly choose your sites within these zones. This is technically called stratified random sampling. Get out the hat! In the shallow, weedy zone you get an average of 5.3 fish, and in the open zone you get an average of 0.3 fish. We need to adjust the averages based on the amount of the lake’s area that is in each zone, but when you do that you calculate a whole lake population (this calculation is somewhat difficult and is not presented here) of 74.3 fish. Count the whole population and see how close you are.
10

Pitfalls of sampling Quite often subsampling and true replicated sampling are confused, so let us define a term, pseudoreplication. Pseudoreplication is when non-independent samples are used as individual samples. ...What? Let’s say that you want to know the average pH of Rectangle Lake. You know that taking multiple samples is a good idea so you want to go out and take ten pH readings. Because you are a well-trained limnologist you know that the pH can be different in shallow water and deep water (i.e., when the lake is stratified). You row your boat out to the deepest part of the lake, anchor, then proceed to take five pH readings in the surface water and five pH readings in the deep water. You get back to the lab and calculate the average pH for the lake. How many true samples did you take for Rectangle Lake? The answer is...only 1! Why? Well, you only sampled one site, despite the fact that you took ten subsamples at that site. You are guilty of pseudoreplication if you treat these subsamples as true replicates for determining the pH of Rectangle Lake because these subsamples are not really independent from each other. In other words, the first sample you took for pH is related closely to the second sample you took. You COULD use these data to report the pH of that one site in the lake, but not of the whole lake. Subsampling is not a bad idea; in fact, it is a very good idea because more subsamples increase your precision for that one site. To get away from the pseudoreplication problem in this example, you would want to take a couple subsamples from ten different sites in Rectangle Lake. Your ten subsamples at each site are averaged to give you ten true replicates (your true replicates, then, are the ten sites).* Now you have a grasp of the above concepts of experimental design. No more complaining about having to take three or five samples from the same spot or having to travel all over the lake to take samples. Now you know why you HAVE to do these things to make your study/monitoring statistically solid.
11
* Some may argue that no samples taken in the same lake are truly independent, and therefore all samples from a lake are pseudoreplicates. We acknowledge this point of view, but do not want to burden the discussion with this complex issue.
Chapter 3. Limnology For years lakes were viewed as complete ecosystems, relatively independent of the surrounding environment. A lake does indeed have its own processes with a complete array of plants, animals, and microorganisms. However, the lake ecosystem is greatly influenced by factors outside its immediate basin. Weather, climate, atmospheric inputs, hydrology, and land use practices can all exert a strong influence on lakes. Lake water usually originates far from the actual basin and flows into the lake via streams and rivers, permeates the terrestrial sediments in the form of groundwater or falls in the form of precipitation (see hydrologic cycle). Aside from water transport, materials also reach a lake through aerial transport. Nutrients, sediments, biological materials, and harmful contaminants may all be carried through the air and settle into the lake basin. Nutrient input through atmospheric deposition may be very important, especially in northern lakes with low surrounding terrestrial nutrient sources. Gases arising from bottom sediments or within the earth can also dissolve and influence water quality. Through all of these avenues, there are inputs of chemicals and biological materials, many of which are carried to the lake basin. These numerous sources of elements would be impossible to quantify, so instead, the lake basin is monitored. By monitoring changes in a lake ecosystem, deleterious impacts can be recognized before the damage is too great. The source can then be singled out and hopefully mitigated. Lakes naturally form and disappear over the years, but during their existence they are fascinating and lively ecosystems. Lakes can be formed through numerous geologic processes. During glacial advance and retreat, basins are scoured out that subsequently serve as catchment basins for available water (Great Lakes, USA/Canada); many lakes in the northern hemisphere were formed through these processes. Blocks of glacial ice trapped in glacial moraine may form a kettle lake (Walden Pond, Massachusetts). Tectonic activity also forms lakes, either in areas of uplifting or downfaulting (Lake Baikal, Siberia; Lake Tahoe, California/Nevada), or in the event of an earthquake (Reelfoot Lake, Tennessee) or landslide when the resulting basin fills with water. Dormant volcanoes or collapsed volcanic cones can also be the site of lake formation (Crater Lake, Oregon). Water action is another lake-forming process. Occasionally, glacial moraines dam streams (Finger Lakes, New York) or river erosion creates a new basin that is eventually closed off by sediment deposition (oxbow lakes). Rivers or streams may also become blocked or dammed, and the widening behind the dam can develop into a lake or reservoir. Along the coast, lakes can be formed when sediment deposition encloses a basin previously connected to a large lake or the ocean. Many of the inland lakes around the Great Lakes are embayments that have been closed in with sand. All of these types of lake formation depend on the geology of the region in which the basin is formed; basins can be washed away by filling water if the sediment is not stable enough to maintain the depression. Lakes have a limited existence that is influenced by morphology, nutrient and sediment input, and geographic and geologic setting. During its existence the lake is an ecosystem of complex physical, chemical, and biological interactions. The biological community of a lake system can be abundant and diverse; and it is through this
12

community that nutrients and chemicals are cycled through the system.
Physical Characteristics
The lake basin can be divided into two main sections. The littoral zone is the shallow area where light is able to penetrate the water all the way to the sediment surface. At the depth where light can no longer reach the bottom, the limnetic zone begins. Light penetration is important because it determines where rooted aquatic plants can grow (littoral zone) and where they are unable to grow (limnetic zone); it also affects water temperature throughout the lake. These zone distinctions shift in any particular lake through the seasons or over the years, however, depending on factors such as primary production, water clarity, and sediment infilling. Light is scattered through the water column, and the depth at which the light is only 1% of the surface light is called the compensation depth. At this point, respiration is equal to photosynthesis. Above the compensation depth is the photic zone or trophogenic zone where plants create more products than are consumed, and below the compensation depth is the aphotic zone or tropholytic zone where food consumption is greater than production. During summer, sunlight and warm weather heat the upper layers of the lake. Because sunlight is unable to penetrate the entire water column, deeper waters are not as warm as surface waters. With increasing depth, heat is transferred through the water with rapidly decreasing efficiency. The section of water column at which temperature decreases most rapidly with depth, due to less heat transfer, is called the metalimnion. Some limnologists define the metalimnion as the area where temperature changes at least 1 0C per meter of water. Above the metalimnion is the epilimnion, where warm water circulates at a relatively constant temperature. Below the metalimnion is the much cooler water of the hypolimnion. Cool water is denser than warm water, so it will remain in the bottom layers of the lake, and therefore the epilimnetic and hypolimnetic layers do not mix. A lake with these distinct layers is called stratified. In a dimictic lake (mixes twice), the water layers start to break up as summer turns to fall. Fall air temperatures and wind action cool the surface waters, and as the water temperature in the epilimnion drops, the water begins to sink. The sinking water destabilizes the thermocline, and as this former epilimnetic water cools to temperatures lower than the hypolimnetic water, it replaces it in the deeper zone of the lake. Hypolimnetic water then begins to rise because it is now less dense than the cooler water sinking to the lake bottom. Mixing in the fall results from the cooling of air temperatures and also due to high winds associated with fall storms. For this reason, the lake mixes repeatedly until winter draws nearer. This process of sinking and rising related to temperature changes is called lake mixing or turnover, and it usually occurs in the fall and the spring in temperate lakes. As winter approaches, the lake continues to cool in response to air temperatures. When water temperature reaches 4 0C, it is at its most dense. Any water at this temperature will be sitting at the bottom of the lake. If lake water continues to cool past 4 0C, that water then begins to rise toward the surface as density decreases again. Cooling may continue, and the water will rise until it reaches 0 0C, at which point it will
13

be at the lake surface and may form ice. At this point, the coldest water is at the surface and the warmest water (4 0C) is at the bottom of the lake. This layering is called winter stratification or inverse stratification. This relationship between water density and temperature prevents lakes from freezing from the bottom up and allows animals and plants to survive the winter under the ice. In the spring, the ice begins to melt, and the warming water sinks as it approaches 4 0C and then rises again as temperature increases above 4 0C. There is lake turnover again as water layers cycle through the water column, sinking and rising. This process will continue until summer stratification.
Epilimnion
Metalimnion
Hypolimnion
ICE
Temperature 0C
Summer Stratification
Temperature 0CWinter Stratification
40
Figure 1. Depth profiles for summer and winter stratification in a dimictic lake
Lake turnover is critical for redistributing nutrients, organics, and gases that are dissolved in the lake water. The process described applies to dimictic lakes, but there are numerous other mixing regimes depending on geography, altitude, and basin characteristics. Some lakes turn over several times in a year while others never mix completely. Polymictic lakes turn over more than twice in a year. These lakes typically are shallow and/or have a long fetch– the longest distance across the lake surface unimpeded by land over which the wind blows. Also, during mixing, holomictic lakes mix completely from top to bottom, and meromictic lakes only mix through part of the water column– the bottom layers never mix. The latter is rarer and occurs in very deep protected lakes or lakes with density differences due salinity.
14

Chemical Characteristics Water chemistry is an important indicator of a lake’s condition. Numerous materials are dissolved in lake water or suspended in the water column, and many more insoluble forms are associated with the lake sediment. Many are present in more than one form and can be transformed through chemical or biological processes into different forms. Concentrations of various elements provide information about biological processes, nutrient loading, contaminant input, trophic status, stratification, and many other variables. Among the most commonly sampled chemical characteristics are dissolved oxygen, nitrogen, and phosphorus. These are the three elements most important for biological processes. Other chemical variables also impact lake status and biological processes, but they will not be discussed here. Among the most important elements in a lake is dissolved oxygen. Needed for aerobic organism survival, oxygen concentration is often considered the most important indicator for lake health. Oxygen is produced by macrophytes and periphyton in the littoral zone and phytoplankton throughout the photic zone, but animals and aerobic microorganisms need it throughout the water column. For a lake to maintain health, there must be enough oxygen for the aerobic organisms and in the lower water layers of the lake, where much decomposition occurs. The amount of oxygen required depends on the amount of organic material that must be decomposed. Without sufficient oxygen, the hypolimnion may become anoxic (devoid of oxygen) during decomposition. As carbon dioxide continues to build up, anoxia will become more severe. Anoxic conditions near the sediment-water interface are normal and help regenerate important nutrients such as phosphorus. Byproducts of decomposition include carbon dioxide, methane, phosphorus, and ammonia– a form of nitrogen. During turnover, the dissolved products of decomposition are cycled into the upper water layers, and oxygen produced in the upper layers is cycled into the lower layers.
Lake Case: In a very unusual scenario, lake mixing actually resulted in hundreds of human deaths. In 1986, Lake Nyos in Cameroon suddenly mixed completely; the bottom layers of this meromictic lake had not mixed in many years. When the lake turned over, a cloud of gas released from the lake water swept through a nearby village killing hundreds of people and livestock. A geological investdetermined that the cause of death among the villagers was carbon dioxide suffocation. Later research determined that carbon dioxide had been leaking into the lower layers of the lake due to geological processes, and when the concentration got too high, it forced the lake to turn over thereby releasing a huge cloud of stored carbon dioxide. Ongoing research at the lake has resulted in the recent installation of a pumping device that gradually releases gases present in the bottom of the lake into the atmosphere.
igation
During summer stratification, a fairly common phenomenon is the metalimnetic oxygen maximum. This occurs when the surface waters are depleted of oxygen due to decreased solubility in the warm summer waters. Simultaneously, the hypolimnetic
15

waters are being depleted of oxygen during decomposition. Phytoplankton continue to produce oxygen, and as a result, the middle layers of the lake, the metalimnion, have the highest oxygen concentration. This layer may even be supersaturated due to increased primary production at the metalimnion border, with dissolved oxygen concentrations greater than 100%. Nitrogen is present in lakes in many forms, and its availability is essential for biological processes. It is the major component of air, but in the water, nitrogen must be converted through a process called biological fixation into one of several usable forms before being incorporated into the phytoplankton. The resulting ammonia (NH4) can be assimilated by some phytoplankton, especially blue green algae, and certain plants. Animals obtain their nitrogen by consuming plants or other organisms, both of which contain usable forms of nitrogen. Ammonia is also available as a waste product from aquatic organisms, and through a process called nitrification, it can be converted by bacteria, fungi, and primary producers into nitrite (NO2) or nitrate (NO3). Most of the nitrogen in the lake, therefore, is contained within the biological organisms. During decomposition of dead plants or animals, some nitrogen is made available again in the water column. The large store of nitrogen in the lower lake layers is recycled into the lake during turnover. Phosphorus is also required for biological processes. Phosphorus originates from rocks and soils, and although it is abundant on earth, it is usually the limiting nutrient in a lake system in the temperate United States (see below: phytoplankton). Dissolved phosphorus in the lake is first taken up by plants in the form of orthophosphate (PO4). It then moves through the food web as the organisms’ source of phosphorus. Phosphorus is recycled into the system through excretion and decomposition, and the rate of release and uptake governs the phosphorus cycle in a lake. Phosphorus is also recycled into the lake during turnover, but if it settles to the bottom and is buried by sediment before the lake turns over, it may be lost from the system. Phosphorus is dissolved, adsorbed, assimilated, and excreted rapidly, and the processes are complicated. For this reason, many limnologists measure total phosphorus to account for all of these forms.
Energy Cycling The biological community of the lake depends on the previously discussed physical and chemical processes for survival. Community composition is the species makeup of the entire biological community or a specific group of organisms. Community composition is determined by many interactive lake processes including nutrient availability, organism interactions, competition, predation, and outside pressures such as fishing or exotic species invasion. One way of quantifying community composition is by measuring diversity. Diversity, in effect, describes the number of different species within a community and the number of individuals within each species. Some communities may be dominated by only a few, common
16

Primary Producers (algae, phytoplankton, macrophytes)
Primary consumers/ herbivores (zooplankton and herbivorous fish)
Secondary consumers/ carnivores (predatory zooplankton, small fish)
Tertiary consumers/ carnivores (medium fish)
Top carnivores (large fish, birds, mammals)
Figure 2. Generalized food web design
organisms (low diversity), whereas others will have lower numbers of more species (high diversity). Another means of measuring biological material in a lake is biomass, the mass of all living material within the lake. Biomass is useful for calculating the location and movement of nutrients and other chemicals through the system. Nutrients are taken up by primary producers (organisms that make their own food, i.e. plants) and incorporated as biomass. These nutrients are then only available to other organisms through predation or death and decomposition, except for a limited amount made available in waste products. When organisms die, they start sinking to the bottom of the lake and decomposing. During decomposition, the decomposing organisms (e.g. bacteria and fungi), release the tied-up nutrients for uptake again by themselves and other aquatic organisms. Organism groups in the lake community comprise different trophic levels through which energy moves in a lake system. Trophic levels (“nutrition”/energy) are differentiated by functional similarities among populations. Primary producers convert sunlight, carbon dioxide, and water into usable energy and are therefore the lowest trophic level. Primary consumers are the organisms that feed on the primary producers, and secondary consumers feed on primary consumers. Within this simplified organization are organisms that feed on bacteria, detritus, and organisms within their trophic level. These relationships can be displayed in a trophic pyramid that represents the decrease in community size with higher trophic level (see diagram). The trophic pyramid is a highly simplified interpretation of very complex system trophic interactions. A more accurate interpretation is a food web consisting of overlapping and interacting trophic groups. Lakes are often classified in terms of their trophic status, which is related to the community trophic levels. Although different criteria are used to apply the terminology, a lake with high primary production, high densities of consumers, low dissolved oxygen
17

in the hypolimnion during late summer, and low water clarity is identified as a eutrophic lake. An oligotrophic lake has low nutrients, low primary productivity, low densities of consumers, and high dissolved oxygen throughout the year. Most lakes are not at one end of the scale or the other, but rather they fall between eutrophic and oligotrophic. Numerous systems of lake classification, which rely on different characteristics, have been developed to describe lake trophic status.
Biological Communities Phytoplankton, attached algae, and macrophytes compose the primary producer community in the lake. Attached algae may be present in the littoral zone clinging to sediment or clinging to rooted or floating plants, and generally, they rely on the same chemical resources as phytoplankton, although the sources may be different. Phytoplankton are microscopic plants that are at the mercy of lake currents. The abundance of phytoplankton in a lake varies widely, based on nutrient availability among other factors, but can be close to 1,000,000 individuals per liter during an algal bloom. Receiving their energy from sunlight, which drives photosynthesis, phytoplankton and other plants convert water and carbon dioxide into oxygen and carbohydrates– an energy source for consumers. This conversion is accomplished in the pigment chlorophyll a. This pigment is present in all photosynthetic organisms where it acts as the primary pigment for photosynthesis. The rate of conversion (primary productivity) depends on available nutrients and sunlight and temperature. Primary nutrients required by phytoplankton are nitrogen and phosphorus– and silica for a group of plankton called diatoms. Concentrations of nitrogen and phosphorus vary and can be low enough to limit primary productivity. That nutrient which is in lower abundance relative to the needs of the organism is called a limiting nutrient; phytoplankton production would increase if the limiting nutrient were added. During spring and fall turnover nutrients that have sunk to the lake bottom or that have become available due to decomposition are recycled into the water column. These nutrients are readily used by the phytoplankton and algae, and plankton blooms often result. Primary production rates and plankton biomass can increase dramatically. This bloom does not last, however, as the vast numbers of phytoplankton deplete the nutrients or are consumed by the growing community of zooplankton. Zooplankton, including both the primary and secondary consumers of the lake ecosystem, are microscopic animals that live and migrate through the water column. Like all plankton they tend to drift with the current. Many zooplankton in the limnetic zone will migrate to the surface at night. In addition to attached algae and phytoplankton, zooplankton will consume bacteria, protozoans, and other zooplankton that are also present in the lake. Community size and composition depend on the abundance and availability of algal or planktonic organisms in the lake, so if nutrients are limiting for the phytoplankton, food sources will subsequently be limited for the zooplankton. Shortly after a phytoplankton bloom, zooplankton community size also increases dramatically, and their grazing effect on the phytoplankton puts primary productivity rates in check. As phytoplankton biomass drops, zooplankton community
18

size subsequently decreases. Eventually, phytoplankton and zooplankton populations decrease and maintain a more stable community size. Benthic macroinvertebrates are some of the organisms living on or in the lake sediment that consume algae, bacteria, detritus (non-living organic matter, dissolved and particulate), and dead plant or animal material. The organisms classified as benthic macroinvertebrates are extremely diverse, so it is difficult to describe them as a group. Distribution is determined by sediment type and amount of dissolved oxygen available. Typically, distribution is extremely patchy, so obtaining a representative quantitative sample is difficult. Benthic macroinvertebrate communities tend to be more diverse in the littoral zone of the lake, and among the many represented taxonomic groups are aquatic worms, flatworms, crustaceans, mollusks, and aquatic insects. Benthic organisms in the limnetic zone of eutrophic lakes must be able to survive with limited oxygen available, so the community tends to be less diverse. As the lake becomes more productive, even fewer species survive in this environment. The phytoplankton community, therefore, impacts the benthic community through the availability of oxygen. Fish are one of the more obvious, and popular, inhabitants of the lake ecosystem. Among the strictly aquatic organisms, the top consumers are in the fish community. Within that community, however, are species that fit into the food web in many places. Some fish consume phytoplankton, others consume zooplankton, and others consume other fish or larval fish. The fish community can be very diverse, and it is affected by availability of food, as well as predation (by larger fish, ducks, etc.). Fish distribution can be measured and is often based on food availability, but because they are highly motile, fish occupy wide-ranging areas. Certain groups are associated with surface layers of the lake while others are categorized as bottom feeders. The lake ecosystem is a complex, interacting system of physical characteristics, chemical elements, and biological groups. Predicting these interactions is a nearly impossible task because of the subtle connections that can easily go undetected. Limnologists have uncovered many of the intricacies of the lake as a system, but still more information is unknown. Because the lake is not a separate basin, disconnected from its surrounding environment, the factors that influence it are extensive. The interconnectedness of a lake and a wide surrounding area make generalizations among many lakes impossible. Studying a particular lake periodically and monitoring changes throughout the seasons can establish a better understanding.
19

Chapter 4. Lake Parameters
Depth profiles for physical parameters One way to learn a great deal about a lake, without too much cost or effort, is by creating a depth profile. Depth profiles can include temperature, dissolved oxygen, pH, specific conductance, and turbidity measurements through the depth of the water column. Dissolved oxygen is one of the critical measurements in limnology that can be used as a quick indicator for many parameters in the lake system. Temperature, similarly, provides insight for what organisms may inhabit the lake based on thermal tolerance. Turbidity can indicate high volumes of plankton in the water column or high suspended sediments, which in turn affect the scatter of light. Specific conductance and pH both measure the amount of ions in the water, which has to do with buffering capacity and acidity. Each of these measurements gives some indication of the status of the lake, and the health of the ecosystem. By collecting the parameters along a depth gradient, you can obtain information about lake overturn or stratification, decomposition on the lake bottom, primary productivity, and acidity. Depth profiles are taken using electronic probes or a discrete depth water sampler. When using a water sampler, samples must be brought to the surface where the parameters are measured. The samples can be analyzed in the field using a handheld probe, pH paper, or a chemistry kit, or they may be brought to a laboratory for more sophisticated analysis. Again, some of the products used for these analyses are more accurate than others, and there is a wide range of costs. Taking the samples back to the laboratory may compromise sample integrity due to the time delay. Electronic probes have the advantage of measuring parameters in place, which provides for a more accurate and timely measurement. To obtain a depth profile for the lake, readings are taken at the water surface and then about one-meter intervals to the lake bottom. Results at each depth are recorded in a notebook or on an attached computer device. The variables measured in a depth profile change very rapidly, so frequent sampling is necessary. In order to characterize the lake’s extent of stratification and the changes within the water column, lake profiles should be taken at least once a month, and preferably more often. If other variables will be measured monthly, the lake profiles can be taken at the same time, but if possible, profiles should be collected more often. NECESSARY INSTRUMENTS Depth profiles can be taken using equipment with widely varied costs. Several companies have developed electronic probes and testing kits, so it is best to research the equipment by comparing cost vs. need for your monitoring program. Some of these probes measure one or two parameters; some probes can be used only at the surface; and some probes are only for use in the laboratory. Test kits are another option if you do not have electronic probes. These can be used for measuring many of the parameters for which probes are used. Another option is a multiprobe apparatus, which can measure numerous parameters simultaneously and can be lowered to the lake 20

bottom. This will increase your speed and efficiency, but it will also greatly increase your expense. The multiprobe sampler requires an attached cable and a handheld data display. Readings will have to be recorded in a notebook if the display does not have memory installed. After the type of equipment has been selected, you will need to acquire the related devices. If you are collecting samples from a discrete depth and then analyzing them at the surface or in the laboratory, you will first need a water sampling device. In addition to these physical parameters, the water sampling device can be used in many other tests. If samples will be taken to the laboratory, you will also need a container for each of the depths sampled. Every step of the procedure should be recorded, including time of sampling, number of samples, and subsample number (if applicable). Quality control checks should include careful equipment calibration following all procedures described in the instrument’s manual. From time to time, it may also be useful to check the instrument against other profiling instruments. By comparing instruments, both calibration techniques and instrument accuracy can be gauged. The solutions used in calibration should also be changed according to instructions and checked using another testing device periodically.
Figure 3. A multiprobe sonde lowered through the water column can analyze several variables simultaneously while being monitored from the lake surface.
21

Secchi disk The Secchi disk is one of the most widely used tools for water quality monitoring. A Secchi disk reading can provide information about water clarity from which characteristics such as turbidity and productivity can be inferred. The more phytoplankton or suspended sediment in a lake, the lower the Secchi disk reading. Because of the useful information it provides and the simplicity of use, the Secchi disk is used in many volunteer monitoring programs or in monitoring programs with small budgets. In coordination with other water quality measuring devices, the Secchi disk provides even more information about lake quality. The Secchi disk is a round, flat disk painted with alternating black and white quadrants that was developed in the 19th century by an Italian astronomer named Secchi. The disk is lowered into the water on the shady side of a boat, and at the point at which the disk is no longer visible, the depth is recorded. The disk is then raised until it becomes visible again, and that depth is also recorded. The average of these two depths is the Secchi depth. The range of Secchi depths is extraordinary. Eutrophic lakes may have Secchi depths of only 0-2 meters, and very clear, oligotrophic lakes may have Secchi depths closer to 20-30 meters. Secchi depth changes over the course of seasons within an individual lake with algal blooms, storm turbulence, and seasonal plankton fluctuations. Because of the low cost and ease of use, Secchi disk readings can be collected often. Whenever you might be out on the lake being monitored, you might as well take a Secchi reading. The information can be invaluable, and gathering readings over the course of seasons and change will be extremely useful in a monitoring program.
Deep Disks: Oceanographers often use a larger Secchi disk (50 cm instead 20 cm in diameter) that might be painted all white on one side. Because water clarity is so high, the disk may be 40 meters (130 feet) deep before it is no longer visible! The larger is easier to keep track of at such a distance
disk .
22

Water chemistry and chlorophyll a Water chemistry is likely the easiest means of examining a lake, particularly if you have a functional laboratory. Nutrient status and contaminant inputs can be determined using water chemistry. Adding biological analyses will make the monitoring program more robust, but with such an addition, the cost and effort increase significantly. The extent of chemical analysis also may vary with the specific goals of a monitoring program. For a lake that is experiencing rapid eutrophication, analyzing nutrients should be a high priority. A lake that may be at risk for agricultural impact should be sampled for pesticides, herbicides, and fertilizers. A lake experiencing aerial inputs of contaminants such as heavy metals and pesticides should be sampled for those chemicals. Sampling for the plant pigment chlorophyll a can also provide information about the nutrient status of a lake. Phytoplankton biomass can be estimated by filtering the phytoplankton and then extracting the chlorophyll a. High chlorophyll a results suggest an excess of nutrients, which may originate from anthropogenic inputs or natural eutrophication. With the right equipment, testing for chlorophyll a is a simple procedure, and it is commonly used in volunteer monitoring programs for lakes. Analysis requires special equipment, but sampling and preparation can be taught easily. NECESSARY INSTRUMENTS Water samples can be collected using any number of instruments or by simply reaching over the edge of the boat to fill a sample bottle. Instruments have been developed for sampling at discrete sampling depths or for collecting a composite sample representative of the entire water column. Instruments for collecting water from discrete depths include the Kemmerer sampler, Van Dorn sampler, and a simple weighted bottle with a cork. The Kemmerer and Van Dorn samplers are lowered to the specified sampling depth in an open position, and then a weighted messenger on the rope is released. This triggers the sampling device to close at that depth, and the sample can be brought to the surface. The differences among these devices are slight, but they are important for different kinds of water collections. The Kemmerer and VanDorn samplers function in essentially the same manner. Both are available in vertical orientation, and the Van Dorn is also available in a horizontal position. The weighted bottle, the simplest device, is simply lowered with a cork in place, and when the desired depth is reached, the cork is removed by tugging on an attached rope. Suitability for the situation and parameters being studied must be considered when choosing a sampling device. Water samples can also be collected automatically, if you are examining short-term temporal changes in an ecosystem. Automated samplers can be programmed to collect samples several times in an hour or every few hours. These devices must be used on a dock or other stable platform, so their use is somewhat restricted. Using automated samplers for chemical analysis has many advantages, but the bottles must be collected fairly often if the parameters being measured are likely to degrade over time.
23
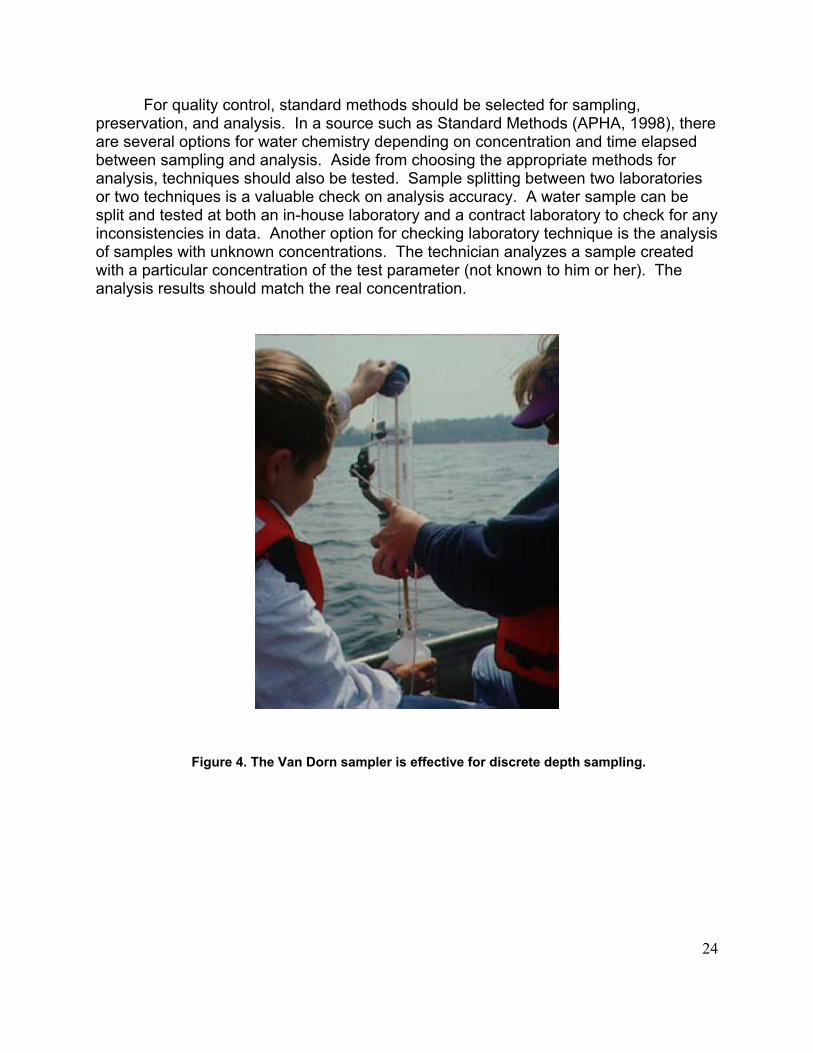
For quality control, standard methods should be selected for sampling, preservation, and analysis. In a source such as Standard Methods (APHA, 1998), there are several options for water chemistry depending on concentration and time elapsed between sampling and analysis. Aside from choosing the appropriate methods for analysis, techniques should also be tested. Sample splitting between two laboratories or two techniques is a valuable check on analysis accuracy. A water sample can be split and tested at both an in-house laboratory and a contract laboratory to check for any inconsistencies in data. Another option for checking laboratory technique is the analysis of samples with unknown concentrations. The technician analyzes a sample created with a particular concentration of the test parameter (not known to him or her). The analysis results should match the real concentration.
Figure 4. The Van Dorn sampler is effective for discrete depth sampling.
24
E. coli and other bacteria Bacteria are a significant part of the lake ecosystem. Thousands of different types of bacteria inhabit a lake at any time. Bacteria are the major portion of the decomposing community, so their presence is of utmost importance to nutrient recycling. Additionally, the bacteria community is a food source to some organisms in the lake. Some bacteria can be harmful to human health, so when a lake is used for recreation, it is typically sampled for E. coli bacteria. Although certain strains of E. coli are harmful to humans, most are harmless. E. coli are typically sampled as an indicator of the presence of more harmful pathogens. E. coli are abundant in the gastrointestinal tract of humans, other mammals, and birds where they perform functions essential to digestion. Other, harmful bacteria also inhabit these gastrointestinal tracts, so if E. coli are present in a lake, it is likely that they may also be present. Among the more harmful pathogens might be Salmonella, Shigella, Klebsiella, Pseudomonas, and Vibrio (APHA 1992). These can lead to illness ranging from minor to serious. E. coli contamination of a lake is more likely to occur where there is potential contaminant input from outside sources, such as leaking septic systems or increased sewage overflow. Mitigating factors include stream outfalls, beach use, rainfall, and wind direction, so it is difficult to predict contamination (Whitman et al. 1999). NECESSARY INSTRUMENTS Water samples for bacteria analysis should be collected using sterile technique. Because bacteria are present everywhere, it is important not to allow your sample to be contaminated by any bacteria other than the ones collected from the lake. The sample can be collected using a Whirl-Pak bag or a sterile bottle. The sample is collected and immediately placed on ice for transport to the laboratory. More equipment is required for the analysis portion of the procedure than the collection portion, and cost can be significant. Included among the necessary supplies are an incubator, autoclave, filtering apparatus, and vacuum pump. All of this equipment is required as part of the membrane filtration technique. Other methods that provide as specific results require significantly more funds.
25

Plankton Plankton sampling is a relatively simple procedure, but the results of a plankton tow can provide a great deal of information about a lake ecosystem. Both phytoplankton and zooplankton can be useful in lake assessment. Phytoplankton are effective indicators for nutrient status of the lake, and zooplankton are helpful for understanding predation and trophic interactions. Phytoplankton, as primary producers, absorb their energy from sunlight and dissolved nutrients in the water. The nutrient status of the lake, therefore, can often be determined by examining the organisms that use the nutrients. Phytoplankton community composition reflects the differing uptake and competition capabilities of individual species, and it varies based on the chemical composition of the water. Therefore, inferences can be made about changes in the lake’s nutrient status over time. Furthermore, some information can be gained about trophic interactions by examining these primary producers. Phytoplankton counts are also estimated in chlorophyll a analysis, which is used to approximate plankton biomass in the lake, but phytoplankton identification goes much further into community dynamics and provides far more information. In order to maximize the number of species collected, sampling should be conducted through the seasonal changes in the plankton community. Analyzing phytoplankton samples takes considerable time and expertise, however, so a taxonomist must be available for counting and identification. Sampling for phytoplankton should be conducted at least once a month. The phytoplankton community changes dramatically throughout the seasons due to fluctuations in nutrients, sunlight, and predation pressures. Some groups of phytoplankton may appear only briefly in the system during a season, and in order to characterize the entire community, all of these shorter-lived groups need to be represented. Monthly sampling is adequate, and more frequent sampling provides more information. Zooplankton are some of the primary and secondary consumers in the water column, and zooplankton communities are also a good predictive tool for determining the nutrient status of the lake. Zooplankton are also relatively easy to sample, but again, analysis takes a considerable amount of time and expertise. Frequency of zooplankton collection can vary among lake systems. In order to sample a representative group of the zooplankton, it is necessary to collect samples at least once a month. Because of the changes in nutrient status and the resulting changes in the phytoplankton community, there are also changes to the zooplankton community. To capture these seasonal changes, monthly sampling (at least) is necessary. NECESSARY INSTRUMENTS Plankton sampling can involve a single sampling regime for both phytoplankton and zooplankton, or the two can be collected separately for more accurate phytoplankton sampling. Several methods have been developed, so depending on the goals of sampling, different techniques will be used. Because of the great size
26

difference between the phytoplankton and zooplankton, some methods are more effective for only one group. If a plankton sample is needed from a discrete depth, a sampler can be lowered in an open position and then triggered to close once it has reached the desired depth. With this sampling regime, a limited amount of water is included in the plankton sample. Samplers of this type include the Kemmerer sampler, Van Dorn sampler, and the Juday trap. When the Juday sampler is brought to the surface, water drains out of the instrument through an attached mesh plankton net. This technique is not useful for collecting smaller phytoplankton (nanoplankton). For collecting nanoplankton from a discrete depth, a Kemmerer or Van Dorn sampler can be used. Water brought to the surface must be filtered through a separate plankton net or brought to the laboratory for microfiltration or plankton settling. Sampling for nanoplankton is limited by the volume of water that can be collected, which is typically only a few liters. Another collection method is the plankton net. A plankton net can be used for discrete depth sampling or for a plankton tow. In order to sample from a discrete depth, the sample is collected using another device and then poured through the plankton net. This can take a significant amount of time if a large volume of water must be filtered. Using a plankton net for towing will allow sampling a much larger volume of water; the net can be lowered to the bottom of the lake for a vertical tow or towed behind a boat for a horizontal tow. The amount of suspended material in the lake will determine the maximum towing distance. Again, this technique typically underrepresents the nanoplankton because they pass through the large mesh size of the net, and decreasing mesh size will cause the net to clog sooner. If the net clogs, your sample will be compromised because you will not be able to calculate the correct volume of water that has passed through the net. Special nets such as the Wisconsin plankton net and nets with longer lengths are designed to reduce this common sampling error. An improvement on the typical plankton net is the Clarke-Bumpus metering plankton net. The flow meter attached to the opening of the net can determine the actual water volume passing through the net. In addition to collecting multiple samples, quality control procedures should include taxonomic confirmations of species identifications by experts. Although plankton identifications can be learned using taxonomic keys and guidelines for methods, it is necessary to consult experts who have likely spent years doing taxonomic identifications.
27

Figure 5. The cone section at the top of a Wisconsin net eliminates some of the water pressure caused by pulling the net through water and makes for a more accurate sample collection.
28

Benthic macroinvertebrates and sediment chemistry Benthic organisms are also a good indicator of lake conditions. Benthic biomass and community composition are both important components of lake monitoring. The quality of life at the sediment surface can indicate the amount of detrital material and therefore dissolved oxygen in the water. Also, the benthic community may provide insight into communities at other trophic levels in the ecosystem. Organism distribution can be patchy in lakes, and therefore, collecting limnetic and littoral samples will help to maximize the types of organisms collected from a particular lake. Unlike the plankton communities, however, the benthic macroinvertebrate community does not undergo dramatic seasonal changes. Sampling can be limited to once a year, if there are constraints to a monitoring program, although ideally, there will be more frequent sampling. Sediment chemistry can provide information about pollution that has accumulated in the lake over time. Because most material eventually reaches the lake bottom over time, the sediments contain many compounds that have entered the system. Many organisms or chemical compounds are broken down through biodegradation and decomposition, but many heavy metals, pesticides, and organic and inorganic pollutants remain intact in the sediment. Sediment chemistry changes very slowly, particularly heavy metals and pesticides, so sampling does not need to take place even every year. Analysis can be very expensive also, so sampling every five years is appropriate. NECESSARY INSTRUMENTS In order to collect benthic samples from the lake surface, a number of instruments have been developed that differ in technique and effectiveness. The sampling device is typically deployed in an open position, lowered to the sediment surface, and then triggered to snap shut– thereby grabbing a sediment sample. The instrument is then raised to the surface and emptied into a bucket or a bucket fitted with a screen bottom for benthic macroinvertebrates or a sample jar for sediment chemistry. To retain macrobenthos, sediment is filtered through a sieve until only benthic macroinvertebrates and the larger sediment particles remain. Various instruments have been developed to sample benthic macroinvertebrates, and each varies in its applicability. Common benthic samplers include the Ekman, ponar, and Petersen samplers. One of the common complaints about the Petersen sampler is sediment surface displacement. Because the sampler is very heavy with a heavy top, water is forced into the sediment during instrument deployment. This displacement can affect the quality of the sample by dispersing the organisms on the sediment surface. To correct this problem, an Ekman dredge may be used, which allows water to flow through the instrument rather than pushing it into the sediment. Sampling devices for benthic macroinvertebrates can also be chosen to alter the surface area or depth of the sample. In order to increase either of these parameters, the weight of the sampling device must be increased significantly. A heavier sampling device, such as the ponar sampler, will allow collection of a deeper sample. Sampling
29

in larger or harder sediments often requires the heft of a ponar sampler to penetrate the benthos. Ponar sampling is often the best choice for sandy substrates. This can limit sampling ability as it may require a large boat and/or a winch. Another option for sampling sediment is a core sampler. With a core sample, parameters can be measured along a depth gradient. Because benthic macroinvertebrates typically live within the top few centimeters of the sediment surface, this device is not as useful for biological sampling. For sediment chemistry, a core can be very useful in many analyses, and for paleolimnology, core sampling is required. Most of these common samplers come in different sizes to increase maneuverability or sampling area as needed. In addition to collecting multiple samples, quality control procedures should include taxonomic confirmations of benthic macroinvertebrates by experts. Although benthic macroinvertebrate identifications can be learned using taxonomic keys and guidelines for methods, it is necessary to consult experts who have likely spent years doing taxonomic identifications. Sediment chemistry quality control is similar to the techniques used for water chemistry. Namely, samples can be split between two laboratories or analysts. Known concentrations can be provided to technicians who do not know the sample’s concentration. The results received from the technicians can then be compared to the actual concentration. Additionally, multiple sediment samples can be collected for analyses.
Figure 6. The ponar grab (left) is useful for rocky or gravel bottoms, but it can be quite heavy to pull up by hand. The Ekman dredge (right) is a lighter alternative that is widely used.
30

Figure 7. Depending on the quality of the sediment you are collecting, sieving can take a lot of time and energy! Sand and gravel sediment are easy to sieve, but sediment rich in organics and debris will take a lot more time.
31
32
Fishes Fish can be excellent indicators of lake health. Fish community size and composition often reflects nutrient status or other lake health. In addition, fish have a direct effect on other trophic groups, including phytoplankton and zooplankton. Measuring the fish community can be problematic because often lakes are stocked with fish desirable to sport fishermen. This can have a detrimental effect on the native fish community, as they must compete for resources with the new inhabitants. In some cases, the introduced fish have been in the lake for such a long time that their origin is unknown. For this reason, historical records should be sought regarding the fish species present in the lake, particularly in heavily fished lakes. NECESSARY INSTRUMENTS Sampling fish can take a considerable amount of time in the field. Because of the size and volume of fish collections, it is best to identify them in the field upon collection and then return them to the water immediately. Depending on characteristics of the lake, location of fish sampling may be important and may require a number of sampling techniques. Although stream sampling can be relatively straightforward due to the minimal stream width, it can be difficult to choose an area in the lake in which to collect a sample representative of the fish community. A number of different types of nets can be used depending on lake depth, present species, and accessibility. Some of the possible techniques for netting fish include hoop nets or fyke nets for sampling in inlet areas; gill nets for sampling large areas of the lake and at different depths; and seines for use in wadeable areas. Other options include electroshocking, where a current sent through the water temporarily disables fish so they can be collected, measured, and counted. The fish are then returned to the water where they revive. Finally, the fish in a contained area may be poisoned for collection and counting. This is often used to remove undesirable fish in preparation for stocking sport fish, but the technique poisons invertebrates and other fish as well.

Table 1. Sampling Equipment Matrix
Sampling Device
Use Advantages Disadvantages Ease (1-5) Time (1-5) Cost (1-5)
Laboratory analysis for physical and chemical characteristics
depth profile; surface measurement
lower cost; can re-analyze any questionable results
not as accurate when samples are not measure in situ
1-5 5 2
Single probes measuring on surface
grab samples, samples brought up from discrete depths
accurate; relatively reliable not as accurate when samples are not measured in situ
1 4
Single probes deployed at surface and discrete depths
depth profile; surface measurements
accurate; reliable; easy to use require some maintenance; need several probes
1 3 4
Multiprobe apparatus depth profile; surface measurements
accurate, fast, collects several variable simultaneously
expensive, considerable maintenance 2 1 5
Weighted bottle with cork discrete depth water sampling
easy to use; readily available materials
not for dissolved oxygen 1 1 1
Kemmerer discrete depth water sampling
sturdy, rarely fails to trip due to vertical orientation
somewhat unwieldy 1 2 3
VanDorn discrete depth water sampling
sampler in horizontal orientation allows assured discrete depth sampling
easy to set incorrectly; more likely to misfire; horizontal likely to disturb water layers
2 2 3
Juday plankton trap discrete depth plankton sampling
samples known volume at known depth; nano- and larger plankton
limited volume of water filtered due to built-in filtration device
2 3 4
Plankton net net plankton can filter large volume of water, plankton tow
water displacement by net does not allow accurate measure of volume; numbers of smaller plankton not consistent
1 3 3
Wisconsin net net plankton towed through large volumes of water; plankton concentrated in bucket; little water displacement
numbers of smaller plankton not consistent
1 3 3
Metered plankton net net plankton calculates the volume of water through which the plankton net is pulled during plankton tow
precise depths difficult to sample 2 3 4
Ekman grab benthos minimal sediment displacement; sample intact
not useful in harder of rockier sediments; will not work if hard materials get caught in jaws
3 4 3
Ponar grab benthos good for hard/rocky sediments; unlikely to fail due to interference
very heavy; surface sediment displacement considerable
4 4 3
Petersen grab benthos good for rocky.hard sediments; unlikely to fail due to interference
very heavy; surface sediment displacement great
4 4 3
33

Chapter 5. Pre-sampling Decisions
Selecting a fixed Sampling Site Selecting a site for sampling can be a complicated decision. If you will only be sampling at a limited number of sites, however, you want to make sure the sites are representative of the lake in terms of what you are examining. The goals of the monitoring program are critical in choosing the sampling site. Determine what part of the lake would be the best indicator for the variables you’re testing. Accessibility is another aspect of site selection but should not be the primary criteria. The site must be easily accessed based on the sampling equipment available. If no boat is available, sampling may take place off a dock or other fixed structure or from shore, and only the littoral zone will be included in the monitoring regime. In these cases, it will be necessary to avoid areas of dense vegetation when using a plankton net or rocky sediments when collecting benthic grabs. Biological parameters best sampled in the littoral zone include benthic macroinvertebrates and macrophytes. If there is access to a boat, there is some more flexibility for sampling location. The limnetic zone can be sampled in place of or in addition to the littoral zone. A site may be selected in the deepest part of the lake, in a location previously sampled, or at a site randomly selected. Ideally, the number of sites sampled within a lake zone will be replicated in order to make analysis more effective. Because lakes will be subject to different threats, site selection will depend on your monitoring goal. If there is a potential point-source input, sampling should be done near that area. Ask some questions about the sampling goals in order to choose an appropriate sampling site (See pseudoreplication in previous chapter).
• How will the site be accessed? • What parameters will be sampled? • Where will the most representative samples be collected? • Is there a potential point source input? • What are the obstacles to sampling? • What future changes (in the season or in another year) may alter this site?
34
Pre-sampling list • Decide what parameters will be measured • Set up contracts for chemical and biological analyses • Make sure boat is ready for use • Select sampling site(s) in the lake • Plan transportation needed for travel to and from site • Make sure shipping arrangements are ready • Set up laboratory for analyzing chemistry samples • Make storage plans for biological samples • Have freezer space available for chlorophyll samples
Making Preparations Preparation for field sampling will take quite a bit of time until the practice becomes standard. If you are contracting with a laboratory for any of your analyses, arrangements must begin well in advance of sample collection. If you are analyzing samples in-house, the laboratory has to be ready for chemical analyses and solutions must be available for biological preservation. Gathering equipment and calibrating instruments are the short-term preparations that will be accomplished the day before sampling. Be certain to leave enough time to finish all of your preparations so that you do not have to rush to complete many last-minute details. Contract vs. In-house Laboratory Analysis Before actually doing any field sampling, the fate of the collected samples must be decided. Many of the parameters for which you will be sampling need to be analyzed as soon as possible after being removed from the lake. For this reason, a detailed plan for handling and analyzing samples must be in place well in advance of sampling. CHEMISTRY If a contract laboratory will be used for any of the chemistry analyses, arrangements for packaging, shipping, and paying for analysis will have to be made. There are numerous analytical laboratories that can be contacted, and prices will depend on the particular analyses. It is likely that many use the same techniques of analysis, but sometimes that is not the case. It is best to research the analysis methods in order to make an informed decision about your samples. Other issues that might be important in your sample analysis include equipment, turnaround time, prices, and data delivery. There are certainly some advantages to contracting samples to an outside laboratory. Because sample analysis is their business, trained professionals who do the analysis have likely analyzed thousands of samples. Quality control procedures are already in place in a contract laboratory. The laboratory already owns very expensive analytical equipment that is regularly calibrated and serviced. However, because the samples are sent to them, samples will be processed on their time schedule. Furthermore, analyzing samples at a contract laboratory tends to be quite expensive. If samples will be analyzed in-house, pre-arrangements will include the purchase of supplies and the calibration of equipment. Again, some of the samples will need to be analyzed soon after sample collection, so it is best to have everything ready before collecting samples. Committing to analyzing samples in-house involves a significant
35

investment of time and money, so advantages and disadvantages should be weighed carefully. The cost for in-house analysis is significantly cheaper once a working laboratory is in place. However, to build a working laboratory requires laboratory space, chemical storage and disposal facilities, safety materials, and some expensive laboratory equipment (spectrophotometer, fluorometer, etc.). Additionally, there is the cost of training personnel, buying supplies, and maintaining equipment calibration. A system of quality control must be established. If these costs can be overcome, some of the advantages of in-house analysis are clearer: control over time of analysis and familiarity with analyzing personnel. BIOLOGICAL ANALYSIS Analysis of biological samples is less time-sensitive because the organisms can be preserved indefinitely. Analyzing any biological group, however, requires expertise. If there is not an available technician in-house, training someone to proficiency will take several months. Even so, taxonomic identifications will have to be confirmed by an outside expert. Additionally, biological identifications require expensive microscopes, and purchase might not be feasible if they are not already owned. Samples can also be contracted to an outside laboratory where there are taxonomic experts. This can be quite expensive, and again, time schedule may be longer than hoped. Outside contractors own the expensive equipment and have a network of experts with which to consult. Important items to confirm with contractors include preferred preservation method, specificity of identification, data delivery, and timetable for analysis. Data quality is the foremost issue to consider when deciding on analysis protocol. In order to get reliable data, what type of analysis must be done? If reliability of either an in-house or contract laboratory is questionable, do not use it. The time and resources spent on a monitoring project are too great to compromise it all by amassing poor-quality data. In all, unreliable data is worse than having no data. Preservatives Samples should be preserved as soon as possible after sampling in order to avoid breakdown in chemistry samples and predation in biological samples, so it is important to have the necessary chemicals prepared. Water or sediment chemistry samples may need preservatives added either in the field or upon return to the laboratory, depending what parameters will be analyzed. Biological samples should be preserved as soon as possible after collection to eliminate predation within the sample. Chlorophyll filters will need to be frozen immediately to prevent pigment degradation. If the chemicals have already been made, it is important to make certain you have enough to preserve the number of samples you will collect. Choice of preservatives may be decided based on a number of factors, including what’s available in the laboratory, a contract laboratory’s criteria, or shipping regulations. For plankton samples, common preservatives include Lugol’s solution or
36

buffered formalin. In addition to preserving the sample, Lugol’s solution dyes the organisms and is preferable for the technician during identifications. Because Lugol’s is not as strong a preservative and has a tendency to evaporate, additional drops have to be added from time to time between collection and identification. Any samples preserved with Lugol’s solution should be stored in a cool, dark place to slow degradation. Once the plankton have been processed, ethanol or formalin should be used to preserve them permanently. Benthic macroinvertebrate samples may be preserved in formalin or in ethanol. Staining can be done just before identifications. Fish samples will need to be fixed initially with formalin, but after fixing, they can then be placed in ethanol for long-term storage. Shipping formaldehyde can be problematic, so if samples must be transported between laboratories, ethanol and Lugol’s may be better choices for preservatives.
Considerations for preservatives • Length of storage time before analysis (especially for Lugol’s) • Shipping regulations • Available, proper storage facilities
Keep safety issues in mind when using preservatives. Lugol’s solution contains iodine and a small amount of glacial acetic acid. Although the amount of acid is probably not enough to hurt your skin, if rinsed off, it may damage clothing. Iodine will stain hands temporarily and clothing. Skin exposure to ethanol and formalin should be minimized or avoided completely. Exposure to formalin, ethanol, and Lugol’s fumes should be avoided. Be particularly careful when handling formalin; this is likely the most dangerous of the preservatives. The participating laboratories will likely handle any preservatives used for chemistry analyses. Sample bottles sent to you often already contain the acids necessary for preserving specific samples. Nitric acid and sulfuric acid are dangerous, and skin contact should be avoided completely. If you will be analyzing chemistry samples in-house, you will not need to preserve the samples between collection and analysis if analysis will be conducted on the same day. Electronic equipment Electronic instruments to be used during sampling will need to be calibrated. Dissolved oxygen probes must be calibrated every time before sampling, and the membrane must be changed periodically. Your pH probes will also need calibration before fieldwork. Conductivity probes require less frequent calibration. Chemicals are
37

needed for the pH and conductivity calibrations, so time for obtaining the chemicals and working with the instruments should be factored into your sampling schedule.
38

Gathering field equipment It is an excellent idea to assemble a field equipment list that can be used every time you go out field sampling. Inevitably, some item will be left behind because it is not in plain view, and typically, it is a critical item, such as an anchor or plankton net! This sampling list can be posted and checked each time you go out in the field. The following example list includes equipment for sampling numerous chemical and biological parameters, so you may want to highlight the parameters you will be sampling and gather the appropriate equipment listed. Materials listed represent necessary equipment for preferred techniques. If you have not been out sampling in a while, your boat, if you are using one, may need some attention. Be sure that you have all of the boat equipment necessary for safe operation and that the boat will function reliably and safely throughout sampling. Personal flotation devices are a must.
39

Example: Field Equipment List □□ General Items: data sheets and pen/pencil thermometer for air temperature Secchi disk on marked line GPS depth finder laboratory tape permanent marker ice packs and cooler extra distilled water extra battery for depth finder □ Depth Profiles: probes, single or multiprobe cable □ Water Chemistry: water sampler on marked line clean bottles or lab bottles □ Phytoplankton: water sampler on marked line plastic small mouth 1 L bottles Lugol’s solution w/eyedropper □ Chlorophyll a: water sampler on marked line
2 L bottle (if filtering on shore) graduated cylinder tweezers filters—0.45-0.8 �m filtering apparatus hand pump aluminum foil small vials for filter storage
□ Zooplankton: plankton net on marked line spray bottle
squeeze bottle (with filtered water)
plastic sample jars (Lugol’s solution w/eyedropper) Alka-Seltzer tablets small container for narcotizing □ Benthic macroinvertebrates: sediment sampler wash bucket with sieve
simple wash container to rinse sieve (bucket or bowl) plastic wide-mouth sample bottles
(alcohol) □ Sediment Chemistry: sediment sampler teflon pan teflon ladle clean bottles or lab bottles
paper towel (for wiping sediment jars)
□ Boat and Safety: anchor, rope paddles/oars PFDs (life vests)
decontaminating salt solution canoe straps for car phone/radio first aid kit drinking water sunscreen rain gear
40

Labeling samples Once you have gathered all of the sampling bottles and vials you will use, everything should be labeled. Some information will have to be recorded in the field once the sample has been collected, but there is a lot of information that can be included on the label before sampling. Labeling samples correctly is an important part of your sampling program. Information that is necessary on every sample collected is included below; some items may not apply to your sampling regime:
Lake Name Date/Time of collection Site Name/Location Site Depth
Grab/Composite sample (water or sediment chemistry) Tow Length (zooplankton) Volume Water Filtered (chlorophyll a) Littoral/Limnetic site
Replicate number or letter (1 of 3, etc.) Preservatives (if any) Sampler’s name
Although it may seem excessive to label each sample with all of the information, it is absolutely necessary to maintain the monitoring program’s integrity. One bottle can be easily misplaced, and without proper documentation, the sample will be lost. Furthermore, safety rules for storage require adequate labeling, and it is likely that different people will be processing the samples and working on the monitoring program in the future.
Pre-sampling list • Prepare chemicals for probe calibration • Prepare preservatives for biological samples • Calibrate all electronic equipment • Gather field equipment • Label sample bottles
41

Chapter 6. Field Sampling
Sampling Order In order to collect samples that exemplify the lake system that you are studying, it is best to collect those samples least likely to disturb the system first. In other words, collect water samples before sediment samples. Ideally, water chemistry samples will be collected first followed by plankton and chlorophyll a and then benthic macroinvertebrates and sediment chemistry. When benthic macroinvertebrate samples are collected, they must be sieved at the lake surface in order to remove excess sediment. This process clouds the water considerably, and although the sediment dissipates relatively quickly, some silts and clays remain in the water column that could potentially interfere with water samples. Sampling benthic macroinvertebrates is also the most labor-intensive of the described procedures, so doing this sampling last will allow as much time as is needed. A suggested sampling order follows: 1. Physical Parameters: • field notebook • GPS • weather • Secchi disk • depth profiles
2. Water Samples: • water chemistry • phytoplankton • chlorophyll • zooplankton
3. Sediment Samples: • sediment chemistry • benthic macroinvertebrates
When doing field sampling, any unusual sights or occurrences should be documented in your field notebook. It is best to stay aware of changes in the lake and surrounding area. This requires observing the water and surrounding vegetation among other things. Some signs may indicate significant changes to the lake ecosystem.
Noticeable changes to the lake ecosystem • Change in aquatic vegetation • High number of dead fish • Sulfur odor • Change in lake color (pea green) • Excess material in plankton tows • Differences in appearance of littoral bottom • Increase or decrease in number of clams/mussels • Change in bird life
42

Field notebooks One of the most important records of conditions on the sampling day is your field notebook. Weather and lake conditions can be very important in drawing conclusions about water chemistry and biology. It is not possible to recall specific conditions or occurrences when the data are reviewed later, so take some time to fill out your field notebook. There is plenty of writing space, so write as much as you want. Anything that strikes you including water appearance, weather conditions, vegetation, or wildlife should be recorded in the notebook. Weather-proof paper can be useful, especially during rainy sampling. If you are using weather-proof paper, be sure to use a #2 pencil or permanent ink.
Date 08/09/00 Time 13:40
Lake name Lake Michigan
Site Limnetic Analysts Smith and Jones
Temperature 320C Wind Speed & Direction 5-7 SW
Skies and other conditions Sunny and hazy, light breeze;
quite humid; visibility moderate; cirrus clouds
Weather history: Sunny/ hot several days; thunderstorms last night
Site depth 6m Shoreward distance 100m
Secchi depth (m) 3.4 GPS N 420 30' 27" W 860 55' 48"
Chlorophyll filtered 1800 ml Other observations: much suspended sediment in water column;
many people on the beach; several recreational boats, jetskis, and
swimmers in the water; water temperature relatively warm; many
seagulls down the beach from people; choppy water nearshore,
calmer open water
* plankton net hit bottom; we took another sample (labeled B2) * sediment chemistry sample was a composite of three subsamples--one of which was taken from only the top 2 inches of sediment
43

GPS If a Global Positioning System (GPS) is available, locating a fixed sampling site will be an easier task. Either a fixed site or randomly selected sites can be located using GPS coordinates. Alternatively, a site can be located by triangulation; fixed sites can be marked with a post, buoy, or other device. If permanent markers or posts are not permitted, GPS or triangulation are easy solutions. Site coordinates can be stored in the device memory or written down for later recall. ☼ Weather ☼ Once the sampling site has been located, weather and other physical parameters should be recorded. Weather data should include current temperature and conditions, wind speed and direction, cloud cover, amount of precipitation in the last 24 hours, general weather history, and any further effects of weather on the sample lake. Other observations might include activities around the study site (human or wildlife), water color, plant growth, water level, or any visible changes since the lake was last sampled.
Secchi disk The Secchi disk is a simple device used for measuring water clarity. Its use is standard in limnology, and Secchi depth is universally accepted and understood in lake analysis. The flat disk has a black and white checkered pattern that makes it very visible in the water. Equipment Secchi disk on marked line (mark every one meter) Procedure ◘ Lower disk into the water on the shaded side of the boat while keeping a firm grip on the line. ◘ As the disk is lowered, count the number of depth marks on the line. ◘ Keep lowering the disk until it is no longer visible; record the depth according the line marks. ◘ Slowly raise the disk, and when it appears again, record the depth. ◘ The average of these two depths is the Secchi depth.
44

Depth Profiles Depth profiles or surface readings using electronic instruments should also be taken early in the sampling regime. Instruments often need time to warm up, so be certain that the calibrated instruments have been given enough time before using them. If you are using a multiprobe sonde for your depth profile, the data may be stored in memory for later recall. Equipment dissolved oxygen probe pH probe specific conductivity probe (or multiprobe sonde with cable and hand-held digital display) Procedure
• Place the probe just below the water surface while keeping a firm grip on the line. • When the readout stabilizes, record the reading. • Lower the probe one meter, allow the readout to stabilize, and record the next
reading • Repeat until the probe hits the lake bottom
Profile Tip: When using an electronic probe, you can tell when the instrument has hit bottom by watching the readout. When the probes touch the sediment, the readings may fluctuate wildly. Alternatively, they may plummet or rise very rapidly.
45

Water Chemistry
Water samples for chemical analysis also should be free of inadvertent suspended sediments because they may be tested for turbidity and/or suspended solids. Water samples should be collected in acid-washed bottles or in laboratory-prepared bottles. If the bottles you are using do not contain an acid preservative, you may want to rinse them out in the lake before filling since old rinse water or other clinging materials might be present. Water samples can be taken from near the surface or the bottom or any depth between; they can also be a composite of several water depths. Depth of sampling should be dictated by the specific monitoring objective. It is important that water samples are collected below the water surface so as to avoid materials adhered to the water surface. If you are taking grab samples for water chemistry using bottles that contain acid, DO NOT dip these bottles into the lake. Use a separate bottle that does not contain acid and fill the acid bottles with that. Be careful not to overfill the bottles because the water-acid solution will overflow and may injure your hands. EQUIPMENT water sampler with line (for discrete depth samples) sampling bottles cooler and ice packs PROCEDURE Surface grab sample for bottle without preservative
• rinse bottle with lake water before collecting sample • firmly grasp bottle in hand • thrust inverted bottle beneath water surface • turn bottle right-side-up below the surface to fill, avoiding contact between hand
and sample water • cap bottle and place in cooler immediately
�� if bottle contains preservative, use another bottle to collect the sample and then pour it into preservative bottle ��
Comment: Whenever you are mixing an acid solution, it is critical that you add the acid to water and not vice versa. Adding water to an acid can cause a violereaction. In this situation, however, the amount of acid in the laboratory bottles is only a few milliliters. The large amount of water being added, in comparison, is enough to cool the heat reaction that takes place.
nt
46

Discrete depth sample using water sampler
• set sampler in open position; do not touch inside of sampler • lower sampler to desired depth keeping a firm grasp on the line and the attached
messenger (weight) • when sampler has reached depth, release the messenger to trigger the sampler
shut • raise sampler to surface and make certain seals are closed tightly • open air valve to allow water flow • (bottles without preservative) pour a small amount of water into bottle, rinse, and
discard • fill bottle with sample water • cap bottle and place in cooler immediately
47

Chlorophyll a Chlorophyll a is collected using the same techniques as for water chemistry samples. Grab samples or discrete depth samples can be collected. Again, these samples may be analyzed by a contract laboratory or an on-site laboratory. For chlorophyll a analysis, water can be filtered in the field or in the laboratory. The procedure is simple, and by filtering the water immediately after collection, pigment degradation is stopped. EQUIPMENT
sample bottles (if filtering at laboratory or sending to contract laboratory) filtering apparatus (at right)
Lid
CupWhite Support Plate
Flask
CollarPump Port
graduated cylinder tweezers filters hand pump aluminum foil small vials for filter storage cooler and ice packs PROCEDURE Surface grab sample
• firmly grasp bottle in hand • thrust inverted bottle beneath water surface • turn bottle right-side-up below the surface to fill • cap bottle immediately and place in cooler OR filter the sample immediately
Sample using water sampler
• set sampler in open position; do not touch the inside of the sampler • lower sampler to desired depth keeping a firm grasp on the line and the attached
messenger (weight) • when sampler has reached depth, release the messenger to trigger the sampler
shut • raise sampler to surface and make certain seals are closed tightly • open air valve to allow water flow • pour a small amount of water into bottle, rinse, and discard • fill bottle with sample water, cap, and place in cooler OR filter sample water
48 immediately

Filtering equipment set-up
• attach clear rubber caps to ports; leave one port open for aeration and attach handpump to one port on side of flask
• place one o-ring under the support plate and one on the cup; these are essential for correct operation of the filtering apparatus
Filtering
��keep sample and filter out of direct sunlight as much as possible during filtering ��
• set up filtering apparatus without filter and flush with 25 ml of filtered or deionized water
• using tweezers, place one filter on the support plate and screw cup into place without tearing the filter; DO NOT USE THE PAPER DIVIDER BETWEEN FILTERS
• rinse graduated cylinder with small amount of sample water and then measure a known quantity of your sample
• squeeze the hand pump to create slight pressure and then pour sample into cup • squeeze the pump periodically to maintain the pressure; do not exceed
recommended pressure for apparatus; make sure there is either an open port or the lid is on loosely to allow aeration
�� If flask fills and you need to continue filtering: release pump pressure; carefully remove cup and support plate by unscrewing the white collar, empty the flask— you do not need this water— reassemble, and continue filtering ��
• continue filtering until filter is clogged, filter is green, or 2000 ml of sample have been filtered
• release pump pressure; unscrew the collar to remove cup from the flask • using tweezers, fold the filter in half as it rests on the support plate (do not touch
the filtrate area); fold in half again and place filter on small piece of aluminum foil • fold the foil several times to enclose the filter • label foil and vial with lake name, site, date, time, and volume of water filtered • store vial on ice until return to lab; then store in freezer • rinse cup and support plate with filtered or distilled water
49

E. coli Measuring E. coli can be an important part of a lake monitoring program, particularly if the lake is used for recreational activities (i.e. swimming, canoeing, etc.). High E. coli concentrations in a lake can lead to minor to serious illness in those who come into contact with the water. Those most affected are small children who are more likely to ingest the water. Sampling E. coli is not difficult, but because the samples must be processed within six hours of sampling, a working laboratory is needed on-site or nearby. Sample processing does not take long, but the incubation time required before results are ready is close to 24 hours. Equipment Whirl-Pak bags (16 oz. Pre-sterilized) OR other container that meets the following criteria:
able to contain 100 ml sample chemical and residue free sterilized by autoclave at 121 0C (15 lbs. Pressure) for 15 minutes contain sodium thiosulfate if it may contain chlorine
Procedure Choose sample site by avoiding the “swash zone” (the area of low wave/ nearshore
water) Collect sample where water depth is at least one meter deep and take sample at mid-
depth When at site, open whirl-pak or other container being careful not to touch the interior of
the container Sweep the container down through the water in a U-shaped motion to elbow depth and
then turn upright to fill; avoid contact between hands and water sample Immediately close container tightly and put sample on ice
Bacteria Tips: Avoid contact between sediment and container. Try to avoid kicking up the sediment while sampling Clean hands with antiseptic between samples
Technique adapted from Indiana Interagency Task Force on E. coli, Standard Operating Procedure for Recreational Water Collection and Analysis of E.coli on Streams, Rivers, Lakes and Wastewater, March 1999.
50

Plankton tow Plankton tows are generally used for collecting zooplankton with a plankton net. Most of the phytoplankton are filtered through the large openings in the mesh. Plankton tow lengths are limited by the amount of suspended material in a lake because the mesh net will get clogged. In a lake that is full of algae or sediment, the net will be clogged far sooner than in an oligotrophic lake. Determining clogging effects may take some preliminary exploration or experience at a particular lake. Equipment plankton net spray bottle squeeze bottle (filled with clean–filtered, distilled, etc.– water) plastic wide-mouthed bottles with plastic lids Alka Seltzer tablets small container for narcotizing extra distilled water preservative Procedure Vertical tow
• while keeping a firm grasp on the line, slowly lower the plankton net to within 1 meter of the lake’s bottom; the weight of the bucket should pull the net down at a constant rate
• retrieve the net using a gentle hand-over-hand motion (approximately 0.5 to 1 meter per second) while raising vertically
• at the surface, gently lower and raise the net in the water to rinse down the sides without allowing water through the top
• holding the net above the water, use the spray bottle full of lake water or “clean” water to rinse down the OUTSIDE of the net
• rest the sample bucket in the plastic container containing Alka Seltzer solution; remove the net
• leave the bucket in the solution for about one minute to narcotize the organisms • rinse the inside of the bucket and the “screened” areas into the container with the
squeeze bottle full of filtered lake water, distilled water, or tap water (not regular lake water)
• add preservative; mix gently • Lugol’s* should be added until the sample is the color of weak tea, ethanol and
formalin should be added in a volume equal to the sample Surface Horizontal tow
• keeping a firm grasp on the line, toss plankton net away from you in an underhanded motion.
51

• slowly retrieve the net with a hand over hand motion, keeping net just under water surface
• follow rinsing instructions above OR • in a motorized boat, place net in water behind boat with line attached to boat • slowly move forward at a rate so that the net is pulled just under the water
surface • follow rinsing instructions above
* Lugol’s solution contains iodine and a small amount of glacial acetic acid. The iodine will stain hands and clothing, and the acid may damage clothing. Use necessary caution when using Lugol’s.
52

Zooplankton from a discrete depth Zooplankton can also be sampled from a discrete depth, much in the same way as phytoplankton sampling. By using a water sampling device, water is collected from a specified depth and poured through the plankton net manually. Using this method, not nearly as much water can be filtered as with a plankton tow, but more specific information can be obtained. An alternative to this two-step process is the Juday plankton trap, which takes a water sample from a discrete depth. As the sampler is brought to the surface, water in the sampler is automatically filtered through an attached filtering device. The filter then has to be rinsed into the sample bottle. Equipment water sampler and plankton net OR Juday plankton trap spray bottle squeeze bottle (filled with filtered or distilled water) Alka Seltzer tablets small container for narcotizing plastic wide-mouthed bottles with plastic lids preservative Procedure
• set the water sampler in open position • keeping a firm hold on the line and messenger, lower the sampler to desired
depth • release the messenger to trigger sampler shut • raise sampler to surface and make sure seals are tightly closed • (if using separate net) pour water through plankton net while holding both over
the water • holding the net above the water, use the spray bottle full of lake water or “clean”
water to rinse down the OUTSIDE of the net • rest the sample bucket in the plastic container containing Alka Seltzer solution;
remove the net • leave the bucket in the solution for about one minute to narcotize the organisms • rinse the inside of the bucket and the “screened” areas into the container with the
squeeze bottle full of filtered lake water, distilled water, or tap water (not regular lake water)
• add preservative and mix gently
53

Phytoplankton (nanoplankton) Plankton nets are not adequate for collecting the smaller phytoplankton (nanoplankton). In order to collect a representative sample of all the phytoplankton, it is necessary to use microfiltration. This requires the collection of a water sample and subsequent filtering or settling in the laboratory. Because the water is collected and carried back to the laboratory, the amount filtered is limited by the amount of water that can be transported. Sampling is similar to the techniques used for water chemistry samples. Equipment water sampler plastic small-mouthed bottles preservative Procedure
• set sampler in open position • keeping a firm grasp on the line and messenger, lower sampler to desired depth • release messenger to trigger sampler shut and raise to the surface • make sure all seals are shut • rinse sample bottles with small amount of water and discard • fill bottles to the top with water from sampler • add preservative and mix gently
54

Benthic macroinvertebrates Benthic macroinvertebrates should be collected last in the sampling order. Sediment samples are lifted to the surface in a grab sampler, and excess sediment often washes out during this procedure. Further, a great deal of sediment is released during sample sieving. Excess sediment in the water column could affect other chemistry or plankton results. Equipment benthic sampler wash bucket with No. 30 sieve bottom simple wash container (bucket, bowl, or bottle to rinse sieve) plastic wide-mouth sample bottles preservative Procedure Ekman grab
• carefully set Ekman while it is resting on the boat floor or seat • keeping a firm grasp on the line, slowly lower Ekman in the water, keeping it
vertical from the boat to the lake bottom • when Ekman has reached the bottom, drop messenger to trigger sampler; you
will either hear it trip or feel it in the rope • lift Ekman to water surface with a smooth even motion • keeping Ekman under the surface, quickly slip sieve bucket underneath • lift these (together) up to the edge of the boat • empty Ekman into the sieve bucket by pulling up the sides (jaws) and rinsing the
inside of the Ekman with lake water; releasing the spring-loaded sides may make emptying easier; minimize the amount of water you pour into the bucket to make sieving easier
• when the Ekman has been emptied, put it aside; rinse the sample by swirling the bucket while thrusting it up and down in the water; do not let water run over the top of the bucket, as this makes sieving more difficult
��� if your sample has many fine clays, it may help to mix the sample gently with your hand; rinse your hand or glove into the sample if there is sediment on it ���
• your final sample should not have muck and fine silt– the small amount of water in your sample should be clear
• concentrate the sample materials to one side of the bucket by holding it at an angle at the water surface and splashing the bottom of the bucket; empty contents into sample container
55

• the remaining small particles can be rinsed into the bottle by pouring water over
the bottom of the screen with your simple wash container
Ponar grab
• set the ponar in open position • carefully lower ponar over side of boat to the sediment surface while keeping a
firm grasp on line • after device has triggered, carefully raise ponar to the surface • place sampler in bucket and open to release sediment • sieve sample through sieve bucket or pour off excess water through small sieve
and wash remaining sediment back into sample • wash sample into jar
How much preservative? Ethanol: When adding ethanol, a considerable amount is needed to preserve all of the organisms. You should add twice as much ethanol as there is sample and water. If the sample fills more than 1/3 of the jar, it will need to be separated into two jars, and ethanol should be added accordingly. Buffered Formalin: Far less formalin is needed for sample preservation. The final sample should be 95% sample and water and 2-6% formalin.
56
Sediment Chemistry Analyzing sediment chemistry is useful for determining some of the past impacts to a lake ecosystem. Many materials are stored up in the sediment and subsequently buried under layers of new sediments. Some of these materials degrade very slowly, so analysis can be conducted years after initial contamination. Years of buildup can therefore be measured in a sediment chemistry sample. Some parameters measured are only present in trace amounts, so techniques must be followed that avoid contamination. Thus, specific sampling equipment may be required for some trace analysis. EQUIPMENT sediment sampler teflon pan teflon ladle sample bottles PROCEDURE
• set sediment sampler; lower to bottom while firmly holding line; release messenger or otherwise trigger the sampler closed
• lift sampler to the surface using a slow, steady motion • if the sample is a solid consistency, open the lid of the sediment sampler • with a teflon spoon, scoop some of the sediment from the center of the sampler
into sample jar • if your sample is a liquid or mucky consistency, empty the sediment sampler into
the Teflon pan and then scoop out and fill sample jar ***Note: decrease possibility of contamination by minimizing the amount of equipment that comes into contact with the sample ***
57

Chapter 7. After Field Sampling
Preventing the spread of invasive, non-native species If you will be sampling more than one lake, it is crucial that you take the time to decontaminate your equipment. Decontamination between lakes is imperative where there is threat of invasion by non-native species. It will take some time, but it is well worth the effort when you consider the long-term effects of non-native species invasions. Zebra mussels, purple loosestrife, Eurasian water milfoil, fishhook waterflea, Bythotrephes cederstroemi, and other non-native species are a serious threat to lake ecosystems. When these species invade a new lake, they can quickly out-compete the native inhabitants for resources and space. Highly diverse ecosystems are reduced to a few species, and dominance in the ecosystem is shifted dramatically toward the invasive species. The shift in species composition can alter the entire lake ecosystem, and whether its integrity can ever be re-established is unknown. Invasive species are often transported to a new lake by way of boats or fishing and sampling equipment. Zebra mussel veligers easily attach to sampling equipment, and because they are too small to see without a microscope, they are unknowingly transported to a new lake. Seeds or larvae of other invasive species often attach themselves to equipment and are then transported to other lakes. These non-native species have had detrimental effects on many lake systems, so you don’t want to transport them to a new lake where they might colonize. If you will be sampling several lakes in a day, and the status of zebra mussel invasion is known for each of the lakes, you will want to arrange your sampling order accordingly. Lakes that have not been contaminated with zebra mussels or other nonnative invasive species should be sampled first. Contaminated lakes should be sampled after these lakes to avoid spreading the species. This is not an alternative to equipment decontamination but an additional precaution against nonnative invasion. There are a few easy methods that will eliminate the zebra mussel veligers and presumably other non-native species from your sampling equipment. The easiest technique is simply drying out the equipment. Zebra mussel veligers are destroyed in the drying process. This technique cannot be used if you will be sampling more than one lake in a day, however; there is not enough time between lakes to dry equipment thoroughly. Another option for decontaminating your equipment is immersing it in water that is 160-180 0F. Some of your equipment should never be placed in hot water, so this technique also has limitations. Additionally, water at such a high temperature can be difficult to locate out in the field! A third technique is a 30 ppt saltwater bath (30 grams (1.1 ounces) salt for each quart of water). Each item of equipment should be immersed in a bucket of salt water, which destroys the zebra mussel veligers. Items that are difficult to immerse should be sprayed completely with the saltwater solution. Additionally, your boat and paddles– anything that has come into contact with the lake– should be sprayed with salt water. Excess water must be drained, and any areas containing water should also be cleaned with salt solution. Some areas that can harbor zebra mussels for an extended period of time include the water pumps in boat motors 58

and bottom ribs of flat bottom boats; all such areas should be thoroughly decontaminated. After each item has been decontaminated with salt water, everything should be rinsed thoroughly with clean water (not lake water!). The dry salt adhering to your equipment will act as a pollutant in a lake and may corrode your equipment if they are stored after the salt rinse.
59
Storing and Shipping Chemistry Samples Most of your samples must be kept in a cooler between the lake and the laboratory. Upon return to the laboratory, put these samples in a refrigerator. Vials containing chlorophyll a filters should be placed in the freezer. These should be kept frozen until analysis. If you are having a contract laboratory analyze your chemistry samples, samples should be shipped as soon as possible after returning from the field. Before packing them for shipping, make sure all necessary information has been included on the bottle labels. The contract laboratory is likely handling hundreds of contracts, and improperly labeled samples will be lost easily. Samples should be packed in a cooler with plenty of ice packs in order to maintain a 40C temperature throughout shipping. Some laboratories prefer each cooler to have a small bottle of deionized water placed in with the samples. Upon arrival at the laboratory, the water temperature is taken to test whether the temperature of the samples has been maintained at a constant, low temperature throughout shipping. Sufficient packing material should be used in the cooler to prevent glass sample bottles from breaking. If applicable, be certain all chain-of-custody forms are filled out completely and accurately. Quality control procedure requires a chain-of-custody form so that there is a record of every person who has handled the samples. Water samples that will be analyzed in-house may be stored in the refrigerator or in the cooler until analysis. If you are sharing refrigerator space, make certain again that all bottles are properly labeled with sample information and your name. If you have preserved biological samples that need to be shipped to a contractor or other outlet, there are very strict regulations you must follow. Shipping formaldehyde or ethanol in volumes you will be using in the US Mail is illegal, and should not be attempted under any circumstances. There are other shipping services that will ship these substances, but the rules are very strict, and any departure from set guidelines may result in your packages being returned to you. Therefore, determine your shipping outlet well before sample collection so that you know what type of preservative you need to use. Biological samples that will be stored for any length of time should be placed in a dark location without any temperature extremes. Lugol’s solution degrades and/or evaporates more quickly in light. Additionally, for large volumes of samples, flammable cabinets will be needed. Put your preserved samples where you were storing the preservative!
Sampling Equipment Even if you will be sampling on the next day, all equipment should be rinsed out thoroughly with clean water. Everything should then be left in an open position to air-dry. Allow enough time for all ropes, nets, and equipment to dry completely before packing them away in storage boxes. Hang up the plankton net so that it and the attached rope can dry completely.
60

Preserving Biological Samples Ideally, preservatives are added to the biological samples shortly after collection. If they have not been preserved in the field, it is best to attend to these samples as soon as possible. Due to predation in the phytoplankton, zooplankton, and benthic macroinvertebrates, more organisms will be lost the longer you wait. Because the preservatives can be harmful when inhaled, it is best to do this work outside or in a suitable laboratory with a fume hood. Be sure to follow all safety instructions with regard to inhalation or contact. Phytoplankton and zooplankton can be preserved with Lugol’s solution, ethanol, or formalin. A few drops of Lugol’s should be added to the samples, with additional solution added every few weeks. Formaldehyde will fix the samples permanently, and it should be added so that the final concentration of the sample is 2-6% formalin. Again, keep in mind any restrictions of those who will be analyzing the samples and any shipping regulations for the preservatives. Follow all safety regulations for the preservatives you will be using, and avoid skin contact with formaldehyde or prolonged exposure to formaldehyde or ethanol fumes. Benthic macroinvertebrates: If you are using 100% ethanol as a preservative, add enough so that 2/3 of the liquid in the sample jar is preservative. This will make a 70% ethanol solution that should keep your samples from degrading. If there are any mussels in the sample, you will need to use significantly more preservative. It will take a great deal of preservative for it to soak all the way into the soft tissues of the mussels.
61

Processing Biological Samples Processing biological samples will take a considerable amount of time. Identifying biological samples is a complicated and costly task. Certain decisions related to the specificity of identification must be made before proceeding. The level of identification needed may determine the time involved, the expertise needed, and the method for analysis. Identification to species is ideal, but the cost and effort may be too ambitious for a monitoring program. For this reason, certain groups can be identified to genus and other only to family; this will provide sufficient information for many monitoring needs. Before proceeding, identify the costs and benefits for your identification options and see how they fit into the ultimate goals of the monitoring program. Research studies that have been conducted on choosing analyses, and plan your analysis program accordingly. Analyzing E. coli involves less decision-making. The U.S. EPA has determined that the membrane filtration technique for E. coli is the most reliable method for use in monitoring programs. Although there are more complex means of analyzing E. coli, these are typically techniques used by microbiologists with more experience and resources.
62

E. coli E. coli analysis is a very technical procedure that requires strict attention to details. Because you are attempting to culture a bacterium that is abundant in nature, you must use sterile technique to avoid contamination of the collected sample. Make certain that the laboratory is clean and that you keep your hands clean throughout the analysis process– use alcohol wipes or antiseptic lotion. For bacteria analysis that can be done in a multi-use laboratory, there are a few techniques. The US EPA, however, adopted E. coli analysis as the most reliable method for sampling natural freshwater for recreational use. There are some problems with the technique, so research is being conducted to improve monitoring methods. For now, however, the membrane filtration technique for E. coli is the most reliable and widely used. The EPA has set a standard of 235 colonies of E. coli per 100 ml of water for a one-time sample collection. If the E. coli concentration exceeds this count, the beach should be closed to swimming. Some states have adopted more strict regulations, but enforcing these regulations can be difficult. Equipment mTEC agar petri dishes buffered, sterile dilution water sodium dihydrogen phosphate (NaH2PO4) sodium monohydrogen phosphate (Na2HPO4) sodium chloride (NaCl) urea substrate phenol red urea 1N HCl filtering manifold apparatus vacuum pump filters (0.45 um gridded) forceps alcohol pipette graduated cylinder incubator **Prior to filtering, petri dishes will have to be prepared for analysis Mix agar according to directions on bottle, including sterilization and pH adjustment Pour or pipette 4-5 ml of agar into each petri dish and replace cover Allow agar to solidify; store in refrigerator between preparation and analysis Remove plates from refrigerator to warm to room temperature before use **Prior to filtering, you will also need to prepare sterile, buffered dilution water
63

dissolve 0.66 g sodium dihydrogen phosphate (NaH2PO4H2O) 2.5 g sodium monohydrogen phosphate (Na2HPO4) and 8.5 g sodium chloride (NaCl) in 1 L of reagent-grade water Adjust pH to 7.4 ± 0.2 Autoclave at 121 0C for 15 minutes **Prior to filtering you will need to prepare urea substrate Dissolve 2.0 g urea and 0.01 g phenol red in 100 ml reagent grade water Adjust pH to 3-4 using 1N Hcl Solution should be straw yellow ANALYZING
set up filtering manifold with filter base place tweezers briefly in alcohol and pass through bunsen burner flame; allow to
extinguish open filter and using tweezers, place it on filter base put funnel and clamp in place spray small amount of sterile, buffered water on filter (10-20 ml) shake water sample for 20-30 seconds to redistribute cells measure sample amount using sterile pipette or graduated cylinder and pour into
funnel turn on vacuum pump spray sides of funnel during filtration and do not allow filter to go completely dry remove clamp and funnel, sterilize tweezers as before remove filter with tweezers and center on petri plate containing agar; (make sure
there are no trapped bubbles) close petri plate make sure plate is labeled and place in incubator at 35 0C for two hours after two hours, place plates in incubator at 44 0C for 22 hours remove dishes from incubator place absorbent pads in the lids of the petri dishes and saturate with urea substrate transfer membranes to saturated pads and hold at room temperature for 15-20
minutes Counting E. coli colonies
using a dissecting scope, if needed, count all of the yellow-brown colonies (spots) on the plate
E. coli results should ideally be between 20-80 colonies per plate, so use the sample dilution that
comes closest to that range
64

multiply the number of colonies in the dilution to number per 100 ml of water ≡ if you have a sample result of 22 in a sample in which you filtered 1 ml of
sample, your result per 100 ml would be: 22 colonies/1 ml = 2200 colonies/100 ml � if you have a sample result of 68 in a sample in which you filtered 0.1 ml of sample,
your result per 100 ml would be: 68 colonies/ 0.1 ml = 68,000 colonies/100 ml ≡ if the plate is covered with colonies, the resulting count may be identified as too
numerous to count (TNTC) ≡ if the counts for all of the dilutions fall outside of the 20-80 count range, use the
count closest to that range � if counts for more than one dilution fall into the acceptable range, calculate the
number per 100 ml for all plates and then average the numbers.
Better Results: A modified method for determining E. coli counts has been developed that has fewer false positive results with the E. coli assay (Smith and Dufour 1997). The method follows the same steps outlined here with one change and one additional step. The phenol red is avoided in the urea step, and after the filter has soaked in the urea, it is placed in a medium of 5-bromo-6-chloro-3-indoyl-beta-D-glucuronidae. After 1-6 hours in this medium, the E. coli colonies are counted. This method has better results for specificity in counting E. coli rather than other growing bacteria, but it does involve more time for analysis.
Technique adapted from Indiana Interagency Task Force on E. coli, Standard Operating Procedure for Recreational Water Collection and Analysis of E.coli on Streams, Rivers, Lakes and Wastewater, March 1999.
65

Chlorophyll a
Chlorophyll a analysis can be quite expensive due to the cost of start-up equipment. Analyzing phytoplanktonic biomass requires both a spectrophotometer and a fluorometer and also a centrifuge. Once this equipment is purchased, the cost per sample is much more reasonable. Alternatively, water samples can be filtered for chlorophyll a analysis, and the frozen filters can be shipped to a qualified laboratory for analysis. Before getting started, it is necessary to calibrate the spectrophotometer to the fluorometer using a chlorophyll standard. This can be purchased or made using acetone and a green lettuce leaf (Wetzel and Likens, 1979). The lettuce leaf is extracted in acetone for several hours, resulting in acetone that is dark green in color, having been saturated with chlorophyll from the lettuce leaf. This concentrated chlorophyll sample is diluted to a specific concentration by taking readings at different light wavelengths on the spectrophotometer. When the specified concentration is reached (Wetzel and Likens, 1979), the sample is compared on the fluorometer and a concentration curve is created. The slope of the curve provides the correction factor that is used for calculating chlorophyll concentration from a fluorometer reading. More extensive explanations of this process are described in Standard Methods and Wetzel and Likens [Wetzel, 1979 #428; American Public Health Association, 1995 #429]. Equipment Spectrophotometer with cuvettes Fluorometer with cuvettes and window orifices Centrifuge Tissue grinder (if glass-fiber filters used) 15 or 25 mL centrifuge tubes buffered 90 % acetone green lettuce leaf Prepare filters the day before analyzing:
Place filter in tissue grinder with a small amount of buffered acetone (2-3 ml) Grind filter for 1 minute at 500 RPM Transfer sample to a screw-cap centrifuge tube and rinse grinder with small
amount of acetone; add acetone to a volume of 10 ml cover centrifuge tubes and place in dark refrigerator overnight
Prepare equipment for use:
extract lettuce leaf in 25-50 ml of acetone for several hours; filter and store in darkness
66
dilute this sample to a concentration of 6 mg chl a/liter using the spectrophotometer (see Wetzel and Likens, 1979)

calibrate fluorometer to spectrophotometer following instructions on Wetzel and Likens, exercise 10 (1979) and Standard Methods, section 10200 H (1995)
Analyzing samples:
pour a small amount of sample extract from centrifuge tube into fluorometer cuvette wipe outside of cuvette thoroughly before placing in fluorometer measure fluorescence, record result and aperture size used repeat for each sample using a clean cuvette
Chlorophyll a concentrations will have to be calculated from fluorometer readings using the equation Chla (ug/L) = (F) (fluorometer reading) (v) (V) where: F = correction factor developed from calibration v = volume of extract, in liters V = volume of water filtered, in liters
67

Phytoplankton
Phytoplankton analysis can be quite complicated and requires someone with expertise in plankton identification. The equipment required is quite expensive, and unless you will be analyzing samples for years to come, it might be best to contract the samples to a taxonomic expert. If you will be analyzing phytoplankton in-house, you will want to use Lugol’s solution as a preservative and dye. Add enough Lugol’s so that the water is the color of weak tea. Lugol’s should be added periodically so that the sample retains the dye color. Both phytoplankton and zooplankton can be analyzed together as net plankton, or they can be analyzed separately so as to include the smaller phytoplankton (nanoplankton). When counting nanoplankton, calculations can be made based on representative counts. You may want to count the entire sample, a certain number of fields of view, or a certain number of transects. The method used will vary based on nanoplankton concentration in the sample. Several methods of analysis are available for the nanoplankton depending upon which groups you are interested in analyzing. One of these methods includes microfiltration and subsequent filter clearing. This method allows you to analyze a large volume of water in each slide, so it is particularly effective for oligotrophic lakes. The first method described uses a clearing oil that has a tendency to evaporate. Equipment clean, plastic bottles glutaraldehyde filters, 25 mm, pore size 0.45 �m millipore filters vacuum pump and apparatus coverslips and slides microscope clove oil paraffin ethanol phytoplankton taxonomic keys Procedure • measure known volume of sample into clean bottle (100-300 ml) • add 10-30 drops glutaraldehyde (1 drop/10 ml sample) • swirl the sample until diffraction lines disappear • refrigerate for at least four hours • set up filtering apparatus and attach vacuum pump • place filter on apparatus • swirl sample to distribute evenly the planktonic cells • filter 50 ml of sample (25 ml if very high chlorophyll) • filter at very low vacuum until all liquid has been filtered
68

• before it is completely filtered, rinse with at least 20 ml 50% EtOH, then with 20 ml 95% EtOH.
• Filter until filter is almost dry • add 5 drops clove oil to glass slide (THIS IS ESSENTIAL) • remove filter and place on top of the drop of clove oil • add 5 drops clove oil to top of filter • place coverslip over filter • gently press out excess air bubbles and wipe off excess oil • label all slides with sample number, volume sampled, and date • two weeks after slides are made, filter will be completely clear • add more clove oil if necessary and seal edges of coverslip with hot paraffin • slide is ready for identification and counting Another method of nanoplankton analysis that uses a smaller volume of water is the settling tube. This method requires an inverted microscope, however, which may not be readily available. Furthermore, it is most applicable to lakes with eutrophic conditions, due to the small amount of water analyzed. Equipment sedimentation tubes (5-25 ml) inverted microscope phytoplankton taxonomic keys • pour known volume of sample, stained with Lugol’s, into sedimentation tube • allow sample to sit, undisturbed; 4 hours for each centimeter of liquid • place settling tube on inverted microscope and count Phytoplankton in your samples will include species from a number of taxonomic groups. It is likely that you will encounter forms from the blue-green algae (often called cyanobacteria), green algae, and diatoms.
69

Zooplankton and Net Plankton If you will be counting the zooplankton and larger phytoplankton together (net plankton), you will use a different method that does not require much preparation. It can be more difficult to count the organisms together because it requires familiarity with both the phytoplankton and zooplankton. The Sedgwick-Rafter counting cell is commonly used for net plankton counts. Similar to a microscope slide, it holds a known volume of sample (l ml). Because of the small sample size, all of the organisms on the slide are counted and identified, both large phytoplankton and zooplankton. Smaller phytoplankton are more difficult to identify because of the size and shape of the Sedgwick-Rafter cell. Equipment Sedgwick-Rafter counting cell with coverslip Hensen-Stempel pipette compound microscope zooplankton taxonomic keys phytoplankton taxonomic keys Procedure • stir plankton sample to redistribute planktonic cells • measure 1 ml of sample using pipette • place in counting cell and cover with coverslip • carefully place slide on microscope and count all cells Zooplankton samples may also be counted in a counting wheel or petri dish. This technique requires a dissecting microscope rather than a compound microscope, so only the larger forms can be identified. Again, a subsample is analyzed, but the counting wheel holds 5 ml of sample and depending on the size and concentration of the sample, the entire sample can be analyzed with the petri dish. Larger and less abundant organisms are more likely to appear in a larger subsample. Most of the zooplankton collected will fall into two general taxonomic groups: rotifers and crustaceans.
70

Benthic macroinvertebrates Benthic samples require a considerable amount of processing time before they are ready to be analyzed. The first step is to pick the organisms from the sediment samples. Because there can be much large sediment and other debris in the samples, the organisms must be extracted from the sample before they can be identified. This can be a time-consuming and tedious process, but using organism dyes, such as rose bengal, can make this task somewhat easier. Once all of the organisms have been separated, they can be identified. Benthic macroinvertebrates are very diverse, so identifications require some understanding of a number of organismal groups. Furthermore, a number of groups need to be mounted on separate slides for identification under a compound microscope. Several taxonomic guides will be needed to guide you through all of the identifications. Equipment shallow white enamel pan forceps small sample vials petri dish dissecting microscope microscope slides and coverslips compound microscope Procedure • pour benthic sample into shallow pan and add enough water so that sediment is
covered • using forceps, carefully pick out all organisms and place them in vials; place like
organisms together to make later identifications somewhat easier • after all organisms have been picked, identify using dissecting microscope • small organisms can be mounted on microscope slides and identified on a compound
scope; specifically chironomids (midges) and oligochaetes (earthworms)
71

Data Storage One of the biggest problems in maintaining a monitoring program is the problem of data loss. Oftentimes, data are stored on different computers and by different people, or worse, the data never make it to a computer and are forgotten in field notes or in the memory of the hand-held digital display, only to be written over with another file. Sometimes, data sheets received from the contract laboratory are misplaced before the data are entered into the database, and this important and expensive information is lost. When it is time for data analysis, in these situations, much of the information cannot be located at all. For this reason, data storage decisions are a critical part of a monitoring program. It is best to decide on one location for storing all of the data. In addition to this location, extra copies should be stored on other computers and with other people. That way, if the main computer storage area fails, hopefully the data can be pieced together again. One person should be put in charge of maintaining the database and making certain that data are entered every time the lake is sampled. For data entry, a spreadsheet program is appropriate, but for data analysis, some statistical software will be needed. Data can be entered directly into a program with statistical capabilities right from the start, thereby saving the task of data transfer between programs. The program selected should be sufficient for the program needs, but if the project is being conducted among agencies, software should be identical or compatible. Support from other offices will be helpful when questions arise about data entry or analysis. When you return from the field, you should upload data in the hand-held digital display or enter other depth profile data and prepare a narrative statement of the sampling event. After all of the data have been entered, you should save the files in more than one place–removable disks, another computer, or both. All of these should be put in a central location and duplicated. Field notes and chain of custody forms should be photocopied and placed in central files. METADATA In addition to recording collected data in more than one place, it is critical that you also record information pertaining to the database. Without a record of what information was entered and how the data were organized, it will be impossible to interpret the database on a later date. This is a common problem because personnel tend to change with some regularity, and if the monitoring program outlasts the knowledgeable personnel, records of data analysis and storage protocol will be needed. Metadata is the term applied to data describing data; it is the information that allows database interpretation. Metadata might include codes or initials used to shorten names, dates of sample collection, dates of analysis, or dates of entry into the database. It might also include analyst’s names for any step of the process. Meta-Mars: A costly example of the importance of metadata is a space probe NASA
sent to Mars in 1999. NASA assumed the thruster measurements they had were in Newton-seconds, but the probe manufacturer had supplied the numbers in pound-seconds. The probe crashed into Mars and was destroyed. Price tag: $125 million.
72

Long-Term Storage Sampling equipment Sampling equipment should be stored carefully in the original storage cases. If you do not have cases for the equipment, store equipment in a box or somewhere it will not be damaged. Water samplers should be handled carefully so as to prevent breaking and scratching, and plankton nets should be stored where they will not be ripped. Water sampling equipment is quite expensive, and replacement items or parts are a significant cost. If electronic probes will be stored for several months without being used, you will need to attend to them before putting them away for the season. Follow the instructions provided by the probe manufacturer for storage recommendations. If you are using a multiprobe apparatus, some of the probes must be removed from the instrument and placed in storage vials or solutions. Storing samples and flammable preservatives When you have added preservatives to all of your samples, store them in a cool dark place. Some of the preservative dyes will degrade in light. Depending on the safety regulations, you may need to store samples in a flammable cabinet. Make certain everything is properly identified in the storage facility, especially preservatives that may have been added to the samples.
73

Chapter 8. Limnology Terms and Concepts (This glossary includes general concepts for many of the terms you will encounter. Complete definitions would require much more elaboration.) alkalinity— This is the buffering ability of water to resist decreases in pH. This is typically due to carbonate-bicarbonate buffering systems. anthropogenic input– Inputs from human sources or human-derived sources are considered anthropogenic. Anthropogenic inputs can be in the form of excess nutrients, pesticides, herbicides, sediments, heavy metals, and contaminants. These inputs can increase the rate of lake aging. benthos— This term refers to organisms living in the sediment or the sediment-water interface. Commonly, this refers only to animals (zoobenthos). In oligotrophic lakes, benthic macroinvertebrates are diverse, but in eutrophic lakes, the oxygen-depleted environment is suitable only for a few benthic species. Benthic macroinvertebrates rely on primary producers as a food source, from benthic-dwelling plants (phytobenthos), sinking phytoplankton, or decomposing phytoplankton. Furthermore, benthic organisms rely on decomposing organisms as a food source. Some predation is also present within the benthic community. benthic macroinvertebrates sampling— Sampling for benthic macroinvertebrates can be done from the lake surface using a sediment grab sampler. An Ekman dredge, ponar sampler, or a similar device is used to grab a sediment sample. On the boat, the sampler is set in an open position using a spring mechanism. The sampler is then lowered to the lake bottom and either releases when it touches the sediment or a weight (messenger) is dropped down the rope to trigger the device closed. The sampling device is then brought to the surface for processing. Usually, the sediment is sieved immediately so that only the organisms are brought back from the field, and excess sediment is left in the lake. The sediment sample is poured through a sieve with a known mesh size so that organisms of a certain size (macrobenthos) are retained, and smaller organisms are strained through with the water, silt, and sand. The remaining coarse sediment and benthic organisms are placed in a sample jar for preservation. biochemical oxygen demand (BOD)– Biochemical oxygen demand is the amount of oxygen required by microorganisms while breaking down decomposable organic matter.
74

This test is typically used in areas where there is some sort of domestic or industrial waste discharge with a high organic load and excess oxygen demand. chloride— A major ion, chloride (Cl-) often follows sulfate in dissolved abundance in water. Chloride has an effect on water salinity, oxygen solubility, and water regulation function in organisms. Chloride forms ionic bonds with ions such as sodium, potassium, calcium, and magnesium. dissolved oxygen— Oxygen is the most important element in a lake. Dissolved in the water, it is available from atmospheric sources and primary producers. Oxygen is used by aerobic organisms and is needed for aerobic decomposition, so sufficient availability is imperative for lake health. The balance between oxygen supply from photosynthesis and oxygen consumption by organisms depends on many parameters including water temperature, primary productivity, and nutrient abundance. Oxygen dissolves more readily in cold water. Oxygen concentrations differ with depth, and seasonal changes have a significant effect on oxygen. epilimnion— The upper layer of thermally stratified water in summer, the epilimnion is the layer mixed by wind and wave action. Due to surface interactions and mixing, this area is warmer during summer stratification. eutrophication– Natural aging of a lake that takes place due to nutrient and sediment inputs is called eutrophication. Sediment and nutrients originating in the lake’s watershed start filling in the lake, and as it shallows without a decrease in productivity, the rate of infilling increases. For this reason, large, deep lakes (oligotrophic) undergo eutrophication slowly, while small, shallow lakes (eutrophic) age more rapidly. The rate of eutrophication can be increased by human activity such as nutrient loading (pesticides and herbicides in the watershed) or sediment runoff (from development in the watershed). If eutrophication continues, the lake will eventually be converted to a wetland and may finally disappear. eutrophic lake— This is a lake with high nutrients and, therefore, high primary productivity (algae and plants). Blue-green algae are characteristically extensive in these lakes, especially in summer. The littoral zone is typically broad with abundant plants. Due to high production, there is a great deal of biomass and decomposition in the profundal zone with few benthic species. In the summer, there is often depleted oxygen in the hypolimnion.
75

hardness— The amount of calcium and magnesium in water constitute water hardness. These cations are usually related to carbonate-bicarbonates, and this measurement is referred to as carbonate hardness. hypolimnion— During summer, this is the lower layer of cool, dense water that does not mix with the epilimnion. The metalimnion keeps the layers separated. Mixing occurs within the hypolimnion to keep nutrients and other chemicals’ concentrations equally distributed. Organic material collects in the sediments, and decomposition uses much of the oxygen. This layer is warmer than the epilimnion in the winter and cooler in the summer in stratified lakes. Chemistry of the hypolimnion is different due to decomposition. inverse stratification– During winter, the lake is again stratified into distinct temperature layers. Unlike summer stratification, the temperature at the surface is the coldest, as evidenced by ice cover. At the end of summer, surface water begins to cool, and the cooler, more dense water begins to sink toward the bottom. When water temperature reaches about 4 0C, it is at its most dense. As the water cools beyond 4 0C, it starts to rise to the surface; when the water reaches 0 0C, ice forms. This movement due to cooling and density changes causes the entire water column to be mixed before it becomes stratified again. It is because of this density characteristic that lakes freeze from the top down and not vice versa. limnetic zone— The limnetic zone is the open water area of the lake where light does not penetrate to the bottom. The limnetic zone is differentiated from the littoral zone by depth of the water. (see figure of light-defined lake zones). littoral zone— This is the shallow area of the lake where light is able to penetrate to the bottom. Rooted aquatic plants can grow in this zone. The area of this zone is widely variable among lakes and depends on sedimentation rates, water clarity, and lake morphometry (see figure of light-defined lake zones).
LIMNETICLITTORAL
Profundal zone
76

macrobenthos– The larger of the benthic organisms, macrobenthos live on or near the sediment surface at the bottom of the lake. Distinguished from the meiobenthos or microbenthos by size, macrobenthos are collected to determine the biological health of a lake ecosystem. macrophytes— This group of plants are larger than the phytoplankton, and they can be found either floating or attached to the substrate. These are typically found in the lake’s littoral zone. Physiological modifications in plant structures allow the macrophytes to exist in water, and many of the same factors that determine phytoplanktonic success influence macrophyte survival: nutrients, light, and space. nitrogen— Nitrogen is present in lakes in many forms, and its availability is essential to life. It is the major component of air, but in the water, N2 must be converted through a process called biological fixation into one of several usable forms before being incorporated into the phytoplankton. The resulting ammonia (NH4) can be assimilated by plants. Ammonia is also available as a waste product from aquatic organisms, and through a process called nitrification, it can be converted by bacteria, fungi, and autotrophic organisms into nitrite (NO2) or nitrate (NO3). The steps are very complex, and the nitrogen cycle is one of the fascinating processes in aquatic systems. This should be considered only a simple version of nitrogen cycling, and more extensive explanations should be sought.
NO2NO3
nitrification
denitrification
N2
N2
biomassassimilatory denitrification
NH4
decompositionexcretion
fixation(blue-green algae)
(plants/algae)
(bacteria)
77

oligotrophic lake— Low nutrients and transparent water characterize these lakes. There is low productivity, and the benthic fauna is highly diverse but low in number. The basin is typically deep with steep banks. The sediments are typically low in organic matter. overturn— This process mixes the entire water column, rather than just the epilimnion. It is a result of temperature changes or wind and wave mixing. In temperate, dimictic lakes, when the surface ice is warmed, in spring, or the summer water is cooled, in fall, it begins to sink as it approaches 4 0C. As the temperature continues to rise above or fall below 4 0C, it again moves toward the surface. As the water temperature continues to change, the layers mix, and the nutrient-rich bottom water is brought to the surface.
dimictic lakes— In these lakes, the entire water column is mixed twice a year: spring and fall. Dimictic lakes are directly stratified in summer and inversely stratified in winter. cold monomictic lakes— These are primarily Arctic and mountain lakes in which the water temperature never exceeds 4 0C. These lakes mix only once during the year, in summer. warm monomictic lakes— A typical coastal lake type, warm monomictic lakes mix in winter, and stratify in summer. The temperature never falls below 4 0C, and therefore these lakes never freeze. oligomictic lakes— Mixing in these lakes is rare, at irregular intervals, and quickly done. Water temperature is always above 4 0C, and these are usually tropical lakes. polymictic lakes— Circulation more than twice a year or continuous circulation characterizes a polymictic lake. Cold polymictic lakes always have a temperature around 4 0C, and warm polymictic lakes have temperatures far above 4 0C.
pH— This measurement refers to the concentration of free hydrogen ions in water. Water with a pH of 7 is neutral with a balanced concentration of H+ ions. The addition of acids, salts, and bases changes the balance of these ions. Adding acids decreases the pH (pH <7), and adding bases increases the pH (pH >7). phosphorus— Phosphorus is essential for life. Most phosphorus occurs in one form--orthophosphate (PO4). The three possible forms of phosphorus--orthophosphate, monophosphate, and dihydrogen phosphate--together make up the total phosphorus in a lake system. Phosphorus originates from rocks and soils, and although it is abundant
78

on earth, it is often the limiting nutrient in a lake system. In other words, nitrogen and other elements are available in quantities sufficient for rapid growth and reproduction, but there isn’t enough phosphorus to maintain that rate. Phosphorus passes through the biotic component of a lake by first being taken up from weathered materials by plants and algae. Organisms feed on the plants for their phosphorus source. Phosphorus is again made available to the system through excretion and decomposition, and the rate of release and uptake governs the phosphorus cycle in a lake. Bottom sediment is also an important source of phosphorus where it can be recycled into the system. Phosphorus can be lost from the system if it is buried before being recycled. photosynthesis– Photosynthesis takes place in the chlorophyll in plants, and it is the process by which inorganic substances are converted to usable energy forms Using carbon dioxide and water, in the presence of sunlight, plants create carbohydrates and oxygen– as a byproduct. Organisms that photosynthesize are called primary producers. This process is the first step in the trophic web in an ecosystem, and it is absolutely necessary for the movement of energy through the lake system. Other organisms that are unable to create their own energy products must consume either the primary producers or other consumers. phytoplankton— This term literally means “floating plants.” The phytoplankton are plants, typically microscopic, that rely on sunlight and nutrients dissolved in the water for survival. These are some of the primary producers of a lake, and the range of survival requirements in different groups of algae is broad. Nutrient availability, light, heat, and competition for resources structures the phytoplankton community. Differences among the groups can be found in pigment composition, morphology, and ecology. Because they are light-dependent, algae are found where light penetrates the water column. Motility is limited, but with the use of projections or by changing their density, algae can maintain a position near the water surface. Some of the major phytoplankton groups found in freshwater include the blue-green algae (cyanobacteria), green algae, golden-brown algae, and diatoms. phytoplankton sampling— Finer mesh nets can be used for phytoplankton, but these can break up some delicate phytoplankton forms. Phytoplankton can be collected with a water sampler (e.g. Kemmerer) just as water is collected for chemical analysis. In the laboratory, the water is then concentrated so that only a small amount of water, with many phytoplankton, is examined under the microscope. primary production— This is the process in which high-energy organic compounds are produced from inorganic substances. Light and nutrients are assimilated to form energy, usually through photosynthesis. Plants are, therefore, the basis for creating
79

energy in a lake. Oxygen is a by-product of photosynthesis, so macrophytes and phytoplankton contribute both a food source and oxygen to the lake system. profundal zone— This area is located where light does not penetrate to the bottom. It includes the sediment where plants are unable to grow due to insufficient light (see figure of light-defined lake zones). respiration– During the process of respiration, aerobic organisms use oxygen, which is necessary for survival. Organisms use oxygen and carbohydrates and produce the waste products carbon dioxide and water. In the process, carbon dioxide is released into the water and is used by phytoplankton for photosynthesis. The rates of these two processes (respiration and photosynthesis) vary greatly among lakes, and they can be indicative of lake water quality. salinity– The total ionic concentration of the water constitutes salinity. Salinity can be affected by influents, evaporation, and precipitation. Major contributing ions in the salinity measurement are Ca++, Mg++, Na+, K+, HCO3
-, CO3=, SO4
=, and Cl-. Lakes are often characterized as hard water or soft water lakes, which is a measure of salinity. Soft water lakes have lower salinity, and hard water lakes have high salinity. sampling for ambient conditions— Temperature, dissolved oxygen, pH, and conductivity are all parameters that should be measured in place. These parameters are subject to much fluctuation, and dramatic changes occur almost immediately after water has been removed from the lake. In order to measure these parameters at depth, a device such as a YSI multiprobe sonde or a Hydrolab sonde can be used. These will take continuous measurements as they are lowered through the water column, and they will record the depth at which each measurement is taken. Secchi disk transparency— The Secchi disk is used to determine light penetration, which is a function of turbidity. The Secchi disk is lowered over the side of a boat, and the depth at which it can no longer be seen is averaged with the depth at which it can be seen again when raised. At the Secchi depth, 10% of surface light is penetrating the water. sediment sampling— Grab samples from the bottom of a lake can be collected with a sediment sampler. These devices are typically set at the surface using quick-release springs and lowered to the bottom. When it is resting on the bottom, either a triggering weight (called a messenger) attached to the rope is dropped to trip the sampler shut, or the sampler triggers when it reaches the sediment surface. The sampler grabs a portion of the sediment, and it is pulled up to the water surface.
80
shoreline development factor (sdf)— This number describes the shape of a lake. The shoreline development factor is calculated as “The ratio of the length of the shoreline (L) to the circumference of a circle of area equal to that of the lake” (Wetzel 1983). A perfectly circular lake would have an sdf of 1. Irregular shorelines have higher sdf values. Bays and inlets can increase the sdf value significantly. silica— Most organisms require only small amounts of silica (Si), but diatoms, one of the most abundant algae types, use large amounts of silica for their frustules (cell wall). Because diatoms are such a crucial component in lake ecosystems, silica availability is important to a lake. Silica in lakes originates from rock weathering. Over the course of the year, concentrations in the water vary depending on rates of dissolution and uptake. The silica in diatoms often settles to the sediment, and large amounts of silica can be lost from the system this way. Dissolution is slow, and the rate of release depends on temperature and currents. specific conductance— A measurement of the amount of current conducted between two electrodes 1 cm apart, specific conductance inversely measures a solution’s resistance to electrical flow. A higher conductance means there are more ions in the water; water with fewer dissolved components has a lower conductance. sulfate— One of the major anions in water, sulfate (SO4) is one of many sulfur forms that occurs in a lake. Sulfate comes from natural sources, but it has become more prevalent as a pollutant in recent years as a result of increased industry. High sulfate levels often indicate acidic conditions. The cycle of sulfur in the water is complex, and many chemical forms are created through biological and chemical processes of decomposition, primary productivity, and sulfur oxidation and reduction. thermal stratification— In thermal stratification, the lake is separated into water layers at distinct temperatures due to differences in water density. Wind and waves mix the top layer of water (epilimnion) and keep the temperature homogeneous. The water below the thermocline is not mixed with the rest of the water column. Some lakes maintain stratification most of the time while others only rarely stratify. Thickness of layers depends on temperature, water clarity, wind, and other factors.
81

Temperature 0CSummer Stratification Winter Stratification
ICE
0 0 4 0
Epilimnion
Thermocline
Hypolimnion
Temperature
thermocline— This layer separates the epilimnion and hypolimnion. This layer is characterized by the greatest temperature change with depth. turbidity— A measurement of water clarity, turbidity causes light to be scattered in water. Several parameters factor into this measurement, including suspended particles, phytoplankton biomass, and dissolved chemicals. Knowing the turbidity can help one determine light penetration in the water column, which affects primary productivity. water sampling— In addition to surface water samples, there are instruments available that allow samples to be collected from discrete depths. Using a water sampler (e.g. Kemmerer), any depth in the lake can be sampled, provided there is enough rope. The collected sample can then be analyzed for many of the parameters described. With this capability, hypolimnion water can be tested separate from epilimnion water, so water conditions through the water column can be characterized. zooplankton— The zooplankton are floating animals with locomotive abilities that feed on the phytoplankton and other zooplankton. They typically range in size from 0.5-3 mm. Freshwater zooplankton communities are primarily composed of three groups of organisms: cladocerans, copepods, and rotifers. Because some are mobile, zooplankton are able to migrate vertically, thereby avoiding potential predators during the day. Availability of food and prevalence of predation, among other factors, determine zooplankton community composition.
82

zooplankton sampling— Zooplankton are typically collected using a fine-meshed net. A vertical lake sample can be collected by lowering the net to the bottom and then slowly raising it to the surface. In the process, zooplankton of a certain size are retained in the net, and smaller organisms, including most phytoplankton, are strained through the mesh. If only surface-dwelling zooplankton are desired, a horizontal tow near the surface can be done.
83

Some Helpful Taxonomic References
Phytoplankton: Patrick, R. and C.W. Reimer. 1966. The diatoms of the United States, Volume 1. Philadelphia: The Academy of Natural Sciences. 688 p. Patrick, R. and C.W. Reimer. 1975. The diatoms of the United States, Volume 2, Part 1. Philadelphia: The Academy of Natural Sciences. 213 p. Whitford, L.A. and G.J. Schumacher. 1984. A manual of fresh-water algae. Raleigh, North Carolina: Sparks Press. 337 p. Zooplankton: Balcer, M.D, N.L. Korda, and S.I. Dodson. 1984. Zooplankton of the Great Lakes: A guide to the identification and ecology of the common crustacean species. Madison: The University of Wisconsin Press. 174 p. Pennak, R.W. 1989. Freshwater invertebrates of the United States, 3rd edition: Protozoa to Mollusca. New York: John Wiley and Sons. 628 p. Stemberger, R.S. 1979. A guide to rotifers of the Laurentian Great Lakes. United States Environmental Protection Agency, EPA-600/4-79-021. July 1979. 186 p. Thorp, J.H. and A.P. Covich, editors. 1991. Ecology and classification of North American Freshwater Invertebrates. San Diego: Academic Press, Inc. 911 p. Benthos: Fitzpatrick, J.F., Jr. 1983. How to know the freshwater crustacea. Dubuque, Iowa: Wm. C. Brown Company Publishers. 227 p. Merritt, R.W. and K.W. Cummins, editors. 1996. An introduction to the aquatic insects of North America, 3rd edition. Dubuque, Iowa: Kendall/Hunt Publishers. 862 p. McCafferty, W.P. 1981. Aquatic Entomology: The fishermen’s and ecologists’ illustrated guide to insects and their relatives. Boston: Jones and Bartlett Publishers. 448 p. Peckarsky, B.L., P.R. Fraissinet, M.A. Penton, and D.J. Conklin, Jr. 1990. Freshwater macroinvertebrates of northeastern North America. Ithaca, New York: Cornell University Press. 442 p.
84

Pennak, R.W. 1989. Freshwater invertebrates of the United States, 3rd edition: Protozoa to Mollusca. New York: John Wiley and Sons. 628 p. Thorp, J.H. and A.P. Covich, editors. 1991. Ecology and classification of North American Freshwater Invertebrates. San Diego: Academic Press, Inc. 911 p. Equipment and Supplies and Laboratory Contacts Equipment and Supplies: Ben Meadows 190 Etowah Industrial Court Canton, GA 30114 800 241-6401 www.benmeadows.com Fisher Scientific 800 766-7000 www.fishersci.com Forestry Suppliers, Inc. P.O. Box 8397 Jackson, MS 39284-8397 www.forestry-suppliers.com Wildco 95 Botsford Place Buffalo, NY 14216-2696 800 799-8301 www.wildco.com YSI Incorporated 1725 Brannum Lane P.O. Box 279 Yellow Springs, OH 45387 (937) 767-7241 www.ysi.com
Laboratory Contacts: Edglo Laboratories 2121 E Washington Blvd Fort Wayne, Indiana 46803 (219) 424-1622 www.edglo.com Severn Trent Laboratories (formerly Quanterra Analytical Laboratories) 4955 Yarrow Street Arvada, CO 80002 (303) 736-0100 www.stl-inc.com
85

86
References Cited and Consulted [APHA] American Public Health Association, American Water Works Association, and Water Environment Federation. 1998. Standard methods for the examination of water and wastewater, 20th edition. Washington, DC. Art, H.W. [editor]. 1993. The dictionary of ecology and environmental science. New York: Henry Holt and Company, Inc. 632 p. Brower, J.E. and J.H. Zar. 1984. Field and Laboratory Methods for General Ecology. 2nd edition. Dubuque, Iowa: Wm. C. Brown Publishers. 226 p. Cole, G.A. 1979. Textbook of Limnology. 2nd edition. St. Louis: The C.V. Mosby Company. 426 p. Horne, A.J. and C.R. Goldman. 1994. Limnology, 2nd edition. New York:McGraw-Hill, Inc. 576 p. Krebs, C. J. 1989. Ecological Methodology. Harper & Row Publishers, New York. 654 pp. Lind, O.T. 1979. Handbook of common methods in Limnology. 2nd edition. St. Louis: The C.V. Mosby Company. 199 p. Smith, B.G. and A.P. Dufour. 1997. A modified mTEC medium for monitoring recreational waters. American Society for Microbiology Annual Meeting, 1997, May. Miami Beach, Florida. Sokal, R. R., and F. J. Rohlf. 1981. Biometry, 2nd Edition. W. H. Freeman and Company, New York. 859 pp. Wetzel, R.G. 1983. Limnology, 2nd edition. Orlando: Harcourt Brace Jovanovich. 767 p. Wetzel, R.G. and G.E. Likens. 1979. Limnological Analyses. Philadelphia: W.B. Saunders Company. 357 p. Whitman, R.L., M.B. Nevers, and P.J. Gerovac. 1999. Interaction of ambient conditions and fecal coliform bacteria in southern Lake Michigan beach waters: monitoring program implications. Natural Areas Journal 19(2): 166-171.
87
Index aphotic zone, 13 benthic macroinvertebrates
analyzing, 71 collecting, 55 defined, 19 importance, 29
biological analysis analyzed in-house, 36 contract laboratory, 36 cost, 36
biomass, 17 buffered formalin, 37 central limit theorem, 6 chemistry
analysis cost, 35 shipping samples, 60 using contract laboratory, 35
chlorophyll a, 48 defined, 18
community composition, 16 compensation depth, 13 core sampling, 30 data storage, 72 depth profile
collecting, 45 importance, 20
dimictic, 14 dimictic lake, 13 dissolved oxygen, 15 diversity, 16 E. coli
analyzing, 62, 63 collecting, 50 importance, 25
Ekman for sediments, 29 procedure, 55
electronic instruments field preparation, 37
electroshocking, 32 epilimnion, 13 equipment
cleaning and storing, 60 ethanol, 37 eutrophic, 18 fetch, 14 field equipment, 39 field notebook, 43 fish
fyke nets, 32 gill nets, 32 importance, 19 seining, 32
formalin, 37 fyke nets, 32 gill nets, 32 GPS, 44 Hensen-Stempel pipette, 70 hypolimnion, 13 inverse stratification, 14 Juday trap, 27 Kemmerer
for plankton, 27 water sampling, 23
labeling samples, 41 lake formation, 12 lake mixing, 13 limiting nutrient, 18 limnetic zone, 13 littoral zone, 13 Lugol’s solution, 36 meromictic, 14 metadata, 72 metalimnetic oxygen maximum, 15 metalimnion, 13 nanoplankton, 54
counting, 68 nitrogen, 16 non-native species, 58 oligotrophic, 18 paleolimnology, 30 Petersen
for sediments, 29 phosphorus, 16

photic zone, 13 phytoplankton
analyzing, 68 defined, 18 importance of sampling, 26
plankton, 26 plankton net, 27
metering, 27 using, 51
plankton tow, 51 polymictic, 14 ponar
defined, 29 procedure, 56
preparation for field sampling, 35 preservatives
for biological samples, 61 selection, 36 storage, 73
primary consumers, 17 primary producers, 17 processing biological samples, 62 pseudoreplication, 11 quality control
for benthic macroinvertebrates, 30 for depth profiles, 21 for plankton, 27 for sediment chemistry, 30 for water sampling, 24
random sampling, 9 replicate, 7 sampling order, 42 secchi disk
defined, 22 importance, 22
using, 44 secondary consumers, 17 Sedgwick-Rafter counting cell, 70 sediment chemistry
analysis, 57 importance, 29
seines, 32 selecting a sampling site, 34 shipping, 60 storing sampling equipment, 73 stratified, 13 stratified sampling, 10 surface horizontal tow, 51 trophic levels, 17 trophic status, 17 trophogenic zone, 13 tropholytic zone, 13 turnover, 13 VanDorn
for plankton, 27 water sampling, 23
vertical tow, 51 water chemistry
description, 15 importance, 23 sampling, 46
weather, 44 weighted bottle with a cork, 23 zebra mussels, 58 zooplankton
analyzing, 70 defined, 18 discrete depth sampling, 53 importance of sampling, 26
88