lake taupo long-term monitoring programme 2007-2008 · lake taupo long-term monitoring programme...
TRANSCRIPT

Environment Waikato Technical Report 2009/09
Lake Taupo long-term monitoring programme 2007-2008 www.ew.govt.nz ISSN 1172-4005 (Print) ISSN 1177-9284 (Online)

Prepared by: Max Gibbs, NIWA Hamilton For: Environment Waikato PO Box 4010 HAMILTON EAST May 2009

Doc # 1482686
Peer reviewed by: Bill Vant Date May 2009
Approved for release by: Dominique Noiton Date May 2009
Disclaimer This technical report has been prepared for the use of Waikato Regional Council as a reference document and as such does not constitute Council’s policy. Council requests that if excerpts or inferences are drawn from this document for further use by individuals or organisations, due care should be taken to ensure that the appropriate context has been preserved, and is accurately reflected and referenced in any subsequent spoken or written communication. While Waikato Regional Council has exercised all reasonable skill and care in controlling the contents of this report, Council accepts no liability in contract, tort or otherwise, for any loss, damage, injury or expense (whether direct, indirect or consequential) arising out of the provision of this information or its use by you or any other party.

Doc # 1482686
© All rights reserved. This publication may not be reproduced or copied in any form without the permission of the client. Such permission is to be given only in accordance with the terms of the client's contract with NIWA. This copyright extends to all forms of copying and any storage of material in any kind of information retrieval system.
Lake Taupo Long-Term Monitoring Programme 2007-2008 Max Gibbs
Prepared for
Waikato Regional Council (Environment Waikato) NIWA Client Report: HAM2009-044 March 2009 NIWA Project: EVW07210 National Institute of Water & Atmospheric Research Ltd Gate 10, Silverdale Road, Hamilton P O Box 11115, Hamilton, New Zealand Phone +64-7-856 7026, Fax +64-7-856 0151 www.niwa.co.nz

Contents Executive Summary iv Glossary 1 1. Introduction 2 2. Methods 4
2.1 Report contents 5 2.2 Statistical evaluation 5 2.3 “TREND” definition 5
3. Results and discussion 6 3.1 Temperature and dissolved oxygen 6 3.2 VHOD rate 7 3.3 Secchi depth 9 3.4 Phytoplankton 10 3.5 Algal species abundance 12 3.6 Nutrients in the upper waters 13 3.7 Nutrient accumulation in the hypolimnion 15 3.7.1 Total mass accumulated 15 3.7.2 Net accumulation rate 17 3.7.3 Total N 18
4. Knowledge gaps 20 5. Summary 21 6. Acknowledgments 23 7. References 24 8. Appendix 1: Site map, sampling strategy and methods 26
8.1 Methods 27 8.2 Data handling and less than detection limit values 29
8.3 Statistical methods 31 9. Appendix 2: The calculation of net VHOD rates 32 10. Appendix 3: Temperature and dissolved Oxygen data 36 11. Appendix 4: Nutrient data 57 12. Appendix 5: Phytoplankton data 82 13. Appendix 6: Historical data 90
Reviewed by: Approved for release by:
Dr Piet Verburg Dr John Quinn
Formatting checked
Lake Taupo Long-Term Monitoring Programme 2007-2008 iv
Executive Summary
With the expectation that the trophic status of Lake Taupo will slowly change to reflect changes in land use within the lake's catchments, a long term programme monitoring the lake's water quality was commissioned by Environment Waikato. This programme commenced in October 1994 and is conducted by NIWA with field assistance from the Department of Internal Affairs, Taupo Harbourmaster’s Office.
The monitoring programme was designed to detect change through assessment of the rate of consumption of oxygen from the bottom waters of the lake (volumetric hypolimnetic oxygen depletion – VHOD) as an integration of all biological processes occurring in Lake Taupo. Additional parameters are measured to provide a more comprehensive picture of water quality. Recently it has become apparent that VHOD may be too coarse to determine trophic change in a lake the size and complexity of Lake Taupo. Consequently, more emphasis is now focused on the parameters ‘phytoplankton biomass’, ‘water clarity’, and nutrient (particularly nitrate) accumulation in the lake. This report presents the results from the 2007/08 monitoring period at the mid-lake site, Site A. Monitoring of additional sites in the Kuratau Basin (Site B) and the Western Bays (Site C) between January 2002 and December 2004 determined that spatial variability of water quality across Lake Taupo is minimal and that it is valid to use the mid-lake site as representative of the open water quality of the lake.
There is a long-term trend of increasing phytoplankton biomass (chlorophyll a) in the upper 10 m of water column over the monitoring period of 0.03 ± 0.03 mg m-3 y-1. The winter 2007 chlorophyll a concentrations, at 2.2 mg m-3, were lower than in the previous winter bloom period. Of interest, the chlorophyll a concentration in September 2008 was 3.0 mg m-3. Regression analysis of maximum winter-spring chlorophyll a concentrations suggests that these have been increasing by 0.12 ± 0.05 mg m-3 y-1 since the start of this monitoring programme in 1994. As noted in the previous report, this trend may not be linear and concentrations may have reached a plateau. Before 2000, the mean of the winter chlorophyll a maximum concentration was 1.46 mg m-3 with an increasing trend of 0.18 mg m-3 y-1. After 2000, the mean of the winter chlorophyll a maximum concentration was 2.5 mg m-3 with no statistically significant trend or substantial change in the concentration data.
Highest phytoplankton biomass occurred in August when the lake had mixed and lowest biomass occurred in the upper water column in early summer when that winter biomass peak had settled from the water column onto the lake bed. Chlorophyll fluorescence profiles show that, each year, a deep chlorophyll maximum (DCM) develops just below the thermocline (40 m) during summer and has up to 70% higher biomass than the upper water column.
The 2007 winter bloom was initially dominated by the diatom Fragilaria crotonensis and then Asterionella formosa became dominant through spring. The colonial green, Botryococcus braunii, and the dinoflagellate, Gymnodinum sp., become dominant in summer and autumn 2008. Cyanobacteria

Lake Taupo Long-Term Monitoring Programme 2007-2008 v
(blue-green algae) were always present in low numbers in the upper water column throughout the 2007/2008 monitoring period, with Anabaena lemmermannii being the most common species but only at around 1% of the total biomass. There was an extended period from October 2007 to the end of February 2008 when algal biomass was very low.
Nutrient concentrations - dissolved reactive phosphorus, ammoniacal nitrogen, and nitrate nitrogen (DRP, NH4-N, and NO3-N) - in the upper water column were comparable with concentrations measured since 2003, although NO3-N concentrations were lower in winter 2007 than in previous years and elevated NH4-N concentrations were present in the upper water column through the summers and autumns of 2007 and 2008. The latter may indicate water column decomposition of the winter-spring bloom, or excretion from a zooplankton bloom.
The total mass of NO3-N in the hypolimnion before winter has increased at a statistically significant rate of about 7.9 t y-1 (P <0.002, r2 = 0.39, n = 21) over the last 33 years. The net accumulation rate of NO3-N in the hypolimnion below 70 m in 2007/2008 was 1.77 t d-1. Regression analysis showed that there has been a weakly significant trend of increase in the net NO3-N accumulation rate of 0.029 t d-1 each year (P <0.1, r2 = 0.15, n = 21) over the last 33 years.
Spring and summer 2007/2008 water clarity was the highest recorded for Lake Taupo, with values greater than 20 m from December 2007 to April 2008, reaching a maximum of 25 m on February 2008. This extreme clear-water phase coincided with a drought (declared officially) and thus may reflect the reduced nutrient input in surface runoff as well as a low input of sediment from erosion.
The 2007/08 net VHOD rate at 14.51 ± 2.94 mg O2 m-3 d-1 (mean ± 95% confidence limit) was almost 4 mg O2 m-3 d-1 higher than the previous year which was 10.74 ± 2.45 mg O2 m-3 d-1.
In the 2002 review of the long-term monitoring programme data, 3 trends in the data were identified — increasing phytoplankton biomass in the upper 10 m, increasing NO3-N mass in the hypolimnion prior to winter mixing, and an increasing range in the variability of water clarity — that were of concern with respect to the water quality of Lake Taupo. In previous reports, it was also shown that the net accumulation rate of NO3-N in the hypolimnion during the stratified period has increased over the last 33 years although the trend is not strong. These trends are still present in the data to 2008.

Lake Taupo Long-Term Monitoring Programme 2007-2008 1
Glossary
BOD Biochemical Oxygen Demand: the rate of oxygen consumption associated with biological decomposition and chemical processes and in the water column.
VHOD Volumetric Hypolimnetic Oxygen Demand: the net rate of oxygen loss associated with biological, chemical and physical processes in the hypolimnion of a lake in the absence of a temperature change
Phytoplankton Microscopic free-floating aquatic plants (algae)
Cyanobacteria
Blue-green algae. These are potentially toxic. They can adjust their depth in the water column using small gas bladders (gas vacuoles), and some species can use (i.e., fix) atmospheric nitrogen for growth when nutrient nitrogen in the water column is depleted.
Zooplankton Small to microscopic free-swimming aquatic animals which graze on phytoplankton or smaller zooplankton
Biomass The living mass of the phytoplankton or zooplankton populations
Thermal stratification Separation of a water column into two layers by temperature – warmer water on top
Thermocline The boundary zone or temperature gradient between the two layers in a thermally stratified water column.
Epilimnion The upper water column in a thermally stratified water column
Hypolimnion The lower water column in a thermally stratified water column
Metalimnion The thermocline zone — of variable thickness
Euphotic zone The upper water column in which there is sufficient light for photosynthesis and hence phytoplankton growth.
Euphotic depth Lower limit of phytoplankton growth where light levels are 1% of surface irradiance
Nutrients Essential dissolved inorganic nitrogen and phosphorus compounds which can be used directly by plants for growth
Ammoniacal nitrogen Sum of ammonium ion (NH4
+) plus free (unionised) ammonia (NH3). Some amines (NH2
-) may be included as interference during analysis. Symbol, NH4-N.
Nitrate nitrogen Used in this report as the sum of nitrate (NO3-) plus nitrite (NO2
-). Symbol, NO3-N.
DIN Dissolved Inorganic Nitrogen: the sum of NH4-N + NO3-N
DON Dissolved Organic Nitrogen: the soluble nitrogen other than DIN
PN Particulate Nitrogen: includes phytoplankton and other detritus
TN Total Nitrogen: Sum of DIN + DON + PN
NOx Gaseous oxides of nitrogen, including N2O, NO, NO2

Lake Taupo Long-Term Monitoring Programme 2007-2008 2
1. Introduction
A long term monitoring programme of Lake Taupo’s water quality was commissioned by Environment Waikato in October 1994 with the expectation that the trophic status of the lake will slowly change to reflect changes in land use within the lake's catchment. This programme is conducted by NIWA with field assistance from the Department of Internal Affairs, Taupo Harbourmaster’s Office. Various additions and improvements to the monitoring have occurred with advances in available technology (Appendix 1). This report presents data from the routine mid-lake monitoring station from August 2007 to July 2008. Additional information for water clarity, temperature, and chlorophyll a collected between August 2008 and the time of writing this report have also been included in the data sets in the appendix.
In two earlier reports, data was included from two additional sites representing those historically measured in the 1974-76 assessment of lake water quality (White et al. 1980) (Fig.1) to evaluate spatial variability of water quality across the lake. Results from these additional sites showed that, in general, there was minimal variation between the sites spatially or with season and that data collected from site A (mid lake) could be used as being representative of the main body of the lake. This report presents data from site A only.
The monitoring programme has 3 components: bottom water oxygen depletion, upper water column water quality, and whole water column water quality. Bottom water oxygen depletion is estimated as the volumetric hypolimnetic oxygen depletion (VHOD) rate, which is sensitive to changes in trophic status of lakes that thermally stratify for part of the year (Burns 1995). VHOD was chosen as the parameter most likely to detect a change in the water quality of Lake Taupo. Estimates of VHOD are made from dissolved oxygen and temperature profiles measured at 2-3 week intervals during the stratified period. However, the VHOD rate will only indicate that a change has occurred and will not detect other indicators of changing water quality. For that purpose, the upper water column is sampled for nutrients, chlorophyll a, phytoplankton species composition and water clarity at 2-3 weekly intervals, and the whole lake water quality is estimated from full profiles which are made twice during the stratified period. The first profile is in spring, when thermal stratification has become established and is stable. The second profile is in autumn the following year before thermal stratification begins to break down, and the thermocline deepens.

Lake Taupo Long-Term Monitoring Programme 2007-2008 3
Sampling sites
A
B
C
Sampling sites
A
B
C
Waikato River
Tongariro River
Tokaanu Tailrace
Horomatangi Reef
Figure 1: Site map of Lake Taupo showing location of the routine monitoring site at mid lake (A), and the two additional sites at Kuratau Basin (B) and the Western Bays (C) sampled during the three-year period 2002-04. The generally close agreement between most data from the three sites gives confidence in the past and future use of the site A data as representing the water quality of the whole lake.

Lake Taupo Long-Term Monitoring Programme 2007-2008 4
2. Methods
Detailed method descriptions are given in Appendix 1. The parameters measured routinely at 2-3 weekly intervals are:
• depth-related temperature and dissolved oxygen (DO), using the RBR XR420f CTD profiler until January 2008, then using the RBR XR620f CTD profiling system. Additional parameters of conductivity and chlorophyll fluorescence, and since January 2008, PAR, recorded by the profiler sensors are available at NIWA and will only be reported as appropriate;
• water clarity by Secchi disc depth (20-cm black and white quartered);
• chlorophyll a, nitrate+nitrite-nitrogen (NO3-N), ammoniacal-N (NH4-N), dissolved organic N (DON), particulate-N (PN), total nitrogen (TN), dissolved reactive phosphorus (DRP), dissolved organic phosphorus (DOP), particulate phosphorus (PP), total phosphorus (TP), and algal species dominance in integrated-tube water samples from the top 10 m. Zooplankton net hauls from 100 m (63μm mesh) are preserved in 4% formalin and stored pending analysis.
Since 2000, water samples have also been collected at the same time from just above the lake bed (150 m) for analysis of NO3-N, NH4 N, and DRP to assess nutrient accumulation rates in the hypolimnion and to assess the extent of winter mixing.
For whole water column sampling, the parameters measured at 10 m depth intervals from the surface to the bottom of the lake twice a year are:
• conductivity, pH, temperature, DO, chlorophyll a, DRP, DOP, PP, TP, NO3-N, NH4-N, DON, PN, TN, urea nitrogen (Urea-N), total suspended solids (SS), volatile suspended solids (VSS), particulate carbon (PC), and dissolved organic carbon (DOC).
Additional parameters measured twice yearly, but not as complete profiles were:
• algal species composition and abundance on water samples from 1, 10, 50, 100 and 140 m.

Lake Taupo Long-Term Monitoring Programme 2007-2008 5
Details of data handling and the treatment of values that are near analytical detection limits are described in Appendix 1.
2.1 Report contents
This report presents the results from the 2007/2008 stratified period plus the winter 2008 mixing, and refers to data in previous annual monitoring reports from 1995 to 2005 (Gibbs 1995, 1997a, 1997b, 1998, 2000a, 2000b, 2002, 2004, 2005, 2006, 2007, 2008; Gibbs et al. 2002) for inter-annual comparisons, and archived historical data since 1974 held by NIWA. The methods used are as per the 1994/95 report and a copy of these methods is included in Appendix 1. The calculation of the net VHOD rate, as applied to Lake Taupo data, was described in the 1996/97 report and a copy is presented in Appendix 2. Copies of temperature and dissolved oxygen, and nutrient data from the previous twelve years are included in Appendix 3 and 4 respectively. Graphical presentations of historical time-series temperature, dissolved oxygen, and Secchi disc depth data collected since the start of this monitoring programme are updated and presented in figures in the text. Phytoplankton species composition and dominance data for 2007/08 are included in Appendix 5 and discussed in the text. Graphical presentations of all available chlorophyll a concentration and Secchi depth water clarity data are presented where appropriate. Historical nitrate and dissolved reactive phosphorus data from spring and autumn full lake profiles are presented in Appendix 6 for reference.
2.2 Statistical evaluation
Simple statistical evaluation of data has been made using Microsoft Excel® and regression results have been reported to ± 95% confidence limits. Statistical significance (P), where used, is qualified with the coefficient of determination (r2) and the number of data points used (n). For details see Statistical Methods, Appendix 1.
2.3 “TREND” definition
As in previous reports, the word “trend” is used in the context of a change between the start and the end of a time series data set where the use of a linear regression analysis shows a statistically significant difference from the null hypothesis of there being no change. Use of the word “trend” is a statistical one. It does not imply any valid extrapolation of the observed change beyond the period of the data set being examined by the linear regression.

Lake Taupo Long-Term Monitoring Programme 2007-2008 6
3. Results and discussion
3.1 Temperature and dissolved oxygen
Depth profiles of temperature and dissolved oxygen (DO) were measured at the mid-lake site, Site A (Fig. 1), at about 2-3 weekly intervals, depending on the weather, throughout the year. These data, plus profiles measured during the full water quality samplings at Site A on 31 October 2007 (spring) and 18 April 2008 (autumn), are presented in Appendix 3. The time-series temperature and DO data from specific depths of 20 m (epilimnion) and 130 m (hypolimnion) collected in the monitoring programme since 1994 are presented in Figure 2.
Temperature and DO data indicate that Lake Taupo was well mixed in winter 2007 with the mixing period being from early August to early September. This produced minimal cooling in bottom waters compared with winter 2004 (Fig. 2A). The lake was also well mixed in winter 2008 from early August but on this occasion there was a rapid drop in bottom water temperature from 11.2 ºC to <10.7 ºC by early September. As was seen in the previous year, surface water temperatures in summer 2007/08 had an extended period above 18 ºC from January through to the beginning of April 2008.
10
12
14
16
18
20
22
1994 1995 1996 1997 1998 1999 2000 2001 2002 2003 2004 2005 2006 2007 2008 2009
Tem
pera
ture
(o C) 20 m
130 mA
Figure 2A: Time-series temperature from 20 m (black line) and 130 m (pink line) depths. Winter mixing occurred where these two lines meet. The data show the lack of mixing in winter 1998 and only partial mixing in 1999. Mixing was brief in 1997 and 2005.

Lake Taupo Long-Term Monitoring Programme 2007-2008 7
Despite years with incomplete mixing, the dissolved oxygen content of the hypolimnion has rarely fallen below 7.0 g m-3, even close to the sediment Fig. 2B). During winter mixing in 2007 and 2008 the bottom oxygen concentrations exceeded 10.0 g m-3 confirming the high degree of mixing (Fig. 2B). Conversely, bottom oxygen concentrations at the end of summer 2007/08 were at around 7.1 g m-3.
6
7
8
9
10
11
1994 1995 1996 1997 1998 1999 2000 2001 2002 2003 2004 2005 2006 2007 2008 2009
DO (g
m-3
)
20 m
130 m
B
Figure 2B: Time-series dissolved oxygen data from 20 m (black line) and 130 m (pink line) depths. Mixing and complete reoxygenation occurred where the 2 lines in the temperature data (Fig. 2A) meet each winter. This corresponds with the period that the 2 lines on the oxygen data should meet. However, where temperature data indicate incomplete mixing and the 2 lines of the oxygen data do not meet, there is incomplete reoxygenation of the hypolimnion. Date ticks are 1 January in each year.
3.2 VHOD rate
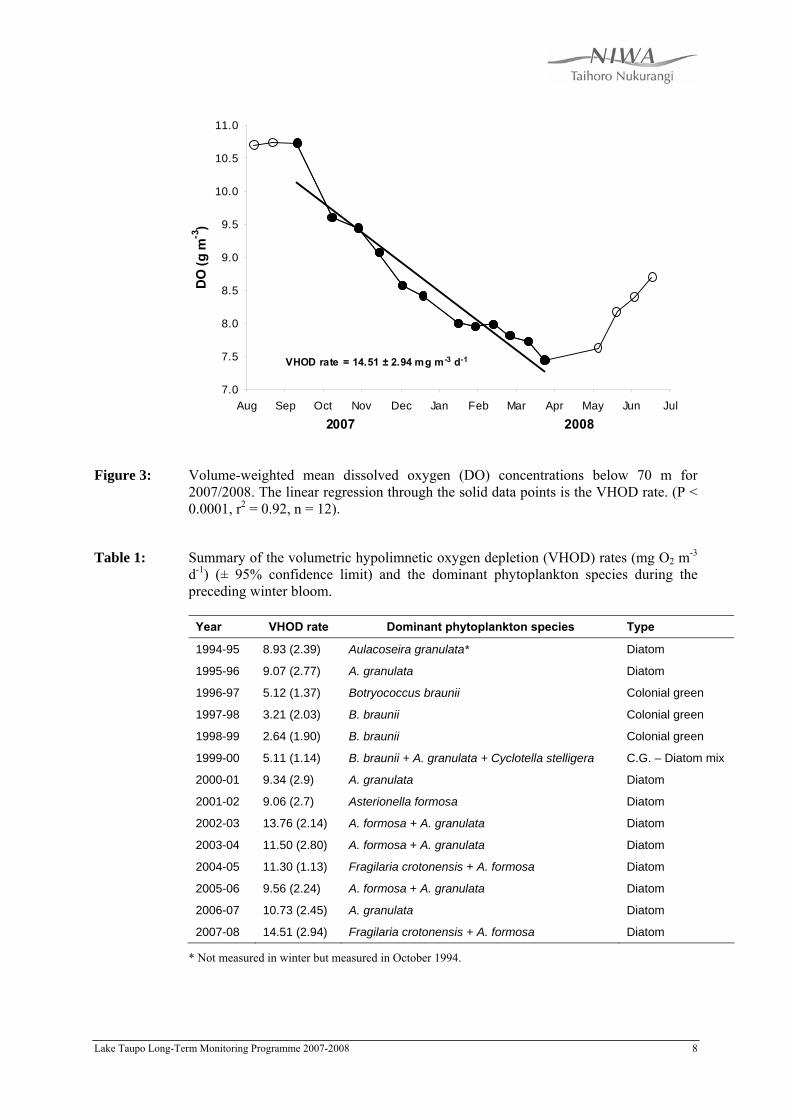
The VHOD rate was estimated between September 2007 and March 2008 based on oxygen profile data collected at site A (Mid Lake). VHOD calculations were made using the volume-weighted mean oxygen concentration below 70 m on each sampling occasion (Fig. 3) –see Appendix 2 for more detail. The VHOD rate in 2007/2008 was 14.51 ± 2.94 mg m-3 d-1 (mean ± 95% confidence limit) (Fig. 3). This value was almost 4 mg m-3 d-1 higher than the value for 2006/07 at 10.73 ± 2.45 mg m-3 d-1 (Table 1). This level of increase in VHOD implies a change in the carbon load on the lake, either from external inputs or primary production within the lake.
Lake Taupo Long-Term Monitoring Programme 2007-2008 8
7.0
7.5
8.0
8.5
9.0
9.5
10.0
10.5
11.0
Aug Sep Oct Nov Dec Jan Feb Mar Apr May Jun Jul
DO
(g m
-3)
VHOD rate = 14.51 ± 2.94 mg m-3 d-1
2007 2008
Figure 3: Volume-weighted mean dissolved oxygen (DO) concentrations below 70 m for 2007/2008. The linear regression through the solid data points is the VHOD rate. (P < 0.0001, r2 = 0.92, n = 12).
Table 1: Summary of the volumetric hypolimnetic oxygen depletion (VHOD) rates (mg O2 m-3 d-1) (± 95% confidence limit) and the dominant phytoplankton species during the preceding winter bloom.
Year VHOD rate Dominant phytoplankton species Type
1994-95 8.93 (2.39) Aulacoseira granulata* Diatom
1995-96 9.07 (2.77) A. granulata Diatom
1996-97 5.12 (1.37) Botryococcus braunii Colonial green
1997-98 3.21 (2.03) B. braunii Colonial green
1998-99 2.64 (1.90) B. braunii Colonial green
1999-00 5.11 (1.14) B. braunii + A. granulata + Cyclotella stelligera C.G. – Diatom mix
2000-01 9.34 (2.9) A. granulata Diatom
2001-02 9.06 (2.7) Asterionella formosa Diatom
2002-03 13.76 (2.14) A. formosa + A. granulata Diatom
2003-04 11.50 (2.80) A. formosa + A. granulata Diatom
2004-05 11.30 (1.13) Fragilaria crotonensis + A. formosa Diatom
2005-06 9.56 (2.24) A. formosa + A. granulata Diatom
2006-07 10.73 (2.45) A. granulata Diatom
2007-08 14.51 (2.94) Fragilaria crotonensis + A. formosa Diatom
* Not measured in winter but measured in October 1994.

Lake Taupo Long-Term Monitoring Programme 2007-2008 9
3.3 Secchi depth
The time-series Secchi depth data (Fig. 4) show that the annual cycle of water clarity is low in winter and high in summer, mostly within the range of 10 – 20 m and has a mean value of 16.2 m for the period shown. During this period very few Secchi depth values were less than 13 m, consistent with the higher mean value. The annual cyclical pattern inversely follows the seasonal pattern of phytoplankton abundance, with low clarity during the winter/spring growth phase and high clarity during summer when the phytoplankton have settled out of the epilimnion, which is depleted in plant growth nutrients at that time. The higher winter clarity suggests lower algal biomass in winter.
5
10
15
20
25
Jan Mar May Jul Sep Nov Jan Mar May Jul Sep Nov Jan Mar May Jul Sep Nov Jan Mar May Jul Sep Nov Jan
Secc
hi D
epth
(m)
20082005 2006 2007
Figure 4: Water clarity as indicated by Secchi disk depth from summer 2005 through to winter 2008. Dotted line represents 13 m. Date ticks are 1st of each month.
Water clarity in summer 2007/2008 was the highest recorded in Lake Taupo, with Secchi depth values over 20 m from December 2007 to April 2008, reaching a maximum of 25 m on February 2008. This extreme clear-water phase coincided with a drought (declared officially) and thus may reflect the reduced nutrient inputs resulting from expected lower stream flow and groundwater inflow, as well as low input of sediment from catchment erosion.
Of interest, there was another very clear period early summer 2008/2009 with values greater than 20 m and a maximum value of 22 m (Fig. 5). This high clarity period coincided with another warm calm period with low runoff. Observations at that time found that the upper water column was populated by large (2-3 mm) colonial algal species (Botryococcus braunii and Anabaena sp.) which allowed the Secchi disc to be seen through a greater depth than would be possible if the colonies were dispersed as individual cells.

Lake Taupo Long-Term Monitoring Programme 2007-2008 10
Long-term water clarity data from 1994 (Fig. 5) show that periods of high summer water clarity with Secchi depth >20 m, have only been seen since 2002 and that water clarity during this period has only once fallen below 10 m.
5
10
15
20
25
1994 1995 1996 1997 1998 1999 2000 2001 2002 2003 2004 2005 2006 2007 2008 2009
Secc
hi D
epth
(m)
Figure 5: Long-term changes in water clarity as indicated by Secchi depth shows the variability across seasons and years for the present monitoring programme since 1994. The broken lines mark 10 m and 20 m. Date ticks are 1 January in each year.
3.4 Phytoplankton
The long-term trend of increasing chlorophyll a concentration in the upper 10 m of the water column at the mid-lake site has continued, with increased concentrations in both winter 2007 and summer 2008. The mean rate of increase [all data] was 0.025 ± 0.017 mg m-3 y-1 (P < 0.005, r2 = 0.033, n = 237) (Fig. 6).
The overall pattern of chlorophyll a concentration changes since 1994 is one of maximum concentrations during the winter algal bloom and minimum concentrations in summer and, as expected, there is a statistically significant inverse logarithmic relationship between chlorophyll a concentration and Secchi disk depth as discussed in the 2004/05 report (Gibbs 2006).
In Gibbs (2007), it was suggested that the relatively low maximum chlorophyll a concentrations in winter and spring 2005 resulted from incomplete mixing in winter 2005 while the subsequent very high chlorophyll a concentrations in winter-spring 2006 could be attributed to a carry over of nutrients from the previous year being assimilated into algal biomass. However, the low chlorophyll a concentrations in winter and spring 2007 were not associated with incomplete mixing and consequently, the very high chlorophyll a concentrations in winter-spring 2008 cannot be attributed to nutrient carry over from the previous year.

Lake Taupo Long-Term Monitoring Programme 2007-2008 11
0.0
0.5
1.0
1.5
2.0
2.5
3.0
1994 1995 1996 1997 1998 1999 2000 2001 2002 2003 2004 2005 2006 2007 2008 2009
Chlo
roph
yll a
(mg
m-3
)
Figure 6: Time-series chlorophyll a concentrations in the upper 10 m of Lake Taupo at the mid-lake site, Site A. The solid regression line represents a statistically significant increase in the mean chlorophyll a concentrations of 0.025 ± 0.017 mg m-3 y-1 (P < 0.005, r2 = 0.03, n = 237). Date ticks are 1 January in each year. Chlorophyll a detection limit = 0.1 mg m-3.
Evaluation of the chlorophyll a data on a seasonal basis shows that the winter maximum concentrations have increased at 0.12 ± 0.05 mg m-3 y-1 (r2 = 0.65, n = 15) since 1994 (Fig. 7), which is the same as reported the previous year, but with a higher r2 value. Conversely, the annual mean concentration increase at 0.03 ± 0.03 mg m-3 y-1 (r2 = 0.33, n = 15) is lower than reported the previous year with a lower r2 value.
In Gibbs (2008) it was suggested that the increase in chlorophyll a concentration may not be continuous as implied by a linear regression through all the data. From 1994 to 1999, inclusive, the mean winter maximum chlorophyll a concentration was 1.46 mg m-3 and chlorophyll a concentrations were increasing at the rate of about 0.18 mg m-3 y-1 (r2 = 0.51, n = 7, P = 0.07). From 2000 to 2008, the mean winter maximum chlorophyll a concentration was 2.5 mg m-3, unchanged from the previous report, and regression analysis showed that there was no statistically significant trend in the data. Similarly there has been little change in the mean summer minimum chlorophyll a concentration data since 2000 although there is a weakly significant trend of decrease by about 0.07 mg m-3 y-1 (r2 = 0.484, n = 9, P <0.03). This trend of declining chlorophyll a, and thus low algal biomass, in summer is consistent with the increased water clarity in summer, although it may not be the only contributing factor.

Lake Taupo Long-Term Monitoring Programme 2007-2008 12
0.0
0.5
1.0
1.5
2.0
2.5
3.0
1994 1995 1996 1997 1998 1999 2000 2001 2002 2003 2004 2005 2006 2007 2008
Chl
orop
hyll
a (m
g m
-3)
Winter MaximaAnnual average
= 0.12 + 0.05 mg m-3 yr-1, r2 = 0.65, n = 15
= 0.03 + 0.03 mg m-3 yr-1, r2 = 0.33, n = 15
Rate of Increase
Figure 7: Annual average and winter maximum chlorophyll a concentrations from the 10-m tube samples since 1994. Regression lines indicate significant (P<0.01) trends in the data. Regression slopes are as given in the graph. Date ticks are 1 January in each year.
The monitoring programme uses the chlorophyll a concentrations as an indicator of algal biomass in the upper 10 m because surface layer chlorophyll a concentrations can be directly related to water clarity as indicated by Secchi depth. However, the use of the profiler fitted with a chlorophyll fluorescence sensor indicates that a large proportion of the algal biomass in Lake Taupo through spring and summer is associated with the base of the thermocline (40 m) as a deep chlorophyll maxima (DCM) with a potential biomass about 70% greater than that in the 0-to-10 m layer, as demonstrated in Gibbs (2007). The DCM was present throughout the spring-summer phase of the 2007/08 stratified period with chlorophyll fluorescence values comparable with previous years.
3.5 Algal species abundance
In the 2007-08 monitoring period, there were 4 major algal species which consistently reached a dominance1 level of 1 to 3 (1 = dominant, 10 = rare) at Site A. The 2007 winter bloom was initially dominated by the diatom Fragilaria crotonensis and then Asterionella formosa became dominant through spring. The colonial green, Botryococcus braunii, and dinoflagellates, Gymnodinum sp., become dominant in summer and autumn 2008. Cyanobacteria were present on most occasions at low
1 Algal dominance is estimated from biovolume rather than cell counts

Lake Taupo Long-Term Monitoring Programme 2007-2008 13
levels with Anabaena lemmermannii being the most abundant but never reaching a dominance value of 3.
Samples taken from the DCM on 30 October 2007 and 17 April 2008 comprised mostly species similar to those in the surface layer suggesting that the water column was being less vigorously mixed at those times thus allowing settling.
3.6 Nutrients in the upper waters
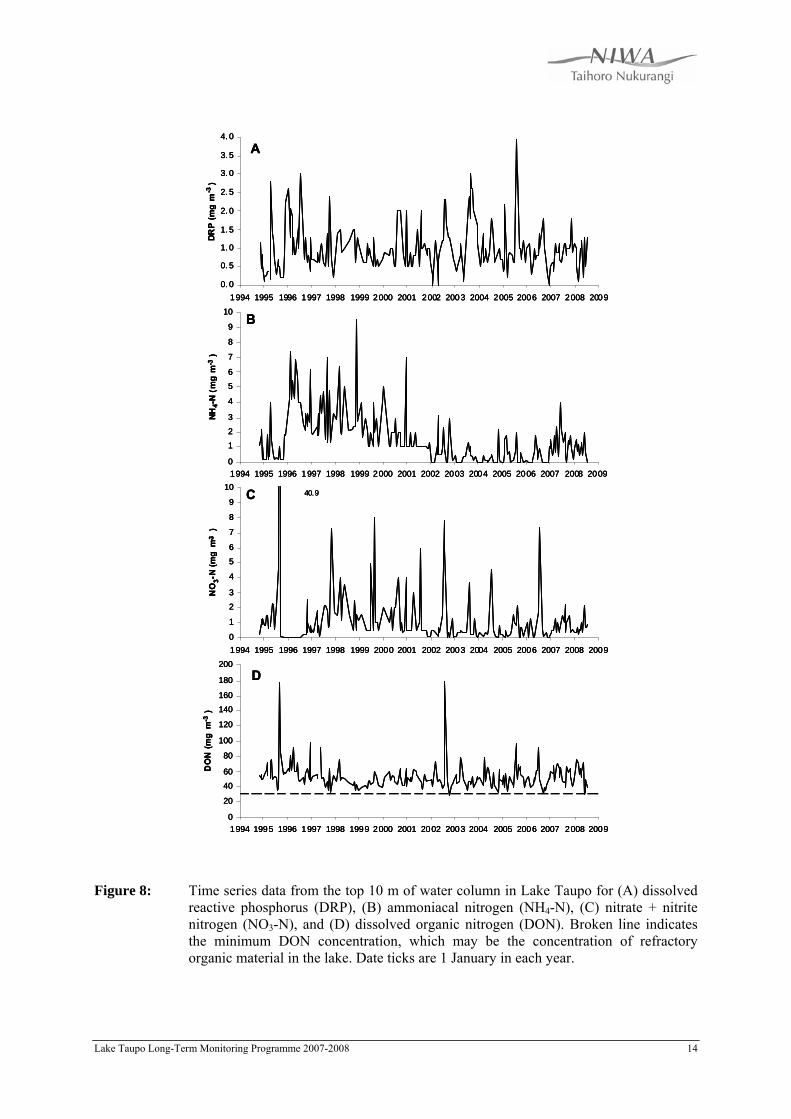
Time-series plots of DRP (Fig. 8A), NH4-N (Fig. 8B), NO3-N (Fig. 8C) and DON (Fig 8D), show that the 2007/2008 values were within the seasonal range measured over the whole period of the present monitoring programme since 1994. As previously noted (Gibbs 2006), nutrient concentrations changed abruptly at the time of the Mount Ruapehu eruptions in 1995 and slowly returned to pre-eruptions levels by 2003 (Fig. 8). Since 2003, fluctuations in the surface NO3-N and NH4-N (Fig. 9) have mostly corresponded with winter mixed periods when nutrient enriched bottom waters (Fig. 10) were dispersed up through the lake’s water column.
A feature of the nutrient data since the beginning of 2007 has been the relatively elevated NH4-N concentrations in the upper water column (Fig. 9). While NH4-N usually occur in the surface water at the time of winter mixing and can be attributed to upwelling of nutrient-rich bottom water, these elevated NH4-N concentrations cannot be linked to an upwelling event. Consequently, it may be related to water column decomposition of senescing phytoplankton or excretion by zooplankton feeding on those algae. This would be consistent with the exceptionally high water clarity in the last few summers.
Lake Taupo Long-Term Monitoring Programme 2007-2008 14
0. 0
0. 5
1. 0
1. 5
2. 0
2. 5
3. 0
3. 5
4. 0
1994 1995 1996 1997 1998 1999 2000 2001 2002 2003 2004 2005 2006 2007 2008 2009
DRP
(mg
m-3
)
A
0
1
2
3
4
5
6
7
8
9
10
1994 1995 1996 1997 1998 1999 2000 2001 2002 2003 2004 2005 2006 2007 2008 2009
NH4-
N (m
g m
-3 )
B
0
1
2
3
4
5
6
7
8
9
10
1994 1995 1996 1997 1998 1999 2000 2001 2002 2003 2004 2005 2006 2007 2008 2009
NO
3-N
(mg
m-3
)
C 40.9
0
20
40
60
80
100
120
140
160
180
200
1994 1995 1996 1997 1998 1999 2000 2001 2002 2003 2004 2005 2006 2007 2008 2009
DO
N (m
g m
-3 )
D
Figure 8: Time series data from the top 10 m of water column in Lake Taupo for (A) dissolved reactive phosphorus (DRP), (B) ammoniacal nitrogen (NH4-N), (C) nitrate + nitrite nitrogen (NO3-N), and (D) dissolved organic nitrogen (DON). Broken line indicates the minimum DON concentration, which may be the concentration of refractory organic material in the lake. Date ticks are 1 January in each year.

Lake Taupo Long-Term Monitoring Programme 2007-2008 15
0
1
2
3
4
5
2003 2004 2005 2006 2007 2008 2009
(mg
m-3 )
DRPNO3NH4
Figure 9: Time series data from the top 10 m of water column in Lake Taupo for dissolved reactive phosphorus (DRP), nitrate + nitrite nitrogen (NO3-N) and ammoniacal nitrogen (NH4-N) since January 2003. The elevated NH4-N concentrations in autumn 2007 and 2008 may be due to water column decomposition of organic matter or zooplankton excretion. Date ticks are 1 January in each year.
3.7 Nutrient accumulation in the hypolimnion
3.7.1 Total mass accumulated
Dissolved inorganic nutrients in water samples from 150 m demonstrated consistent seasonal patterns which more precisely indicate the time of complete mixing in winter (Fig. 10). Winter mixing was indicated by the sudden drop in DRP and NO3-N concentrations that usually occurs around the beginning of August 2007 and 2008. Hypolimnetic NO3-N concentrations before winter mixing have been consistent at around 32-35 mg m-3 from 2004 to 2007, after declining from around 46 mg m-3 in 2001. The hypolimnetic NO3-N concentration reached around 38 mg m-3 before winter mixing in 2008. At each mixing period, NH4-N is released into the bottom water (Fig. 10), but its maximum concentration has decreased from around 9 mg m-3 in 2001 to around 3-4 mg m-3 in winter 2008. The source of this NH4-N is not known.

Lake Taupo Long-Term Monitoring Programme 2007-2008 16
0
5
10
15
20
25
30
35
40
45
50
J J ASONDJ FMAMJ J ASONDJ FMAMJ J ASONDJ FMAMJ J ASONDJ FMAMJ J ASONDJ FMAMJ J ASOND
NO
3-N
(mg
m-3
)
0
2
4
6
8
10
12
14
DRP
, NH
4-N
(mg
m-3
)
NO3-N
DRP
NH4-N
2003 2004 2005 2006 2007 2008
Figure 10: Time series data for DRP (blue square), NO3-N (red diamond) and NH4-N (black triangle) in the bottom waters of Lake Taupo since winter mixing 2003.
0
100
200
300
400
500
600
700
1970 1975 1980 1985 1990 1995 2000 2005 2010
NO
3-N (t
onn
es)
7.9 t y-1
Figure 11: Long-term time series of total mass of NO3-N in the hypolimnion of Lake Taupo in autumn before winter mixing. The regression line indicates a statistically significant trend of increase in the total mass of 7.9 t y-1 (P <0.002, r2 = 0.39, n = 21). Open circle data excluded from regression as time periods and depth data were not the same as used for the other data. Date ticks are 1 January in each year.

Lake Taupo Long-Term Monitoring Programme 2007-2008 17
The total mass 2 of NO3-N in the hypolimnion in autumn each year before winter mixing has ranged from about 120 t (1978) to more than 650 t (2000) (Fig. 11). While this graph is similar to those in earlier reports, this graph also includes all additional information from historical data sets held by NIWA. A copy of the historical source data used to produce the additional data points from 1988 to 1990 is included in Appendix 6. Including the additional historical data, since 1975 there has been a statistically significant (P <0.002, r2 = 0.39, n = 21) long-term trend of increase in the total mass of NO3-N in the hypolimnion before winter mixing of around 7.9 t y-1 (Fig. 11). The total mass of NO3-N in the hypolimnion in April 2008 was around 380 t.
3.7.2 Net accumulation rate
While the total mass of NO3-N in the hypolimnion is a “standing stock” before winter mixing, it is recognised that the standing stock is a function of the mass of NO3-N in the hypolimnion at the beginning of the stratified period plus the net mass that was released from the sediments and accumulated in the hypolimnion during the stratified period. While the standing stock is the mass present at one time, the mass released from the sediments over the stratified period can be expressed as a rate which may give a more reliable estimate of change.
To determine the net accumulation rate of NO3-N in the hypolimnion, the total mass data (Fig. 11) have been transformed into accumulation rate data by subtracting the spring profile data from the autumn profile data and dividing by the number of days between the spring and autumn samplings (Fig. 12).
As sediment process rates are generally slow to change, the expectation would be for a reasonably consistent pattern to the net accumulation rates between years allowing any trends to be well defined. A regression through all of these rate data (Fig. 12) shows a weakly significant trend in the data with the net accumulation rate increasing at 0.029 t d-1 each year (P <0.1, r2 = 0.15, n = 21) over the 33 year data record. The data for 1976 and 1987 were excluded from the regression analysis because they are for different periods than the rest of the data (see also Fig. 11). The data points are included in Figure 12 as an indication of what the net accumulation rates may have been in those two years.
The net accumulation rates of NO3-N (Fig. 12) show a higher degree of variability between years than would be normally expected, with both the 1999 and 2006 data points falling well below the spread of the rest of the data and the trend line. The
2 In earlier reports the total mass of NO3-N in the hypolimnion each year has been referred to as the “total accumulated mass” of NO3-N. It is the “standing stock” of NO3-N at that time.

Lake Taupo Long-Term Monitoring Programme 2007-2008 18
negative net accumulation rate in 2006 indicates a substantial loss of NO3-N from the hypolimnion during the 2005-06 stratified period. Both of these data points are for years following a winter where there was incomplete mixing. This suggests that the low values are anomalies relative to the rest of the data. The effect of incomplete mixing was discussed in a previous report (Gibbs 2007). The net accumulation rate for the 2007/2008 period was 1.77 t d-1, which was almost the same as the previous year at 1.78 t d-1, with data from both years falling very close to the trend line (Fig. 12).
-0.5
0.0
0.5
1.0
1.5
2.0
2.5
3.0
1970 1975 1980 1985 1990 1995 2000 2005 2010
Net
NO 3
-N a
ccum
ulat
ion
rate
(t d
-1)
Figure 12: Net NO3-N accumulation rates (t d-1) in the hypolimnion below 70 m. The regression line shows an increase in the net accumulation rate of 0.029 t d-1 (P <0.1, r2 = 0.15, n = 21). Open circle data were not included in the regression analysis (see text). Note that the Y-axis extends to -0.5 t d-1 for the 2006 data point. Date ticks are 1 January in each year.
3.7.3 Total N
Total nitrogen (TN) mass in Lake Taupo was estimated from the spring profile in each year. Regression analysis found that, although there was an average increase of about 10 t y-1 over the data record, there was no statistically significant trend in the long-term time-series data for TN (Fig. 13). Coincidentally, the average increase of about 10 t TN y-1 is essentially the same as the average increase in the mass of NO3-N in the hypolimnion. Although there is obvious inter-annual variability in the mass of TN in

Lake Taupo Long-Term Monitoring Programme 2007-2008 19
spring, after winter mixing, and there is a net annual external TN load on the lake of around 1200 t, the total mass of TN in Lake Taupo remains at around 3300 t. The estimate for spring 2007 was 3540 t.
0
1000
2000
3000
4000
5000
6000
1975 1980 1985 1990 1995 2000 2005 2010
TN (t
onne
s)
Figure 13: Long-term time series estimates of the mass of total nitrogen (TN) in Lake Taupo in spring after winter mixing. Although there is an average increase of about 10 t y-1 over the data record, this apparent trend in the data is not statistically significant. The mean of the mass is around 3370 t. Date ticks are 1 January in each year.

Lake Taupo Long-Term Monitoring Programme 2007-2008 20
4. Knowledge gaps
An earlier report (Gibbs 2006) commented on several knowledge gaps including in-lake processes in Lake Taupo, and process rates at the sediment-water interface. This report presents estimates of the net rate of NO3-N accumulation in the hypolimnion during the stratified period. The low NO3-N accumulation rate in the 2005/2006 stratified period following incomplete mixing in winter 2005, and the immediate return of the net accumulation rate to the trend in the net rate data the following year, points to water column processes being as important as sediment processes for controlling NO3-N concentrations and highlights the need to understand how the in-lake processes work.
Despite a net input of TN to the lake of 1200 t y-1, representing around a third of the average mass of N in the lake, there is no apparent increase in the TN in the lake (Fig. 13). In addition, the total mass of NO3-N in the hypolimnion just before winter mixing each year appears to reach a plateau (see shape of NO3-N concentration curves Fig. 10). Together these data suggest that processes at the sediment-water interface and elsewhere in the hypolimnion are capable of sequestering very large amounts of N each year. However, as the net accumulation rate of NO3-N in the hypolimnion is increasing, this suggests that the sediment processes of nitrogen burial, decomposition, mineralisation, nitrification, and denitrification are changing.
We have little or no information on any of these N transformation and sequestration process rates.
The appearance of free NH4-N along with free DRP in the upper water column during late spring and summer in 2007 and 2008 is unusual as these nutrients would be expected to be rapidly taken up by phytoplankton growth. The source of that NH4-N is unknown.
This report has also shown that both the mean annual water clarity and the mean annual chlorophyll a concentrations in the upper 10 m of water column have increased significantly since 1994. These parameters are usually inversely related and thus other factors must be influencing the observed increases. Note, the deep chlorophyll maximum, which may account for more than 70% of the algal biomass in Lake Taupo, is not being assessed.

Lake Taupo Long-Term Monitoring Programme 2007-2008 21
5. Summary
• The annual mean chlorophyll a concentration in the upper 10 m of water column in Lake Taupo, as an indicator of phytoplankton biomass, has increased at a rate of 0.03 ± 0.03 mg m-3 y-1 (P < 0.01, r2 = 0.33, n = 15) over the 14 year monitoring period.
• Winter chlorophyll a maximum concentrations have increased at 0.12 ± 0.05 mg m-3 y-1 (r2 = 0.65, n = 15) since 1994. Peak chlorophyll a concentrations in winter are highly variable with a value of 2.2 mg m-3 in 2007 compared with 2.8 mg m-3 in 2006, and 3.0 mg m-3 in 2008.
• The trend of increase in the winter chlorophyll a maximum concentrations may not be linear and concentrations may have reached a plateau. Before 2000, mean winter chlorophyll a maximum concentrations were 1.46 mg m-3 with an increasing trend of 0.18 mg m-3 y-1 (r2 = 0.51, n = 7, P = 0.07). After 2000, mean winter chlorophyll a maximum concentrations, including the 2007 data, were 2.5 mg m-3 with no statistically significant trend in the data.
• There is a substantial deep chlorophyll maxima (DCM) below the thermocline (40 m) in the lake during spring and summer with an estimated chlorophyll a concentration about 70% higher than the chlorophyll a concentrations measured in the upper 10 m. The DCM was present through the 2007/08 spring and summer period.
• Algal species dominance followed a succession from the diatom Fragilaria crotonensis in winter 2007 to Asterionella formosa, which became dominant through spring, to the colonial green, Botryococcus braunii, and some large dinoflagellates, Gymnodinum sp., which became dominant in summer and autumn 2008. Cyanobacteria (blue-green algae) were always present in low numbers in the upper water column throughout the 2007/2008 monitoring period, with Anabaena lemmermannii being the most common species but only at around 1% of the total biomass. There was an extended period from October 2007 to the end of February 2008 when algal biomass was very low.
• Algae collected from the DCM in October 2007 and April 2008 were low in biomass and numbers and were similar in composition to the surface species which may have settled in calm weather.

Lake Taupo Long-Term Monitoring Programme 2007-2008 22
• There was a statistically significant trend of increase in the total mass of NO3 N in the hypolimnion before winter mixing of around 7.9 t yr-1 (P <0.002, r2 = 0.39, n = 21). This increase is comparable with the non-statistically significant increase in whole Lake TN of about 10 t y-1. While not directly linked, following winter mixing the accumulated NO3-N in the hypolimnion in autumn stimulates algal growth which contributes to the TN measured in spring.
• The net accumulation rate of NO3-N in the hypolimnion below 70 m in the last few years has been in the order of 2 t d-1 and regression analysis showed that there has been a weakly significant trend of increase in that rate of 0.029 t d-1 each year (P <0.1, r2 = 0.15, n = 21) over the last 33 years. The net accumulation rate of NO3-N in 2007/08 was 1.77 t d-1 which was comparable with the 2006/07 rate of 1.78 t d-1.
• The net accumulation rates of NO3-N in the hypolimnion in 1999 and 2006 were much lower than the trend and the data indicate that there was a net loss of NO3-N from the hypolimnion in 2006. As sediment release should have been positive and is unlikely to change rapidly, these apparent anomalies point to water column processes in the hypolimnion being of similar importance to sediment processes in controlling NO3-N dynamics.
• The 2007/2008 net VHOD rate for the period from September 2007 to March 2008 was 14.51 ± 2.94 mg m-3 d-1 (mean ± 95% confidence limit) which was almost 4 mg m-3 d-1 higher than the previous year at 10.73 ± 2.45 mg m-3 d-1.
• Nutrient concentrations (DRP, NH4-N, and NO3-N) in the upper water column were generally comparable with concentrations since 2003 and are similar to historical concentrations before Mount Ruapehu erupted in 1995. However, in both 2006/07 and 2007/08, there have been elevated NH4-N but low NO3-N concentrations in the upper water column through summer and autumn.
• Bottom water temperatures gradually rose to 11.2 ºC just before winter mixing at the beginning of August 2008, then fell rapidly to 10.7 ºC a month later.
• Water clarity during summer 2007/08 was the highest recorded for Lake Taupo with Secchi depth values over 20 m from December 2007 to April 2008, reaching a maximum of 25 m on February 2008.

Lake Taupo Long-Term Monitoring Programme 2007-2008 23
• This extremely high water clarity may be attributed to the extended period of calm weather and very low surface run-off and generally low freshwater inputs during the drought contributing less plant growth nutrients and sediment to the lake than in previous years.
In a previous annual report (Gibbs et al. 2002), 3 trends in the data were identified — increasing phytoplankton biomass in the upper 10 m, increasing NO3-N mass in the lake hypolimnion prior to winter mixing, and an increasing range in the variability of water clarity — that were of concern with respect to the water quality of Lake Taupo. In the previous report, it was also shown that the net accumulation rate of NO3-N in the hypolimnion during the stratified period has increased over the last 33 years, although the trend was not strong.
These trends in the data are still present.
6. Acknowledgments
This report was made possible by the team effort of Les Porter and Brent McIntosh of the Taupo Harbourmaster’s Office, and Eddie Bowman (NIWA Rotorua) who have collected the data. Much of the success of this monitoring programme is attributable to the extra effort by Eddie and the team.
Water samples were processed in the NIWA chemistry laboratory and analytical results were provided by Graham Bryers, Denise Rendle, Stu Pickmere and team. Quality control was provided by Mike Crump, Lab Manager.
Phytoplankton dominance and enumeration results were provided by Karl Safi.
Lake Taupo Long-Term Monitoring Programme 2007-2008 24
7. References
Burns, N.M. (1995). Using hypolimnetic dissolved oxygen depletion rates for monitoring lakes. New Zealand Journal of Marine and Freshwater Research 29: 1-11.
Gibbs, M.M. (1995). Lake Taupo long term monitoring programme. NIWA consultancy report to Environment Waikato, report No. EVW60203/1.
Gibbs, M.M. (1997a). Lake Taupo long term monitoring programme: 1995-1996. NIWA consultancy report to Environment Waikato, report No. EVW60203/2.
Gibbs, M.M. (1997b). Lake Taupo long term monitoring programme: 1996-1997. NIWA consultancy report to Environment Waikato, report No. EVW60203/4.
Gibbs, M.M. (1998). Lake Taupo long term monitoring programme: 1997-1998. NIWA consultancy report to Environment Waikato, report No. EVW80203.
Gibbs, M.M. (2000a). Lake Taupo long term monitoring programme: 1998-1999. NIWA consultancy report to Environment Waikato, report No. EVW90203.
Gibbs, M.M. (2000b). Lake Taupo long term monitoring programme: 1999-2000. NIWA consultancy report to Environment Waikato, report No. EVW01203.
Gibbs, M.M.; Rutherford, J.C.; Hawes, I. (2002). Lake Taupo long term monitoring programme 2000 – 2001, with a review of accumulated data since 1994. NIWA consultancy report to Environment Waikato, report No. HAM2002-029, August.
Gibbs, M.M. (2002). Lake Taupo long term monitoring programme 2001-2002: including two additional sites. NIWA consultancy report to Environment Waikato, report No.HAM2002-060, December.
Gibbs, M.M. (2004). Lake Taupo long term monitoring programme 2002-2003: including two additional sites. NIWA consultancy report to Environment Waikato, report No.HAM2004-001, March.
Gibbs, M.M. (2005). Lake Taupo long term monitoring programme 2003-2004: including two additional sites. NIWA consultancy report to Environment Waikato, report No.HAM2005-006, February.

Lake Taupo Long-Term Monitoring Programme 2007-2008 25
Gibbs, M.M. (2006). Lake Taupo long term monitoring programme 2004-2005: including two additional sites. NIWA consultancy report to Environment Waikato, report No.HAM2006-033, May.
Gibbs, M.M. (2007). Lake Taupo long term monitoring programme 2005-2006. NIWA consultancy report to Environment Waikato, report No.HAM2007-029, March.
Gibbs, M.M. (2008). Lake Taupo long term monitoring programme 2006-2007. NIWA consultancy report to Environment Waikato, report No.HAM2008-029, March.
Utermöhl, von H. (1931) Neue Wege in der quantitativen Erfassung des Planktons. (Mit besondere Beriicksichtigung des Ultraplanktons). Verh. Int. Verein. Theor. Angew. Limnol. 5: 567–595.
Vincent, W.F. (1983). Plankton production and winter mixing: contrasting effects in two oligotrophic lakes. Journal of Ecology 71: 1-20.
White, E.; Downes, M.; Gibbs, M.; Kemp, L.; Mackenzie, L. & Payne, G. (1980). Aspects of the physics, chemistry, and phytoplankton biology of Lake Taupo. New Zealand Journal of Marine and Freshwater Research 14(2): 139-148.

Lake Taupo Long-Term Monitoring Programme 2007-2008 26
8. Appendix 1: Site map, sampling strategy and methods
Lake monitoring sites were originally established using land-based markers (Fig.1). These have now been defined using GPS and corrected for curvature using WGS84 convention.
Site Map
6240000
6245000
6250000
6255000
6260000
6265000
6270000
6275000
6280000
6285000
2745000 2750000 2755000 2760000 2765000 2770000 2775000 2780000 2785000
A
C
B
Ju st ope n clif fs andWaih ah a River m ou th
Kuratau River m out h
Trig at s cru b/p as ture b oun dary
Vertical e dg e o f h eadland
Steam plu me from Fle tchers bo re s
Rangatira Po int
Transit lines for sampling sites
150 m
110 m
100 m
NZMG Coordinates (WGS84)
Site A: 2768101.95 6265248.87Site B: 2752476.92 6252097.10Site C: 2755955.48 6271420.07
Figure 1: Site map of Lake Taupo showing location of the routine monitoring site at mid lake (A). Two additional sites at Kuratau Basin (B) and the Western Bays (C) were sampled between January 2002 and December 2004 inclusive. Data from those sites have been retained with the Site A data presented in the appendices. Map coordinates are in NZ Map Grid with WGS84 correction. Lat. Long WGS 84 corrected co-ordinates of "Site A" are 38° 46'.810 S; 175° 58'.440 E.

Lake Taupo Long-Term Monitoring Programme 2007-2008 27
The following section has been copied from Gibbs 1995, and modified after 1998.
8.1 Methods
The sampling site was selected in the central basin of Lake Taupo (Site Map) with a water depth of about 160 m. This site is more than 5 km from the nearest land and is exposed to both the north-south and east-west axis of the lake.
To calculate VHOD requires two measurements each year far enough apart in time for a measurable change to occur in the DO concentrations in the hypolimnion of the lake. Details of the procedure and limitations of this measurement are described by Vant (1987). For the monitoring of Lake Taupo, which mixes briefly in winter between July and August, the initial sampling time was selected to be in October, to give sufficient time for thermal stratification to establish a stable hypolimnion. The final sampling time was selected to be in April, before lake cooling causes the downward movement of the thermocline which precedes the winter mixing.
At each of these biannual samplings, a detailed profile of DO and temperature was measured. Prior to 1998, measurements were made at 1 m depth intervals through the full depth of the water column using an in situ recording Applied Microsystems STD-12 profiler fitted with a Royce DO sensor, and compared with manual measurements of DO and temperature made at 10 m depth intervals from the surface to the bottom of the lake using a Yellow Springs Instrument (YSI) model 58 dissolved oxygen meter fitted with a stirred Model 5739 probe on a 160 m cable. Subsequent to 1998, a Richard Brancker Research (RBR) model TD410 conductivity-temperature-depth (CTD) profiler fitted with a stirred YSI model 5739 DO sensor was used. In January 2002, the TD410 CTD profiler was upgraded to an RBR model XR420f freshwater CTD profiler fitted with the YSI model 5739 DO sensor and a Seapoint chlorophyll fluorescence probe. The DO sensor was calibrated regularly by NIWA, Rotorua staff and chlorophyll fluorescence was converted to chlorophyll a from extracted chlorophyll a analyses of water samples collected beside profiler.
In January 2008, the XR420f profiler was upgraded to a RBR model XR620f freshwater profiler/logger with improved sensitivity. The new profiler is fitted with a Sea Point chlorophyll fluorescence probe and a Li-Cor underwater photosynthetically active radiance (PAR) sensor to measure in situ light levels and light extinction (Kd) associated with the vertical distribution of algal biomass within the lake water column. In the new system the YSI dissolved oxygen (DO) sensor was replaced with an Oxyguard DO sensor fitted to a separate RBR logger attached to the profiling frame.

Lake Taupo Long-Term Monitoring Programme 2007-2008 28
Cross-calibration between the two profilers confirmed the quality of the data and the XR420f has been retained as a back-up.
The following parameters were also measured as profiles from water samples collected using a van Dorn water sampling bottle starting at 1 m and then at 10 m intervals from 10 m to the bottom of the lake:
DO, chlorophyll a, dissolved reactive phosphorus (DRP), dissolved organic phosphorus (DOP), particulate phosphorus (PP), total phosphorus (TP), nitrate + nitrite nitrogen (NO3-N), ammoniacal nitrogen (NH4-N), dissolved organic nitrogen (DON), particulate nitrogen (PN), total nitrogen (TN), urea nitrogen (Urea-N), total suspended solids (SS), volatile suspended solids (VSS), particulate carbon (PC), dissolved organic carbon (DOC), and water colour. (* Little, if any nitrite is ever found in the Lake Taupo water column, hence the use of NO3-N).
Note: TN and TP values are the summation of all other N and P components, respectively, excluding Urea-N which is part of the DON component.
Additional parameters measured but not as complete profiles were:
Water clarity (by Secchi disc depth) and algal species composition and abundance on water samples from 1, 10, 50, 100, and 140 m.
Determinations on the water samples were made with the standard methods routinely used for freshwater analysis by NIWA.
Algal species composition and abundance were obtained by settling a measured volume of sample (up to 100 mL) in Utermöhl (1931) tubes and counting on an inverted microscope. Biovolume was estimated from cell volume tables calculated from the cell dimensions of each species. Dominance was estimated from relative biovolumes with the highest biovolume assigned dominance 1 as most common and the lowest biovolume assigned the dominance 10 as rare. Professional judgement was used to relate dominance between samplings.
Since 2007, dominance is no longer used and the algal data are reported in cell counts and biovolume.
Data for the long term monitoring programme were scheduled to be collected from the mid-lake sampling station at 2 weekly intervals. The practicality of achieving this

Lake Taupo Long-Term Monitoring Programme 2007-2008 29
target was limited by the weather and in reality data were generally collected at about 2-3 weekly intervals. Parameters measured were:
DO and temperature profiles at 1 m depth intervals to the bottom of the lake by RBR XR420f profiler, water clarity as Secchi disc depth, and a 10 m tube water sample was collected for measurement of chlorophyll a, NO3-N, NH4-N, TN, DRP, TP, and algal species dominance.
Near-bottom water samples from 150 m were collected using a van Dorn water sampling bottle and analysed for DRP, NO3-N, and NH4-N.
8.2 Data handling and less than detection limit values
All data in this report have been processed and manipulated on Excel spreadsheets. Data is rounded using the Excel protocol to an appropriate number of significant numbers based on the need for detailed knowledge tempered with the confidence in the precision and accuracy of the analytical methods used. This treatment may lead to small differences between electronic copies of the data and the values presented in this report.
The difference between the written report and the Excel spreadsheet of essentially the same data is the treatment of the less than detection limit (<DL) results. The data have in the past been written as <DL or <DL(value). For statistical analysis the excel spreadsheet replaces <DL with 0 or uses the value in brackets in place of 0. Although it is recognised that the former action will be in error, the use of the value in brackets requires some justification.
In discussion with Burns Macaskill, Graham McBride, and Mike Crump from NIWA on this issue, the following conclusions were reached:
• In general the data is reported as a series of results from analytical methods which have known limitations and precision. The raw number is reported where ever possible so that the user can draw their own conclusions about the reliability of the "last significant figure" on any result when performing data manipulations.
• The real problem arises at very low levels and the result obtained is less than the method’s prescribed DL The problem is not so much the result obtained but what to do with it which in turn raises the question 'What do we mean by detection limit'?

Lake Taupo Long-Term Monitoring Programme 2007-2008 30
• In the book "Statistical methods in water resources" Helsel & Hirsch 1992 [Studies in Environmental Science 49, Elsevier], and chapter 13 "Methods for data below the reporting limit" it is pointed out that the 'detection limit' is variously known as the 'reporting limit' or the 'limit of quantitation'. If no other value is available, there are 3 main options: call it zero (which is clearly an under estimate), call it the detection limit (which is clearly an over estimate), or call it half the detection limit (which gives a 50:50 chance of an over or under estimate). The choice then is one of 'which convention do you wish to use'. In the written reports, I have treated the <DL as zero for summation purposes. This is an under estimate which I should have noted on each report page so that anyone using that data is aware of the convention used.
• An alternative approach is to say that, before the sample is analysed, the DL is the predicted minimum level that will be found using the stipulated method. However, once the sample is analysed the result is what was actually measured and may be <DL on the day of analysis. As it is an actual analytical result, that value (reported in brackets) should be reported even though it is <DL. This implies that the method DL is in reality a reporting level or level of confidence.
• The "DL" was derived for the Lake Taupo data, on each analytical occasion, from a series of blanks and 1ppb standards run with the samples. The "DL" is set as 3 times the SD of the 1 ppb standard. This is actually a limit of confidence. All samples are run in duplicate and the mean of the two results becomes the concentration reported.
• With the introduction of the Lachet FIA system, the limits of detection have been confidently lowered to the point where replicate results may often be <DL. In these instances, in the written report, the value is reported as <DL(result). In the past I have still used the <DL =0 convention in summation for the TN and TP data. This is obviously wrong and the actual result should be used, as is done in the electronic spreadsheet.
In this report the analytical value ‘on-the-day’ has been used wherever possible. Data reported as <DL use the <DL = DL/2 convention. Past data have not been corrected or altered to conform to this protocol.

Lake Taupo Long-Term Monitoring Programme 2007-2008 31
These technical details are incorporated in this annual report so that data users are aware of how the 'DL' or confidence limit was set and how the values <DL are treated when performing data manipulations.
There is still the question of how to deal with numbers where the result has been simply reported as <DL. The use of the DL/2 convention is probably closer to reality than the DL = 0 convention.
Helsel & Hirsch suggest an alternative method for estimating a value in the <DL range. If there is sufficient real data >DL, a probability curve can be derived and extrapolated around the DL to generate the most probable number for the <DL value.
8.3 Statistical methods
Copied from Gibbs (2000b).
In this report we have used linear regressions and associated statistical tests to examine trends. The key result of these procedures is the coefficient of determination (r2), which measures the amount of variability in the data that is accounted for by the regression. Another is the P-value3. This can be used as a weight of evidence against the hypothesis that there was in fact no trend. This weight is strong when P is small, meaning that a trend at least as large as that measured could have occurred merely by chance—we have only a limited number of data from which to infer the strength of any trend, so our measurements always are uncertain to some degree. So if P is low enough (taken as less than 5% in this report, which is the usual practice), it is conventional to say that the measured trend is "statistically significant", and that convention is followed in this report. However, it is important (and often not realised) to note that the P-value cannot be used as an absolute weight of evidence. This is because it tends to decrease as the number of samples taken in a given period is increased. For example, when we plot monthly Secchi disc depth data from 1994–2001 (Figure 3A, Gibbs 2000b) with these 93 data we obtain a statistically significant result (because P < 0.05)—even though the coefficient of determination was only r2 = 0.0445. When we plot the minimum winter clarity over this period we then have only 7 data. In this case (Fig. 3B, Gibbs 2000b) we happen to have the same measured trend slope with a much higher coefficient of determination (r2 = 0.464), yet the result is not statistically significant (because P = 0.09). This is entirely because of the reduced number of samples in the winter minimum case. What this makes clear is that the P value is useful as a relative weight of evidence when comparing datasets of the same size, but it has no evidential meaning when comparing results from datasets of very different sizes. 3 It is defined as the probability of obtaining a trend at least as extreme as was obtained if in fact there was no trend at all.

Lake Taupo Long-Term Monitoring Programme 2007-2008 32
9. Appendix 2: The calculation of net VHOD rates
Copied from Gibbs 1995.
Rationale
In the strictest terms, VHOD can only be calculated for a lake which has thermally stratified and the resultant thermocline provides an effective barrier against re-oxygenation of the hypolimnion. The measure of the barrier efficiency is the rate of heating of the hypolimnion following stratification as heat will be transferred across the thermocline at a similar rate to oxygen.
In Lake Taupo, the thermal inertia of the hypolimnion is so great that heating during the stratified period is typically about 0.2 °C and never more than 0.4 °C over a 200 day period. While this would seem to meet the temperature criterion, in a lake that large, oxygen can be transferred into the hypolimnion by mechanisms other than diffusion.
Wind induced mixing may increase turbulent diffusion across the thermocline as would an internal seiche on the thermocline. Both of these mechanisms would transfer heat. The penetration of the thermocline by an under-flowing density current would entrain oxygenated surface water into the hypolimnion with that flow. As the density current must be colder than the thermocline to plunge through it, there is no heat transferred with this mechanism.
In Lake Taupo the Tongariro River is always colder than the surface water and for at least 9 months of the year it is also colder than the minimum lake water temperature of 10.3 ºC. Thus, during most of the stratified period, the Tongariro River flows directly into the hypolimnion entraining oxygenated surface water with it. The amount of surface water entrained has been estimated to be about 10 times the river discharge. The amount of oxygen transported in this way is likely to be more than 200 tonnes per day (Gibbs 1996).
Clearly this is a substantial oxygen input which invalidates the concept of the thermocline forming an oxygen barrier for purposes of calculating the VHOD. The true VHOD may only be calculated during mid summer when the Tongariro River flows deep into the epilimnion but does not penetrate the thermocline.
The data collected to date indicates that hypolimnetic oxygen depletion occurs throughout the stratified period - with or without the density current re-oxygenation -

Lake Taupo Long-Term Monitoring Programme 2007-2008 33
and hence the value obtained from a VHOD calculation over the whole stratified period is the net VHOD rate taking all the factors affecting the hypolimnion into account.
As the data from 1996/97 shows, the density current also advects dissolved organic nutrients with it. Hence, management strategies which affect the Tongariro River also impact on the lake. Hence it is appropriate to use the net VHOD rate for inter-annual comparisons rather than the true VHOD rate calculated only through mid summer.
Method of calculation
The following is the method used to calculate the net VHOD rate for Lake Taupo.
Requirements: Microsoft EXCEL spreadsheet or equivalent.
Although the thermocline in Lake Taupo is usually at about 40 m, the isothermal water column lies below 70 m. To accommodate the gradient across the thermocline, the net VHOD rate calculation only uses oxygen data from below 70 m.
To calculate the mean oxygen concentration in the water column below 70 m, the DO concentration at each 10 m depth increment is multiplied by the volume of the 10 m slice it came from. This assumes rapid horizontal mixing and minimal vertical mixing to extrapolate one DO value across the whole lake. Historical data from multiple sites would suggest that this is a reasonable assumption.
The slice volumes (hypsographic volumes) for Lake Taupo have been calculated for 10 m thick layers centred on the 5 m point of each slice i.e., 75, 85, 95, 105 m etc. The DO measurements are made at 10 m intervals i.e., 70, 80, 90, 100, 110 m etc.
The mass of oxygen in each 10 m slice is the average of the DO concentration at the top and bottom of a slice multiplied by the slice volume. i.e., for the 70 - 80 m slice the calculation is:-
Mass70-80m = ((DO70m + DO80m) ÷ 2) × Volume70-80m

Lake Taupo Long-Term Monitoring Programme 2007-2008 34
For each profile date:
Compute the mass for each 10 m slice between 70 m and 150 m and sum the results as the total mass of DO in the hypolimnion below 70 m. Sum the slice volumes below 70 m as the total volume of the hypolimnion below 70 m.
The volume weighted mean DO concentration is the total mass value divided by the total volume value.
Use the sequential day number or equivalent to construct a time series of volume weighted mean DO concentrations over the stratified period and use the Excel regression analysis tool to obtain the y = ax + b straight line fit for these data.
As the DO data are in g m-3, the value of 'a' is in g m-3 d-1. Multiply 'a' by 1000 to get the net VHOD rate in mg m-3 d-1. The negative sign indicates a loss rate.
The hypsographic volumes and upper surface areas of the 10 m slices through the whole depth of Lake Taupo are listed at the end of this section.
Lake Taupo Hypsographic Data used in the Net VHOD RATE calculation. Slice depths (m) Volume of slice (km3) Upper surface area of slice (km2) 0 - 10 5.849359 600 10 - 20 5.599702 570 20 - 30 5.459951 550 30 - 40 5.359888 542 40 - 50 5.288266 530 50 - 60 5.150538 528 60 - 70 4.899510 502 70 - 80 4.619076 478 80 - 90 4.278738 446 90 - 100 3.847292 410 100 - 110 3.006616 360 110 - 120 1.730549 245 120 - 130 0.837468 110 130 - 140 0.394439 60 140 - 150 0.073333 22 150 - 0 0

Lake Taupo Long-Term Monitoring Programme 2007-2008 35
Statistical evaluation of the VHOD rate
From the 1999-2000 monitoring report (Gibbs 2000b), the VHOD rate is expressed as the calculated net VHOD rate ± the 95% confidence limit. This gives a meaningful estimate of the range within which the VHOD rate lies and is more appropriate than the standard deviation on the data or a standard error estimate on the regression coefficient.
Julian Date or sequential day number for each day of the year excluding leap years. For Leap Years, add 1 to the sequential day number from 1 March to 31 December of that year.
Jan Feb Mar Apr May Jun Jul Aug Sep Oct Nov Dec 1 1 32 60 91 121 152 182 213 244 274 305 335 1 2 2 33 61 92 122 153 183 214 245 275 306 336 2 3 3 34 62 93 123 154 184 215 246 276 307 337 3 4 4 35 63 94 124 155 185 216 247 277 308 338 4 5 5 36 64 95 125 156 186 217 248 278 309 339 5 6 6 37 65 96 126 157 187 218 249 279 310 340 6 7 7 38 66 97 127 158 188 219 250 280 311 341 7 8 8 39 67 98 128 159 189 220 251 281 312 342 8 9 9 40 68 99 129 160 190 221 252 282 313 343 9 10 10 41 69 100 130 161 191 222 253 283 314 344 10 11 11 42 70 101 131 162 192 223 254 284 315 345 11 12 12 43 71 102 132 163 193 224 255 285 316 346 12 13 13 44 72 103 133 164 194 225 256 286 317 347 13 14 14 45 73 104 134 165 195 226 257 287 318 348 14 15 15 46 74 105 135 166 196 227 258 288 319 349 15 16 16 47 75 106 136 167 197 228 259 289 320 350 16 17 17 48 76 107 137 168 198 229 260 290 321 351 17 18 18 49 77 108 138 169 199 230 261 291 322 352 18 19 19 50 78 109 139 170 200 231 262 292 323 353 19 20 20 51 79 110 140 171 201 232 263 293 324 354 20 21 21 52 80 111 141 172 202 233 264 294 325 355 21 22 22 53 81 112 142 173 203 234 265 295 326 356 22 23 23 54 82 113 143 174 204 235 266 296 327 357 23 24 24 55 83 114 144 175 205 236 267 297 328 358 24 25 25 56 84 115 145 176 206 237 268 298 329 359 25 26 26 57 85 116 146 177 207 238 269 299 330 360 26 27 27 58 86 117 147 178 208 239 270 300 331 361 27 28 28 59 87 118 148 179 209 240 271 301 332 362 28 29 29 88 119 149 180 210 241 272 302 333 363 29 30 30 89 120 150 181 211 242 273 303 334 364 30 31 31 90 151 212 243 304 365 31

Lake Taupo Long-Term Monitoring Programme 2007-2008 36
10. Appendix 3: Temperature and dissolved Oxygen data
Includes accumulated data since 1994.
* represents data missing or invalid.
For completeness, additional data from the Kuratau Basin (site B) and Western Bays (site C) collected for the period between January 2002 and December 2004 are included as separate sheets following the mid-lake data from site A for those years.

Lake Taupo Long-Term Monitoring Programme 2007-2008 37
Lake Taupo Temperature, Dissolved Oxygen, and Secchi Depth Database. 2007-2008 Mid-Lake site A for the period starting 11 September 2007 Temperature Date 11/9/2007 9/10/2007 30/10/2007 15/11/2007 4/12/2007 20/12/2007 17/01/2008 31/01/2008 14/02/2008 27/02/2008 13/03/2008 26/03/2008 17/04/2008 7/05/2008 22/05/2008 5/06/2008 19/06/2008 1/07/2008 15/07/2008 7/08/2008 20/08/2008 Depth (m) 0 11.00 12.33 12.84 13.47 16.64 17.38 21.23 19.79 19.87 19.28 18.83 19.26 17.88 15.67 14.65 13.60 12.89 11.97 11.42 11.06 10.70 10 10.99 11.69 11.83 13.19 16.20 17.15 19.96 19.62 19.81 19.26 18.75 19.24 17.87 15.67 14.65 13.60 12.90 12.03 11.41 10.98 10.70 20 10.98 11.67 11.76 12.92 14.48 14.76 17.21 17.59 19.65 19.24 18.75 18.92 17.85 15.67 14.65 13.59 12.90 12.03 11.40 10.98 10.69 30 10.99 11.44 11.70 12.86 12.58 13.19 13.64 13.82 16.07 14.08 16.20 16.92 15.58 15.67 14.65 13.60 12.90 12.01 11.40 10.98 10.69 40 10.99 11.42 11.64 12.78 12.02 12.18 12.26 12.31 12.63 12.24 12.54 12.44 12.38 15.27 12.27 13.60 12.90 12.03 11.40 10.98 10.69 50 10.99 11.39 11.51 11.80 11.69 11.75 11.64 11.61 11.80 11.71 11.76 11.77 11.72 12.11 11.66 11.93 12.86 12.03 11.39 10.99 10.70 60 10.99 11.34 11.43 11.49 11.42 11.53 11.41 11.39 11.47 11.44 11.47 11.48 11.48 11.56 11.44 11.54 11.60 12.03 11.39 10.98 10.70 70 10.99 11.16 11.32 11.37 11.29 11.33 11.23 11.26 11.33 11.30 11.34 11.29 11.34 11.37 11.32 11.37 11.36 11.61 11.38 10.98 10.70 80 10.96 11.00 11.23 11.31 11.25 11.23 11.22 11.17 11.25 11.25 11.24 11.23 11.27 11.29 11.27 11.29 11.27 11.39 11.38 10.98 10.70 90 10.96 10.98 11.16 11.17 11.14 11.12 11.12 11.11 11.19 11.18 11.18 11.17 11.20 11.21 11.22 11.24 11.23 11.29 11.35 10.98 10.70 100 10.96 10.98 11.07 11.10 11.10 11.09 11.12 11.09 11.15 11.14 11.14 11.14 11.17 11.16 11.18 11.21 11.21 11.28 11.30 10.98 10.70 110 10.96 10.97 11.04 11.04 11.07 11.04 11.06 11.08 11.11 11.11 11.11 11.12 11.14 11.16 11.16 11.19 11.19 11.28 11.25 10.98 10.70 120 10.96 10.96 11.02 11.02 11.05 11.03 11.04 11.06 11.07 11.09 11.09 11.11 11.15 11.15 11.15 11.16 11.17 11.25 11.22 10.98 10.70 130 10.96 10.96 11.00 11.00 11.02 11.00 11.02 11.05 11.06 11.07 11.07 11.09 11.12 11.12 11.13 11.15 11.15 11.22 11.20 10.98 10.70 140 10.96 10.96 10.98 10.97 10.99 11.01 11.00 11.05 11.05 11.06 11.06 11.08 11.11 11.11 11.12 11.13 11.15 11.17 11.19 10.98 10.70 150 10.96 10.95 10.96 10.95 10.98 10.99 11.00 11.04 11.04 11.05 11.06 11.08 11.11 11.10 11.12 11.13 11.15 11.16 11.19 10.98 10.70 Dissolved Oxygen (g m-3) Depth (m) 0 11.00 10.23 10.18 10.03 9.35 9.21 8.61 * 10.77 9.20 9.38 9.87 9.49 9.91 10.13 10.36 10.53 10.75 10.89 10.21 9.55 10 11.12 10.37 10.27 10.11 9.45 9.24 8.63 * 8.76 9.09 9.05 8.61 8.97 9.04 9.37 9.84 10.26 10.63 10.66 11.03 10.80 20 10.87 10.12 10.25 10.07 9.23 9.21 8.70 * 9.00 9.32 9.24 8.85 8.46 8.97 9.18 9.72 10.14 10.32 10.51 11.04 11.16 30 10.99 10.17 10.07 10.17 9.36 9.37 8.93 * 9.35 9.45 9.01 8.73 8.52 8.86 9.16 9.63 10.10 10.37 10.48 10.94 11.11 40 10.84 9.92 10.02 9.97 9.09 9.09 8.69 * 9.01 8.92 8.96 8.57 8.72 8.87 8.68 9.81 10.12 10.40 10.42 10.72 11.08 50 10.92 10.09 9.85 9.66 9.08 9.21 8.67 * 8.64 8.82 8.60 8.51 8.48 8.45 8.56 9.22 10.10 10.31 10.52 10.83 11.07 60 11.07 9.96 9.52 9.75 9.14 8.69 8.60 8.70 8.44 8.49 8.34 8.15 8.20 8.25 8.58 8.96 9.51 10.36 10.45 10.60 11.05 70 10.89 9.90 9.77 9.30 8.74 8.69 8.26 8.22 8.19 8.15 8.02 7.79 7.84 7.89 8.37 8.65 9.07 10.28 10.39 10.76 10.98 80 10.90 9.59 9.58 9.12 8.76 8.38 8.03 8.05 8.16 7.88 7.92 7.52 7.71 7.90 8.30 8.53 8.91 9.60 10.34 10.74 10.96 90 10.66 9.63 9.42 9.07 8.62 8.46 8.10 8.06 7.99 7.87 7.76 7.47 7.57 7.68 8.22 8.45 8.72 9.18 10.23 10.73 10.91 100 10.64 9.58 9.49 9.14 8.46 8.41 7.90 7.90 7.97 7.86 7.69 7.45 7.45 7.46 8.14 8.44 8.66 9.06 9.93 10.72 10.90 110 10.62 9.57 9.16 8.83 8.37 8.46 7.83 7.87 7.81 7.64 7.50 7.20 7.29 7.38 8.03 8.19 8.43 8.72 9.34 10.68 10.84 120 10.66 9.52 9.27 8.95 8.42 8.08 7.95 7.52 7.82 7.39 7.45 7.20 7.29 7.38 7.94 8.16 8.32 8.55 8.94 10.67 10.83 130 10.42 9.35 9.01 8.81 8.31 8.13 7.72 7.40 7.59 7.41 7.27 7.16 7.18 7.19 7.86 7.86 8.14 8.31 8.79 10.63 10.57 140 10.40 9.30 9.11 8.81 8.28 7.88 7.74 7.27 7.62 7.05 7.10 7.10 7.13 7.17 7.81 7.61 8.01 8.25 8.48 10.62 10.38 150 10.37 9.13 8.91 8.45 7.95 7.95 7.33 7.35 7.27 7.00 6.76 6.59 6.72 6.85 7.40 7.50 7.73 8.08 8.48 10.57 9.67 Secchi depth (m) 11 15 16 14 15 17.5 22.5 21.5 25 22 22 19 20.5 16 17 15 16.5 14 13 12.5 12.5

Lake Taupo Long-Term Monitoring Programme 2007-2008 38
Lake Taupo Temperature, Dissolved Oxygen, and Secchi Depth Database. 2006-2007 Mid-Lake site A for the period starting 4 September 2006 Temperature Date 4/09/2006 26/09/2006 18/10/2006 1/11/2006 5/12/2006 19/12/2006 9/01/2007 25/01/2007 8/02/2007 21/02/2007 21/03/2007 3/04/2007 19/04/2007 8/05/2007 22/05/2007 14/06/2007 27/06/2007 18/07/2007 8/08/2007 23/08/2007 11/09/2007 Depth (m) 0 11.10 11.88 11.72 12.43 15.21 15.62 16.51 18.60 19.31 19.58 18.70 18.04 16.49 19.29 15.17 13.56 12.38 11.43 11.15 11.00 11.00 10 10.93 11.48 11.73 12.27 14.06 15.46 16.41 18.42 18.98 19.12 18.03 18.03 16.48 18.98 15.16 13.56 12.39 11.43 11.15 11.00 10.99 20 10.93 11.29 11.72 12.25 13.87 14.45 15.44 17.96 18.16 17.62 17.99 17.94 16.47 18.16 15.16 13.56 12.39 11.43 11.16 11.00 10.98 30 10.89 11.19 11.69 12.20 13.69 14.15 14.42 15.82 14.86 15.17 15.18 16.72 16.47 14.86 15.16 13.56 12.39 11.36 11.15 11.00 10.99 40 10.87 11.15 11.45 12.10 13.16 12.43 12.25 13.05 12.89 13.09 12.65 13.50 13.78 12.89 15.15 13.56 12.39 11.29 11.16 11.00 10.99 50 10.83 11.08 11.34 11.96 11.77 11.64 11.74 11.84 11.89 11.91 11.94 12.33 12.47 11.89 11.99 13.55 12.39 11.27 11.16 11.00 10.99 60 10.82 11.06 11.25 11.34 11.20 11.36 11.29 11.47 11.39 11.46 11.51 11.65 11.69 11.39 11.54 11.77 12.38 11.25 11.15 11.00 10.99 70 10.82 11.00 11.21 11.17 11.11 11.21 11.15 11.26 11.21 11.21 11.22 11.28 11.33 11.21 11.33 11.35 11.39 11.22 11.16 11.01 10.99 80 10.82 10.94 11.16 11.06 11.06 11.10 11.09 11.14 11.15 11.15 11.16 11.22 11.20 11.15 11.21 11.22 11.28 11.17 11.16 11.01 10.96 90 10.81 10.90 11.08 10.99 10.97 11.03 11.03 11.04 11.06 11.05 11.09 11.11 11.13 11.06 11.12 11.11 11.22 11.14 11.16 11.01 10.96 100 10.81 10.87 10.97 10.94 10.94 11.00 11.00 11.00 11.03 11.05 11.05 11.10 11.09 11.03 11.10 11.10 11.16 11.13 11.16 11.01 10.96 110 10.81 10.84 10.89 10.91 10.91 10.96 10.98 10.98 11.01 11.02 11.03 11.04 11.05 11.01 11.07 11.09 11.12 11.12 11.16 11.01 10.96 120 10.80 10.81 10.86 10.88 10.90 10.94 10.97 10.99 11.06 11.02 11.02 11.04 11.04 11.06 11.07 11.08 11.11 11.12 11.16 11.01 10.96 130 10.79 10.79 10.85 10.85 10.88 10.92 10.95 10.97 10.99 10.99 11.01 11.01 11.03 10.99 11.03 11.07 11.08 11.11 11.16 11.01 10.96 140 10.76 10.78 10.83 10.84 10.88 10.89 10.94 10.97 10.97 10.98 10.99 11.00 11.02 10.97 11.03 11.05 11.07 11.10 11.16 11.01 10.96 150 10.75 10.76 10.82 10.85 10.88 10.91 10.93 10.99 10.96 11.02 11.04 11.03 11.02 11.00 11.04 11.05 11.07 11.10 11.16 11.01 10.96 Dissolved Oxygen (g m-3) Depth (m) 0 10.52 10.31 10.36 10.23 9.62 9.52 9.35 8.99 8.95 9.16 9.31 9.44 9.74 9.20 10.01 10.01 10.26 10.36 10.96 11.02 11.00 10 10.47 10.28 10.31 10.16 9.69 9.52 9.52 8.95 8.96 9.26 9.27 9.51 9.73 9.29 10.06 9.95 10.37 10.43 11.08 11.05 11.12 20 10.33 10.25 10.23 10.14 9.56 9.43 9.64 8.95 8.77 9.22 9.27 9.45 9.84 9.08 10.12 9.83 10.48 10.56 11.05 11.15 10.87 30 10.23 10.22 10.27 10.07 9.48 9.50 9.49 8.61 8.78 9.21 8.52 9.30 9.75 9.09 10.06 9.74 10.25 10.27 10.89 11.01 10.99 40 10.13 10.10 10.14 10.08 9.38 9.39 9.47 8.84 8.95 9.08 8.94 8.86 9.26 9.28 9.87 9.71 10.17 10.11 10.89 10.92 10.84 50 10.00 9.96 9.99 10.03 9.05 9.28 9.33 8.66 8.68 8.71 8.77 8.87 9.11 9.00 9.39 9.70 10.12 9.88 10.67 10.90 10.92 60 9.91 10.06 9.93 9.73 9.15 8.97 9.15 8.61 8.62 8.63 8.72 8.76 9.00 8.93 8.83 9.28 10.23 9.84 10.67 10.84 11.07 70 9.82 9.95 9.83 9.54 8.79 8.89 9.02 8.53 8.48 8.57 8.76 8.82 8.96 8.78 8.90 8.45 9.67 9.60 10.67 10.68 10.89 80 9.88 9.83 9.82 9.51 8.66 8.85 8.85 8.34 8.47 8.41 8.62 8.49 8.89 8.78 8.62 8.42 9.34 9.39 10.78 10.88 10.90 90 9.78 9.71 9.71 9.33 8.69 8.67 8.75 8.29 8.29 8.40 8.54 8.53 8.70 8.59 8.66 7.89 8.47 8.36 10.67 10.73 10.66 100 9.82 9.69 9.65 9.30 8.49 8.46 8.65 7.99 8.21 8.01 8.36 8.23 8.58 8.51 8.13 7.66 8.56 8.20 10.79 10.67 10.64 110 9.73 9.62 9.47 9.21 8.40 8.38 8.38 8.02 8.04 7.95 8.22 8.24 8.41 8.33 8.20 7.74 8.40 7.87 10.66 10.70 10.62 120 9.79 9.38 9.37 9.08 8.34 8.33 8.38 7.88 7.84 7.72 8.02 8.01 8.24 8.12 7.74 7.69 8.30 7.92 10.61 10.76 10.66 130 9.65 9.35 9.29 9.00 8.24 8.26 8.27 7.81 7.91 7.71 7.58 8.09 8.01 8.19 7.74 7.54 7.95 7.75 10.52 10.55 10.42 140 9.61 9.38 9.10 8.94 8.22 8.21 8.14 7.75 7.86 7.61 7.58 7.72 7.66 8.15 7.34 7.35 7.94 7.74 10.50 10.75 10.40 150 9.65 9.13 9.02 8.69 7.96 7.82 7.89 7.45 7.25 7.35 7.25 7.25 7.32 7.50 7.18 7.39 7.58 7.55 10.46 10.54 10.37 Secchi depth (m) 11 17.5 13 14.5 16 15.5 13.5 14.5 16 18.2 16.5 19 16 16 18.5 18 18.5 14.5 14 13 11
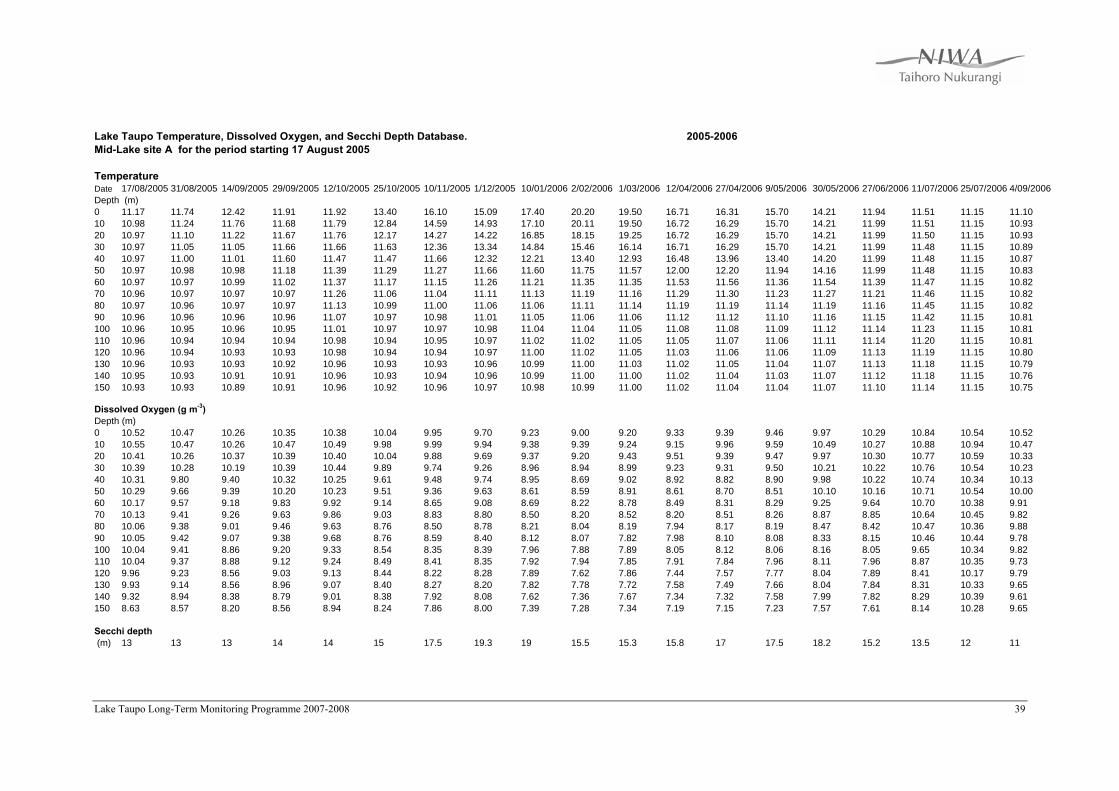
Lake Taupo Long-Term Monitoring Programme 2007-2008 39
Lake Taupo Temperature, Dissolved Oxygen, and Secchi Depth Database. 2005-2006 Mid-Lake site A for the period starting 17 August 2005 Temperature Date 17/08/2005 31/08/2005 14/09/2005 29/09/2005 12/10/2005 25/10/2005 10/11/2005 1/12/2005 10/01/2006 2/02/2006 1/03/2006 12/04/2006 27/04/2006 9/05/2006 30/05/2006 27/06/2006 11/07/2006 25/07/2006 4/09/2006 Depth (m) 0 11.17 11.74 12.42 11.91 11.92 13.40 16.10 15.09 17.40 20.20 19.50 16.71 16.31 15.70 14.21 11.94 11.51 11.15 11.10 10 10.98 11.24 11.76 11.68 11.79 12.84 14.59 14.93 17.10 20.11 19.50 16.72 16.29 15.70 14.21 11.99 11.51 11.15 10.93 20 10.97 11.10 11.22 11.67 11.76 12.17 14.27 14.22 16.85 18.15 19.25 16.72 16.29 15.70 14.21 11.99 11.50 11.15 10.93 30 10.97 11.05 11.05 11.66 11.66 11.63 12.36 13.34 14.84 15.46 16.14 16.71 16.29 15.70 14.21 11.99 11.48 11.15 10.89 40 10.97 11.00 11.01 11.60 11.47 11.47 11.66 12.32 12.21 13.40 12.93 16.48 13.96 13.40 14.20 11.99 11.48 11.15 10.87 50 10.97 10.98 10.98 11.18 11.39 11.29 11.27 11.66 11.60 11.75 11.57 12.00 12.20 11.94 14.16 11.99 11.48 11.15 10.83 60 10.97 10.97 10.99 11.02 11.37 11.17 11.15 11.26 11.21 11.35 11.35 11.53 11.56 11.36 11.54 11.39 11.47 11.15 10.82 70 10.96 10.97 10.97 10.97 11.26 11.06 11.04 11.11 11.13 11.19 11.16 11.29 11.30 11.23 11.27 11.21 11.46 11.15 10.82 80 10.97 10.96 10.97 10.97 11.13 10.99 11.00 11.06 11.06 11.11 11.14 11.19 11.19 11.14 11.19 11.16 11.45 11.15 10.82 90 10.96 10.96 10.96 10.96 11.07 10.97 10.98 11.01 11.05 11.06 11.06 11.12 11.12 11.10 11.16 11.15 11.42 11.15 10.81 100 10.96 10.95 10.96 10.95 11.01 10.97 10.97 10.98 11.04 11.04 11.05 11.08 11.08 11.09 11.12 11.14 11.23 11.15 10.81 110 10.96 10.94 10.94 10.94 10.98 10.94 10.95 10.97 11.02 11.02 11.05 11.05 11.07 11.06 11.11 11.14 11.20 11.15 10.81 120 10.96 10.94 10.93 10.93 10.98 10.94 10.94 10.97 11.00 11.02 11.05 11.03 11.06 11.06 11.09 11.13 11.19 11.15 10.80 130 10.96 10.93 10.93 10.92 10.96 10.93 10.93 10.96 10.99 11.00 11.03 11.02 11.05 11.04 11.07 11.13 11.18 11.15 10.79 140 10.95 10.93 10.91 10.91 10.96 10.93 10.94 10.96 10.99 11.00 11.00 11.02 11.04 11.03 11.07 11.12 11.18 11.15 10.76 150 10.93 10.93 10.89 10.91 10.96 10.92 10.96 10.97 10.98 10.99 11.00 11.02 11.04 11.04 11.07 11.10 11.14 11.15 10.75 Dissolved Oxygen (g m-3) Depth (m) 0 10.52 10.47 10.26 10.35 10.38 10.04 9.95 9.70 9.23 9.00 9.20 9.33 9.39 9.46 9.97 10.29 10.84 10.54 10.52 10 10.55 10.47 10.26 10.47 10.49 9.98 9.99 9.94 9.38 9.39 9.24 9.15 9.96 9.59 10.49 10.27 10.88 10.94 10.47 20 10.41 10.26 10.37 10.39 10.40 10.04 9.88 9.69 9.37 9.20 9.43 9.51 9.39 9.47 9.97 10.30 10.77 10.59 10.33 30 10.39 10.28 10.19 10.39 10.44 9.89 9.74 9.26 8.96 8.94 8.99 9.23 9.31 9.50 10.21 10.22 10.76 10.54 10.23 40 10.31 9.80 9.40 10.32 10.25 9.61 9.48 9.74 8.95 8.69 9.02 8.92 8.82 8.90 9.98 10.22 10.74 10.34 10.13 50 10.29 9.66 9.39 10.20 10.23 9.51 9.36 9.63 8.61 8.59 8.91 8.61 8.70 8.51 10.10 10.16 10.71 10.54 10.00 60 10.17 9.57 9.18 9.83 9.92 9.14 8.65 9.08 8.69 8.22 8.78 8.49 8.31 8.29 9.25 9.64 10.70 10.38 9.91 70 10.13 9.41 9.26 9.63 9.86 9.03 8.83 8.80 8.50 8.20 8.52 8.20 8.51 8.26 8.87 8.85 10.64 10.45 9.82 80 10.06 9.38 9.01 9.46 9.63 8.76 8.50 8.78 8.21 8.04 8.19 7.94 8.17 8.19 8.47 8.42 10.47 10.36 9.88 90 10.05 9.42 9.07 9.38 9.68 8.76 8.59 8.40 8.12 8.07 7.82 7.98 8.10 8.08 8.33 8.15 10.46 10.44 9.78 100 10.04 9.41 8.86 9.20 9.33 8.54 8.35 8.39 7.96 7.88 7.89 8.05 8.12 8.06 8.16 8.05 9.65 10.34 9.82 110 10.04 9.37 8.88 9.12 9.24 8.49 8.41 8.35 7.92 7.94 7.85 7.91 7.84 7.96 8.11 7.96 8.87 10.35 9.73 120 9.96 9.23 8.56 9.03 9.13 8.44 8.22 8.28 7.89 7.62 7.86 7.44 7.57 7.77 8.04 7.89 8.41 10.17 9.79 130 9.93 9.14 8.56 8.96 9.07 8.40 8.27 8.20 7.82 7.78 7.72 7.58 7.49 7.66 8.04 7.84 8.31 10.33 9.65 140 9.32 8.94 8.38 8.79 9.01 8.38 7.92 8.08 7.62 7.36 7.67 7.34 7.32 7.58 7.99 7.82 8.29 10.39 9.61 150 8.63 8.57 8.20 8.56 8.94 8.24 7.86 8.00 7.39 7.28 7.34 7.19 7.15 7.23 7.57 7.61 8.14 10.28 9.65 Secchi depth (m) 13 13 13 14 14 15 17.5 19.3 19 15.5 15.3 15.8 17 17.5 18.2 15.2 13.5 12 11

Lake Taupo Long-Term Monitoring Programme 2007-2008 40
Lake Taupo Temperature, Dissolved Oxygen, and Secchi Depth Database. 2004-2005 Mid-Lake site A for the period starting 24 August 2004 Temperature Date 24/08/2004 7/09/2004 21/10/2004 2/11/2004 22/11/2004 15/12/2004 11/01/2005 25/01/2005 9/02/2005 22/02/2005 10/03/2005 21/03/2005 14/04/2005 18/05/2005 9/06/2005 20/06/2005 20/07/2005 3/08/2005 17/08/2005 31/08/2005 14/09/2005 Depth (m) 0 10.92 10.70 11.75 12.94 15.31 14.17 16.97 19.27 20.73 20.05 19.25 19.34 17.92 14.33 12.98 12.67 11.46 11.12 11.17 11.74 12.42 10 10.83 10.66 11.61 12.89 15.15 14.10 16.01 18.05 20.19 19.73 19.24 19.17 17.96 14.31 12.99 12.47 11.31 11.11 10.98 11.24 11.76 20 10.83 10.66 11.60 12.49 13.69 13.89 15.83 16.72 18.05 18.80 19.23 18.81 17.95 14.24 12.98 12.43 11.31 11.10 10.97 11.10 11.22 30 10.83 10.66 11.59 11.65 13.17 13.79 13.37 14.55 14.65 14.02 14.92 14.59 15.13 14.13 12.98 12.42 11.30 11.11 10.97 11.05 11.05 40 10.83 10.66 11.59 11.28 11.61 13.59 12.39 13.12 12.83 12.36 13.06 12.62 12.92 13.88 12.98 12.44 11.30 11.10 10.97 11.00 11.01 50 10.83 10.65 11.58 10.93 11.09 11.35 11.33 11.89 11.75 11.49 11.75 11.64 12.00 11.47 12.97 12.42 11.28 11.11 10.97 10.98 10.98 60 10.83 10.66 11.15 10.75 10.97 11.03 11.04 11.23 11.12 11.00 11.16 11.20 11.33 11.18 12.57 11.54 11.28 11.10 10.97 10.97 10.99 70 10.83 10.66 10.78 10.72 10.77 10.88 10.86 10.98 10.90 10.87 10.92 10.96 10.99 10.97 11.13 11.07 11.26 11.11 10.96 10.97 10.97 80 10.83 10.65 10.74 10.64 10.73 10.80 10.81 10.91 10.83 10.82 10.88 10.94 10.88 10.93 10.98 11.00 11.21 11.10 10.97 10.96 10.97 90 10.82 10.61 10.72 10.62 10.69 10.73 10.75 10.80 10.75 10.80 10.80 10.81 10.82 10.89 10.95 10.93 10.98 11.10 10.96 10.96 10.96 100 10.83 10.58 10.71 10.61 10.68 10.70 10.74 10.81 10.80 10.78 10.80 10.82 10.78 10.90 10.90 10.91 10.94 11.10 10.96 10.95 10.96 110 10.83 10.56 10.67 10.60 10.64 10.67 10.69 10.72 10.73 10.75 10.74 10.76 10.76 10.87 10.89 10.87 10.93 11.08 10.96 10.94 10.94 120 10.83 10.56 10.66 10.58 10.64 10.66 10.68 10.73 10.76 10.76 10.76 10.79 10.76 10.88 10.87 10.86 10.89 10.99 10.96 10.94 10.93 130 10.82 10.55 10.64 10.57 10.61 10.63 10.66 10.69 10.71 10.71 10.72 10.73 10.74 10.81 10.84 10.86 10.88 10.97 10.96 10.93 10.93 140 10.82 10.53 10.61 10.57 10.61 10.61 10.65 10.68 10.74 10.73 10.75 10.77 10.74 10.82 10.80 10.86 10.88 10.93 10.95 10.93 10.91 150 10.79 10.47 10.56 10.58 10.60 10.62 10.67 10.67 10.70 10.70 10.71 10.72 10.72 10.77 10.78 10.85 10.87 10.90 10.93 10.93 10.89 Dissolved Oxygen (g m-3) Depth (m) 0 10.7 10.7 10.4 10.1 9.5 9.9 9.4 8.95 8.64 8.74 8.77 8.89 9.12 9.75 10.12 10.15 10.7 10.7 10.52 10.47 10.26 10 10.5 10.5 10.1 10.2 9.6 9.8 9.5 8.87 8.75 8.78 8.77 8.87 9.01 9.75 10.03 10.12 10.5 10.5 10.55 10.47 10.26 20 10.5 10.5 10.3 10.0 9.5 9.8 9.5 8.79 8.73 8.59 8.72 8.85 9.04 9.66 9.97 10.17 10.5 10.5 10.41 10.26 10.37 30 10.4 10.4 10.1 9.9 9.5 9.7 9.2 8.72 8.68 8.62 8.01 8.34 8.37 9.55 9.97 10.03 10.4 10.4 10.39 10.28 10.19 40 10.4 10.3 10.2 9.9 9.5 9.7 9.2 8.80 8.76 8.68 8.48 8.39 8.66 9.49 9.88 9.99 10.4 10.3 10.31 9.80 9.40 50 10.3 10.3 10.0 9.6 9.4 9.3 9.0 8.54 8.45 8.36 8.16 8.17 8.34 9.01 9.87 9.93 10.3 10.3 10.29 9.66 9.39 60 10.3 10.2 9.9 9.5 9.1 9.4 8.9 8.50 8.41 8.37 8.14 8.22 8.21 8.66 9.69 9.05 10.3 10.2 10.17 9.57 9.18 70 10.2 10.2 9.7 9.3 9.1 9.3 8.8 8.40 8.36 8.32 8.04 8.18 8.21 8.56 8.90 8.72 10.2 10.2 10.13 9.41 9.26 80 10.2 10.1 9.6 9.2 9.0 9.2 8.7 8.29 8.24 8.27 8.04 8.13 8.19 8.22 8.70 8.33 10.2 10.1 10.06 9.38 9.01 90 10.1 10.0 9.4 9.1 8.8 9.1 8.6 8.18 8.12 8.13 8.03 8.11 8.27 8.07 8.39 8.23 10.1 10.0 10.05 9.42 9.07 100 10.1 10.0 9.4 9.0 8.8 9.0 8.5 8.13 7.86 7.93 7.89 7.90 7.99 7.90 8.27 8.06 10.1 10.0 10.04 9.41 8.86 110 9.9 9.9 9.3 9.0 8.8 8.9 8.4 8.07 7.84 7.81 7.82 7.83 7.82 7.75 8.16 7.99 9.9 9.9 10.04 9.37 8.88 120 10.0 9.9 9.3 8.9 8.6 8.8 8.4 8.02 7.78 7.71 7.73 7.81 7.66 7.78 8.08 7.70 10.0 9.9 9.96 9.23 8.56 130 10.0 9.9 9.3 8.7 8.6 8.7 8.3 8.00 7.76 7.71 7.68 7.78 7.69 7.77 8.03 7.57 10.0 9.9 9.93 9.14 8.56 140 9.9 9.9 9.2 8.7 8.4 8.5 8.1 7.83 7.59 7.50 7.36 7.48 7.56 7.69 7.94 7.42 9.9 9.9 9.32 8.94 8.38 150 9.8 9.7 9.0 8.6 8.2 8.3 7.9 7.51 7.54 7.46 7.35 7.43 7.47 7.67 7.75 7.36 9.8 9.7 8.63 8.57 8.20 Secchi depth (m) 12.5 12 15 16 16 19.5 20 19.5 18 21.5 18.5 20 17.2 16 14.1 13.8 13 14 13 13 13
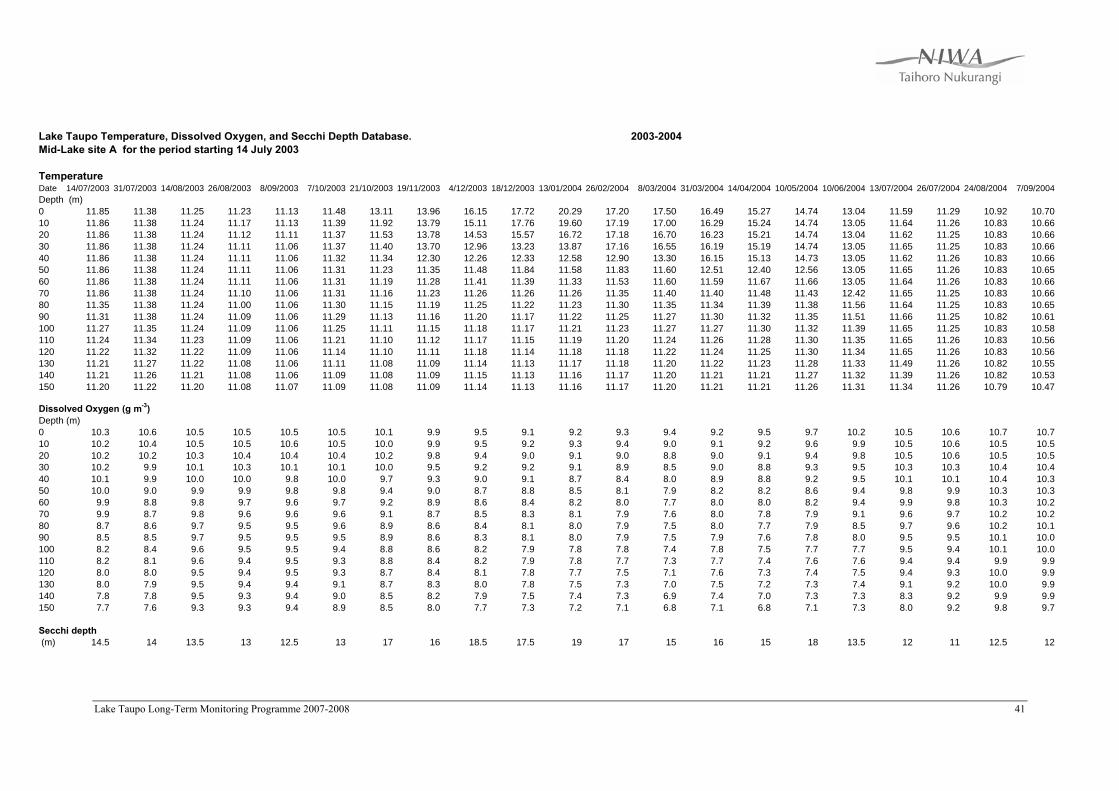
Lake Taupo Long-Term Monitoring Programme 2007-2008 41
Lake Taupo Temperature, Dissolved Oxygen, and Secchi Depth Database. 2003-2004 Mid-Lake site A for the period starting 14 July 2003 Temperature Date 14/07/2003 31/07/2003 14/08/2003 26/08/2003 8/09/2003 7/10/2003 21/10/2003 19/11/2003 4/12/2003 18/12/2003 13/01/2004 26/02/2004 8/03/2004 31/03/2004 14/04/2004 10/05/2004 10/06/2004 13/07/2004 26/07/2004 24/08/2004 7/09/2004 Depth (m) 0 11.85 11.38 11.25 11.23 11.13 11.48 13.11 13.96 16.15 17.72 20.29 17.20 17.50 16.49 15.27 14.74 13.04 11.59 11.29 10.92 10.70 10 11.86 11.38 11.24 11.17 11.13 11.39 11.92 13.79 15.11 17.76 19.60 17.19 17.00 16.29 15.24 14.74 13.05 11.64 11.26 10.83 10.66 20 11.86 11.38 11.24 11.12 11.11 11.37 11.53 13.78 14.53 15.57 16.72 17.18 16.70 16.23 15.21 14.74 13.04 11.62 11.25 10.83 10.66 30 11.86 11.38 11.24 11.11 11.06 11.37 11.40 13.70 12.96 13.23 13.87 17.16 16.55 16.19 15.19 14.74 13.05 11.65 11.25 10.83 10.66 40 11.86 11.38 11.24 11.11 11.06 11.32 11.34 12.30 12.26 12.33 12.58 12.90 13.30 16.15 15.13 14.73 13.05 11.62 11.26 10.83 10.66 50 11.86 11.38 11.24 11.11 11.06 11.31 11.23 11.35 11.48 11.84 11.58 11.83 11.60 12.51 12.40 12.56 13.05 11.65 11.26 10.83 10.65 60 11.86 11.38 11.24 11.11 11.06 11.31 11.19 11.28 11.41 11.39 11.33 11.53 11.60 11.59 11.67 11.66 13.05 11.64 11.26 10.83 10.66 70 11.86 11.38 11.24 11.10 11.06 11.31 11.16 11.23 11.26 11.26 11.26 11.35 11.40 11.40 11.48 11.43 12.42 11.65 11.25 10.83 10.66 80 11.35 11.38 11.24 11.00 11.06 11.30 11.15 11.19 11.25 11.22 11.23 11.30 11.35 11.34 11.39 11.38 11.56 11.64 11.25 10.83 10.65 90 11.31 11.38 11.24 11.09 11.06 11.29 11.13 11.16 11.20 11.17 11.22 11.25 11.27 11.30 11.32 11.35 11.51 11.66 11.25 10.82 10.61 100 11.27 11.35 11.24 11.09 11.06 11.25 11.11 11.15 11.18 11.17 11.21 11.23 11.27 11.27 11.30 11.32 11.39 11.65 11.25 10.83 10.58 110 11.24 11.34 11.23 11.09 11.06 11.21 11.10 11.12 11.17 11.15 11.19 11.20 11.24 11.26 11.28 11.30 11.35 11.65 11.26 10.83 10.56 120 11.22 11.32 11.22 11.09 11.06 11.14 11.10 11.11 11.18 11.14 11.18 11.18 11.22 11.24 11.25 11.30 11.34 11.65 11.26 10.83 10.56 130 11.21 11.27 11.22 11.08 11.06 11.11 11.08 11.09 11.14 11.13 11.17 11.18 11.20 11.22 11.23 11.28 11.33 11.49 11.26 10.82 10.55 140 11.21 11.26 11.21 11.08 11.06 11.09 11.08 11.09 11.15 11.13 11.16 11.17 11.20 11.21 11.21 11.27 11.32 11.39 11.26 10.82 10.53 150 11.20 11.22 11.20 11.08 11.07 11.09 11.08 11.09 11.14 11.13 11.16 11.17 11.20 11.21 11.21 11.26 11.31 11.34 11.26 10.79 10.47 Dissolved Oxygen (g m-3) Depth (m) 0 10.3 10.6 10.5 10.5 10.5 10.5 10.1 9.9 9.5 9.1 9.2 9.3 9.4 9.2 9.5 9.7 10.2 10.5 10.6 10.7 10.7 10 10.2 10.4 10.5 10.5 10.6 10.5 10.0 9.9 9.5 9.2 9.3 9.4 9.0 9.1 9.2 9.6 9.9 10.5 10.6 10.5 10.5 20 10.2 10.2 10.3 10.4 10.4 10.4 10.2 9.8 9.4 9.0 9.1 9.0 8.8 9.0 9.1 9.4 9.8 10.5 10.6 10.5 10.5 30 10.2 9.9 10.1 10.3 10.1 10.1 10.0 9.5 9.2 9.2 9.1 8.9 8.5 9.0 8.8 9.3 9.5 10.3 10.3 10.4 10.4 40 10.1 9.9 10.0 10.0 9.8 10.0 9.7 9.3 9.0 9.1 8.7 8.4 8.0 8.9 8.8 9.2 9.5 10.1 10.1 10.4 10.3 50 10.0 9.0 9.9 9.9 9.8 9.8 9.4 9.0 8.7 8.8 8.5 8.1 7.9 8.2 8.2 8.6 9.4 9.8 9.9 10.3 10.3 60 9.9 8.8 9.8 9.7 9.6 9.7 9.2 8.9 8.6 8.4 8.2 8.0 7.7 8.0 8.0 8.2 9.4 9.9 9.8 10.3 10.2 70 9.9 8.7 9.8 9.6 9.6 9.6 9.1 8.7 8.5 8.3 8.1 7.9 7.6 8.0 7.8 7.9 9.1 9.6 9.7 10.2 10.2 80 8.7 8.6 9.7 9.5 9.5 9.6 8.9 8.6 8.4 8.1 8.0 7.9 7.5 8.0 7.7 7.9 8.5 9.7 9.6 10.2 10.1 90 8.5 8.5 9.7 9.5 9.5 9.5 8.9 8.6 8.3 8.1 8.0 7.9 7.5 7.9 7.6 7.8 8.0 9.5 9.5 10.1 10.0 100 8.2 8.4 9.6 9.5 9.5 9.4 8.8 8.6 8.2 7.9 7.8 7.8 7.4 7.8 7.5 7.7 7.7 9.5 9.4 10.1 10.0 110 8.2 8.1 9.6 9.4 9.5 9.3 8.8 8.4 8.2 7.9 7.8 7.7 7.3 7.7 7.4 7.6 7.6 9.4 9.4 9.9 9.9 120 8.0 8.0 9.5 9.4 9.5 9.3 8.7 8.4 8.1 7.8 7.7 7.5 7.1 7.6 7.3 7.4 7.5 9.4 9.3 10.0 9.9 130 8.0 7.9 9.5 9.4 9.4 9.1 8.7 8.3 8.0 7.8 7.5 7.3 7.0 7.5 7.2 7.3 7.4 9.1 9.2 10.0 9.9 140 7.8 7.8 9.5 9.3 9.4 9.0 8.5 8.2 7.9 7.5 7.4 7.3 6.9 7.4 7.0 7.3 7.3 8.3 9.2 9.9 9.9 150 7.7 7.6 9.3 9.3 9.4 8.9 8.5 8.0 7.7 7.3 7.2 7.1 6.8 7.1 6.8 7.1 7.3 8.0 9.2 9.8 9.7 Secchi depth (m) 14.5 14 13.5 13 12.5 13 17 16 18.5 17.5 19 17 15 16 15 18 13.5 12 11 12.5 12

Lake Taupo Long-Term Monitoring Programme 2007-2008 42
Lake Taupo Temperature, Dissolved Oxygen, and Secchi Depth Database. 2003-2004 Additional site B (Kuratau Basin ) for the period starting 14 July 2003
Temperature Date 14/07/2003 31/07/2003 14/08/2003 26/08/2003 8/09/2003 7/10/2003 21/10/2003 19/11/2003 4/12/2003 18/12/2003 13/01/2004 26/02/2004 8/03/2004 31/03/2004 14/04/2004 10/05/2004 10/06/2004 13/07/2004 26/07/2004 24/08/2004 7/09/2004 Depth (m) 0 11.82 11.32 11.38 11.36 11.13 11.70 13.31 13.79 15.65 17.08 20.25 16.83 17.63 15.92 15.10 14.72 13.02 11.43 11.26 10.92 10.85 10 11.80 11.29 11.22 11.17 11.11 11.44 12.28 13.49 15.00 16.43 19.73 16.72 16.56 15.90 15.02 14.68 12.95 11.40 11.20 10.77 10.59 20 11.79 11.29 11.22 11.14 11.07 11.40 11.71 13.33 13.81 15.28 16.73 16.58 16.51 15.89 15.00 14.64 12.84 11.41 11.20 10.73 10.58 30 11.79 11.29 11.21 11.13 11.03 11.35 11.46 12.22 12.37 13.38 13.74 16.16 16.40 15.88 14.99 14.47 12.71 11.41 11.20 10.72 10.57 40 11.79 11.29 11.21 11.13 11.02 11.34 11.38 11.67 11.90 12.91 12.48 15.75 15.53 15.53 14.18 14.07 12.67 11.41 11.19 10.72 10.57 50 11.79 11.29 11.21 11.13 11.02 11.33 11.28 11.40 11.57 11.65 11.62 12.97 12.55 12.89 12.48 12.48 12.66 11.41 11.19 10.72 10.56 60 11.78 11.29 11.21 11.13 11.01 11.25 11.23 11.31 11.37 11.33 11.40 11.88 11.64 11.69 11.72 11.78 12.57 11.40 11.19 10.72 10.56 70 11.78 11.29 11.21 11.12 11.01 11.12 11.15 11.24 11.25 11.27 11.28 11.55 11.47 11.49 11.51 11.47 12.51 11.41 11.18 10.72 10.56 80 11.77 11.29 11.16 11.12 11.01 11.06 11.09 11.18 11.21 11.25 11.20 11.38 11.41 11.37 11.43 11.38 12.27 11.37 11.18 10.72 10.51 90 11.35 11.29 11.04 11.11 11.01 11.02 11.08 11.13 11.13 11.19 11.16 11.32 11.35 11.32 11.37 11.31 11.77 11.26 11.17 10.71 10.45 100 11.27 11.29 10.91 11.08 11.01 11.02 11.05 11.10 11.11 11.16 11.14 11.28 11.33 11.26 11.30 11.24 11.65 11.24 11.17 10.66 10.38 Dissolved Oxygen (g m-3) Depth (m) 0 10.7 10.9 10.8 10.6 10.6 10.4 10.5 10.1 9.8 9.1 9.2 9.3 9.5 8.8 10.5 11.4 12.3 10.6 10.5 10.5 10.8 10 10.5 11.0 10.6 10.6 10.5 10.4 10.4 10.3 9.9 9.3 9.2 9.1 9.0 9.0 9.5 10.2 10.7 10.6 10.5 10.4 10.7 20 10.3 11.3 10.4 10.2 10.2 10.2 10.1 9.9 9.6 9.4 9.2 9.0 8.9 8.9 9.2 9.9 10.1 10.1 10.5 10.5 10.7 30 10.2 11.2 10.1 9.9 10.1 9.9 10.0 9.6 9.3 9.1 9.0 9.0 8.7 8.8 8.9 9.4 9.7 9.8 10.3 10.4 10.6 40 10.1 11.2 9.9 9.8 9.9 9.6 9.7 9.2 8.9 9.1 8.8 8.7 8.2 8.7 8.5 9.1 9.6 9.6 10.0 10.3 10.5 50 10.0 10.9 9.8 9.6 9.8 9.6 9.4 9.0 8.8 8.7 8.5 8.2 7.9 8.2 7.9 8.5 9.3 9.5 9.8 10.2 10.3 60 9.9 10.7 9.7 9.5 9.7 9.4 9.0 8.8 8.6 8.3 8.2 8.1 7.7 8.0 7.6 8.0 9.2 9.3 9.6 10.1 10.3 70 9.9 10.4 9.7 9.5 9.7 9.3 8.9 8.7 8.6 8.3 8.1 7.9 7.6 7.8 7.3 7.7 8.9 9.2 9.6 10.1 10.2 80 9.8 10.3 9.4 9.4 9.6 9.1 8.7 8.6 8.4 7.9 7.8 7.8 7.4 7.6 7.1 7.4 8.7 9.1 9.4 10.0 10.1 90 9.2 10.1 9.2 9.3 9.6 9.0 8.7 8.5 8.3 7.9 7.8 7.7 7.3 7.6 7.0 7.5 8.3 8.7 9.5 9.9 10.1 100 8.3 10.0 9.2 9.3 9.6 8.9 8.6 8.2 7.9 7.9 7.6 7.4 7.3 7.3 6.8 7.0 8.1 8.1 9.4 9.8 10.0
Secchi depth
(m) 12 13 13 11.5 11 9.5 15 17 17 15 16 13.5 5 11 14 15.5 12 11 10 10 11

Lake Taupo Long-Term Monitoring Programme 2007-2008 43
Lake Taupo Temperature, Dissolved Oxygen, and Secchi Depth Database. 2003-2004 Additional site C (Western Bays ) for the period starting 14 July 2003
Temperature Date 14/07/2003 31/07/2003 14/08/2003 26/08/2003 8/09/2003 7/10/2003 21/10/2003 19/11/2003 4/12/2003 18/12/2003 13/01/2004 26/02/2004 8/03/2004 31/03/2004 14/04/2004 10/05/2004 10/06/2004 13/07/2004 26/07/2004 24/08/2004 7/09/2004 Depth (m) 0 11.86 11.43 11.56 11.31 11.32 11.85 13.29 15.10 15.79 17.00 20.17 16.90 18.43 16.37 15.41 14.98 13.16 11.58 11.51 10.97 11.14 10 11.80 11.36 11.26 11.21 11.13 11.24 11.93 13.84 15.29 16.33 18.89 16.69 17.02 16.35 15.18 14.80 13.08 11.61 11.32 10.94 10.73 20 11.80 11.34 11.25 11.14 11.09 11.17 11.62 13.76 14.31 15.26 17.11 16.34 16.45 16.35 15.15 14.76 13.07 11.61 11.30 10.90 10.71 30 11.80 11.32 11.25 11.14 11.08 11.14 11.52 13.63 12.99 13.46 13.74 14.66 15.33 15.95 15.15 14.75 13.07 11.61 11.31 10.90 10.71 40 11.80 11.31 11.25 11.14 11.08 11.14 11.50 11.91 12.03 12.88 12.25 12.56 13.64 13.21 15.14 14.73 13.07 11.60 11.31 10.89 10.70 50 11.80 11.31 11.25 11.14 11.07 11.13 11.46 11.42 11.43 11.64 11.57 11.63 11.64 11.68 12.68 12.57 12.80 11.61 11.30 10.90 10.70 60 11.80 11.31 11.25 11.14 11.07 11.13 11.38 11.31 11.30 11.31 11.36 11.53 11.48 11.45 11.76 11.73 11.68 11.60 11.30 10.89 10.70 70 11.80 11.31 11.25 11.14 11.07 11.12 11.21 11.27 11.28 11.26 11.28 11.39 11.37 11.34 11.54 11.48 11.44 11.61 11.30 10.89 10.70 80 11.79 11.31 11.25 11.14 11.07 1.10 11.13 11.20 11.25 11.22 11.25 11.31 11.35 11.32 11.37 11.39 11.37 11.58 11.30 10.89 10.70 90 11.60 11.29 11.25 11.14 11.07 11.04 11.07 11.14 11.21 11.19 11.21 11.26 11.33 11.29 11.30 11.32 11.33 11.61 11.30 10.89 10.70 100 11.28 11.27 11.24 11.14 11.07 11.03 11.07 11.11 11.19 11.12 11.19 11.23 11.32 11.25 11.29 11.31 11.32 11.61 11.30 10.89 10.70 Dissolved Oxygen (g m-3) Depth (m) 0 10.3 10.7 10.3 10.4 10.4 11.4 10.1 9.8 9.5 9.2 9.2 9.3 9.3 9.4 10.4 10.3 10.6 10.6 11.0 10.4 10.7 10 10.3 10.8 10.3 10.3 10.4 11.0 10.1 9.9 9.9 9.1 9.2 9.1 9.0 9.2 9.5 9.8 10.1 10.6 10.5 10.4 10.4 20 10.1 10.3 10.1 10.1 10.2 10.8 9.9 9.9 9.5 9.2 9.1 9.2 9.1 9.0 9.1 9.7 9.9 10.6 10.2 10.3 10.4 30 10.1 10.0 9.9 9.9 10.0 10.1 9.6 9.6 9.3 9.1 8.8 8.6 8.6 8.9 8.9 9.4 9.7 10.3 9.9 10.2 10.4 40 10.0 10.0 9.8 9.7 9.9 9.7 9.4 9.4 9.0 9.1 8.8 8.4 8.4 8.3 8.7 9.2 9.6 9.9 9.8 10.1 10.3 50 9.9 9.9 9.6 9.6 9.7 9.7 9.3 9.2 8.8 8.8 8.5 8.2 8.0 8.0 8.2 8.7 9.3 9.6 9.6 10.1 10.2 60 9.8 9.6 9.6 9.5 9.6 9.5 9.2 9.0 8.5 8.5 8.2 8.0 7.9 8.0 7.8 8.2 8.6 9.5 9.5 10.1 10.2 70 9.8 9.5 9.5 9.4 9.5 9.4 9.1 8.8 8.5 8.3 8.1 7.9 7.8 7.9 7.5 8.0 8.2 9.4 9.5 10.0 10.1 80 9.7 9.5 9.5 9.4 9.5 9.3 8.8 8.8 8.3 8.2 7.9 7.8 7.8 7.8 7.4 7.8 8.0 9.3 9.4 10.0 10.0 90 9.6 9.1 9.4 9.3 9.4 9.2 8.7 8.6 8.4 7.9 7.8 7.8 7.7 7.7 7.3 7.6 7.9 9.2 9.2 9.9 10.0 100 8.8 8.8 9.0 9.3 9.4 9.1 8.7 8.5 8.3 7.9 7.7 7.6 7.7 7.5 7.3 7.5 7.8 9.1 9.3 9.9 10.0
Secchi depth
(m) 14 12 14.5 13 12 12.5 12 17.2 17 19 17.5 14 13 12.5 16.5 16 14 12.5 11 10 12

Lake Taupo Long-Term Monitoring Programme 2007-2008 44
Lake Taupo Temperature, Dissolved Oxygen, and Secchi Depth Database. 2002-2003 Mid-Lake site A for the period starting 1 July 2002
Temperature Date 1/07/2002 17/07/2002 31/07/2002 29/08/2002 18/09/2002 9/10/2002 13/11/2002 28/11/2002 18/12/2002 30/01/2003 13/02/2003 17/03/2003 3/04/2003 28/04/2003 15/05/2003 12/06/2003 14/07/2003 31/07/2003 14/08/2003 26/08/2003 8/09/2003 Depth (m) 0 12.13 11.44 11.20 11.10 11.38 11.60 12.58 14.12 15.00 17.84 19.31 18.55 19.05 16.76 15.67 13.59 11.85 11.38 11.25 11.23 11.13 10 12.12 11.44 11.20 10.90 11.33 11.60 12.55 14.02 14.78 17.59 19.19 18.43 18.70 16.73 15.57 13.56 11.86 11.38 11.24 11.17 11.13 20 12.11 11.44 11.20 10.90 11.28 11.40 12.50 12.91 14.48 17.08 18.10 18.37 18.59 16.73 15.56 13.55 11.86 11.38 11.24 11.12 11.11 30 12.11 11.44 11.20 10.80 11.02 11.30 12.38 12.41 14.26 16.13 15.50 16.77 17.02 16.72 15.57 13.55 11.86 11.38 11.24 11.11 11.06 40 12.11 11.44 11.20 10.90 10.97 11.30 12.16 11.98 12.67 12.69 12.85 13.44 13.31 12.80 15.53 12.22 11.86 11.38 11.24 11.11 11.06 50 12.11 11.44 11.20 10.90 10.96 11.20 12.00 11.54 11.87 12.03 12.14 12.03 12.30 11.96 12.20 11.82 11.86 11.38 11.24 11.11 11.06 60 12.10 11.44 11.20 10.80 10.94 11.20 11.72 11.22 11.64 11.70 11.68 11.60 11.81 11.62 11.61 11.52 11.86 11.38 11.24 11.11 11.06 70 12.10 11.44 11.20 10.80 10.93 11.20 11.51 11.09 11.31 11.41 11.33 11.39 11.52 11.34 11.36 11.38 11.86 11.38 11.24 11.10 11.06 80 11.97 11.44 11.20 10.90 10.92 11.10 11.32 10.98 11.17 11.25 11.25 11.27 11.31 11.27 11.27 11.27 11.35 11.38 11.24 11.00 11.06 90 11.49 11.43 11.20 10.90 10.91 11.10 11.13 10.95 11.06 11.15 11.16 11.16 11.20 11.17 11.22 11.21 11.31 11.38 11.24 11.09 11.06 100 11.39 11.41 11.20 10.90 10.90 11.10 11.05 10.92 11.04 11.11 11.10 11.13 11.18 11.15 11.20 11.20 11.27 11.35 11.24 11.09 11.06 110 11.32 11.37 11.20 10.90 10.89 11.00 11.05 10.90 11.04 11.09 11.08 11.10 11.13 11.13 11.16 11.17 11.24 11.34 11.23 11.09 11.06 120 11.29 11.32 11.20 10.90 10.87 11.00 11.01 10.87 11.00 11.06 11.06 11.09 11.13 11.13 11.15 11.15 11.22 11.32 11.22 11.09 11.06 130 11.25 11.27 11.20 10.90 10.85 10.90 10.99 10.85 10.98 11.04 11.04 11.08 11.09 11.10 11.12 11.12 11.21 11.27 11.22 11.08 11.06 140 11.23 11.26 11.20 10.80 10.83 10.90 10.97 10.83 10.97 11.03 11.03 11.09 11.09 11.09 11.12 11.11 11.21 11.26 11.21 11.08 11.06 150 11.23 11.26 11.20 10.80 10.81 10.90 10.96 10.82 10.97 11.03 11.03 11.07 11.08 11.09 11.11 11.11 11.20 11.22 11.20 11.08 11.07 Dissolved Oxygen (g m-3) Depth (m) 0 10.3 10.4 9.7 10.5 10.5 10.3 10.2 9.8 9.6 9.1 8.9 9.0 8.8 9.2 9.5 10.0 10.3 10.6 10.5 10.5 10.5 10 10.3 10.7 9.5 10.4 10.7 10.3 10.2 10.0 9.7 9.1 8.9 8.9 8.8 9.2 9.2 9.7 10.2 10.4 10.5 10.5 10.6 20 10.3 10.7 9.4 10.3 10.6 10.2 10.2 10.1 9.6 9.2 8.9 8.8 8.6 9.1 9.3 9.4 10.2 10.2 10.3 10.4 10.4 30 10.2 10.7 9.4 10.3 10.5 10.2 10.2 10.1 9.6 9.1 8.8 8.5 8.3 8.9 9.2 9.3 10.2 9.9 10.1 10.3 10.1 40 10.2 10.6 9.4 10.2 10.4 10.2 10.1 9.7 9.5 9.2 8.8 8.4 8.0 8.4 9.1 9.0 10.1 9.9 10.0 10.0 9.8 50 10.2 10.6 9.4 10.2 10.3 10.1 10.1 9.7 9.3 9.1 8.6 8.2 7.8 8.2 8.2 8.2 10.0 9.0 9.9 9.9 9.8 60 10.1 10.5 9.4 10.2 10.2 10.1 10.0 9.5 9.1 8.9 8.4 8.0 7.7 8.1 8.1 8.1 9.9 8.8 9.8 9.7 9.6 70 10.1 10.5 9.3 10.1 10.2 10.0 9.9 9.5 8.8 8.8 8.4 7.8 7.6 8.0 8.0 8.0 9.9 8.7 9.8 9.6 9.6 80 10.0 10.3 9.4 10.1 10.2 10.1 9.7 9.4 8.7 8.7 8.3 7.8 7.5 7.9 7.8 7.9 8.7 8.6 9.7 9.5 9.5 90 9.7 10.3 9.4 10.1 10.1 10.1 9.5 9.3 8.7 8.7 8.2 7.8 7.4 7.8 7.5 7.6 8.5 8.5 9.7 9.5 9.5 100 8.6 10.1 9.4 10.1 10.0 9.8 9.4 9.1 8.6 8.6 8.1 7.7 7.3 7.7 7.2 7.5 8.2 8.4 9.6 9.5 9.5 110 8.3 9.8 9.3 9.9 9.9 9.8 9.4 9.1 8.4 8.4 8.0 7.6 7.2 7.6 7.1 7.4 8.2 8.1 9.6 9.4 9.5 120 8.1 8.8 9.3 9.9 9.9 9.8 9.3 9.0 8.3 8.3 7.8 7.4 7.0 7.5 7.1 7.2 8.0 8.0 9.5 9.4 9.5 130 8.0 8.5 9.3 9.9 9.9 9.7 9.2 9.0 8.3 8.2 7.7 7.2 6.9 7.4 7.0 7.0 8.0 7.9 9.5 9.4 9.4 140 7.8 8.1 9.3 9.9 9.9 9.4 9.0 8.8 8.2 8.0 7.4 7.1 6.8 7.2 6.8 6.7 7.8 7.8 9.5 9.3 9.4 150 7.8 8.1 9.3 9.8 9.8 9.4 8.9 8.7 8.1 7.9 7.3 6.9 6.5 6.9 6.7 6.5 7.7 7.6 9.3 9.3 9.4 Secchi depth (m) 16 15.5 12 9.5 12 15.5 18 12.7 13.5 18 19 15 13.5 14 16.5 11 14.5 14 13.5 13 12.5

Lake Taupo Long-Term Monitoring Programme 2007-2008 45
Lake Taupo Temperature, Dissolved Oxygen, and Secchi Depth Database. 2002-2003 Additional site B (Kuratau Basin ) for the period starting 1 July 2002
Temperature Date 1/07/2002 17/07/2002 31/07/2002 29/08/2002 18/09/2002 9/10/2002 13/11/2002 28/11/2002 18/12/2002 30/01/2003 13/02/2003 17/03/2003 3/04/2003 28/04/2003 15/05/2003 12/06/2003 14/07/200331/07/2003 14/08/2003 26/08/2003 8/09/2003
Depth (m) 0 12.13 11.48 11.3 11 11.08 11.70 11.98 13.82 15.16 16.76 18.87 18.74 19.09 16.73 15.79 13.24 11.82 11.32 11.38 11.36 11.13 10 12.09 11.49 11.1 10.8 11.05 11.30 11.94 13.67 15.08 16.75 18.46 18.54 18.82 16.66 15.49 13.02 11.8 11.29 11.22 11.17 11.11 20 12.09 11.48 11.1 10.8 11.03 11.20 11.9 12.79 13.86 16.53 17.71 18.45 18.49 16.62 15.47 12.79 11.79 11.29 11.22 11.14 11.07 30 12.09 11.48 11.1 10.8 11.03 11.20 11.8 12.31 13.4 14.33 16.2 14.87 15.32 16.2 15.41 11.83 11.79 11.29 11.21 11.13 11.03 40 12.08 11.48 11.1 10.8 11.02 11.20 11.68 11.75 13.18 12.98 13.89 12.03 13.25 13.46 13.2 11.62 11.79 11.29 11.21 11.13 11.02 50 11.97 11.49 11.1 10.8 10.91 11.20 11.44 11.44 12.91 12.1 12.59 12.06 12 12.28 12.09 11.51 11.79 11.29 11.21 11.13 11.02 60 11.93 11.49 11.1 10.8 10.9 11.10 11.26 11.27 12.27 11.69 11.75 11.58 11.58 11.7 11.71 11.38 11.78 11.29 11.21 11.13 11.01 70 11.87 11.48 11.1 10.8 10.89 11.10 11.11 11.17 11.58 11.37 11.4 11.36 11.35 11.4 11.4 11.29 11.78 11.29 11.21 11.12 11.01 80 11.78 11.48 11.1 10.8 10.89 11.00 11 11.03 11.51 11.23 11.3 11.24 11.25 11.25 11.28 11.27 11.77 11.29 11.16 11.12 11.01 90 11.37 11.46 11.1 10.7 10.87 11.00 10.93 10.96 11.39 11.14 11.17 11.13 11.15 11.18 11.21 11.26 11.35 11.29 11.04 11.11 11.01 100 11.28 11.3 11 10.7 10.85 11.00 10.91 10.92 11.2 11.09 11.12 11.13 11.12 11.12 11.18 11.25 11.27 11.29 10.91 11.08 11.01 110 10.7 10.7 10.90 Dissolved Oxygen (g m-3) Depth (m) 0 10.3 10.4 9.9 10.4 10.4 10.4 10.3 9.9 9.6 9.3 9.4 8.9 8.9 9.7 9.4 10 10.7 10.9 10.8 10.6 10.6 10 10.3 10.8 9.7 10.3 10.5 10.5 10.3 10 9.7 9.3 9.3 8.9 8.8 9.6 9.4 10 10.5 11 10.6 10.6 10.5 20 10.2 10.6 9.6 10.3 10.5 10.3 10.3 9.9 9.5 9.2 9.3 8.8 8.5 9.5 9.3 9.6 10.3 11.3 10.4 10.2 10.2 30 10.2 10.6 9.6 10.2 10.5 10.3 103 9.9 9.6 9.2 9.2 8.2 8.1 9.4 8.8 9.2 10.2 11.2 10.1 9.9 10.1 40 10.1 10.5 9.6 10.2 10.4 10.2 10.2 9.5 9.4 9.1 9 8.2 8 8.8 8.5 8.8 10.1 11.2 9.9 9.8 9.9 50 10.1 10.5 9.6 10.1 10.3 10.1 10.1 9.5 9.4 8.9 8.8 8 7.7 8.3 7.9 8.5 10 10.9 9.8 9.6 9.8 60 9.8 10.4 9.6 10.1 10.2 10.1 9.9 9.4 9.2 8.6 8.6 7.8 7.6 8.3 7.8 8.3 9.9 10.7 9.7 9.5 9.7 70 9.7 10.4 9.5 10 10.1 9.8 9.8 9.4 9 8.4 8.4 7.7 7.4 8.2 7.7 8.2 9.9 10.4 9.7 9.5 9.7 80 9.5 10.3 9.5 10 10.1 9.7 9.7 9 8.6 8.3 8.3 7.3 7.3 8 7.7 8.1 9.8 10.3 9.4 9.4 9.6 90 9.1 10.3 9.5 10 10 9.7 9.5 9 8.6 8.2 8 7.2 7.1 7.7 7.5 7.7 9.2 10.1 9.2 9.3 9.6 100 8.7 9.8 9.6 9.9 9.9 9.7 9.2 9 8.4 7.7 7.6 7 7 7.6 7.1 7.5 8.3 10 9.2 9.3 9.6 110 9.2 9.8 9.4 Secchi depth
(m) 16 12.5 10.5 8 11 16 14 12.7 14 18 11 14 12.8 13.5 15.5 12 12 13 13 11.5 11

Lake Taupo Long-Term Monitoring Programme 2007-2008 46
Lake Taupo Temperature, Dissolved Oxygen, and Secchi Depth Database. 2002-2003 Additional site C (Western Bays ) for the period starting 1 July 2002
Temperature Date 1/07/2002 17/07/2002 31/07/2002 29/08/2002 18/09/2002 9/10/2002 13/11/2002 28/11/2002 18/12/2002 30/01/2003 13/02/2003 17/03/2003 3/04/2003 28/04/2003 15/05/2003 12/06/2003 14/07/2003 31/07/2003 14/08/2003 26/08/2003 8/09/2003
Depth (m) 0 12.22 11.52 11.6 11.4 11.24 12.10 12.56 13.98 15.12 17.61 19.58 19.04 18.15 17.1 15.8 13.65 11.86 11.43 11.56 11.31 11.32
10 12.15 11.5 11.2 10.9 11.23 11.30 12.5 13.45 14.21 17.49 18.95 18.45 18.58 16.82 15.54 13.62 11.8 11.36 11.26 11.21 11.13 20 12.14 11.49 11.2 10.9 11.16 11.30 12.38 12.63 13.31 17.48 17.41 18.29 18.3 16.77 15.52 13.59 11.8 11.34 11.25 11.14 11.09 30 12.14 11.49 11.2 10.8 11.06 11.20 12.33 12.42 12.73 14.31 14.19 14.81 14.61 16.76 15.51 13.59 11.8 11.32 11.25 11.14 11.08 40 12.13 11.49 11.2 10.8 11.02 11.20 11.75 12.2 11.98 12.36 12.79 12.88 12.73 13.62 13.07 13.59 11.8 11.31 11.25 11.14 11.08 50 12.13 11.49 11.2 10.8 11.02 11.20 11.28 11.98 11.53 12 11.98 11.86 12.1 12.08 12.14 13.54 11.8 11.31 11.25 11.14 11.07 60 11.92 11.49 11.2 10.8 11 11.10 11.12 11.37 11.33 11.61 11.68 11.49 11.71 11.56 11.71 13.28 11.8 11.31 11.25 11.14 11.07 70 11.55 11.49 11.2 10.8 10.99 11.10 11.08 11.21 11.15 11.29 11.3 11.35 11.37 11.35 11.4 11.8 11.8 11.31 11.25 11.14 11.07 80 11.5 11.49 11.2 10.8 10.95 11.10 11.03 11.04 11.12 11.19 11.19 11.25 11.22 11.24 11.27 11.45 11.79 11.31 11.25 11.14 11.07 90 11.47 11.49 11.2 10.8 10.94 11.00 11 10.98 11.1 11.11 11.15 11.2 11.18 11.18 11.22 11.35 11.6 11.29 11.25 11.14 11.07
100 11.45 11.49 11.2 10.8 10.92 11.00 10.97 10.96 11.08 11.08 11.13 11.2 11.15 11.15 11.17 11.23 11.28 11.27 11.24 11.14 11.07
Dissolved Oxygen (g m-3) Depth (m)
0 10.4 10.5 9.7 10.3 10.5 10.4 10.2 9.9 9.6 9.1 9.5 9.9 8.9 9.4 9.3 10 10.3 10.7 10.3 10.4 10.4 10 10.4 10.8 9.5 10.2 10.7 10.4 10.3 9.7 9.6 9 9.3 9.7 8.8 9.2 9.1 9.6 10.3 10.8 10.3 10.3 10.4 20 10.4 10.8 9.5 10.2 10.7 10.4 10.3 9.9 9.7 9 9.3 9 8.8 9.2 9 9.3 10.1 10.3 10.1 10.1 10.2 30 10.3 10.7 9.4 10.1 10.6 10.4 10.2 9.9 9.6 8.7 9 8.4 8.3 9 8.8 9.1 10.1 10 9.9 9.9 10 40 10.3 10.5 9.4 10 10.5 10.3 10.1 9.7 9.5 8.7 9 8.4 8.1 8.5 8.3 9.3 10 10 9.8 9.7 9.9 50 10.2 10.5 9.4 10 10.4 10 9.9 9.7 9.2 8.6 8.7 8.1 7.9 8.2 7.8 9.2 9.9 9.9 9.6 9.6 9.7 60 10 10.5 9.4 10 10.4 10 9.7 9.6 9.1 8.5 8.5 8.1 7.9 8.2 7.8 9.9 9.8 9.6 9.6 9.5 9.6 70 9.6 10.5 9.4 9.9 10.3 9.9 9.7 9.5 9 8.4 8.4 7.9 7.8 8 7.7 9.7 9.8 9.5 9.5 9.4 9.5 80 8.8 10.5 9.3 9.9 10.2 9.9 9.5 9 8.8 8.3 8.3 7.6 7.7 8 7.5 9.4 9.7 9.5 9.5 9.4 9.5 90 8.7 10.4 9.3 9.9 10.1 9.8 9.5 9.1 8.7 8.1 8.3 7.5 7.6 7.9 7.3 9.2 9.6 9.1 9.4 9.3 9.4
100 8.6 10.2 9.3 10 10 9.6 9.3 9.1 8.7 8 8.1 7.3 7.4 7.8 7.2 9.1 8.8 8.8 9 9.3 9.4
Secchi depth (m) 14 12.5 12 8 12 19 16 15.5 13.5 18.5 19 15 14.5 14.5 17 11 14 12 14.5 13 12

Lake Taupo Long-Term Monitoring Programme 2007-2008 47
Lake Taupo Temperature, Dissolved Oxygen, and Secchi Depth Database. 2001-2002 Mid-Lake site A for the period starting 2 July 2001
Temperature Date 2/07/01 25/07/01 13/08/01 3/09/01 25/09/01 25/10/01 12/11/01 10/12/01 20/12/01 8/01/02 22/01/02 6/03/02 4/04/02 22/04/02 5/05/02 19/06/02 1/07/02 17/07/02 31/07/02 29/08/02 18/09/02 9/10/02 Depth (m)
0 12.11 11.26 11.15 10.96 11.58 12.97 14.23 15.47 17.92 18.37 19.4 18.69 17.45 17.05 15.51 12.57 12.13 11.44 11.2 11.1 11.38 11.60 10 12.04 11.26 11.12 10.98 11.57 12.91 14.16 15.51 16.60 18.07 18.8 18.69 17.38 16.64 15.54 12.57 12.12 11.44 11.2 10.9 11.33 11.60 20 12.00 11.26 11.12 10.95 11.56 12.90 13.37 15.52 15.46 17.62 18.05 18.68 17.18 16.61 15.52 12.57 12.11 11.44 11.2 10.9 11.28 11.40 30 11.99 11.26 11.11 10.94 11.52 12.89 12.85 14.52 13.79 13.5 14.8 15.3 16.83 16.56 15.5 12.56 12.11 11.44 11.2 10.8 11.02 11.30 40 11.98 11.26 11.11 10.94 11.04 12.00 11.87 13.01 12.41 12.43 13.1 12.42 12.9 13.35 15.39 12.56 12.11 11.44 11.2 10.9 10.97 11.30 50 11.98 11.26 11.11 10.94 10.96 11.50 11.57 11.80 11.70 11.61 12.06 11.73 12.09 11.93 11.92 12.56 12.11 11.44 11.2 10.9 10.96 11.20 60 11.95 11.26 11.10 10.94 10.92 11.13 11.24 11.27 11.32 11.38 11.52 11.43 11.51 11.53 11.49 12.53 12.1 11.44 11.2 10.8 10.94 11.20 70 11.76 11.26 11.09 10.94 10.91 11.01 11.13 11.13 11.22 11.24 11.25 11.27 11.3 11.3 11.33 11.98 12.1 11.44 11.2 10.8 10.93 11.20 80 11.51 11.26 11.08 10.92 10.90 10.96 11.03 11.05 11.16 11.16 11.17 11.2 11.24 11.25 11.27 11.35 11.97 11.44 11.2 10.9 10.92 11.10 90 11.45 11.26 11.08 10.91 10.90 10.95 11.01 11.02 11.12 11.13 11.15 11.17 11.19 11.22 11.28 11.27 11.49 11.43 11.2 10.9 10.91 11.10
100 11.41 11.26 11.08 10.91 10.90 10.94 10.99 11.00 11.08 11.12 11.14 11.16 11.17 11.2 11.38 11.25 11.39 11.41 11.2 10.9 10.9 11.10 110 11.39 11.26 11.08 10.91 10.90 10.92 10.97 10.99 11.07 11.1 11.13 11.13 11.14 11.18 11.27 11.24 11.32 11.37 11.2 10.9 10.89 11.00 120 11.36 11.26 11.08 10.91 10.89 10.92 10.95 10.97 11.04 11.1 11.12 11.13 11.14 11.17 11.26 11.21 11.29 11.32 11.2 10.9 10.87 11.00 130 11.35 11.26 11.07 10.90 10.89 10.91 10.94 10.96 11.04 11.09 11.1 11.13 11.13 11.15 11.24 11.2 11.25 11.27 11.2 10.9 10.85 10.90 140 11.34 11.26 11.07 10.90 10.89 10.90 10.94 10.96 11.04 11.08 11.1 11.13 11.13 11.14 11.23 11.19 11.23 11.26 11.2 10.8 10.83 10.90 150 11.33 11.26 11.07 10.90 10.89 10.90 10.94 10.96 11.03 11.08 11.1 11.12 11.13 11.14 11.19 11.9 11.23 11.26 11.2 10.8 10.81 10.90
Dissolved Oxygen (g m-3) Depth (m)
0 9.2 10.2 9.6 10.6 10.4 9.9 9.5 9.4 9.1 9.1 9.0 8.7 8.8 9.4 10.5 10.2 10.3 10.4 9.7 10.5 10.5 10.3 10 9.1 10.5 9.6 10.7 10.4 9.9 9.8 9.5 8.9 9.0 8.9 8.7 8.9 9.3 9.5 10.2 10.3 10.7 9.5 10.4 10.7 10.3 20 9.4 9.4 9.6 10.6 10.4 10.0 9.4 9.5 9.0 9.0 9.1 8.7 8.8 9.3 9.5 10.2 10.3 10.7 9.4 10.3 10.6 10.2 30 9.8 9.2 9.6 10.6 10.4 10.1 9.4 9.1 8.8 9.0 9.1 8.4 8.7 9.2 9.4 10.2 10.2 10.7 9.4 10.3 10.5 10.2 40 9.8 9.1 9.6 10.6 10.0 9.7 8.9 9.1 8.6 8.8 9.0 8.4 8.3 8.7 9.3 10.1 10.2 10.6 9.4 10.2 10.4 10.2 50 9.6 8.9 9.6 10.6 9.9 9.5 9.0 8.7 8.6 8.7 8.7 8.2 8.2 8.3 8.6 10.1 10.2 10.6 9.4 10.2 10.3 10.1 60 9.4 8.9 9.5 10.5 9.8 9.3 8.7 8.6 8.5 8.6 8.6 8.2 8.1 8.1 8.3 10.0 10.1 10.5 9.4 10.2 10.2 10.1 70 9.5 9.0 9.4 10.4 9.7 9.3 8.8 8.7 8.5 8.6 8.5 8.2 8.0 8.0 8.2 9.6 10.1 10.5 9.3 10.1 10.2 10.0 80 7.7 8.9 9.4 10.4 9.7 9.2 8.6 8.4 8.5 8.6 8.4 8.1 7.9 7.9 8.2 8.5 10.0 10.3 9.4 10.1 10.2 10.1 90 7.8 8.9 9.4 10.4 9.6 9.5 8.8 8.5 8.5 8.6 8.2 8.1 7.8 7.8 8.0 8.3 9.7 10.3 9.4 10.1 10.1 10.1
100 7.5 8.6 9.3 10.4 9.6 9.2 8.6 8.4 8.3 8.5 8.1 8.0 7.8 7.8 7.5 8.2 8.6 10.1 9.4 10.1 10.0 9.8 110 7.4 8.7 9.3 10.4 9.6 9.2 8.6 8.4 8.3 8.4 8.1 8.0 7.7 7.7 7.3 8.1 8.3 9.8 9.3 9.9 9.9 9.8 120 6.9 8.5 9.3 10.3 9.5 9.0 8.4 8.4 8.3 8.2 8.1 7.9 7.7 7.6 7.2 8.0 8.1 8.8 9.3 9.9 9.9 9.8 130 6.9 8.5 9.3 10.2 9.5 9.0 8.4 8.4 8.3 8.2 8.2 7.9 7.6 7.5 7.3 7.9 8.0 8.5 9.3 9.9 9.9 9.7 140 6.8 8.3 9.2 10.2 9.5 8.6 8.2 8.2 8.1 8.0 8.1 7.8 7.1 7.8 7.3 7.8 7.8 8.1 9.3 9.9 9.9 9.4 150 6.4 8.2 9.2 10.2 9.3 8.5 8.1 8.1 7.9 7.8 7.9 7.6 7.0 7.2 7.3 7.7 7.8 8.1 9.3 9.8 9.8 9.4
Secchi depth
(m) 12 14.5 13.5 17.5 11 14.5 15.5 16 13 13 15 14.5 19 22 16.4 17 16 15.5 12 9.5 12 15.5

Lake Taupo Long-Term Monitoring Programme 2007-2008 48
Lake Taupo Temperature, Dissolved Oxygen, and Secchi Depth Database. 2001-2002 Additional site B (Kuratau Basin ) for the period starting 8 January 2002 on Temperature Date 8/01/2002 22/01/2002 6/03/2002 4/04/2002 22/04/2002 5/05/2002 19/06/2002 1/07/2002 17/07/2002 31/07/2002 29/08/2002 18/09/2002Depth (m)
0 18.1 18.8 18.64 17.38 16.84 15.12 12.45 12.13 11.48 11.3 11 11.08
10 17.55 18.45 18.58 17.35 16.61 15.14 12.44 12.09 11.49 11.1 10.8 11.05
20 15.72 17.4 18.56 17.1 16.6 15.05 12.44 12.09 11.48 11.1 10.8 11.03
30 13.74 13.9 15.07 16.74 16.4 14.75 12.43 12.09 11.48 11.1 10.8 11.03
40 12.62 12.73 13.08 14.3 13.4 14.4 12.24 12.08 11.48 11.1 10.8 11.02
50 11.92 11.98 11.91 12.77 12.12 14.07 12.11 11.97 11.49 11.1 10.8 10.91
60 11.31 11.41 11.5 12.03 11.53 12.96 11.73 11.93 11.49 11.1 10.8 10.9
70 11.21 11.25 11.24 11.5 11.32 12.2 11.49 11.87 11.48 11.1 10.8 10.89
80 11.15 11.19 11.21 11.29 11.24 11.97 11.38 11.78 11.48 11.1 10.8 10.89
90 11.1 11.13 11.15 11.2 11.18 11.69 11.3 11.37 11.46 11.1 10.7 10.87
100 11.1 11.12 11.12 11.19 11.15 11.39 11.22 11.28 11.3 11 10.7 10.85
110 10.7 10.7
Dissolved Oxygen (g m-3) Depth (m)
0 8.7 8.8 9.3 9.3 9.3 10.9 10.4 10.3 10.4 9.9 10.4 10.4
10 8.6 9 9.1 9.2 9.3 9.5 10.3 10.3 10.8 9.7 10.3 10.5
20 8.8 9 9.1 9.2 9.2 9.4 10.2 10.2 10.6 9.6 10.3 10.5
30 8.8 8.9 8.6 9.1 9.2 9.3 10.2 10.2 10.6 9.6 10.2 10.5
40 8.7 8.7 8.7 8.9 8.5 9.1 10.1 10.1 10.5 9.6 10.2 10.4
50 8.7 8.4 8.5 8.6 8.2 9 10 10.1 10.5 9.6 10.1 10.3
60 8.7 8.3 8.4 8.4 8 8.6 9 9.8 10.4 9.6 10.1 10.2
70 8.7 8.3 8.3 8.3 7.9 8.1 8.7 9.7 10.4 9.5 10 10.1
80 8.7 8.2 8.1 8.1 7.8 7.9 8.4 9.5 10.3 9.5 10 10.1
90 8.2 8.1 7.9 7.7 7.7 7.8 8.2 9.1 10.3 9.5 10 10
100 8 7.6 7.5 7.7 7.5 7.7 7.8 8.7 9.8 9.6 9.9 9.9
110 8 6.2 9.2 9.8
Secchi depth
Depth (m) 13.5 12 14.5 19.5 19 13.2 15 16 12.5 10.5 8 11

Lake Taupo Long-Term Monitoring Programme 2007-2008 49
Lake Taupo Temperature, Dissolved Oxygen, and Secchi Depth Database. 2001-2002 Additional site C (Western Bays ) for the period starting 8 January 2002 on
Temperature Date 8/01/2002 22/01/2002 6/03/2002 4/04/2002 22/04/2002 5/05/2002 19/06/2002 1/07/2002 17/07/2002 31/07/2002 29/08/2002 18/09/2002 9/10/2002Depth (m)
0 18.72 18.82 18.68 17.47 16.88 15.6 12.58 12.22 11.52 11.6 11.4 11.24 12.10
10 17.41 18.46 18.47 17.24 11.63 15.64 12.56 12.15 11.5 11.2 10.9 11.23 11.30
20 16.95 18.21 18.32 17.16 16.58 15.64 12.56 12.14 11.49 11.2 10.9 11.16 11.30
30 14 13.77 15.9 17.12 16.5 15.61 12.56 12.14 11.49 11.2 10.8 11.06 11.20
40 13.14 12.01 12.98 13.17 13.02 12.26 12.56 12.13 11.49 11.2 10.8 11.02 11.20
50 11.97 11.5 12.13 12.11 11.87 11.57 12.56 12.13 11.49 11.2 10.8 11.02 11.20
60 11.44 11.26 11.59 11.57 11.47 11.37 11.9 11.92 11.49 11.2 10.8 11 11.10
70 11.26 11.17 11.36 11.38 11.32 11.29 11.36 11.55 11.49 11.2 10.8 10.99 11.10
80 11.18 11.16 11.25 11.32 11.26 11.24 11.28 11.5 11.49 11.2 10.8 10.95 11.10
90 11.15 11.14 11.18 11.21 11.23 11.21 11.23 11.47 11.49 11.2 10.8 10.94 11.00
100 11.12 11.11 11.18 11.19 11.19 11.19 11.22 11.45 11.49 11.2 10.8 10.92 11.00
110 11.11 11.1 11.16 11.15 11.2 10.8 10.90
120 11.2 10.8 10.90
Dissolved Oxygen (g m-3) Depth (m)
0 8.6 8.9 9.3 9.4 9.3 10.6 10.3 10.4 10.5 9.7 10.3 10.5 10.4
10 8.4 8.9 9 9.1 9.2 9.5 10.2 10.4 10.8 9.5 10.2 10.7 10.4
20 8.9 8.9 9 9.1 9.2 9.5 10.2 10.4 10.8 9.5 10.2 10.7 10.4
30 8.6 8.9 8.8 9.1 9.1 9.4 10.1 10.3 10.7 9.4 10.1 10.6 10.4
40 8.6 8.5 8.6 8.6 8.5 8.9 10.1 10.3 10.5 9.4 10 10.5 10.3
50 8.5 8.2 8.5 8.5 8.1 8.6 10 10.2 10.5 9.4 10 10.4 10
60 8.6 8.1 8.5 8.2 7.9 8.3 9.7 10 10.5 9.4 10 10.4 10
70 8.6 8.1 8.2 8.2 7.8 8.2 9.1 9.6 10.5 9.4 9.9 10.3 9.9
80 8.7 8.1 8.1 8 7.7 8 8.4 8.8 10.5 9.3 9.9 10.2 9.9
90 8.6 8.1 8.1 7.9 7.7 7.9 8 8.7 10.4 9.3 9.9 10.1 9.8
100 8.7 8.1 8.1 7.9 7.6 7.8 7.7 8.6 10.2 9.3 10 10 9.6
110 8.5 7.9 7.6 7.7 9.3 10 9.7
120 8.5 7.7 9.1 9.9 9.6
Secchi depth
Depth (m) 14.5 15.5 16 19 18.5 15.6 16 14 12.5 12 8 12 19

Lake Taupo Long-Term Monitoring Programme 2007-2008 50
Lake Taupo Temperature, Dissolved Oxygen, and Secchi Depth Database. 2000-2001
For the period starting 11 July 2000 Temperature Date 11-7-00 04-8-00 21-8-00 11-9-00 28-9-00 25-10-00 13-11-00 06-12-00 03-1-01 15-1-01 20-2-01 01-3-01 19-3-01 09-4-01 11-4-01 10-5-01 29-5-01 02-7-01 25-7-01 13-8-01 Depth (m)
0 11.87 11.32 11.19 11.80 12.47 14.04 13.27 15.73 18.16 18.98 20.47 20.87 19.01 16.99 16.99 15.78 13.62 12.11 11.26 11.15 10 11.87 11.32 11.15 11.46 11.52 13.03 13.09 15.06 17.37 18.51 19.37 20.71 19.05 16.87 16.99 15.78 13.74 12.04 11.26 11.12 20 11.86 11.32 11.14 11.33 11.36 11.99 12.98 14.15 15.46 14.79 18.08 18.98 19.06 16.78 16.97 15.78 13.78 12.00 11.26 11.12 30 11.86 11.33 11.14 11.30 11.33 11.83 12.80 13.31 13.61 13.63 16.06 15.95 16.46 15.82 16.84 15.73 13.79 11.99 11.26 11.11 40 11.86 11.33 11.14 11.27 11.31 11.60 12.36 12.49 12.73 12.81 13.39 13.36 13.05 13.13 13.87 13.19 13.80 11.98 11.26 11.11 50 11.86 11.33 11.14 11.22 11.30 11.49 12.10 12.16 12.21 12.27 12.67 12.58 12.42 12.35 12.68 12.42 13.80 11.98 11.26 11.11 60 11.64 11.33 11.15 11.18 11.27 11.42 11.69 11.78 11.76 11.87 12.01 12.01 11.84 11.81 11.89 11.90 11.92 11.95 11.26 11.10 70 11.42 11.33 11.15 11.15 11.24 11.39 11.41 11.53 11.64 11.67 11.77 11.79 11.67 11.67 11.69 11.69 11.61 11.76 11.26 11.09 80 11.31 11.33 11.15 11.14 11.20 11.38 11.29 11.40 11.47 11.55 11.56 11.63 11.55 11.54 11.54 11.52 11.54 11.51 11.26 11.08 90 11.22 11.33 11.15 11.13 11.17 11.33 11.26 11.36 11.43 11.46 11.50 11.55 11.49 11.46 11.48 11.47 11.46 11.45 11.26 11.08
100 11.21 11.32 11.15 11.13 11.14 11.33 11.21 11.32 11.38 11.39 11.43 11.50 11.43 11.41 11.43 11.42 11.42 11.41 11.26 11.08 110 11.19 11.32 11.15 11.13 11.06 11.29 11.19 11.28 11.36 11.36 11.40 11.46 11.41 11.37 11.39 11.40 11.38 11.39 11.26 11.08 120 11.19 11.31 11.15 11.13 11.04 11.27 11.19 11.27 11.33 11.34 11.39 11.44 11.39 11.33 11.35 11.38 11.35 11.36 11.26 11.08 130 11.18 11.26 11.15 11.12 11.02 11.23 11.17 11.26 11.30 11.32 11.37 11.43 11.37 11.32 11.34 11.36 11.33 11.35 11.26 11.07 140 11.16 11.18 11.14 11.12 11.01 11.18 11.15 11.25 11.30 11.31 11.35 11.40 11.35 11.31 11.32 11.34 11.31 11.34 11.26 11.07 150 11.15 11.18 11.14 11.12 11.01 11.15 11.15 11.25 11.32 11.31 11.33 11.41 11.34 11.31 11.32 11.34 11.31 11.33 11.26 11.07
Dissolved Oxygen (g m-3) Depth (m)
0 9.0 9.0 9.2 9.3 9.1 8.9 8.2 8.7 8.2 8.0 8.0 8.2 8.4 8.3 8.4 8.2 8.7 9.2 10.2 9.6 10 9.0 9.0 9.4 9.5 8.7 8.8 8.4 8.3 8.3 8.6 8.0 8.5 8.3 8.3 8.2 8.0 8.5 9.1 10.5 9.6 20 9.0 9.1 9.4 9.5 8.7 9.1 8.4 8.5 8.4 8.1 8.2 8.6 8.6 8.4 7.9 7.9 8.4 9.4 9.4 9.6 30 9.0 9.1 9.6 9.5 8.7 8.9 8.4 8.5 8.5 8.2 8.0 8.3 8.0 8.0 8.0 7.8 8.4 9.8 9.2 9.6 40 9.0 9.1 9.6 9.5 9.1 8.7 8.2 8.2 8.4 7.9 8.1 8.1 7.6 7.8 7.6 7.7 8.3 9.8 9.1 9.6 50 9.0 9.1 9.6 9.5 9.1 8.5 8.2 8.2 8.2 8.1 7.9 7.8 7.6 7.5 7.4 7.5 8.3 9.6 8.9 9.6 60 9.0 9.1 9.7 9.5 8.7 8.4 8.0 7.9 8.0 7.5 7.7 7.4 6.8 7.2 7.2 7.5 7.2 9.4 8.9 9.5 70 8.9 9.1 9.7 9.5 8.7 8.3 7.9 7.8 7.9 7.4 7.6 7.2 6.8 7.1 7.4 7.3 7.0 9.5 9.0 9.4 80 7.8 9.0 9.7 9.5 8.7 8.2 7.6 7.6 7.8 7.5 7.4 7.0 6.5 6.9 7.3 7.3 7.0 7.7 8.9 9.4 90 7.4 8.9 9.7 9.5 8.7 8.2 7.6 7.6 7.7 7.5 7.4 6.9 6.5 6.9 7.1 7.1 7.0 7.8 8.9 9.4
100 7.2 8.7 9.7 9.5 8.7 8.0 7.5 7.6 7.6 7.3 7.2 6.8 6.6 6.8 7.0 7.0 6.9 7.5 8.6 9.3 110 7.1 8.3 9.7 9.5 8.7 8.0 7.5 7.5 7.6 7.2 7.1 6.7 6.5 6.8 7.0 7.0 6.7 7.4 8.7 9.3 120 6.9 7.9 9.7 9.5 8.2 8.1 7.4 7.4 7.5 7.1 7.0 6.5 6.5 6.7 6.8 6.9 6.6 6.9 8.5 9.3 130 6.9 7.3 9.7 9.5 8.5 8.1 7.4 7.3 7.4 7.0 7.0 6.5 6.5 6.6 6.7 6.6 6.5 6.9 8.5 9.3 140 6.9 7.1 9.7 9.5 8.6 8.0 7.3 7.2 7.2 6.9 6.8 6.4 6.5 6.4 6.4 6.7 6.3 6.8 8.3 9.2 150 6.8 7.4 9.7 9.3 8.5 7.9 7.3 7.1 7.1 6.6 6.5 6.3 6.4 6.3 6.3 6.6 6.1 6.4 8.2 9.2
Secchi depth Depth (m)
11 12 15 12 13 11 12 17 17 18 17 14.5 17 13.5 13.5 17 14.5 12 14.5 13.5

Lake Taupo Long-Term Monitoring Programme 2007-2008 51
Lake Taupo Temperature, Dissolved Oxygen, and Secchi Depth Database. 1999-2000 For the period starting 13 July 1999
Temperature Date 13-7-99 6-8-99 3-9-99 29-9-99 18-10-99 19-12-99 18-1-00 12-4-00 4-5-00 25-5-00 20-6-00 11-7-00 4-8-00 21-8-00 11-9-00 28-9-00 25-10-00 13-11-00 6-12-00 Depth (m)
0 12.0 11.8 11.8 11.5 12.8 16.56 18.63 17.41 15.82 14.22 12.28 11.87 11.32 11.19 11.80 12.47 14.04 13.27 15.73 10 12.0 11.4 11.3 11.5 12.7 16.40 18.35 17.25 15.77 14.28 12.28 11.87 11.32 11.15 11.46 11.52 13.03 13.09 15.06 20 12.0 11.4 11.2 11.5 12.4 15.96 17.22 17.21 15.76 14.31 12.28 11.86 11.32 11.14 11.33 11.36 11.99 12.98 14.15 30 12.0 11.4 11.1 11.4 11.6 15.23 14.94 16.65 15.75 14.28 12.27 11.86 11.33 11.14 11.30 11.33 11.83 12.86 13.31 40 12.0 11.3 11.1 11.2 11.4 12.16 13.29 12.55 13.64 14.22 12.26 11.86 11.33 11.14 11.27 11.31 11.60 12.36 12.49 50 12.0 11.3 11.1 11.1 11.3 11.64 11.91 11.67 12.14 12.53 12.26 11.86 11.33 11.14 11.22 11.30 11.49 12.10 12.16 60 12.0 11.3 11.0 11.1 11.1 11.35 11.45 11.39 11.56 11.56 12.21 11.85 11.33 11.15 11.18 11.27 11.42 11.69 11.78 70 12.0 11.3 11.0 11.0 11.1 11.25 11.31 11.29 11.36 11.34 11.58 11.64 11.33 11.15 11.15 11.24 11.39 11.41 11.53 80 11.4 11.3 11.0 11.0 11.0 11.18 11.21 11.23 11.24 11.23 11.32 11.42 11.33 11.15 11.14 11.20 11.38 11.29 11.40 90 11.3 11.3 11.0 11.0 11.0 11.16 11.17 11.20 11.21 11.20 11.24 11.31 11.33 11.15 11.13 11.17 11.33 11.26 11.36
100 11.2 11.2 11.0 11.0 11.0 11.14 11.14 11.17 11.17 11.15 11.17 11.22 11.32 11.15 11.13 11.14 11.33 11.21 11.32 110 11.2 11.2 11.0 11.0 11.0 11.12 11.12 11.15 11.14 11.12 11.16 11.21 11.32 11.15 11.13 11.06 11.29 11.19 11.28 120 11.2 11.1 11.0 11.0 11.0 11.10 11.09 11.13 11.12 11.10 11.14 11.19 11.31 11.15 11.13 11.04 11.27 11.19 11.27 130 11.1 11.1 11.0 11.0 11.0 11.08 11.08 11.11 11.10 11.09 11.12 11.18 11.26 11.15 11.12 11.02 11.23 11.17 11.26 140 11.1 11.1 11.0 11.0 11.0 11.07 11.07 11.09 11.09 11.09 11.10 11.16 11.18 11.14 11.12 11.01 11.18 11.15 11.25 150 11.1 11.0 11.0 10.9 11.0 11.10 11.06 11.09 11.09 11.07 11.10 11.15 11.18 11.14 11.12 11.01 11.15 11.15 11.25
Dissolved Oxygen (g m-3) Depth (m)
0 10.5 10.1 9.2 9.5 8.9 8.3 7.9 9.2 8.7 8.5 8.1 9.0 9.0 9.2 9.3 9.1 8.9 8.2 8.7 10 10.7 10.2 9.8 9.8 8.9 8.6 7.9 9.2 8.6 8.3 8.3 9.0 9.0 9.4 9.5 8.7 8.8 8.4 8.3 20 10.7 9.9 9.8 9.9 8.9 8.7 8.1 9.2 8.8 8.5 8.7 9.0 9.1 9.4 9.5 8.7 9.1 8.4 8.5 30 10.6 10.0 9.8 9.7 8.9 8.7 8.3 9.0 8.8 8.5 8.6 9.0 9.1 9.6 9.5 8.7 8.9 8.4 8.5 40 10.6 9.7 9.5 9.6 8.8 8.7 8.1 8.3 8.2 8.6 8.6 9.0 9.1 9.6 9.5 9.1 8.7 8.2 8.2 50 10.4 9.9 9.5 9.3 8.6 8.7 8.0 8.0 7.9 8.2 8.6 9.0 9.1 9.6 9.5 9.1 8.5 8.2 8.2 60 10.4 9.8 9.4 9.2 8.6 8.6 8.0 8.0 7.9 7.7 8.7 9.0 9.1 9.7 9.5 8.7 8.4 8.0 7.9 70 10.3 9.7 9.3 9.0 8.6 8.7 8.0 8.0 7.8 7.7 8.4 8.9 9.1 9.7 9.5 8.7 8.3 7.9 7.8 80 10.3 9.0 9.2 9.0 8.5 8.5 7.9 7.9 7.7 7.6 7.6 7.8 9.0 9.7 9.5 8.7 8.2 7.6 7.6 90 8.1 8.6 9.2 9.0 8.6 8.5 7.7 7.9 7.8 7.4 7.4 7.4 8.9 9.7 9.5 8.7 8.2 7.6 7.6
100 7.9 7.3 9.2 8.9 8.6 8.5 8.3 7.7 7.6 7.4 7.3 7.2 8.7 9.7 9.5 8.7 8.0 7.5 7.6 110 7.5 7.1 9.1 8.9 8.6 8.3 8.1 7.7 7.6 7.6 7.4 7.1 8.3 9.7 9.5 8.7 8.0 7.5 7.5 120 7.4 6.8 9.1 8.9 8.3 8.4 8.1 7.7 7.4 7.5 7.3 6.9 7.9 9.7 9.5 8.2 8.1 7.4 7.4 130 7.3 6.7 9.0 8.8 7.9 8.2 8.0 7.5 7.4 7.5 7.3 6.9 7.3 9.7 9.5 8.5 8.1 7.4 7.3 140 7.1 6.7 8.9 8.7 7.5 8.1 8.0 7.5 7.2 7.4 7.2 6.9 7.1 9.7 9.5 8.6 8.0 7.3 7.2 150 6.9 6.4 8.9 8.6 7.5 8.0 7.5 7.2 6.8 7.0 6.9 6.8 7.4 9.7 9.3 8.5 7.9 7.3 7.1
Secchi depth Depth (m) 16 14.5 10 10 14.9 18 19.1 15 14 14 14 11 12 15 12 13 11 12 17
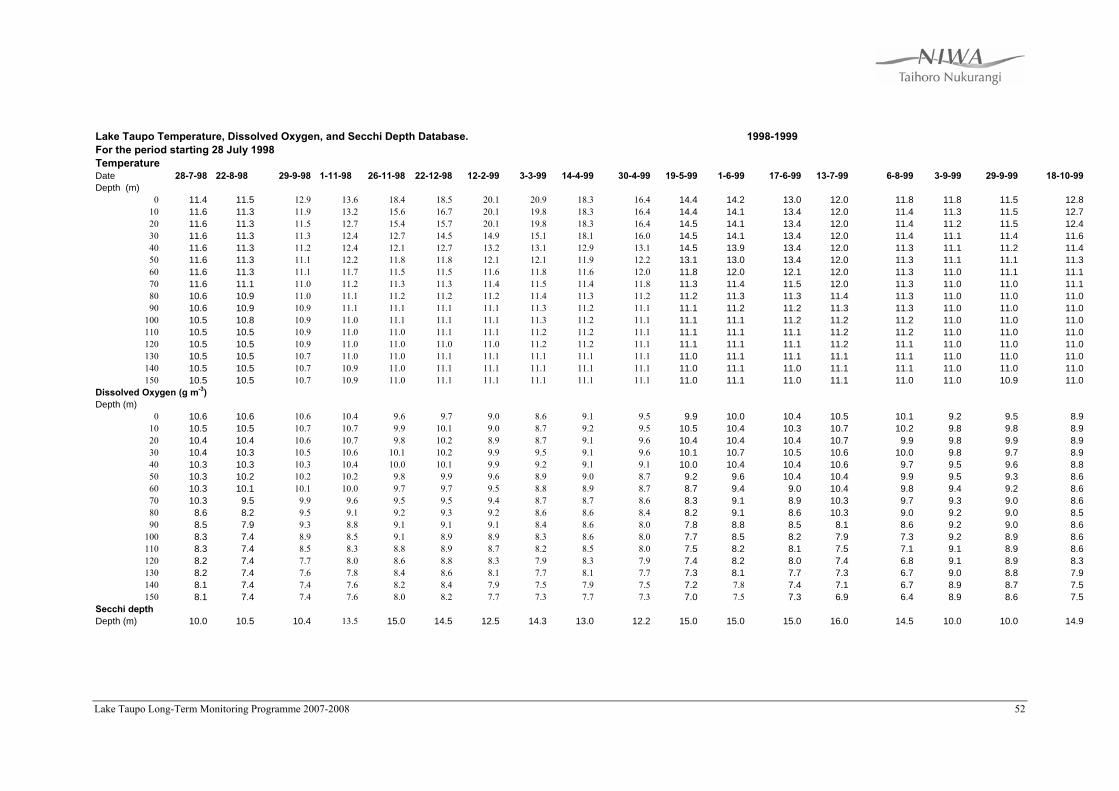
Lake Taupo Long-Term Monitoring Programme 2007-2008 52
Lake Taupo Temperature, Dissolved Oxygen, and Secchi Depth Database. 1998-1999 For the period starting 28 July 1998 Temperature Date 28-7-98 22-8-98 29-9-98 1-11-98 26-11-98 22-12-98 12-2-99 3-3-99 14-4-99 30-4-99 19-5-99 1-6-99 17-6-99 13-7-99 6-8-99 3-9-99 29-9-99 18-10-99 Depth (m)
0 11.4 11.5 12.9 13.6 18.4 18.5 20.1 20.9 18.3 16.4 14.4 14.2 13.0 12.0 11.8 11.8 11.5 12.8 10 11.6 11.3 11.9 13.2 15.6 16.7 20.1 19.8 18.3 16.4 14.4 14.1 13.4 12.0 11.4 11.3 11.5 12.7 20 11.6 11.3 11.5 12.7 15.4 15.7 20.1 19.8 18.3 16.4 14.5 14.1 13.4 12.0 11.4 11.2 11.5 12.4 30 11.6 11.3 11.3 12.4 12.7 14.5 14.9 15.1 18.1 16.0 14.5 14.1 13.4 12.0 11.4 11.1 11.4 11.6 40 11.6 11.3 11.2 12.4 12.1 12.7 13.2 13.1 12.9 13.1 14.5 13.9 13.4 12.0 11.3 11.1 11.2 11.4 50 11.6 11.3 11.1 12.2 11.8 11.8 12.1 12.1 11.9 12.2 13.1 13.0 13.4 12.0 11.3 11.1 11.1 11.3 60 11.6 11.3 11.1 11.7 11.5 11.5 11.6 11.8 11.6 12.0 11.8 12.0 12.1 12.0 11.3 11.0 11.1 11.1 70 11.6 11.1 11.0 11.2 11.3 11.3 11.4 11.5 11.4 11.8 11.3 11.4 11.5 12.0 11.3 11.0 11.0 11.1 80 10.6 10.9 11.0 11.1 11.2 11.2 11.2 11.4 11.3 11.2 11.2 11.3 11.3 11.4 11.3 11.0 11.0 11.0 90 10.6 10.9 10.9 11.1 11.1 11.1 11.1 11.3 11.2 11.1 11.1 11.2 11.2 11.3 11.3 11.0 11.0 11.0
100 10.5 10.8 10.9 11.0 11.1 11.1 11.1 11.3 11.2 11.1 11.1 11.1 11.2 11.2 11.2 11.0 11.0 11.0 110 10.5 10.5 10.9 11.0 11.0 11.1 11.1 11.2 11.2 11.1 11.1 11.1 11.1 11.2 11.2 11.0 11.0 11.0 120 10.5 10.5 10.9 11.0 11.0 11.0 11.0 11.2 11.2 11.1 11.1 11.1 11.1 11.2 11.1 11.0 11.0 11.0 130 10.5 10.5 10.7 11.0 11.0 11.1 11.1 11.1 11.1 11.1 11.0 11.1 11.1 11.1 11.1 11.0 11.0 11.0 140 10.5 10.5 10.7 10.9 11.0 11.1 11.1 11.1 11.1 11.1 11.0 11.1 11.0 11.1 11.1 11.0 11.0 11.0 150 10.5 10.5 10.7 10.9 11.0 11.1 11.1 11.1 11.1 11.1 11.0 11.1 11.0 11.1 11.0 11.0 10.9 11.0
Dissolved Oxygen (g m-3) Depth (m)
0 10.6 10.6 10.6 10.4 9.6 9.7 9.0 8.6 9.1 9.5 9.9 10.0 10.4 10.5 10.1 9.2 9.5 8.9 10 10.5 10.5 10.7 10.7 9.9 10.1 9.0 8.7 9.2 9.5 10.5 10.4 10.3 10.7 10.2 9.8 9.8 8.9 20 10.4 10.4 10.6 10.7 9.8 10.2 8.9 8.7 9.1 9.6 10.4 10.4 10.4 10.7 9.9 9.8 9.9 8.9 30 10.4 10.3 10.5 10.6 10.1 10.2 9.9 9.5 9.1 9.6 10.1 10.7 10.5 10.6 10.0 9.8 9.7 8.9 40 10.3 10.3 10.3 10.4 10.0 10.1 9.9 9.2 9.1 9.1 10.0 10.4 10.4 10.6 9.7 9.5 9.6 8.8 50 10.3 10.2 10.2 10.2 9.8 9.9 9.6 8.9 9.0 8.7 9.2 9.6 10.4 10.4 9.9 9.5 9.3 8.6 60 10.3 10.1 10.1 10.0 9.7 9.7 9.5 8.8 8.9 8.7 8.7 9.4 9.0 10.4 9.8 9.4 9.2 8.6 70 10.3 9.5 9.9 9.6 9.5 9.5 9.4 8.7 8.7 8.6 8.3 9.1 8.9 10.3 9.7 9.3 9.0 8.6 80 8.6 8.2 9.5 9.1 9.2 9.3 9.2 8.6 8.6 8.4 8.2 9.1 8.6 10.3 9.0 9.2 9.0 8.5 90 8.5 7.9 9.3 8.8 9.1 9.1 9.1 8.4 8.6 8.0 7.8 8.8 8.5 8.1 8.6 9.2 9.0 8.6
100 8.3 7.4 8.9 8.5 9.1 8.9 8.9 8.3 8.6 8.0 7.7 8.5 8.2 7.9 7.3 9.2 8.9 8.6 110 8.3 7.4 8.5 8.3 8.8 8.9 8.7 8.2 8.5 8.0 7.5 8.2 8.1 7.5 7.1 9.1 8.9 8.6 120 8.2 7.4 7.7 8.0 8.6 8.8 8.3 7.9 8.3 7.9 7.4 8.2 8.0 7.4 6.8 9.1 8.9 8.3 130 8.2 7.4 7.6 7.8 8.4 8.6 8.1 7.7 8.1 7.7 7.3 8.1 7.7 7.3 6.7 9.0 8.8 7.9 140 8.1 7.4 7.4 7.6 8.2 8.4 7.9 7.5 7.9 7.5 7.2 7.8 7.4 7.1 6.7 8.9 8.7 7.5 150 8.1 7.4 7.4 7.6 8.0 8.2 7.7 7.3 7.7 7.3 7.0 7.5 7.3 6.9 6.4 8.9 8.6 7.5
Secchi depth Depth (m) 10.0 10.5 10.4 13.5 15.0 14.5 12.5 14.3 13.0 12.2 15.0 15.0 15.0 16.0 14.5 10.0 10.0 14.9
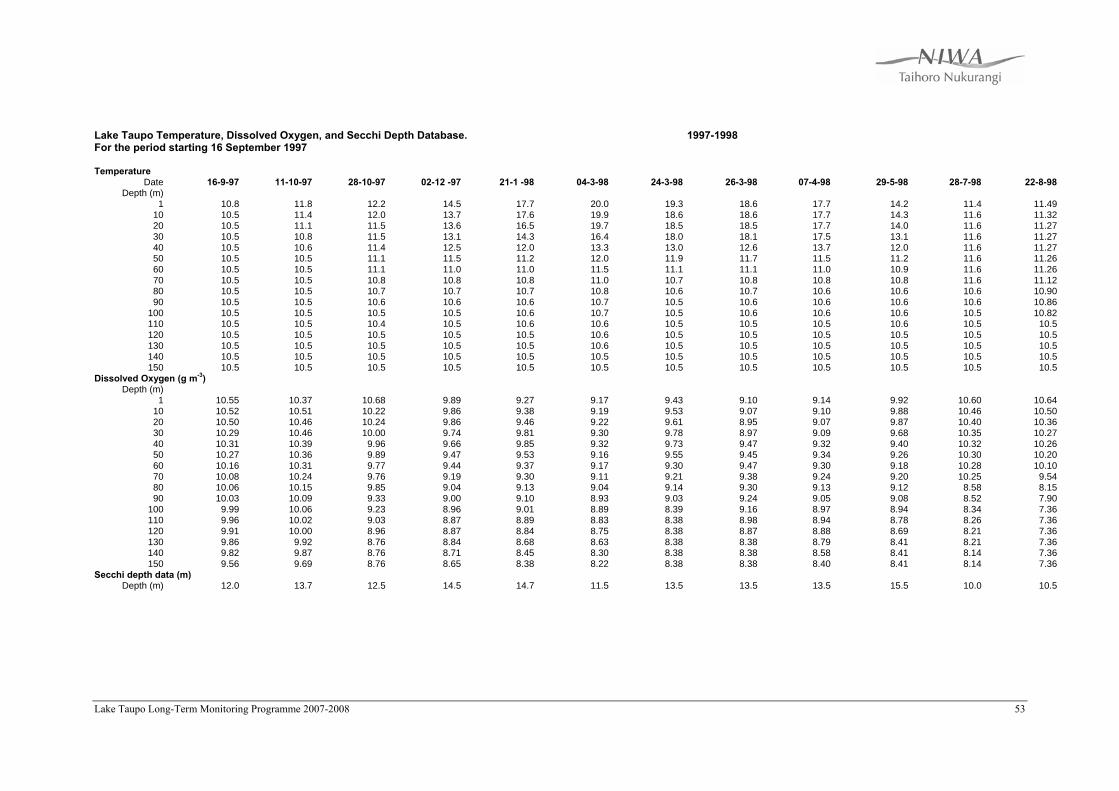
Lake Taupo Long-Term Monitoring Programme 2007-2008 53
Lake Taupo Temperature, Dissolved Oxygen, and Secchi Depth Database. 1997-1998 For the period starting 16 September 1997
Temperature
Date 16-9-97 11-10-97 28-10-97 02-12 -97 21-1 -98 04-3-98 24-3-98 26-3-98 07-4-98 29-5-98 28-7-98 22-8-98 Depth (m)
1 10.8 11.8 12.2 14.5 17.7 20.0 19.3 18.6 17.7 14.2 11.4 11.49 10 10.5 11.4 12.0 13.7 17.6 19.9 18.6 18.6 17.7 14.3 11.6 11.32 20 10.5 11.1 11.5 13.6 16.5 19.7 18.5 18.5 17.7 14.0 11.6 11.27 30 10.5 10.8 11.5 13.1 14.3 16.4 18.0 18.1 17.5 13.1 11.6 11.27 40 10.5 10.6 11.4 12.5 12.0 13.3 13.0 12.6 13.7 12.0 11.6 11.27 50 10.5 10.5 11.1 11.5 11.2 12.0 11.9 11.7 11.5 11.2 11.6 11.26 60 10.5 10.5 11.1 11.0 11.0 11.5 11.1 11.1 11.0 10.9 11.6 11.26 70 10.5 10.5 10.8 10.8 10.8 11.0 10.7 10.8 10.8 10.8 11.6 11.12 80 10.5 10.5 10.7 10.7 10.7 10.8 10.6 10.7 10.6 10.6 10.6 10.90 90 10.5 10.5 10.6 10.6 10.6 10.7 10.5 10.6 10.6 10.6 10.6 10.86
100 10.5 10.5 10.5 10.5 10.6 10.7 10.5 10.6 10.6 10.6 10.5 10.82 110 10.5 10.5 10.4 10.5 10.6 10.6 10.5 10.5 10.5 10.6 10.5 10.5 120 10.5 10.5 10.5 10.5 10.5 10.6 10.5 10.5 10.5 10.5 10.5 10.5 130 10.5 10.5 10.5 10.5 10.5 10.6 10.5 10.5 10.5 10.5 10.5 10.5 140 10.5 10.5 10.5 10.5 10.5 10.5 10.5 10.5 10.5 10.5 10.5 10.5 150 10.5 10.5 10.5 10.5 10.5 10.5 10.5 10.5 10.5 10.5 10.5 10.5
Dissolved Oxygen (g m-3) Depth (m)
1 10.55 10.37 10.68 9.89 9.27 9.17 9.43 9.10 9.14 9.92 10.60 10.64 10 10.52 10.51 10.22 9.86 9.38 9.19 9.53 9.07 9.10 9.88 10.46 10.50 20 10.50 10.46 10.24 9.86 9.46 9.22 9.61 8.95 9.07 9.87 10.40 10.36 30 10.29 10.46 10.00 9.74 9.81 9.30 9.78 8.97 9.09 9.68 10.35 10.27 40 10.31 10.39 9.96 9.66 9.85 9.32 9.73 9.47 9.32 9.40 10.32 10.26 50 10.27 10.36 9.89 9.47 9.53 9.16 9.55 9.45 9.34 9.26 10.30 10.20 60 10.16 10.31 9.77 9.44 9.37 9.17 9.30 9.47 9.30 9.18 10.28 10.10 70 10.08 10.24 9.76 9.19 9.30 9.11 9.21 9.38 9.24 9.20 10.25 9.54 80 10.06 10.15 9.85 9.04 9.13 9.04 9.14 9.30 9.13 9.12 8.58 8.15 90 10.03 10.09 9.33 9.00 9.10 8.93 9.03 9.24 9.05 9.08 8.52 7.90
100 9.99 10.06 9.23 8.96 9.01 8.89 8.39 9.16 8.97 8.94 8.34 7.36 110 9.96 10.02 9.03 8.87 8.89 8.83 8.38 8.98 8.94 8.78 8.26 7.36 120 9.91 10.00 8.96 8.87 8.84 8.75 8.38 8.87 8.88 8.69 8.21 7.36 130 9.86 9.92 8.76 8.84 8.68 8.63 8.38 8.38 8.79 8.41 8.21 7.36 140 9.82 9.87 8.76 8.71 8.45 8.30 8.38 8.38 8.58 8.41 8.14 7.36 150 9.56 9.69 8.76 8.65 8.38 8.22 8.38 8.38 8.40 8.41 8.14 7.36
Secchi depth data (m) Depth (m) 12.0 13.7 12.5 14.5 14.7 11.5 13.5 13.5 13.5 15.5 10.0 10.5

Lake Taupo Long-Term Monitoring Programme 2007-2008 54
Lake Taupo Temperature, Dissolved Oxygen, and Secchi Depth Database. 1996-1997 For the period starting 3 September 1996 Temperature
Date 3-9-96 17-9-96 27-9-96 17-10-96 24-10-96 6-11-96 28-11-96 11-12-96 23-12-96 8-1-97 29-1-97 26-3-97 2-4-97 15-4-97 20-5-97 29-5-97 7-7-97 29-7-97 Depth (m)
1 10.5 10.7 12.5 13.3 12.6 13.5 13.6 14.8 16.3 17.9 17.8 17.7 17.3 16.7 14.1 14.2 11.7 10.9 10 10.4 10.6 11.6 12.0 12.3 13.6 13.6 14.8 15.3 16.8 17.6 17.6 17.3 16.7 14.0 14.1 11.7 11.0 20 10.3 10.4 11.1 11.9 12.3 13.4 13.3 14.4 15.1 16.5 17.4 17.2 17.2 16.7 14.0 14.1 11.7 11.0 30 10.3 10.3 11.0 11.8 12.3 13.3 13.3 14.2 15.0 15.6 14.8 16.6 17.2 16.7 12.6 14.1 11.7 11.0 40 10.3 10.3 10.5 11.7 11.9 11.7 11.6 12.7 13.5 13.0 13.4 13.8 14.5 14.0 11.5 14.0 11.7 11.0 50 10.4 10.3 10.4 11.5 11.6 10.8 10.9 12.5 12.4 11.9 11.8 12.4 11.5 11.9 11.0 12.1 11.7 11.0 60 10.3 10.3 10.4 10.9 11.1 10.6 10.9 11.7 11.3 11.2 10.9 11.2 10.9 11.1 10.5 11.8 11.7 11.0 70 10.3 10.3 10.3 10.6 10.6 10.5 10.5 11.7 10.7 10.8 10.7 10.7 10.6 10.9 10.5 11.1 11.7 11.0 80 10.3 10.3 10.3 10.5 10.5 10.4 10.4 11.1 10.6 10.6 10.6 10.5 10.5 10.7 10.5 10.8 10.9 11.0 90 10.3 10.3 10.3 10.4 10.4 10.4 10.4 10.4 10.5 10.5 10.4 10.5 10.5 10.6 10.5 10.6 10.8 10.9
100 10.3 10.3 10.3 10.3 10.4 10.4 10.4 10.4 10.4 10.4 10.4 10.4 10.5 10.5 10.5 10.5 10.6 10.7 110 10.3 10.3 10.3 10.3 10.3 10.3 10.3 10.4 10.4 10.4 10.4 10.4 10.4 10.5 10.5 10.5 10.5 10.6 120 10.3 10.3 10.3 10.3 10.3 10.3 10.3 10.4 10.4 10.4 10.4 10.4 10.4 10.5 10.5 10.5 10.5 10.5 130 10.3 10.3 10.3 10.3 10.3 10.3 10.3 10.4 10.4 10.4 10.4 10.4 10.4 10.5 10.5 10.5 10.5 10.5 140 10.3 10.3 10.3 10.3 10.3 10.3 10.3 10.4 10.3 10.3 10.3 10.4 10.4 10.5 10.5 10.5 10.5 10.5 150 10.3 10.3 10.3 10.3 10.3 10.3 10.3 10.3 10.3 10.3 10.3 10.4 10.4 10.5 10.4 10.4 10.5 10.5
Dissolved Oxygen (g m-3) Depth (m)
1 8.81 9.08 10.03 9.78 10.32 9.96 9.99 10.03 9.10 8.71 8.80 9.70 9.40 9.06 9.09 9.3 9.9 10.53 10 9.17 9.17 10.43 9.85 10.27 9.84 9.87 9.97 9.30 8.70 8.80 9.30 9.25 8.95 9.10 9.2 9.8 10.42 20 9.14 8.98 10.32 9.84 10.15 9.80 9.80 9.90 9.30 8.70 8.70 8.93 8.94 8.91 9.06 9.2 9.8 10.45
30 8.98 8.95 10.16 9.84 9.89 9.79 9.81 9.76 9.30 8.80 9.10 8.80 8.82 8.87 9.01 9.2 9.8 10.43 40 8.90 8.93 9.98 9.80 9.89 9.73 9.77 9.70 9.30 9.00 8.90 8.78 8.79 8.82 8.94 9.1 9.8 10.46 50 8.78 8.87 9.69 9.76 9.80 9.29 9.35 9.10 9.30 8.80 8.90 8.51 8.58 8.65 8.86 9.1 9.7 10.40 60 8.73 8.80 9.54 9.67 9.67 9.19 9.14 9.04 9.15 8.60 8.70 8.49 8.56 8.71 8.70 9.0 9.7 10.36 70 8.74 8.80 9.45 9.56 9.44 9.14 9.09 9.03 9.07 8.60 8.60 8.47 8.52 8.71 8.64 8.9 9.7 10.34 80 8.70 8.77 9.37 9.42 9.33 9.03 9.01 9.01 9.00 8.60 8.50 8.36 8.46 8.69 8.48 8.5 8.6 10.34 90 8.63 8.70 9.24 9.29 9.30 8.99 8.96 8.92 8.98 8.60 8.50 8.30 8.45 8.63 8.32 8.3 8.2 10.24
100 8.59 8.61 9.11 9.22 9.21 8.94 8.93 8.88 8.95 8.60 8.40 8.27 8.40 8.54 8.29 8.2 8.1 8.70 110 8.48 8.49 9.13 9.15 9.20 8.90 8.87 8.80 8.89 8.50 8.30 8.18 8.29 8.48 8.27 8.1 8.0 8.02 120 8.44 8.33 9.07 8.91 8.98 8.77 8.74 8.73 8.85 8.40 8.20 8.08 8.20 8.41 8.22 8.1 8.0 8.05 130 8.19 8.27 9.07 8.83 8.98 8.71 8.69 8.69 8.66 8.30 8.30 7.96 8.02 8.20 8.19 8.1 7.9 8.09 140 8.39 8.35 9.05 8.89 8.89 8.62 8.65 8.60 8.33 8.20 8.20 7.40 7.60 7.87 7.97 7.8 7.4 7.79 150 8.81 8.84 8.98 8.49 8.94 8.48 8.43 8.47 8.25 8.10 8.10 7.40 7.50 7.71 7.88 7.7 7.2 7.13
Secchi depth data (m) Secchi d 13.1 14..2 11.2 12.6 13.4 14.9 14.1 14.7 17.7 15.1 15.2 15.3 16.0 17.7 14.6 14.5 12.5 13.5

Lake Taupo Long-Term Monitoring Programme 2007-2008 55
Lake Taupo Temperature, Dissolved Oxygen, and Secchi Depth Database. 1995-1996 For the period starting 12 September 1995 Temperature
Date 12-9-95 25-9-95 30-10-95 24-11-95 06-12-95 12-1-96 31-1-96 13-2-96 29-2-96 20-3-96 28-3-96 18-4-96 19-5-96 14-6-96 9-7-96 Depth (m)
1 10.7 13.7 17.7 21.1 21.7 22.7 20.5 18.2 16.8 17.7 14.8 12.2 11.2 10 10.7 11.9 16.2 20.7 20.7 21.0 20.1 18.2 16.7 17.4 14.8 12.2 11.2 20 10.7 11.4 15.3 18.1 18.5 20.6 20.0 18.2 16.6 17.3 14.8 12.1 11.2 30 10.7 11.2 12.4 14.8 13.5 15.1 15.5 18.1 13.7 17.0 14.8 12.1 11.2 40 10.7 10.9 11.4 12.4 12.3 12.2 11.9 12.3 12.4 12.6 14.7 12.0 11.2 50 10.7 10.8 11.0 11.5 11.6 11.6 11.3 11.4 11.6 11.4 11.6 11.2 11.2 60 10.7 10.7 10.7 11.0 11.2 11.0 11.0 11.1 11.4 11.1 11.1 10.9 11.2 70 10.7 10.5 10.6 10.9 10.8 10.8 10.8 10.9 11.6 11.1 10.9 10.8 11.2 80 10.5 10.5 10.6 10.9 10.7 10.7 10.7 10.8 11.2 10.9 10.8 10.8 11.2 90 10.4 10.5 10.6 10.7 10.7 10.7 10.7 10.7 11.3 10.8 10.7 10.8 10.8
100 10.4 10.5 10.5 10.6 10.6 10.7 10.7 10.7 10.9 10.8 10.7 10.7 10.8 110 10.4 10.5 10.5 10.5 10.6 10.7 10.7 10.6 10.8 10.8 10.7 10.7 10.8 120 10.4 10.5 10.5 10.5 10.5 10.6 10.6 10.6 10.7 10.7 10.7 10.7 10.8 130 10.4 10.5 10.5 10.5 10.5 10.7 10.6 10.6 10.7 10.7 10.7 10.7 10.8 140 10.4 10.5 10.5 10.5 10.5 10.6 10.6 10.6 10.7 10.7 10.7 10.7 10.8 150 10.4 10.5 10.5 10.5 10.5 10.6 10.6 10.6 10.6 10.7 10.7 10.7 10.8 160 10.4 * 10.5 10.5 10.5 * * * * * * * *
Dissolved oxygen (g m-3) Depth (m)
1 9.6 10.3 9.5 8.5 8.5 8.1 8.2 8.4 8.7 8.6 9.0 9.2 9.3 10 9.6 10.5 9.9 8.7 8.5 8.1 8.2 8.3 8.7 8.6 9.0 9.2 9.1 20 9.6 10.6 10.0 9.1 9.1 8.2 8.1 8.3 8.8 8.6 8.9 9.2 9.1 30 9.6 10.7 10.5 9.7 10.1 9.2 9.0 8.1 9.0 8.4 8.9 9.1 9.0 40 9.7 10.7 10.5 10.1 10.2 9.5 9.1 8.7 8.8 8.7 8.9 9.0 8.9 50 9.6 10.3 10.3 9.9 9.9 9.0 9.0 8.6 8.6 8.4 8.7 8.4 8.8 60 9.5 10.3 10.0 9.6 8.9 8.7 8.8 8.5 8.5 8.4 8.5 8.1 8.7 70 9.4 10.2 10.0 9.6 8.9 8.6 8.6 8.5 8.5 8.4 8.3 7.9 8.7 80 9.4 10.2 9.9 9.6 8.8 8.5 8.5 8.4 8.3 8.4 8.3 7.8 8.6 90 9.0 10.1 9.8 9.5 8.8 8.4 8.4 8.3 8.2 8.3 8.2 7.7 8.1
100 9.0 10.0 9.7 9.4 8.8 8.3 8.3 8.3 8.2 8.3 8.1 7.7 7.5 110 9.0 9.9 9.6 9.4 8.8 8.1 8.3 8.2 8.1 7.9 7.8 7.6 7.3 120 8.8 9.9 9.4 9.3 8.3 8.1 8.3 8.1 8.3 7.9 7.8 7.5 7.1 130 8.8 9.8 9.3 9.2 8.3 7.9 8.2 7.8 8.3 7.8 7.8 7.5 7.1 140 8.7 9.6 9.1 8.9 7.9 7.6 8.2 7.5 8.0 7.6 7.7 7.4 7.0 150 8.7 9.2 8.9 8.7 7.9 7.6 8.0 7.4 7.8 7.4 7.5 7.4 7.0
Secchi depth Depth (m) 11.9 11.9 13.0 13.6 15.1 16.3 15.7 17.8 18.4 14.1 14.6 14.4 14.7 14.4 12.9

Lake Taupo Long-Term Monitoring Programme 2007-2008 56
Lake Taupo Temperature, Dissolved Oxygen, and Secchi Depth Database. 1994-1995 Started 27 October 1994 Temperature
Date 27-10-94 21-11-94 01-12-94 13-12 -94 27-12 -94 13-1 -95 25-1 -95 09-2 -95 26-2 -95 08-3 -95 24-3-95 12-4-95 19-4-95 04-5-95 21-5-95 08-6-95 14-7-95 30-7-95 Depth (m)
1 11.7 12.8 15.7 17.5 17.8 18.6 19.9 20.6 20.9 20.9 18.5 19.4 18.4 17.0 15.0 13.4 11.3 10.8 10 11.5 12.6 14.2 16.4 17.3 18.4 19.9 20.0 19.9 19.8 18.4 18.6 18.2 16.9 15.0 13.5 11.3 10.8 20 11.5 12.6 13.2 15.5 16.9 18.0 17.8 19.6 19.9 19.7 18.4 18.4 18.2 16.8 15.0 13.4 11.3 10.8 30 11.3 12.6 13.0 13.2 13.3 15.9 15.6 15.0 15.0 15.1 18.4 15.7 16.5 14.6 15.0 13.4 11.3 10.8 40 10.9 12.6 12.1 12.5 12.2 13.1 13.3 12.9 13.0 12.8 12.7 13.0 12.5 12.2 12.7 13.3 11.3 10.8 50 10.9 12.4 11.4 11.7 11.6 12.0 11.8 11.9 11.9 11.8 12.0 11.8 11.6 11.3 11.7 12.8 11.2 10.8 60 10.8 11.8 10.7 11.1 * 11.4 11.5 11.4 11.1 11.2 11.3 11.3 11.1 11.2 11.3 11.7 11.2 10.8 70 10.7 10.9 10.6 10.8 * * 11.2 11.0 10.9 10.9 11.0 10.9 10.9 10.9 11.0 11.2 11.2 10.8 80 10.6 10.7 10.5 10.7 * * 11.0 10.8 10.8 10.8 10.8 10.8 10.8 10.8 10.8 11.0 10.9 10.8 90 10.5 10.6 10.5 10.6 * * 10.7 10.7 10.7 10.7 10.7 10.7 10.7 10.7 10.8 10.8 10.8 10.8
100 10.5 10.5 10.5 10.5 * * 10.7 10.6 10.7 10.7 10.7 10.7 10.7 10.7 10.7 10.8 10.7 10.8 110 10.5 10.5 10.4 10.4 * * 10.6 10.6 10.6 10.6 10.7 10.7 10.7 10.7 10.7 10.8 10.7 10.8 120 10.4 10.4 10.4 10.4 * * 10.6 10.5 10.6 10.6 10.6 10.7 10.7 10.7 10.7 10.8 10.7 10.8 130 10.4 10.4 10.4 10.3 * * 10.5 10.5 10.6 10.6 10.6 10.6 10.7 10.7 10.7 10.8 10.7 10.8 140 10.4 10.3 10.4 10.3 * * 10.5 10.5 10.6 10.6 10.6 10.6 10.7 10.6 10.7 10.8 10.7 10.8 150 10.3 10.3 10.3 10.3 * * 10.5 10.5 10.6 10.6 10.6 10.6 10.6 10.6 10.7 10.8 10.7 10.8 160 10.3 10.3 10.3 10.3 * * 10.5 10.5 10.6 10.6 10.6 10.6 10.6 10.7 * 10.7 * *
Dissolved oxygen (g m-3) Depth (m)
1 10.5 9.6 9.8 9.2 9.0 8.0 8.9 8.4 8.5 8.5 8.7 * 9.2 9.3 9.0 9.0 9.6 9.6 10 10.6 9.4 10.3 9.4 10.6 10.4 10.2 8.5 8.4 8.0 * * 9.3 9.1 8.8 9.1 9.6 9.5 20 10.8 9.4 10.3 9.4 11.0 10.5 11.5 8.5 8.4 8.0 * * 9.2 9.0 8.8 9.1 9.4 9.4 30 10.7 9.4 10.2 9.7 12.5 11.2 11.4 9.8 9.6 9.7 * * 9.3 9.2 8.7 9.0 9.4 9.3 40 10.5 9.3 10.1 9.6 12.5 11.9 12.0 9.7 9.4 9.7 * * 9.7 9.3 8.6 9.0 9.3 9.3 50 10.4 9.3 9.9 9.5 12.6 11.9 12.0 9.4 9.4 9.5 * * 9.5 9.2 8.5 8.8 9.2 9.3 60 10.4 9.4 9.9 9.5 * 10.3 11.9 9.4 9.3 9.4 * * 9.5 9.2 8.5 8.3 9.2 9.2 70 10.4 * 9.8 9.5 * * 11.7 9.3 9.3 9.3 * * 9.5 9.2 8.4 8.3 9.2 9.2 80 10.4 * 9.8 9.5 * * 11.6 9.3 8.9 9.1 * * 9.0 9.2 8.3 8.3 8.5 9.1 90 10.4 * 9.7 9.5 * * 11.4 9.2 8.8 9.0 * * 8.7 9.0 8.1 7.9 8.3 9.0
100 10.2 * 9.6 9.4 * * 11.3 9.0 8.6 8.8 * * 8.6 8.6 8.0 7.6 7.8 8.9 110 10.3 * 9.7 9.3 * * 11.1 9.0 8.3 8.7 * * 8.3 8.2 8.0 7.5 7.4 8.8 120 10.2 * 9.4 9.2 * * 10.9 8.7 8.2 8.4 * * 8.2 7.9 7.8 7.1 7.2 8.6 130 9.8 * 9.2 9.0 * * 10.6 8.5 7.9 8.3 * * 8.0 7.7 7.6 7.0 7.2 8.4 140 9.8 * 8.9 9.0 * * 10.5 8.3 7.6 8.1 * * 8.0 7.5 7.4 7.0 7.1 8.4 150 9.9 * 8.6 8.7 * * 10.4 8.3 7.3 7.9 * * 7.5 7.3 7.0 7.0 7.1 8.3 160 * * 8.5 8.5 * * 10.0 8.2 7.5 7.7 * * 6.6 7.2 * 6.8 * *
Secchi depth
Depth (m)
11.7 11.4 12.5 12.9 15.6 17.8 15.7 17.0 16.5 17.1 14.7 15.7 16.1 15.1 14.3 15.0 12.5 15.7
* = missing or invalid data

Lake Taupo Long-Term Monitoring Programme 2007-2008 57
11. Appendix 4: Nutrient data
Includes accumulated 10-m tube data since 1994. Blank cells represent missing data.
For completeness, 10-m tube data collected from the Kuratau Basin (site B) and Western Bays (site C) from January 2002 to December 2004 are included as separate sheets following the mid-lake data from site A for those years.
In the spring/autumn profile data, two different analytical methods are used to measure particulate nitrogen:
1. a wet digestion method involving high temperature refluxing in digestion mixture [persulphate / sulphuric acid / Selenium catalyst] for 3 hours followed by colorimetric determination of the nitrogen as the ammoniacal form; and
2. a CHN combustion method which converts all nitrogen compounds to N2 gas in a furnace at ~1000°C to be measured in a thermal conductivity detector.
Particulate nitrogen analysed by the wet digestion method may not include some refractory nitrogen components which may be detected by the CHN combustion furnace method. Consequently the PN value from the CHN combustion furnace method should always be greater than or equal to the PN value obtained by the wet digestion method. Occasionally they are reported as less than the wet digestion method value in which case the wet digestion value should be regarded as correct. The cause of this difference is unknown but may be associated with the presence of low molecular weight organic nitrogen compounds lost during the drying step before combustion. The PN values for the time series data are all from wet digestion method analyses and hence are directly comparable with the profile data.
Low level NH4-N results are likely to be subject to interference from low molecular weight DON and hence may not be biologically available for phytoplankton growth.
From February 2002, DRP, NO3-N, and NH4-N were measured on a Lachat Flow Injection Analysis (FIA) system but using essentially the same chemistry as previously used on the Technical Auto-Analyzer system. The reported detection limits for these nutrients remains the same at 0.5 mg m-3 for DRP and NO3-N, and 1 mg m-3 for NH4-N, however, the greater precision of the FIA system provides confidence in reporting results to a lower level as an indication of likely absolute values near zero. Such values are provided as an indication only and the true value should be expressed
Lake Taupo Long-Term Monitoring Programme 2007-2008 58
as less than the detection limit. TN and TP values are the sum of all N and P components, excluding Urea-N which is part of the DON component. All analytical values ‘on-the-day’ are used wherever possible or <DL = DL/2 for summation in TN and TP. See section 8.2 for discussion on detection limits.
The DON value for 5/08/2000 was corrected from 12 to 43.5 in March 2006. This was a transcription error from the original analytical result sheet.
Temperature, water clarity (Secchi depth) and chlorophyll a data available from August 2008 up to the time of reporting have been included in the 10-m tube data set.

Lake Taupo Long-Term Monitoring Programme 2007-2008 59
Lake Taupo cumulative database of 10m tube sample data from October1994 to September 2002.
Samples collected from central lake site. Date
Collected Temp. Secchi DRP DOP PP TP NH4-N NO3-N DON PN TN Chlorophyll a PC
oC m mg m-3 mg m-3 mg m-3 mg m-3 mg m-3 mg m-3 mg m-3 mg m-3 mg m-3 mg m-3 mg m-3
27/10/1994 11.7 11.7 1.2 0.7 2.5 4.4 1.1 0.2 56 16.6 73.4 1.16 24/11/1994 12.8 11.4 0.5 2.7 1.7 4.8 1.7 1.0 51 12.6 66.5 0.41 1/12/1994 15.7 12.5 0.6 2.4 2.4 5.4 2.2 1.2 56 18.5 78.0 0.41 13/12/1994 17.5 12.9 0.8 4.2 1.4 6.4 <0.2 0.9 51 9.3 60.8 0.24 28/12/1994 17.8 15.6 0.5 1.7 1.9 4.1 1.1 1.3 51 16.7 69.6 0.41 13/01/1995 18.6 17.8 0.1 2.2 1.6 3.8 <0.2 0.8 53 11.6 64.9 0.22 24/01/1995 19.9 15.7 0.2 2.1 1.2 3.6 <0.2 0.8 57 13.3 71.0 0.25 10/02/1995 20.6 17.0 0.3 2.2 1.2 3.6 <0.2 1.5 62 10.2 73.3 0.32 27/02/1995 20.9 16.5 0.4 <0.5 2.5 2.8 1.9 1.5 71 16.5 90.8 0.35 9/03/1995 20.9 17.1 0.4 1.7 1.7 3.7 0.2 0.7 55 11.6 67.5 0.28 24/03/1995 18.5 14.7 1.9 1.9 13.0 0.37 12/04/1995 19.4 15.7 0.2 1.4 1.7 3.2 0.3 0.7 51 17.3 69.6 0.57 19/04/1995 18.4 16.1 2.8 1.5 1.4 5.7 4.0 0.9 71 14.1 90.0 0.92 4/05/1995 17.0 15.1 1.4 1.1 3.0 5.5 1.4 2.3 76 24.7 104.4 0.96 21/05/1995 15.0 14.3 1.2 0.9 2.2 4.3 0.4 2.1 50 29.2 81.8 0.98 8/06/1995 13.4 15.0 0.7 0.4 1.8 2.9 0.2 0.6 54 15.4 70.2 1.05 14/07/1995 11.3 12.5 0.3 2.5 1.7 4.5 0.3 2.1 53 15.0 70.8 1.32 30/07/1995 10.8 15.7 0.7 0.7 1.9 3.3 <0.2 4.6 35 17.3 57.3 13/08/1995 0.5 0.4 1.9 2.8 <0.2 4.6 39 14.2 57.4 0.99 12/09/1995 10.7 11.9 0.5 2.2 2.2 4.9 1.0 40.9 177 19.1 237.6 1.37 25/09/1995 11.5 11.9 <0.2 0.7 2.1 2.8 <0.2 0.1 84 17.6 101.6 0.64 30/10/1995 13.0 13.0 <0.2 2.4 1.9 4.3 <0.2 <0.1 56 14.7 70.4 0.93 24/11/1995 13.7 13.6 0.8 1.8 1.6 4.3 1.9 <0.1 59 12.6 73.3 0.29 6/12/1995 17.7 15.1 2.2 0.4 1.2 3.9 1.7 <0.1 58 11.3 70.8 0.20 12/01/1996 21.1 16.3 2.6 0.6 1.2 4.4 3.6 <0.1 64 10.1 77.8 0.24 31/01/1996 21.7 15.7 1.3 1.6 1.3 4.2 4.2 <0.1 59 11.9 75.5 0.29 13/02/1996 22.7 17.8 2.1 3.3 1.2 6.6 7.4 <0.1 81 10.4 98.9 0.15 29/02/1996 20.5 18.4 1.9 2.2 1.2 5.3 4.2 <0.1 61 10.8 76.3 0.31 20/03/1996 18.2 14.1 0.8 2.2 1.4 4.5 5.4 <0.1 76 14.2 95.3 0.56 Special repeat analyses. 28/03/1996 16.8 14.6 1.3 1.8 1.4 4.5 4.7 <0.1 91 12.6 108.3 0.81 Detection limit <0.1 mg m-3 18/04/1996 17.7 14.4 0.8 2.2 4.3 <0.1 61 0.41 19/05/1996 14.8 14.7 0.8 3.0 6.8 <0.1 59 0.70 14/06/1996 12.2 14.4 1.6 3.2 5.7 <0.1 71 19/06/1996 12.2 14.4 1.0 1.2 4.0 <0.1 49 0.70 9/07/1996 11.2 12.9 3.0 1.9 4.0 <0.1 47 11.3 0.80 3/09/1996 10.5 13.1 0.7 2.0 3.0 5.7 2.5 0.2 52 17.0 71.7 1.03 18/09/1996 10.7 14.2 1.3 1.2 2.4 4.9 2.1 0.2 42 14.0 58.3 0.75 30/09/1996 12.5 11.2 0.9 1.6 1.8 4.3 3.3 0.2 58 11.0 72.5 0.28 17/10/1996 13.3 12.6 0.6 2.1 2.6 5.3 2.9 2.5 64 19.0 88.4 0.59 24/10/1996 12.6 13.4 0.7 2.3 2.2 5.2 2.4 0.4 64 15.0 81.8 0.47 6/11/1996 13.5 14.9 0.8 2.6 2.2 5.6 3.2 1.0 64 17.0 85.2 0.45 28/11/1996 13.6 14.1 0.4 1.9 2.4 4.7 2.6 0.4 49 20.0 72.0 0.90 11/12/1996 14.8 14.7 1.3 1.7 1.3 4.3 6.2 0.8 98 17.0 122.0 0.33 23/12/1996 16.3 17.7 1.3 1.1 5.2 0.3 46 0.23 8/01/1997 17.9 15.1 0.7 1.7 1.9 4.3 2.0 0.6 50 15.0 67.6 0.33 29/01/1997 17.8 15.2 0.7 1.8 1.6 4.1 1.9 0.4 54 17.0 73.3 0.21 26/03/1997 17.7 15.3 0.6 1.7 2.1 4.4 2.4 1.8 57 19.0 80.2 0.46 2/04/1997 17.3 16.0 0.9 1.3 1.6 3.8 1.7 0.3 51 16.0 69.0 0.69 15/04/1997 16.7 17.7 0.7 2.5 1.5 4.7 3.2 0.8 57 12.0 73.0 0.40 1/05/1997 15.6 16.0 0.6 1.7 0.1 0.58 21/05/1997 14.2 14.6 1.0 8.8 1.7 11.5 4.5 0.3 92 15.0 111.8 1.05 29/05/1997 14.3 14.5 1.1 1.1 3.3 1.0 51 0.89 7/07/1997 11.6 12.5 0.6 0.9 4.7 2.1 53 0.90 29/07/1997 10.9 13.5 0.5 1.6 1.5 2.1 39 1.13 2/09/1997 10.6 14.1 1.4 1.1 1.7 4.2 7.0 1.8 47.0 13.1 68.9 1.08 16/09/1997 10.6 12.0 0.5 1.1 1.3 0.7 35 2.16 11/10/1997 11.6 13.7 2.4 2.8 1.7 6.9 4.8 0.9 63.3 16.2 85.2 1.14 29/10/1997 12.1 12.5 0.7 1.9 1.9 4.5 1.3 7.3 32 19.0 59.6 1.49 2/12/1997 14.5 14.5 0.2 2.3 3.2 1.7 55 0.83 21/01/1998 17.7 14.7 1.4 1.1 1.2 3.7 2.8 1.5 46.0 10.0 60.3 0.48 Detection limits prior to 14 April 1999 were 4/03/1998 20.0 11.5 1.5 1.7 2.6 5.8 6.4 4.0 76.0 19.8 106.2 0.58 DL 24/03/1998 19.3 13.5 1.0 1.4 1.8 3.2 2.1 1.1 48.0 13.2 64.4 1.25 DRP 0.2 mg m-3 7/04/1998 17.7 13.5 0.9 1.4 1.8 4.1 1.9 2.5 52.0 13.7 70.1 1.04 NH4-N 0.5 mg m-3 29/05/1998 14.2 15.5 1.0 1.9 1.9 4.8 5.0 3.5 51.0 16.4 75.9 1.36 NO3-N 0.5 mg m-3 28/07/1998 11.4 10.0 1.2 1.0 3.1 5.3 2.1 1.4 45.0 26.0 74.5 1.19 29/09/1998 12.9 10.5 1.5 1.0 2.2 0.5 41.0 20.3 64.0 0.70 Values reported less than the DL 8/10/1998 12.9 10.4 1.5 <1 2.4 2.4 46.0 37.6 88.4 1.00 were special estimates of low samples. 1/11/1998 13.6 13.5 0.6 1.3 2.6 4.5 2.4 <0.5 36.0 15.2 53.6 0.90 26/11/1998 18.4 15.0 1.3 2.6 2.1 6.0 9.6 1.6 42.0 16.4 69.6 0.61 22/12/1998 18.5 14.5 1.1 0.4 2.5 4.0 2.7 1.1 36.0 17.7 61.5 0.25 12/02/1999 20.1 12.5 0.8 2.8 1.7 5.3 4.0 1.6 39.0 11.4 56.0 0.60 165 3/03/1999 20.9 14.3 0.6 2.9 2.0 5.5 1.6 1.1 40.0 16.8 59.5 0.82 203 14/04/1999 18.3 13.0 0.6 <1 1.8 2.4 3.0 <0.5 41.0 19.0 61.6 1.20 250 30/04/1999 16.4 12.2 1.1 1.5 1.7 4.3 2.1 <0.5 38.0 19.6 60.2 0.94 198 Detection limits from 14 April 1999 on are 19/05/1999 14.4 15.0 0.8 <1 1.5 5.1 1 <1 46.0 16.2 63.7 1.2 166 DL 8/06/1999 14.1 14.5 1.0 <1 3.9 4.9 1 <1 48.0 25.4 74.9 1.1 DRP 0.5 mg m-3 18/06/1999 13.0 15.0 0.8 <1 2.0 5.0 2 5 42.0 16.5 65.5 1.7 NH4-N 1 mg m-3 20/07/1999 12.0 16.0 0.5 <1 3.1 3.6 1 <1 45.0 28.3 74.3 1.0 NO3-N 1 mg m-3 9/08/1999 11.5 14.5 1.3 1.7 2.3 5.3 4 8 45.0 18.4 75.4 1.7 6/09/1999 11.1 10.0 <0.5 2.5 2.1 5.1 2 1 60 16.2 79.2 0.5 Values reported less than the DL 29/09/1999 11.5 10.0 0.7 1 4 5.7 3 1 54 32.6 90.6 1.8 were special estimates of low samples. 18/10/1999 12.7 14.9 0.5 3 2.5 6 <1 <1 41 19.4 60.4 0.4 20/12/1999 16.4 18.0 0.7 2.3 5 8 4 2 39 38 83 1.6 18/01/2000 17.6 19.1 0.9 2 2 4 5 2 52 18.5 70.5 0.6 12/04/2000 17.3 15.0 0.8 3 2 5 1 1 61 22 83 0.8 4/05/2000 15.8 14.0 1 3 2 5 1 2 48 17 68 1.3 25/05/2000 14.3 14.0 1 4 1 6 2 <1 55 17 65 0.6 20/06/2000 12.3 14.0 <1 4 0 4.0 2 2 52 16 72.0 1.7 194 11/07/2000 11.9 11.0 <1 4 3 7.0 3 2 46 22.5 73.5 1.65 198 5/08/2000 11.3 12.0 2 2 3 7.0 1 3.5 43.5 19.5 66.0 2.5 154 22/08/2000 11.2 15.0 2 2 2 6.0 2 4 49 16.5 71.5 1.65 159 12/09/2000 11.5 12.0 2 5 3.5 10.5 2 <1 63 23.5 88.5 1 148 29/09/2000 11.5 13.0 2 4 2 8.0 1 1 54 21 77.0 1.15 237 26/10/2000 13.1 11.0 0.8 4.2 3 8.0 1.0 0.4 41.6 25 68.0 1.3 237 14/11/2000 13.1 12.0 <1 4 2 6.0 1 <1 41 14.5 56.5 0.9 171 7/12/2000 15.1 17.0 2 2 1.55 5.6 7 4 63 14.75 88.8 0.6 166 4/01/2001 18.0 14.5 <1 2 1.5 3.5 1 <1 40 11 52.0 0.5 127 16/01/2001 19.0 18.0 0.5 2.5 1.5 4.5 1 0.5 53.5 13 68.0 0.5 119 21/02/2001 20.5 17.0 0.9 1.1 1.5 3.5 <1 0.5 46.5 12.5 59.5 0.6 191 2/03/2001 20.7 14.5 <1 2 2 4.0 2 <1 53 18 73.0 0.9 193 20/03/2001 19.0 17.0 <1 3 1.4 4.4 <1 <1 46 14.25 60.3 0.9 154 9/04/2001 17.0 13.5 0.8 1.2 2.15 4.2 <1 3 62 19.45 84.5 1.05 199 8/05/2001 15.8 17.0 0.8 3.2 1.7 5.7 2 <1 61 23 86.0 1.1 248 30/05/2001 13.6 14.5 1.5 1.5 2 5.0 1 <1 57 12 70.0 1.4 203 2/07/2001 12.1 12.0 <1 3 2.3 5.3 1 1 50 18.3 70.3 1.5 156 25/07/2001 11.3 14.5 2 1 2.65 5.7 <1 6 45 19.75 70.8 2.2 188 13/08/2001 11.2 13.5 1 1 2.85 4.9 1 <1 41 21.9 63.9 2.1 225 3/09/2001 10.2 17.5 1 1 2.6 4.6 <1 <1 37 19 56.0 1.7 203 25/09/2001 11.6 11.0 1.1 0.9 2.8 4.8 1 <1 56 24.5 81.5 0.9 283 New LACHAT Flow Injection Analysis 25/10/2001 13.0 14.5 0.8 1.2 2.4 4.4 <1 <1 46 19.4 65.4 1.1 246 Detection limits from 1 Dec 2001 on are 12/11/2001 14.3 15.5 0.7 <1 (0.3) 5.15 6.2 <1 (0.5) <0.5 (0) 34 35.0 69.5 1.7 403 DL 10/12/2001 15.5 16.0 1.0 2 2.55 5.6 <1 (0.9) <0.5 (0.1) 48 17.6 65.6 0.5 228 DRP 0.5 mg m-3 20/12/2001 17.0 13.0 0.6 2.7 2.05 5.4 1.3 <0.5 (0.1) 48 14.85 64.2 0.5 204 NH4-N 1 mg m-3 8/01/2002 18.3 13.0 <0.5 (0.3) 2 2.2 4.2 <1 (0) <0.5 50 17.15 67.2 0.8 247 NO3-N 0.5 mg m-3 22/01/2002 19.3 15.0 <0.5 (0) 7 2.25 9.3 <1 (0) <0.5 40 20.35 60.4 0.9 188 6/03/2002 18.7 14.5 1.2 0.8 2.05 4.1 <1 (0) <0.5 (0.4) 74 17.7 91.7 1.7 227 High precision and confidence in the FIA 4/04/2002 17.4 19.0 0.6 3 1.45 5.1 1.1 <0.5 (0.1) 46 10.7 57.8 0.8 138 results allow estimates below the nominal DL. 17/04/2002 17.4 22.0 <0.5 (0) 3 1.65 4.7 <1 (0.5) 0.5 47 13.1 60.6 0.9 157 Data in brackets are given as an indication 22/04/2002 17.05 22.0 - - - - - - - - - - - 5/05/2002 15.5 16.4 0.7 1 3.1 0.7 48 1 of the likely absolute concentration 16/05/2002 0.9 1.1 1.5 3.5 <1 <0.5 49 15.1 64.1 0.7 153 19/06/2002 12.6 17.0 1.2 1.8 1.9 4.9 <1 (0.5) 1.4 43.6 15.8 60.8 1.1 165 1/07/2002 12.1 16.0 1.2 1.8 1.8 4.8 <1 (0.9) 1.7 37.3 14.3 53.3 1.5 214 17/07/2002 11.4 15.5 2.3 2.7 1.7 6.7 2.3 7.8 41.9 14.6 66.6 1.5 154 31/07/2002 11.2 12.0 2.3 2.7 2.5 7.5 <1 (0.9) 5.9 177.2 16.7 199.8 2.2 193 29/08/2002 11.1 9.5 1.6 1.4 3.1 6.1 <1 (0) <0.5 (0) 90 23 113.0 2.6 196 5/09/2002 6.7 - - - - - - - - - - -

Lake Taupo Long-Term Monitoring Programme 2007-2008 60
Lake Taupo cumulative database of 10 m tube sample data from June 2000 on Samples collected from Mid Lake (Site A)
Date Collected Temp. Secchi DRP DOP PP TP NH4-N NO3-N DON PN TN Chlorophyll a PC
ºC (m) (mg m-3) (mg m-3) (mg m-3) (mg m-3) (mg m-3) (mg m-3) (mg m-3) (mg m-3) (mg m-3) (mg m-3) (mg m-3) 20/06/2000 12.3 14.0 <1 4 0 4.0 2 2 52 16 72.0 1.7 193.5 11/07/2000 11.9 11.0 <1 4 3 7.0 3 2 46 22.5 73.5 1.65 198 5/08/2000 11.3 12.0 2 2 3 7.0 1 3.5 43.5 19.5 36.0 2.5 153.5 22/08/2000 11.2 15.0 2 2 2 6.0 2 4 49 16.5 71.5 1.65 158.5 12/09/2000 11.5 12.0 2 5 3.5 10.5 2 <1 63 23.5 88.5 1 148 29/09/2000 11.5 13.0 2 4 2 8.0 1 1 54 21 77.0 1.15 236.5 26/10/2000 13.1 11.0 0.8 4.2 3 8.0 1.0 0.4 41.6 25 68.0 1.3 237 14/11/2000 13.1 12.0 <1 4 2 6.0 1 <1 41 14.5 56.5 0.9 171 7/12/2000 15.1 17.0 2 2 1.55 5.6 7 4 63 14.75 88.8 0.6 165.5 4/01/2001 18.0 14.5 <1 2 1.5 3.5 1 <1 40 11 52.0 0.5 127 16/01/2001 19.0 18.0 0.5 2.5 1.5 4.5 1 0.5 53.5 13 68.0 0.5 118.5 21/02/2001 20.5 17.0 0.9 1.1 1.5 3.5 <1 0.5 46.5 12.5 59.5 0.6 190.5 2/03/2001 20.7 14.5 <1 2 2 4.0 2 <1 53 18 73.0 0.9 193 20/03/2001 19.0 17.0 <1 3 1.4 4.4 <1 <1 46 14.25 60.3 0.9 154 9/04/2001 17.0 13.5 0.8 1.2 2.15 4.2 <1 3 62 19.45 84.5 1.05 199 8/05/2001 15.8 17.0 0.8 3.2 1.7 5.7 2 <1 61 23 86.0 1.1 248 30/05/2001 13.6 14.5 1.5 1.5 2 5.0 1 <1 57 12 70.0 1.4 203 2/07/2001 12.1 12.0 <1 3 2.3 5.3 1 1 50 18.3 70.3 1.5 155.5 25/07/2001 11.3 14.5 2 1 2.65 5.7 <1 6 45 19.75 70.8 2.2 188 13/08/2001 11.2 13.5 1 1 2.85 4.9 1 <1 41 21.9 63.9 2.1 225 3/09/2001 10.2 17.5 1 1 2.6 4.6 <1 <1 37 19 56.0 1.7 203 25/09/2001 11.6 11.0 1.1 0.9 2.8 4.8 1 <1 56 24.5 81.5 0.9 283 25/10/2001 13.0 14.5 0.8 1.2 2.4 4.4 <1 <1 46 19.4 65.4 1.1 246 12/11/2001 14.3 15.5 1.0 2 2.55 5.6 0.9 0.1 48 17.6 66.6 0.5 227.5 10/12/2001 15.5 16.0 1.0 2 2.55 5.6 0.9 0.1 48 17.6 66.6 0.5 227.5 20/12/2001 17.0 13.0 0.6 2.7 2.05 5.4 1.3 0.1 48 14.85 64.3 0.5 203.5 8/01/2002 18.3 13.0 0.3 2 2.2 4.5 0 <1 50 17.15 67.2 0.8 246.5 22/01/2002 19.3 15.0 0 7 2.25 9.3 0 <1 40 20.35 60.4 0.9 188 6/03/2002 18.7 14.5 1.2 0.8 2.05 4.1 0.0 0.4 74 17.7 92.1 1.7 226.5 4/04/2002 17.4 19.0 0.6 3 1.45 5.1 1.1 0.1 46 10.7 57.9 0.8 138 17/04/2002 17.4 22.0 0.0 3 1.65 4.7 0.5 0.5 47 13.1 61.1 0.9 157 5/05/2002 15.5 16.4 0.7 1 3.1 0.7 48 1 19/06/2002 12.6 17.0 1.2 1.8 1.9 4.9 0.5 1.4 43.6 15.8 61.3 1.1 165.0 1/07/2002 12.1 16.0 1.2 1.8 1.8 4.8 0.9 1.7 37.3 14.3 54.2 1.5 214 17/07/2002 11.4 15.5 2.3 2.7 1.7 6.7 2.3 7.8 41.9 14.6 66.6 1.5 153.5 31/07/2002 11.2 12.0 2.3 2.7 2.5 7.5 0.9 5.9 177.2 16.7 200.7 2.2 193

Lake Taupo Long-Term Monitoring Programme 2007-2008 61
Date Collected Temp. Secchi DRP DOP PP TP NH4-N NO3-N DON PN TN Chlorophyll a PC
ºC (m) (mg m-3) (mg m-3) (mg m-3) (mg m-3) (mg m-3) (mg m-3) (mg m-3) (mg m-3) (mg m-3) (mg m-3) (mg m-3) 29/08/2002 11.1 9.5 1.6 1.4 3.1 6.1 0.0 0 90 23 113.0 2.6 196 18/09/2002 11.4 12 1.3 1.7 2 5.0 0 0.3 47 13 60.3 0.9 196.5 9/10/2002 11.6 15.5 1.3 2.7 2.1 6.1 2.9 0 29 12 43.9 0.6 159.5 13/11/2002 12.6 18 0.9 1.1 2.4 4.4 1.7 1.3 41 14.0 58.0 0.7 158.5 28/11/2002 14.1 12.7 0.7 2.3 2.7 5.7 0.1 0.0 43.0 22.0 65.1 0.7 201.5 18/12/2002 15.0 13.5 0.6 1.8 2.5 4.9 0.2 0.1 47.0 14.0 61.3 0.4 123.0 30/01/2003 17.8 18 0.4 3.6 1.9 5.9 0.4 0.1 56.5 12.0 69.0 0.7 166.0 13/02/2003 19.3 19 0.5 2.5 1.6 4.6 0.0 0.4 43.6 8.0 52.0 0.5 146.0 17/03/2003 18.5 15 0.8 2.2 1.7 4.7 <1 0.4 45.6 13.0 59.0 1.0 212 3/04/2003 19.3 13.5 1.1 2.9 1.8 5.8 <1 0.5 78.5 17.7 96.7 1.1 234.5 28/04/2003 16.7 14 0.3 3.7 1.9 5.9 <1 0.3 73.7 15.6 89.6 1.5 208.5 15/05/2003 15.6 16.5 0.1 3.9 2.2 6.2 0.3 0.3 50.4 19.5 70.5 1.4 228.5 12/06/2003 13.5 11 1.3 2.7 2.2 6.2 0.3 0.4 40.3 13.7 54.7 1.3 111.0 14/07/2003 11.8 14.5 2.2 1.8 2.6 6.6 1.1 1.1 34.8 18.0 55.0 1.8 102.0 31/07/2003 11.4 14 2.4 1.6 2.4 6.4 1.3 3.7 46.0 16.7 67.7 2.0 89.5 14/08/2003 11.2 13.5 1.8 2.2 3.1 7.1 0.7 0.2 46.1 21.1 68.1 2.9 91.5 26/08/2003 11.2 13 3.0 1.0 4.0 8.0 1.0 0.2 42.8 21.7 65.7 2.9 135.5 8/09/2003 11.1 12.5 2.6 0.4 3.3 6.3 0.4 0.2 45.2 17.4 63.2 1.5 199.5 7/10/2003 11.4 13.0 2.6 1.6 2.8 7.0 0.3 0.2 54.5 17.8 72.8 1.2 157.5 21/10/2003 13.0 17.0 2.0 1.0 2.3 5.3 0.1 1.3 39.6 14.0 55.0 0.6 146.0 19/11/2003 13.9 16.0 1.7 1.3 2.8 5.8 0.3 0.1 45.6 20.0 66.0 0.8 148.0 4/12/2003 16.0 18.5 1.6 2.4 1.8 5.8 0.2 0.1 53.7 13.4 67.4 0.3 106.5 18/12/2003 17.7 17.5 1.1 3.9 3.1 8.1 0.0 0.0 49.0 20.6 69.6 0.4 151.5 13/01/2004 20.3 19.0 0.5 3.5 1.6 5.6 0.0 0.3 52.0 12.5 64.8 0.4 127.0 26/02/2004 17.2 17.0 1.4 1.7 1.6 4.7 0.0 0.1 40.9 15.5 56.5 0.7 139.0 8/03/2004 17.5 15.0 0.6 2.4 2.0 5.0 0.4 0.1 42.5 12.4 55.4 0.6 177.5 31/03/2004 16.4 16.0 0.8 5.2 1.9 7.9 0.2 0.2 78.6 11.5 90.5 1.2 159.5 14/04/2004 15.3 15.0 1.0 3.0 2.4 6.4 0.1 0.3 46.6 16.0 63.0 1.3 187.5 10/05/2004 14.7 18.0 0.6 4.4 1.8 6.8 0.1 0.2 64.7 16.8 81.8 1.2 215.0 10/06/2004 13.6 13.5 0.9 2.1 2.1 5.1 0.0 0.6 63.4 17.8 81.8 1.0 371.5 13/07/2004 11.6 12.0 1.8 3.2 2.4 7.4 0.3 4.5 37.2 19.4 61.4 1.6 193.3 26/07/2004 11.3 11.0 1.6 2.4 3.0 7.0 0.5 2.4 38.1 23.4 64.4 2.7 196.0 24/08/2004 10.9 12.5 0.8 3.2 2.7 6.7 0.0 0.5 58.5 18.6 77.6 2.3 181.5 7/09/2004 10.7 12.0 0.6 2.4 2.7 5.7 0.0 0.1 40.9 15.5 56.5 1.4 162.5 21/10/2004 11.6 15.0 1.0 3.0 2.0 6.0 0.0 0.0 33.0 13.0 46.0 0.7 185.0 2/11/2004 12.9 16.0 1.0 3.0 1.9 5.9 2.2 0.8 62.0 14.7 79.7 0.6 147.0 22/11/2004 15.1 16.0 0.7 2.3 2.1 5.1 0.1 0.2 49.7 16.4 66.4 0.4 195.0 15/12/2004 14.1 19.5 0.7 3.3 2.2 6.2 0.0 0.2 45.8 14.7 60.7 0.2 127.5

Lake Taupo Long-Term Monitoring Programme 2007-2008 62
Date Collected Temp. Secchi DRP DOP PP TP NH4-N NO3-N DON PN TN Chlorophyll a PC
ºC (m) (mg m-3) (mg m-3) (mg m-3) (mg m-3) (mg m-3) (mg m-3) (mg m-3) (mg m-3) (mg m-3) (mg m-3) (mg m-3) 11/01/2005 16.0 20 0.4 2.6 1.4 4.4 0 0.1 42.9 12.5 55.5 0.2 137 25/01/2005 19.3 19.5 0.5 2.5 1.5 4.5 0.0 0.1 54.9 14.5 69.5 0.3 131.0 9/02/2005 20.7 18 2.2 0.8 1.4 4.4 0.5 0.0 38.5 12.7 51.7 0.2 136.0 22/02/2005 20.0 21.5 0.8 5.2 1.7 7.7 1.5 0.5 58.0 15.8 75.8 0.2 159.0 10/03/2005 19.3 18.5 0.2 2.8 1.4 4.4 1.8 0.2 34.0 14.5 50.5 0.4 158.0 21/03/2005 19.3 20 0.8 3.2 1.2 5.2 0.5 0.1 43.4 10.0 54.0 0.5 140.0 14/04/2005 17.9 17.2 0.9 2.1 1.6 4.6 0.8 0.2 54.0 14.0 69.0 0.7 177.0 18/05/2005 14.3 16 0.8 2.2 1.9 4.9 0.0 0.5 46.5 13.9 60.9 1.3 177.5 9/06/2005 13.0 14.1 0.6 3.4 2.2 6.2 0.1 1.6 41.3 17.4 60.4 1.3 140.5 20/06/2005 12.7 13.8 0.6 3.4 2.0 6.0 0.1 1.0 39.9 18.5 59.5 1.2 158.5 20/07/2005 11.5 13 3.9 6.1 2.5 12.5 0.8 0.8 97.4 19.1 118.1 2.1 169 3/08/2005 11.1 14 2.6 1.4 2.3 6.3 2.0 1.4 61.6 20.3 85.3 1.2 116 17/08/2005 11.2 13 3.1 1 3.2 7.3 0.3 2.1 49.6 26.4 78.4 1.7 172.5 31/08/2005 11.7 13 2 1 2.4 5.4 <1 1 69 22.2 92.2 1.3 330 14/09/2005 12.4 13 1 1 2.5 4.5 <1 <1 60 19.9 79.9 0.8 243 29/09/2005 11.9 14 1 1 2.4 4.4 <1 <1 67 18 85 0.8 253.5 12/10/2005 11.9 14 0.7 2.3 2.7 5.7 0.0 0.7 56.3 23.2 80.2 0.8 301 25/10/2005 13.4 15 0.8 4.2 1.8 6.8 0.6 0.7 54.7 16.8 72.8 0.6 193 10/11/2005 16.3 17.5 1.2 3.8 1.5 6.5 0.2 0.1 52.7 15.6 68.6 0.5 160 1/12/2005 15.1 19.3 0.6 2.4 1.4 4.4 0 0.3 39.7 16.1 56.1 0.4 141 10/01/2006 17.4 19 1 2 1.4 4.4 0.1 1 49.9 17.8 68.8 0.5 167 2/02/2006 20.2 15.5 1.1 8.9 1.5 11.5 0.0 0.0 54 18 72 1.1 193.5 1/03/2006 19.5 15.3 0.3 7.7 1.6 9.6 0.0 1.3 38.7 18.5 58.5 0.9 160.5 12/04/2006 16.7 15.8 0.6 2.4 1.6 4.6 0.0 0.0 43 20.4 63.4 1.0 230 27/04/2006 16.3 17 1.0 2 1.6 4.6 0.1 0.0 52.9 17.6 70.6 1.1 196.5 9/05/2006 15.7 17.5 0.7 2.3 1.6 4.6 0.7 0.1 46.2 17.2 64.2 0.9 233 30/05/2006 14.2 18.2 0.8 2.2 1.6 4.6 1.8 0.9 61.3 16.6 80.6 1.3 233 27/06/2006 11.9 15.2 0.8 3.2 1.9 5.9 0.8 1.3 61.9 23.2 87.2 2 243 11/07/2006 11.5 13.5 1.4 5.6 2.3 9.3 0.2 1.7 93.1 21 116 1.7 209 25/07/2006 11.1 12 1.0 0 2.1 3.1 0.9 7.4 48.7 17.6 74.6 2.8 192 4/09/2006 11.1 11 1.8 1.2 2.5 5.5 0.0 0.6 31.4 24.5 56.5 2.8 218 26/09/2006 11.9 17.5 1.0 0.8 2.3 4.1 0.0 0.1 39.9 18.6 58.6 0.8 347 18/10/2006 11.7 13 0.8 1.2 2.5 4.5 0.0 0.3 35.7 18.2 54.2 0.9 227.5 1/11/2006 12.4 14.5 0.3 2.7 2.4 5.4 0.0 0.0 41 19.4 60.4 0.8 203 5/12/2006 14.7 16 0.0 3 2 5 0.0 0.0 52 20.2 72.2 0.7 186 19/12/2006 15.6 15.5 0.2 1.8 1.8 3.8 1.0 0.1 48.9 15.4 65.4 0.7 150 9/01/2007 16.5 13.5 0.5 1.5 1.6 3.6 0.9 0.4 60.7 15 77 0.3 207 25/01/2007 18.5 14.5 0.6 0 1.6 2.2 1.5 0.5 59 18.6 79.6 0.3 212 8/02/2007 19.3 16 0.6 0 1.6 2.2 0.4 0.5 58.1 16.8 75.8 0.4 156 21/02/2007 19.6 18.2 0.4 0 1.8 2.2 0.8 0.5 68.3 24.4 94 0.3 182 21/03/2007 18.6 16.5 1.1 0 2.1 3.2 1.8 1.3 47.2 22.1 72.4 0.8 175 3/04/2007 18.0 19 0.9 6.1 1.8 8.8 0.6 0.3 66.9 23.8 91.6 0.7 19/04/2007 16.5 16 0.9 3.1 2.7 6.7 2.4 1.0 69.6 29.2 102.2 0.6 193

Lake Taupo Long-Term Monitoring Programme 2007-2008 63
Date Collected Temp. Secchi DRP DOP PP TP NH4-N NO3-N DON PN TN Chlorophyll a PC
ºC (m) (mg m-3) (mg m-3) (mg m-3) (mg m-3) (mg m-3) (mg m-3) (mg m-3) (mg m-3) (mg m-3) (mg m-3) (mg m-3) 8/05/2007 19.3 16 1.1 3.9 1.2 6.2 0.3 0.4 63.3 17.8 81.8 1.2 169 22/05/2007 15.2 18.5 0.7 2.3 1.3 4.3 2.0 0.5 53.5 15.4 71.4 0.8 201 14/06/2007 13.6 18 0.6 2.4 1.8 4.8 4.0 0.8 65.2 21.8 91.8 1 159 27/06/2007 12.4 18.5 0.8 0.2 3.6 4.6 2.1 1.4 45.5 25.8 74.8 1.2 162 18/07/2007 11.4 14.5 1.1 1.9 2.9 5.9 1.3 1.0 44.7 37.8 84.8 1.7 8/08/2007 11.1 14 1.1 1.9 2.8 5.8 2.0 2.2 46.8 28.2 79.2 1.3 229 23/08/2007 11.0 13 0.8 2.2 2.5 5.5 0.4 0.4 39.2 30.3 70.3 2.2 202 11/09/2007 11.0 11 1 4 3.3 8.3 0 1 67 34.7 102.7 1.4 324 9/10/2007 12.1 15 1 1 2.6 4.6 1.4 1.5 59.1 23.8 85.8 0.8 184 30/10/2007 12.8 16 1.1 0.9 2.4 4.4 1.2 0.6 64.2 30.5 96.5 0.7 253 15/11/2007 13.5 14 1.8 2.2 2.1 6.1 1.8 0.3 53.9 24.8 80.8 0.5 262 4/12/2007 16.6 15 0.9 2.1 2 5 0.9 0.6 40.5 20.6 62.6 0.3 196 20/12/2007 17.4 17.5 1.1 2.9 1.1 5.1 0.2 0.4 44.4 17 62 0.6 112 17/01/2008 21.1 22.5 1 4 1.5 6.5 0.9 0.4 62.7 24.5 88.5 0.3 230 31/01/2008 19.8 21.5 0.5 1.5 1.3 3.3 1.5 0.3 75.2 17.6 94.6 0.3 190 14/02/2008 19.9 25 0.3 1.7 1.6 3.6 1.4 0.7 75.9 19.8 97.8 0.4 138 27/02/2008 19.3 22 0.1 1.9 1.6 3.6 0.7 0.2 70.1 20 91 0.4 143 13/03/2008 18.8 22 1 1 1.2 3.2 1.2 0.6 56.2 19.6 77.6 0.5 147 26/03/2008 19.3 19 1 0 0.9 1.9 0.4 0.5 63.1 17.1 81.1 0.5 160 17/04/2008 17.8 20.5 1.2 0.8 1.3 3.3 1.1 1 51.9 14.2 68.2 0.8 189 7/05/2008 15.7 16 0.7 2.3 1.5 4.5 1.3 0.3 60.4 21.1 83.1 0.6 189 22/05/2008 14.7 17 0.2 1.8 1.5 3.5 0.4 0.4 71.2 23.6 95.6 0.7 191 5/06/2008 13.6 15 1.3 0.7 1.6 3.6 1 2.1 29.9 17.5 50.5 1 177 19/06/2008 12.9 16.5 0.5 1.5 1.6 3.6 2 0.7 34.3 29.2 66.2 1.2 259 1/07/2008 12.0 14 0.9 2.1 2.15 5.15 0.6 0.7 50.7 34.6 86.6 1.7 15/07/2008 11.4 13 1.3 1.7 2.7 5.7 0.0 0.9 38.1 26.5 65.5 1.9 7/08/2008 11.1 12.5 3.0 20/08/2008 10.7 12.5 1.5 4/09/2008 11.0 13 1.1 16/09/2008 11.3 14.5 0.7 14/10/2008 12.6 12.2 0.6 4/11/2008 13.4 12 0.8 26/11/2008 15.7 10 0.9 22/12/2008 18.8 12 0.5 13/01/2009 19.7 13 28/01/2009 20.9 18 11/02/2009 21.4 22 25/02/2009 20.5 20 26/03/2009 18.0 18.5
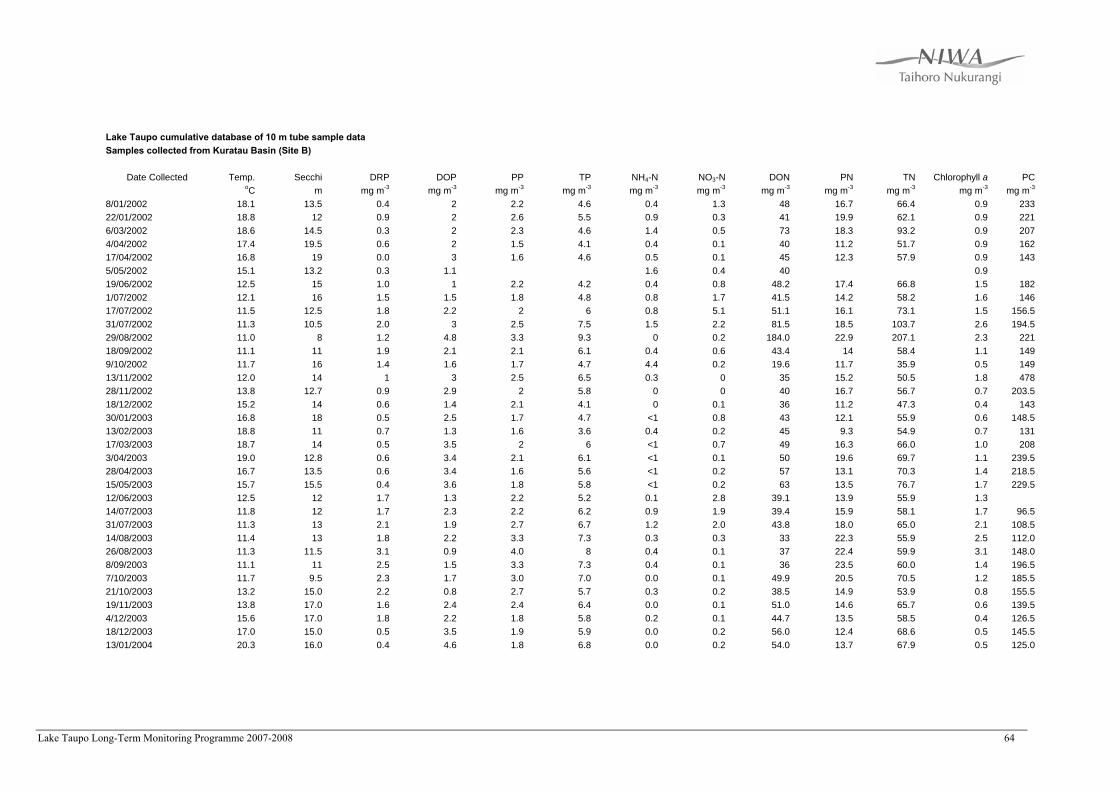
Lake Taupo Long-Term Monitoring Programme 2007-2008 64
Lake Taupo cumulative database of 10 m tube sample data Samples collected from Kuratau Basin (Site B)
Date Collected Temp. Secchi DRP DOP PP TP NH4-N NO3-N DON PN TN Chlorophyll a PC
oC m mg m-3 mg m-3 mg m-3 mg m-3 mg m-3 mg m-3 mg m-3 mg m-3 mg m-3 mg m-3 mg m-3
8/01/2002 18.1 13.5 0.4 2 2.2 4.6 0.4 1.3 48 16.7 66.4 0.9 233 22/01/2002 18.8 12 0.9 2 2.6 5.5 0.9 0.3 41 19.9 62.1 0.9 221 6/03/2002 18.6 14.5 0.3 2 2.3 4.6 1.4 0.5 73 18.3 93.2 0.9 207 4/04/2002 17.4 19.5 0.6 2 1.5 4.1 0.4 0.1 40 11.2 51.7 0.9 162 17/04/2002 16.8 19 0.0 3 1.6 4.6 0.5 0.1 45 12.3 57.9 0.9 143 5/05/2002 15.1 13.2 0.3 1.1 1.6 0.4 40 0.9 19/06/2002 12.5 15 1.0 1 2.2 4.2 0.4 0.8 48.2 17.4 66.8 1.5 182 1/07/2002 12.1 16 1.5 1.5 1.8 4.8 0.8 1.7 41.5 14.2 58.2 1.6 146 17/07/2002 11.5 12.5 1.8 2.2 2 6 0.8 5.1 51.1 16.1 73.1 1.5 156.5 31/07/2002 11.3 10.5 2.0 3 2.5 7.5 1.5 2.2 81.5 18.5 103.7 2.6 194.5 29/08/2002 11.0 8 1.2 4.8 3.3 9.3 0 0.2 184.0 22.9 207.1 2.3 221 18/09/2002 11.1 11 1.9 2.1 2.1 6.1 0.4 0.6 43.4 14 58.4 1.1 149 9/10/2002 11.7 16 1.4 1.6 1.7 4.7 4.4 0.2 19.6 11.7 35.9 0.5 149 13/11/2002 12.0 14 1 3 2.5 6.5 0.3 0 35 15.2 50.5 1.8 478 28/11/2002 13.8 12.7 0.9 2.9 2 5.8 0 0 40 16.7 56.7 0.7 203.5 18/12/2002 15.2 14 0.6 1.4 2.1 4.1 0 0.1 36 11.2 47.3 0.4 143 30/01/2003 16.8 18 0.5 2.5 1.7 4.7 <1 0.8 43 12.1 55.9 0.6 148.5 13/02/2003 18.8 11 0.7 1.3 1.6 3.6 0.4 0.2 45 9.3 54.9 0.7 131 17/03/2003 18.7 14 0.5 3.5 2 6 <1 0.7 49 16.3 66.0 1.0 208 3/04/2003 19.0 12.8 0.6 3.4 2.1 6.1 <1 0.1 50 19.6 69.7 1.1 239.5 28/04/2003 16.7 13.5 0.6 3.4 1.6 5.6 <1 0.2 57 13.1 70.3 1.4 218.5 15/05/2003 15.7 15.5 0.4 3.6 1.8 5.8 <1 0.2 63 13.5 76.7 1.7 229.5 12/06/2003 12.5 12 1.7 1.3 2.2 5.2 0.1 2.8 39.1 13.9 55.9 1.3 14/07/2003 11.8 12 1.7 2.3 2.2 6.2 0.9 1.9 39.4 15.9 58.1 1.7 96.5 31/07/2003 11.3 13 2.1 1.9 2.7 6.7 1.2 2.0 43.8 18.0 65.0 2.1 108.5 14/08/2003 11.4 13 1.8 2.2 3.3 7.3 0.3 0.3 33 22.3 55.9 2.5 112.0 26/08/2003 11.3 11.5 3.1 0.9 4.0 8 0.4 0.1 37 22.4 59.9 3.1 148.0 8/09/2003 11.1 11 2.5 1.5 3.3 7.3 0.4 0.1 36 23.5 60.0 1.4 196.5 7/10/2003 11.7 9.5 2.3 1.7 3.0 7.0 0.0 0.1 49.9 20.5 70.5 1.2 185.5 21/10/2003 13.2 15.0 2.2 0.8 2.7 5.7 0.3 0.2 38.5 14.9 53.9 0.8 155.5 19/11/2003 13.8 17.0 1.6 2.4 2.4 6.4 0.0 0.1 51.0 14.6 65.7 0.6 139.5 4/12/2003 15.6 17.0 1.8 2.2 1.8 5.8 0.2 0.1 44.7 13.5 58.5 0.4 126.5 18/12/2003 17.0 15.0 0.5 3.5 1.9 5.9 0.0 0.2 56.0 12.4 68.6 0.5 145.5 13/01/2004 20.3 16.0 0.4 4.6 1.8 6.8 0.0 0.2 54.0 13.7 67.9 0.5 125.0

Lake Taupo Long-Term Monitoring Programme 2007-2008 65
Date Collected Temp. Secchi DRP DOP PP TP NH4-N NO3-N DON PN TN Chlorophyll a PC ºC (m) (mg m-3) (mg m-3) (mg m-3) (mg m-3) (mg m-3) (mg m-3) (mg m-3) (mg m-3) (mg m-3) (mg m-3) (mg m-3)
26/02/2004 16.8 13.5 1.1 1.9 1.8 4.8 0.6 0.1 42.3 15.8 58.8 0.8 157.0 8/03/2004 17.6 5.0 0.8 2.2 3.1 6.1 1.0 0.3 41.7 17.5 60.5 0.9 172.0 31/03/2004 15.9 11.0 0.8 3.2 1.8 5.8 0.7 0.2 45.1 9.9 55.9 1.4 124.5 14/04/2004 15.0 14.0 0.9 4.1 2.2 7.2 0.6 0.3 52.1 14.9 67.9 1.3 171.5 10/05/2004 14.7 15.5 0.8 2.2 1.7 4.7 0.0 0.2 59.8 15.9 75.9 1.3 179.0 10/06/2004 12.9 12.0 1.4 2.6 2.1 6.1 0.0 0.2 108.8 18.6 127.6 1.2 183.0 13/07/2004 11.4 11.0 2.1 2.9 2.5 7.5 0.0 8.4 40.6 19.3 68.3 1.4 154.0 26/07/2004 11.2 10.0 1.3 2.7 3.2 7.2 0.2 5.8 38.0 25.0 69.0 2.7 204.0 24/08/2004 10.9 10.0 0.7 3.3 3.1 7.1 0.0 0.0 47.0 20.9 67.9 2.5 158.0 7/09/2004 10.8 11.0 0.7 2.3 2.6 5.6 0.0 0.2 44.8 17.1 62.1 1.5 172.5 21/10/2004 11.7 11.0 1.2 1.8 2.1 5.1 0.2 0.0 30.8 16.1 47.1 0.8 172.5 2/11/2004 13.1 15.0 1.0 2.0 1.7 4.7 0.2 0.1 42.7 11.0 54.0 0.5 152.0 22/11/2004 14.9 15.0 0.6 3.4 1.6 5.6 0.6 0.0 33.4 9.5 43.5 0.5 141.5 15/12/2004 13.2 17.2 0.6 3.4 1.6 5.6 0.4 0.1 39.5 12.6 52.6 0.2 120.0

Lake Taupo Long-Term Monitoring Programme 2007-2008 66
Lake Taupo cumulative database of 10 m tube sample data
Samples collected from Western Bays (site C)
Date Collected Temp. Secchi DRP DOP PP TP NH4-N NO3-N DON PN TN Chlorophyll a PC oC m mg m-3 mg m-3 mg m-3 mg m-3 mg m-3 mg m-3 mg m-3 mg m-3 mg m-3 mg m-3 mg m-3
8/01/2002 18.72 14.5 0.9 4 2.3 7.2 0.9 0.6 88 16.1 105.6 0.8 213
22/01/2002 18.82 15.5 0.7 2 2.2 4.9 0.7 0.0 37 16.8 54.5 0.8 221
6/03/2002 18.68 16 0.2 2 2 4.2 0 0.1 45 16 61.1 0.7 177
4/04/2002 17.47 19 0.6 2 1.4 4 0.0 0.0 38 8.8 46.8 0.9 152
17/04/2002 16.88 18.5 0 3 1.6 4.6 0.7 0.2 44 11.8 56.7 0.9 167
5/05/2002 15.6 15.6 0.4 1 2 0.2 45 1.1
19/06/2002 12.58 16 0.9 2.1 2 5 0.3 1.2 38.8 15.9 56.2 0.9 161
1/07/2002 12.22 14 1.3 1.7 1.9 4.9 0.3 0.4 45 15 60.7 1.4 148
17/07/2002 11.52 12.5 1.9 2.1 2 6 0.9 4.9 46.1 16.3 68.2 1.5 160
31/07/2002 11.6 12 2.3 2.7 2.3 7.3 1.7 4.0 113.3 16.7 135.7 2.3 150
29/08/2002 11.4 8 1 3 3.2 7.2 0 0 177 22.3 199.3 2.4 217
18/09/2002 11.24 12 2.8 2.2 2 7 1.7 0.4 45.3 11.7 59.1 0.9 152
9/10/2002 12.10 19 1.5 1.5 1.7 4.7 0.3 0.2 28 10.2 38.7 0.4 116
13/11/2002 12.60 16 1.1 2.9 2 6 0.1 0 51 12.2 63.3 0.6 141
28/11/2002 13.90 15.5 0.9 2.1 2 5 0.4 0.4 40 14.4 55.2 0.8 125.5
18/12/2002 15.10 13.5 0.8 2.2 1.9 4.9 0 0.3 45 10.2 55.5 0.5 136.5
30/01/2003 17.60 18.5 0.5 2.5 1.5 4.5 <1 0.1 46 8.6 54.7 0.4 141.5
13/02/2003 19.50 19 0.6 1.4 1.6 3.6 0 0.1 42 8.4 50.5 0.5 104
17/03/2003 18.70 15 0.5 2.5 1.7 4.7 <1 0.4 46 14.6 61.0 1.1 215
3/04/2003 18.80 14.5 0.5 2.5 1.6 4.6 <1 0.4 49 16.5 65.9 1.2 204
28/04/2003 17.00 14.5 0.4 2.6 1.4 4.4 <1 0.4 54 12.2 66.6 1.5 191
15/05/2003 15.60 17 0.1 3.9 2.2 6.2 <1 0.1 56 18 74.1 1.3 197
12/06/2003 13.70 11 1.3 1.7 2 5 0.1 0.9 40 13.8 54.8 1.3
14/07/2003 11.80 14 1.9 2.1 2 6 1 4.7 39.3 14.9 59.9 1.5 85.0
31/07/2003 11.40 12 3.1 5.9 2.8 11 0.1 4.0 55 20.3 79.4 2.3 101.5
14/08/2003 11.50 14.5 2.4 2.6 2.9 7.9 1.1 3.8 46.1 19.5 70.5 2.8 92.5
26/08/2003 11.30 13 2.8 2.2 3.8 8.8 0.5 0.2 39 25.0 64.7 3.2 174.5
8/09/2003 11.30 12 2.6 0.4 3 6 0.1 0.1 40 19.5 59.7 1.3 233.0
7/10/2003 11.7 12.5 2.7 1.3 2.8 6.8 0.0 0.3 44.7 18.4 63.4 1.5 157.5

Lake Taupo Long-Term Monitoring Programme 2007-2008 67
Date Collected Temp. Secchi DRP DOP PP TP NH4-N NO3-N DON PN TN Chlorophyll a PC
ºC (m) (mg m-3) (mg m-3) (mg m-3) (mg m-3) (mg m-3) (mg m-3) (mg m-3) (mg m-3) (mg m-3) (mg m-3) (mg m-3)
21/10/2003 13.0 12.0 1.5 1.5 3.1 6.1 0.3 0.0 44.7 17.4 62.4 1.1 195.0
19/11/2003 14.3 17.2 1.5 1.5 2.3 5.3 0.8 0.0 38.2 14.4 53.4 0.7 123.0
4/12/2003 15.5 17.0 1.7 3.3 1.7 6.7 0.0 0.2 46.8 11.2 58.2 0.5 129.0
18/12/2003 17.0 19.0 0.5 4.5 1.5 6.5 0.0 0.0 47.0 9.9 56.9 0.4 124.5
13/01/2004 20.2 17.5 0.7 4.3 1.6 6.6 0.0 0.1 53.0 11.9 65.0 0.4 118.5
26/02/2004 16.9 14.0 0.9 2.1 2.2 5.2 0.8 0.4 40.8 17.2 59.2 0.7 156.0
8/03/2004 18.4 13.0 0.8 2.2 2.0 5.0 0.7 0.1 34.2 11.1 46.1 0.6 124.0
31/03/2004 16.4 12.5 0.6 3.4 2.0 6.0 0.7 0.3 51.0 12.3 64.3 1.2 175.5
14/04/2004 15.4 16.5 0.9 3.1 2.3 6.3 0.6 0.3 50.1 14.2 65.2 1.2 159.0
10/05/2004 14.9 16.0 0.8 3.2 1.6 5.6 0.0 0.2 48.8 15.4 64.4 1.1 153.0
10/06/2004 13.1 14.0 0.8 2.2 2.0 5.0 0.0 0.2 41.8 16.6 58.6 1.0 151.0
13/07/2004 11.6 12.5 1.3 2.7 2.5 6.5 0.0 5.9 39.1 19.9 64.9 1.6 156.5
26/07/2004 11.5 11.0 1.5 2.5 2.9 6.9 0.3 2.7 46.0 22.2 71.2 2.4 180.5
24/08/2004 10.9 10.0 1.0 3.0 2.9 6.9 0.0 0.4 37.6 18.5 56.5 2.5 161.0
7/09/2004 11.1 12.0 1.2 3.8 2.6 7.6 0.0 0.0 54.0 16.8 70.8 1.5 202.0
21/10/2004 11.7 12.0 1.1 1.9 1.9 4.9 0.2 0.0 35.8 14.8 50.8 0.6 167.5
2/11/2004 12.4 17.0 1.0 3.0 1.7 5.7 0.3 1.2 45.5 16.3 63.3 0.4 173.0
22/11/2004 14.8 16.0 0.5 3.5 1.7 5.7 0.0 0.2 37.8 10.8 48.8 0.5 149.0
15/12/2004 14.2 20.8 0.9 4.1 1.4 6.4 0.0 0.0 42.0 12.2 54.2 0.2 131.0
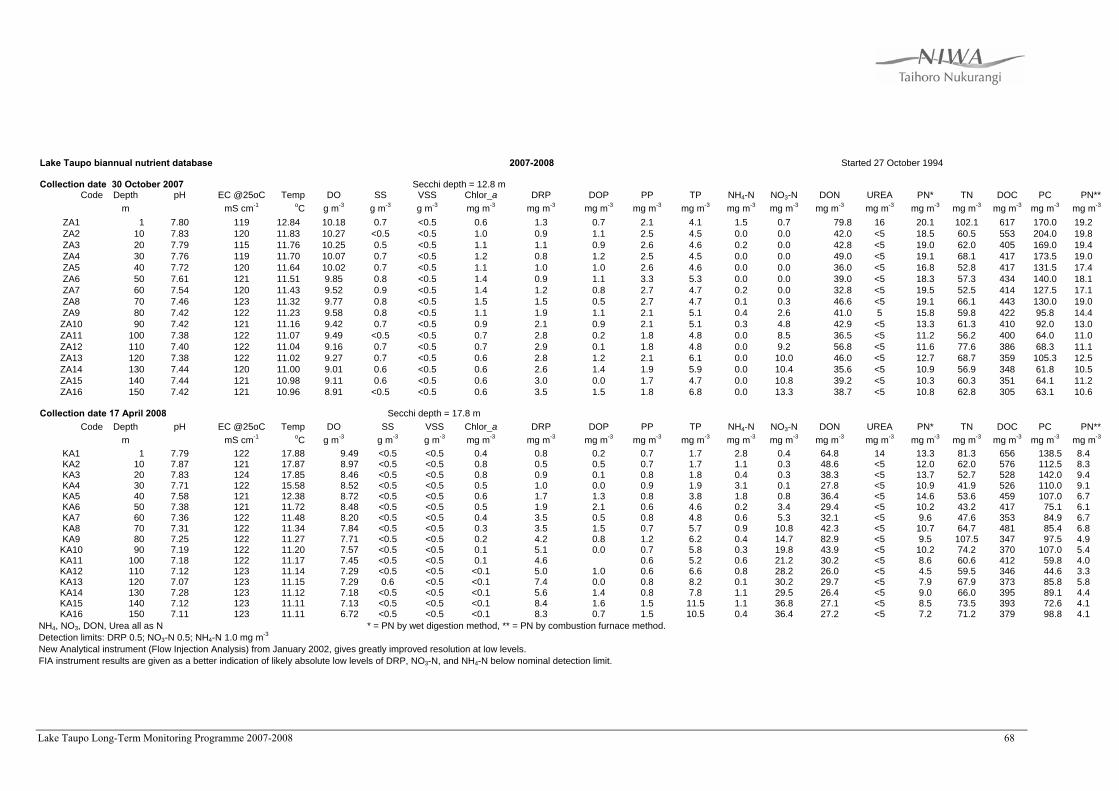
Lake Taupo Long-Term Monitoring Programme 2007-2008 68
Lake Taupo biannual nutrient database 2007-2008 Started 27 October 1994
Collection date 30 October 2007 Secchi depth = 12.8 m Code Depth pH EC @25oC Temp DO SS VSS Chlor_a DRP DOP PP TP NH4-N NO3-N DON UREA PN* TN DOC PC PN**
m mS cm-1 oC g m-3 g m-3 g m-3 mg m-3 mg m-3 mg m-3 mg m-3 mg m-3 mg m-3 mg m-3 mg m-3 mg m-3 mg m-3 mg m-3 mg m-3 mg m-3 mg m-3 ZA1 1 7.80 119 12.84 10.18 0.7 <0.5 0.6 1.3 0.7 2.1 4.1 1.5 0.7 79.8 16 20.1 102.1 617 170.0 19.2 ZA2 10 7.83 120 11.83 10.27 <0.5 <0.5 1.0 0.9 1.1 2.5 4.5 0.0 0.0 42.0 <5 18.5 60.5 553 204.0 19.8 ZA3 20 7.79 115 11.76 10.25 0.5 <0.5 1.1 1.1 0.9 2.6 4.6 0.2 0.0 42.8 <5 19.0 62.0 405 169.0 19.4 ZA4 30 7.76 119 11.70 10.07 0.7 <0.5 1.2 0.8 1.2 2.5 4.5 0.0 0.0 49.0 <5 19.1 68.1 417 173.5 19.0 ZA5 40 7.72 120 11.64 10.02 0.7 <0.5 1.1 1.0 1.0 2.6 4.6 0.0 0.0 36.0 <5 16.8 52.8 417 131.5 17.4 ZA6 50 7.61 121 11.51 9.85 0.8 <0.5 1.4 0.9 1.1 3.3 5.3 0.0 0.0 39.0 <5 18.3 57.3 434 140.0 18.1 ZA7 60 7.54 120 11.43 9.52 0.9 <0.5 1.4 1.2 0.8 2.7 4.7 0.2 0.0 32.8 <5 19.5 52.5 414 127.5 17.1 ZA8 70 7.46 123 11.32 9.77 0.8 <0.5 1.5 1.5 0.5 2.7 4.7 0.1 0.3 46.6 <5 19.1 66.1 443 130.0 19.0 ZA9 80 7.42 122 11.23 9.58 0.8 <0.5 1.1 1.9 1.1 2.1 5.1 0.4 2.6 41.0 5 15.8 59.8 422 95.8 14.4
ZA10 90 7.42 121 11.16 9.42 0.7 <0.5 0.9 2.1 0.9 2.1 5.1 0.3 4.8 42.9 <5 13.3 61.3 410 92.0 13.0 ZA11 100 7.38 122 11.07 9.49 <0.5 <0.5 0.7 2.8 0.2 1.8 4.8 0.0 8.5 36.5 <5 11.2 56.2 400 64.0 11.0 ZA12 110 7.40 122 11.04 9.16 0.7 <0.5 0.7 2.9 0.1 1.8 4.8 0.0 9.2 56.8 <5 11.6 77.6 386 68.3 11.1 ZA13 120 7.38 122 11.02 9.27 0.7 <0.5 0.6 2.8 1.2 2.1 6.1 0.0 10.0 46.0 <5 12.7 68.7 359 105.3 12.5 ZA14 130 7.44 120 11.00 9.01 0.6 <0.5 0.6 2.6 1.4 1.9 5.9 0.0 10.4 35.6 <5 10.9 56.9 348 61.8 10.5 ZA15 140 7.44 121 10.98 9.11 0.6 <0.5 0.6 3.0 0.0 1.7 4.7 0.0 10.8 39.2 <5 10.3 60.3 351 64.1 11.2 ZA16 150 7.42 121 10.96 8.91 <0.5 <0.5 0.6 3.5 1.5 1.8 6.8 0.0 13.3 38.7 <5 10.8 62.8 305 63.1 10.6
Collection date 17 April 2008 Secchi depth = 17.8 m
Code Depth pH EC @25oC Temp DO SS VSS Chlor_a DRP DOP PP TP NH4-N NO3-N DON UREA PN* TN DOC PC PN** m mS cm-1 oC g m-3 g m-3 g m-3 mg m-3 mg m-3 mg m-3 mg m-3 mg m-3 mg m-3 mg m-3 mg m-3 mg m-3 mg m-3 mg m-3 mg m-3 mg m-3 mg m-3
KA1 1 7.79 122 17.88 9.49 <0.5 <0.5 0.4 0.8 0.2 0.7 1.7 2.8 0.4 64.8 14 13.3 81.3 656 138.5 8.4 KA2 10 7.87 121 17.87 8.97 <0.5 <0.5 0.8 0.5 0.5 0.7 1.7 1.1 0.3 48.6 <5 12.0 62.0 576 112.5 8.3 KA3 20 7.83 124 17.85 8.46 <0.5 <0.5 0.8 0.9 0.1 0.8 1.8 0.4 0.3 38.3 <5 13.7 52.7 528 142.0 9.4 KA4 30 7.71 122 15.58 8.52 <0.5 <0.5 0.5 1.0 0.0 0.9 1.9 3.1 0.1 27.8 <5 10.9 41.9 526 110.0 9.1 KA5 40 7.58 121 12.38 8.72 <0.5 <0.5 0.6 1.7 1.3 0.8 3.8 1.8 0.8 36.4 <5 14.6 53.6 459 107.0 6.7 KA6 50 7.38 121 11.72 8.48 <0.5 <0.5 0.5 1.9 2.1 0.6 4.6 0.2 3.4 29.4 <5 10.2 43.2 417 75.1 6.1 KA7 60 7.36 122 11.48 8.20 <0.5 <0.5 0.4 3.5 0.5 0.8 4.8 0.6 5.3 32.1 <5 9.6 47.6 353 84.9 6.7 KA8 70 7.31 122 11.34 7.84 <0.5 <0.5 0.3 3.5 1.5 0.7 5.7 0.9 10.8 42.3 <5 10.7 64.7 481 85.4 6.8 KA9 80 7.25 122 11.27 7.71 <0.5 <0.5 0.2 4.2 0.8 1.2 6.2 0.4 14.7 82.9 <5 9.5 107.5 347 97.5 4.9 KA10 90 7.19 122 11.20 7.57 <0.5 <0.5 0.1 5.1 0.0 0.7 5.8 0.3 19.8 43.9 <5 10.2 74.2 370 107.0 5.4 KA11 100 7.18 122 11.17 7.45 <0.5 <0.5 0.1 4.6 0.6 5.2 0.6 21.2 30.2 <5 8.6 60.6 412 59.8 4.0 KA12 110 7.12 123 11.14 7.29 <0.5 <0.5 <0.1 5.0 1.0 0.6 6.6 0.8 28.2 26.0 <5 4.5 59.5 346 44.6 3.3 KA13 120 7.07 123 11.15 7.29 0.6 <0.5 <0.1 7.4 0.0 0.8 8.2 0.1 30.2 29.7 <5 7.9 67.9 373 85.8 5.8 KA14 130 7.28 123 11.12 7.18 <0.5 <0.5 <0.1 5.6 1.4 0.8 7.8 1.1 29.5 26.4 <5 9.0 66.0 395 89.1 4.4 KA15 140 7.12 123 11.11 7.13 <0.5 <0.5 <0.1 8.4 1.6 1.5 11.5 1.1 36.8 27.1 <5 8.5 73.5 393 72.6 4.1 KA16 150 7.11 123 11.11 6.72 <0.5 <0.5 <0.1 8.3 0.7 1.5 10.5 0.4 36.4 27.2 <5 7.2 71.2 379 98.8 4.1
NH4, NO3, DON, Urea all as N * = PN by wet digestion method, ** = PN by combustion furnace method. Detection limits: DRP 0.5; NO3-N 0.5; NH4-N 1.0 mg m-3 New Analytical instrument (Flow Injection Analysis) from January 2002, gives greatly improved resolution at low levels. FIA instrument results are given as a better indication of likely absolute low levels of DRP, NO3-N, and NH4-N below nominal detection limit.

Lake Taupo Long-Term Monitoring Programme 2007-2008 69
Lake Taupo biannual nutrient database 2006-2007 Started 27 October 1994
Collection date 1 November 2006 Secchi depth = 14.5 m Code Depth pH EC @25oC Temp DO SS VSS Chlor_a DRP DOP PP TP NH4-N NO3-N DON UREA PN* TN DOC PC PN**
m mS cm-1 oC g m-3 g m-3 g m-3 mg m-3 mg m-3 mg m-3 mg m-3 mg m-3 mg m-3 mg m-3 mg m-3 mg m-3 mg m-3 mg m-3 mg m-3 mg m-3 mg m-3 HW1 1 7.79 118 12.43 10.2 0.5 <0.5 0.5 1.2 0.0 1.7 2.9 0.1 1.0 75.9 13.6 90.6 168.0 15.4 HW2 10 7.77 119 12.27 10.1 0.8 <0.5 0.6 1.0 0.0 1.9 2.9 0.0 0.1 61.9 13.8 75.8 187.0 13.8 HW3 20 7.77 120 12.25 10.1 0.7 <0.5 0.7 0.9 1.1 2.3 4.3 0.0 0.1 32.9 17.8 50.8 209.5 17.4 HW4 30 7.81 119 12.20 10.1 0.8 <0.5 0.6 1.0 0.0 2.7 3.7 0.3 0.0 38.7 22.3 61.3 215.5 18.1 HW5 40 7.78 119 12.10 10.1 0.9 <0.5 0.6 1.1 0.9 2.2 4.2 0.0 0.1 30.9 17.9 48.9 227.5 19.8 HW6 50 7.74 119 11.96 10.0 0.6 <0.5 0.7 1.2 0.0 1.9 3.1 0.0 0.2 29.8 14.0 44.0 169.0 13.9 HW7 60 7.67 120 11.34 9.7 0.7 <0.5 1.1 1.5 0.0 1.8 3.3 0.6 0.1 31.3 13.9 45.9 123.5 13.5 HW8 70 7.64 119 11.17 9.5 <0.5 <0.5 1.3 1.2 1.8 2.0 5.0 0.5 0.1 29.4 14.5 44.5 98.0 12.3 HW9 80 7.57 119 11.06 9.4 0.7 <0.5 1.3 1.3 0.7 2.2 4.2 2.5 1.8 27.7 14.1 46.1 91.5 11.2
HW10 90 7.56 119 10.99 9.3 <0.5 <0.5 1.3 1.2 0.8 2.2 4.2 2.7 2.3 52.0 14.4 71.4 122.5 15.3 HW11 100 7.56 119 10.94 9.3 0.5 <0.5 1.1 1.4 0.0 2.3 3.7 2.9 3.1 43.0 13.4 62.4 105.5 13.2 HW12 110 7.50 121 10.91 9.2 <0.5 <0.5 0.9 1.8 0.0 2.3 4.1 3.7 4.6 73.7 14.3 96.3 106.5 12.8 HW13 120 7.50 119 10.88 9.1 <0.5 <0.5 0.7 1.8 2.2 2.2 6.2 3.7 5.8 52.5 11.5 73.5 87.5 11.5 HW14 130 7.57 120 10.85 9.0 <0.5 <0.5 0.9 1.8 2.2 2.2 6.2 3.3 4.4 38.3 12.0 58.0 84.5 11.6 HW15 140 7.50 119 10.84 8.9 0.6 <0.5 0.8 1.4 0.6 2.3 4.3 3.0 4.5 43.5 13.4 64.4 110.5 12.9 HW16 150 7.49 120 10.84 8.7 <0.5 <0.5 0.7 2.0 3.0 2.4 7.4 4.7 7.6 52.7 12.8 77.8 98.0 10.7
Collection date 3 April 2007 Secchi depth = 19.0 m
Code Depth pH EC @25oC Temp DO SS VSS Chlor_a DRP DOP PP TP NH4-N NO3-N DON UREA PN* TN DOC PC PN** m mS cm-1 oC g m-3 g m-3 g m-3 mg m-3 mg m-3 mg m-3 mg m-3 mg m-3 mg m-3 mg m-3 mg m-3 mg m-3 mg m-3 mg m-3 mg m-3 mg m-3 mg m-3
HW17 1 7.94 119 18.04 9.4 <0.5 <0.5 0.7 1.6 2.4 1.4 5.4 4.7 0.9 62.4 14.9 82.9 122.0 18.4 HW18 10 8.09 119 18.03 9.5 <0.5 <0.5 0.8 1.1 3.9 1.8 6.8 0.0 0.1 59.9 14.9 74.9 317.5 19.2 HW19 20 8.09 119 17.94 9.4 <0.5 <0.5 0.8 1.2 2.8 1.6 5.6 0.0 0.2 65.8 14.8 80.8 177.5 16.8 HW20 30 7.95 119 16.72 9.3 <0.5 <0.5 1.2 1.0 4.0 2.0 7.0 0.0 0.1 63.9 17.5 81.5 133.0 19.6 HW21 40 7.73 119 13.50 8.9 <0.5 <0.5 1.2 1.8 2.2 1.6 5.6 0.0 0.3 55.7 12.3 68.3 76.4 12.1 HW22 50 7.62 120 12.33 8.9 <0.5 <0.5 0.8 1.5 4.5 1.3 7.3 0.1 0.8 53.2 9.0 63.1 68.1 10.1 HW23 60 7.54 119 11.65 8.8 <0.5 <0.5 0.7 1.2 3.8 1.5 6.5 0.1 3.4 51.5 7.7 62.7 49.9 6.3 HW24 70 7.48 120 11.28 8.8 <0.5 <0.5 0.9 2.0 2.0 1.3 5.3 0.0 9.7 70.2 6.4 86.3 68.3 8.6 HW25 80 7.43 115 11.22 8.5 <0.5 <0.5 0.6 2.0 3.0 1.2 6.2 0.0 14.6 52.4 6.4 73.4 58.0 8.3 HW26 90 7.39 121 11.11 8.5 <0.5 <0.5 0.3 1.7 3.3 1.0 6.0 0.1 16.3 54.7 7.1 78.2 62.7 8.4 HW27 100 7.35 121 11.10 8.2 <0.5 <0.5 0.3 2.5 1.5 1.1 5.1 0.0 19.4 50.5 7.0 76.9 48.9 6.7 HW28 110 7.31 121 11.04 8.2 <0.5 <0.5 0.2 2.7 2.3 0.9 5.9 1.5 20.9 47.1 5.9 75.4 40.4 7.5 HW29 120 7.32 120 11.04 8.0 <0.5 <0.5 0.2 3.0 2.0 0.9 5.9 0.0 23.8 57.7 4.9 86.4 48.5 7.8 HW30 130 7.73 121 11.01 8.1 <0.5 <0.5 0.2 2.7 3.3 0.9 6.9 0.0 24.8 51.2 3.8 79.8 42.7 6.7 HW31 140 7.30 118 11.00 7.7 <0.5 <0.5 0.2 3.7 2.3 1.3 7.3 0.0 24.6 47.4 3.8 75.8 43.2 6.4 HW32 150 7.25 121 10.99 7.4 <0.5 <0.5 0.2 4.5 3.5 1.6 9.6 0.0 30.5 50.5 6.1 87.1 51.7 9.5
NH4, NO3, DON, Urea all as N * = PN by wet digestion method, ** = PN by combustion furnace method. Detection limits: DRP 0.5; NO3-N 0.5; NH4-N 1.0 mg m-3 New Analytical instrument (Flow Injection Analysis) from January 2002, gives greatly improved resolution at low levels. FIA instrument results are given as a better indication of likely absolute low levels of DRP, NO3-N, and NH4-N below nominal detection limit.

Lake Taupo Long-Term Monitoring Programme 2007-2008 70
Lake Taupo biannual nutrient database 2005-2006 Started 27 October 1994
Collection date 25 October 2005 Secchi depth = 15.0 m Code Depth pH EC @25oC Temp DO SS VSS Chlor_a DRP DOP PP TP NH4-N NO3-N DON UREA PN* TN DOC PC PN**
m mS cm-1 oC g m-3 g m-3 g m-3 mg m-3 mg m-3 mg m-3 mg m-3 mg m-3 mg m-3 mg m-3 mg m-3 mg m-3 mg m-3 mg m-3 mg m-3 mg m-3 mg m-3 QD1 1 7.81 119 13.40 10.1 <0.5 <0.5 0.4 1.0 3.0 1.3 5.3 0.6 0.3 51.1 4 8.5 60.5 613 132.5 11.0 QD2 10 7.88 119 12.88 10.0 0.5 <0.5 0.5 0.7 2.3 1.9 4.9 0.1 0.0 52.9 3 12.8 65.8 623 169.0 13.5 QD3 20 7.74 119 12.17 10.1 0.6 <0.5 0.7 0.6 2.4 2.7 5.7 0.4 0.2 43.4 2 17.0 61.0 625 216.5 20.0 QD4 30 7.77 118 11.65 9.9 0.7 <0.5 0.6 0.6 5.4 2.6 8.6 0.7 0.0 57.3 2 17.3 75.3 566 212.0 16.0 QD5 40 7.68 119 11.49 9.8 <0.5 <0.5 0.9 0.6 3.4 3.1 7.1 0.0 0.2 49.8 2 22.2 72.2 581 229.5 20.5 QD6 50 7.59 119 11.29 9.5 <0.5 <0.5 1.4 0.8 1.2 2.2 4.2 1.4 0.1 35.5 2 15.9 52.9 599 172.5 14.0 QD7 60 7.46 120 11.18 9.2 0.7 <0.5 0.7 1.7 2.3 1.6 5.6 1.7 9.6 41.7 2 9.8 62.8 503 103.5 6.5 QD8 70 7.37 120 11.07 9.0 0.5 <0.5 0.8 1.9 2.1 1.5 5.5 1.6 12.8 56.6 2 9.2 80.2 482 101.5 6.0 QD9 80 7.35 120 11.01 8.8 0.6 <0.5 0.6 2.5 1.5 1.4 5.4 0.6 15.3 30.1 13 9.0 55.0 521 86.5 6.0 QD10 90 7.36 121 10.97 8.8 0.7 <0.5 0.4 2.8 1.2 1.4 5.4 0.3 17.1 47.6 2 7.3 72.3 478 62.5 4.0 QD11 100 7.29 121 10.97 8.6 <0.5 <0.5 0.5 2.8 1.2 1.4 5.4 0.4 17.4 39.2 2 7.8 64.8 476 77.5 4.5 QD12 110 7.34 120 10.94 8.5 <0.5 <0.5 0.5 3.0 1.0 1.3 5.3 1.5 18.7 48.8 2 7.4 76.4 462 92.5 3.0 QD13 120 7.29 121 10.94 8.5 <0.5 <0.5 0.5 2.8 2.2 1.2 6.2 0.8 20.4 42.8 2 6.2 70.2 549 5.0 QD14 130 7.32 120 10.93 8.4 <0.5 <0.5 0.5 2.7 1.3 1.3 5.3 0.1 20.3 35.6 3 5.9 61.9 504 69.5 6.0 QD15 140 7.34 121 10.93 8.4 <0.5 <0.5 0.6 3.0 2.0 1.4 6.4 1.4 20.9 34.7 1 7.8 64.8 352 77.5 6.5 QD16 150 7.26 120 10.92 8.2 <0.5 <0.5 0.5 3.8 1.2 1.5 6.5 0.9 23.5 29.6 3 7.1 61.1 533 66.0 6.0 Collection date 12 April 2006 Secchi depth = 15.8 m
Code Depth pH EC @25oC Temp DO SS VSS Chlor_a DRP DOP PP TP NH4-N NO3-N DON UREA PN* TN DOC PC PN** m mS cm-1 oC g m-3 g m-3 g m-3 mg m-3 mg m-3 mg m-3 mg m-3 mg m-3 mg m-3 mg m-3 mg m-3 mg m-3 mg m-3 mg m-3 mg m-3 mg m-3 mg m-3
ZD1 1 7.9 119 16.72 9.6 <0.5 <0.5 1.2 1.1 0.9 1.9 3.9 0.0 0.2 50.8 2 19.2 70.2 213.5 19.0 ZD2 10 7.9 118 16.72 9.2 <0.5 <0.5 1.3 0.8 1.2 1.6 3.6 0.0 0.0 38.0 2 16.6 54.6 196.0 13.5 ZD3 20 7.9 116 16.72 9.0 0.5 <0.5 1.1 0.7 0.3 1.3 2.3 0.0 0.0 42.0 <1 15.65 57.7 235.0 15.5 ZD4 30 7.88 120 16.71 9.4 <0.5 <0.5 1.2 0.6 1.4 1.6 3.6 0.1 0.0 50.9 <1 15.45 66.5 172.0 13.5 ZD5 40 7.9 116 16.64 9.2 0.8 0.7 1.3 0.5 1.5 1.55 3.6 0.0 0.0 41.0 2 15.45 56.5 224.5 13.0 ZD6 50 7.6 119 12.11 8.7 <0.5 <0.5 1.0 0.7 2.3 1.2 4.2 0.0 0.1 33.9 8 11.4 45.4 133.0 8.5 ZD7 60 7.43 121 11.52 8.5 <0.5 <0.5 1.0 0.7 2.3 1.05 4.1 0.0 0.5 44.5 2 9.15 54.2 171.5 8.0 ZD8 70 7.49 121 11.31 8.3 <0.5 <0.5 0.9 0.7 2.3 1.15 4.2 0.0 0.7 37.3 6 9.55 47.6 130.5 9.0 ZD9 80 7.9 120 11.18 8.3 <0.5 <0.5 1.1 0.5 2.5 1.4 4.4 0.3 0.0 50.7 5 16.1 67.1 182.0 12.5 ZD10 90 7.31 122 11.11 8.1 <0.5 <0.5 0.2 3.0 1 0.45 4.5 0.0 23.0 28.0 2 4.1 55.1 62.5 6.0 ZD11 100 7.31 122 11.08 8.1 <0.5 <0.5 0.3 3.2 0.8 0.5 4.5 0.1 22.8 24.1 <1 4.95 52.0 68.5 6.5 ZD12 110 7.91 119 11.05 8.0 0.7 0.5 1.1 3.2 1.8 1.5 6.5 0.1 22.2 25.7 3 16.5 64.5 196.0 15.0 ZD13 120 7.42 122 11.03 7.9 <0.5 <0.5 0.3 3.1 1.9 0.5 5.5 0.0 21.6 27.4 <1 5.2 54.2 86.5 7.0 ZD14 130 7.5 121 11.02 7.7 <0.5 <0.5 0.3 3.0 2 0.55 5.6 0.0 19.9 32.1 2 5.45 57.5 69.5 6.5 ZD15 140 7.3 119 11.02 7.3 <0.5 <0.5 0.2 3.4 1.6 0.55 5.6 0.0 23.1 31.9 2 6.5 61.5 87.0 7.5 ZD16 150 7.24 122 11.02 7.2 <0.5 <0.5 0.3 2.9 1.1 0.55 4.6 0.2 21.0 28.8 5 5.85 55.9 77.5 7.0 NH4, NO3, DON, Urea all as N * = PN by wet digestion method, ** = PN by combustion furnace method. Detection limits: DRP 0.5; NO3-N 0.5; NH4-N 1.0 mg m-3 New Analytical instrument (Flow Injection Analysis) from January 2002, gives greatly improved resolution at low levels. FIA instrument results are given as a better indication of likely absolute low levels of DRP, NO3-N, and NH4-N below nominal detection limit.
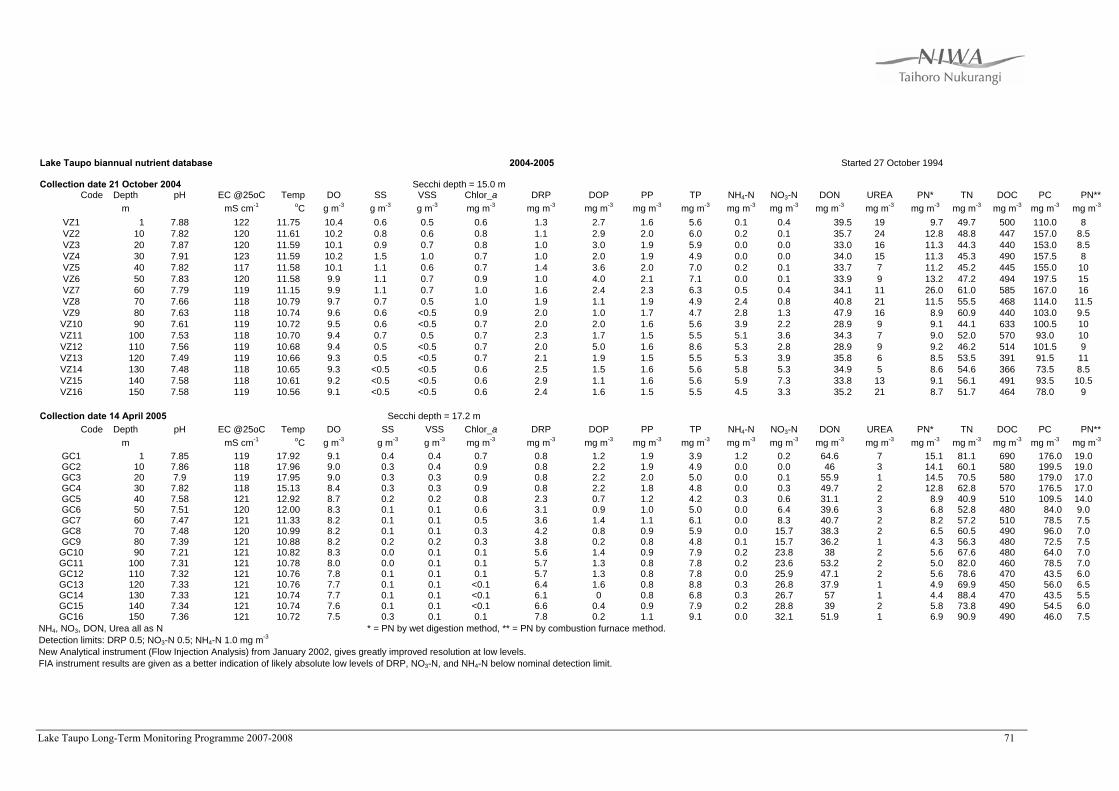
Lake Taupo Long-Term Monitoring Programme 2007-2008 71
Lake Taupo biannual nutrient database 2004-2005 Started 27 October 1994
Collection date 21 October 2004 Secchi depth = 15.0 m Code Depth pH EC @25oC Temp DO SS VSS Chlor_a DRP DOP PP TP NH4-N NO3-N DON UREA PN* TN DOC PC PN**
m mS cm-1 oC g m-3 g m-3 g m-3 mg m-3 mg m-3 mg m-3 mg m-3 mg m-3 mg m-3 mg m-3 mg m-3 mg m-3 mg m-3 mg m-3 mg m-3 mg m-3 mg m-3 VZ1 1 7.88 122 11.75 10.4 0.6 0.5 0.6 1.3 2.7 1.6 5.6 0.1 0.4 39.5 19 9.7 49.7 500 110.0 8 VZ2 10 7.82 120 11.61 10.2 0.8 0.6 0.8 1.1 2.9 2.0 6.0 0.2 0.1 35.7 24 12.8 48.8 447 157.0 8.5 VZ3 20 7.87 120 11.59 10.1 0.9 0.7 0.8 1.0 3.0 1.9 5.9 0.0 0.0 33.0 16 11.3 44.3 440 153.0 8.5 VZ4 30 7.91 123 11.59 10.2 1.5 1.0 0.7 1.0 2.0 1.9 4.9 0.0 0.0 34.0 15 11.3 45.3 490 157.5 8 VZ5 40 7.82 117 11.58 10.1 1.1 0.6 0.7 1.4 3.6 2.0 7.0 0.2 0.1 33.7 7 11.2 45.2 445 155.0 10 VZ6 50 7.83 120 11.58 9.9 1.1 0.7 0.9 1.0 4.0 2.1 7.1 0.0 0.1 33.9 9 13.2 47.2 494 197.5 15 VZ7 60 7.79 119 11.15 9.9 1.1 0.7 1.0 1.6 2.4 2.3 6.3 0.5 0.4 34.1 11 26.0 61.0 585 167.0 16 VZ8 70 7.66 118 10.79 9.7 0.7 0.5 1.0 1.9 1.1 1.9 4.9 2.4 0.8 40.8 21 11.5 55.5 468 114.0 11.5 VZ9 80 7.63 118 10.74 9.6 0.6 <0.5 0.9 2.0 1.0 1.7 4.7 2.8 1.3 47.9 16 8.9 60.9 440 103.0 9.5
VZ10 90 7.61 119 10.72 9.5 0.6 <0.5 0.7 2.0 2.0 1.6 5.6 3.9 2.2 28.9 9 9.1 44.1 633 100.5 10 VZ11 100 7.53 118 10.70 9.4 0.7 0.5 0.7 2.3 1.7 1.5 5.5 5.1 3.6 34.3 7 9.0 52.0 570 93.0 10 VZ12 110 7.56 119 10.68 9.4 0.5 <0.5 0.7 2.0 5.0 1.6 8.6 5.3 2.8 28.9 9 9.2 46.2 514 101.5 9 VZ13 120 7.49 119 10.66 9.3 0.5 <0.5 0.7 2.1 1.9 1.5 5.5 5.3 3.9 35.8 6 8.5 53.5 391 91.5 11 VZ14 130 7.48 118 10.65 9.3 <0.5 <0.5 0.6 2.5 1.5 1.6 5.6 5.8 5.3 34.9 5 8.6 54.6 366 73.5 8.5 VZ15 140 7.58 118 10.61 9.2 <0.5 <0.5 0.6 2.9 1.1 1.6 5.6 5.9 7.3 33.8 13 9.1 56.1 491 93.5 10.5 VZ16 150 7.58 119 10.56 9.1 <0.5 <0.5 0.6 2.4 1.6 1.5 5.5 4.5 3.3 35.2 21 8.7 51.7 464 78.0 9
Collection date 14 April 2005 Secchi depth = 17.2 m
Code Depth pH EC @25oC Temp DO SS VSS Chlor_a DRP DOP PP TP NH4-N NO3-N DON UREA PN* TN DOC PC PN** m mS cm-1 oC g m-3 g m-3 g m-3 mg m-3 mg m-3 mg m-3 mg m-3 mg m-3 mg m-3 mg m-3 mg m-3 mg m-3 mg m-3 mg m-3 mg m-3 mg m-3 mg m-3
GC1 1 7.85 119 17.92 9.1 0.4 0.4 0.7 0.8 1.2 1.9 3.9 1.2 0.2 64.6 7 15.1 81.1 690 176.0 19.0 GC2 10 7.86 118 17.96 9.0 0.3 0.4 0.9 0.8 2.2 1.9 4.9 0.0 0.0 46 3 14.1 60.1 580 199.5 19.0 GC3 20 7.9 119 17.95 9.0 0.3 0.3 0.9 0.8 2.2 2.0 5.0 0.0 0.1 55.9 1 14.5 70.5 580 179.0 17.0 GC4 30 7.82 118 15.13 8.4 0.3 0.3 0.9 0.8 2.2 1.8 4.8 0.0 0.3 49.7 2 12.8 62.8 570 176.5 17.0 GC5 40 7.58 121 12.92 8.7 0.2 0.2 0.8 2.3 0.7 1.2 4.2 0.3 0.6 31.1 2 8.9 40.9 510 109.5 14.0 GC6 50 7.51 120 12.00 8.3 0.1 0.1 0.6 3.1 0.9 1.0 5.0 0.0 6.4 39.6 3 6.8 52.8 480 84.0 9.0 GC7 60 7.47 121 11.33 8.2 0.1 0.1 0.5 3.6 1.4 1.1 6.1 0.0 8.3 40.7 2 8.2 57.2 510 78.5 7.5 GC8 70 7.48 120 10.99 8.2 0.1 0.1 0.3 4.2 0.8 0.9 5.9 0.0 15.7 38.3 2 6.5 60.5 490 96.0 7.0 GC9 80 7.39 121 10.88 8.2 0.2 0.2 0.3 3.8 0.2 0.8 4.8 0.1 15.7 36.2 1 4.3 56.3 480 72.5 7.5
GC10 90 7.21 121 10.82 8.3 0.0 0.1 0.1 5.6 1.4 0.9 7.9 0.2 23.8 38 2 5.6 67.6 480 64.0 7.0 GC11 100 7.31 121 10.78 8.0 0.0 0.1 0.1 5.7 1.3 0.8 7.8 0.2 23.6 53.2 2 5.0 82.0 460 78.5 7.0 GC12 110 7.32 121 10.76 7.8 0.1 0.1 0.1 5.7 1.3 0.8 7.8 0.0 25.9 47.1 2 5.6 78.6 470 43.5 6.0 GC13 120 7.33 121 10.76 7.7 0.1 0.1 <0.1 6.4 1.6 0.8 8.8 0.3 26.8 37.9 1 4.9 69.9 450 56.0 6.5 GC14 130 7.33 121 10.74 7.7 0.1 0.1 <0.1 6.1 0 0.8 6.8 0.3 26.7 57 1 4.4 88.4 470 43.5 5.5 GC15 140 7.34 121 10.74 7.6 0.1 0.1 <0.1 6.6 0.4 0.9 7.9 0.2 28.8 39 2 5.8 73.8 490 54.5 6.0 GC16 150 7.36 121 10.72 7.5 0.3 0.1 0.1 7.8 0.2 1.1 9.1 0.0 32.1 51.9 1 6.9 90.9 490 46.0 7.5
NH4, NO3, DON, Urea all as N * = PN by wet digestion method, ** = PN by combustion furnace method. Detection limits: DRP 0.5; NO3-N 0.5; NH4-N 1.0 mg m-3 New Analytical instrument (Flow Injection Analysis) from January 2002, gives greatly improved resolution at low levels. FIA instrument results are given as a better indication of likely absolute low levels of DRP, NO3-N, and NH4-N below nominal detection limit.
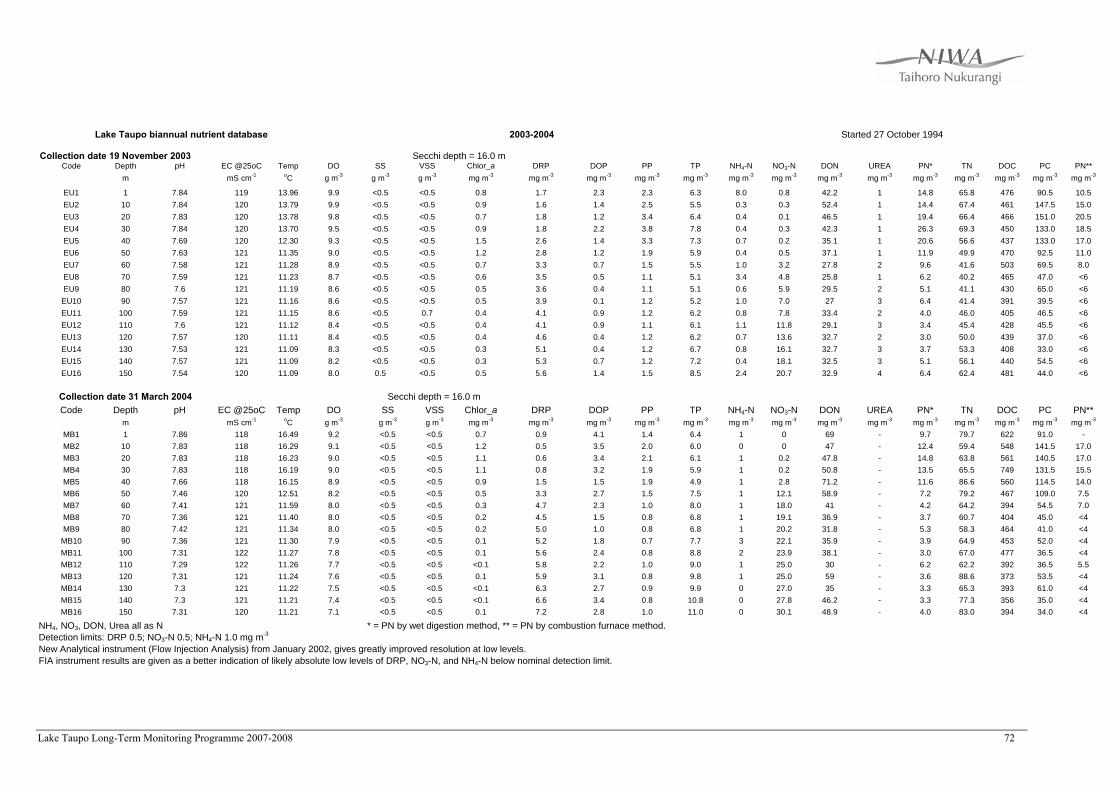
Lake Taupo Long-Term Monitoring Programme 2007-2008 72
Lake Taupo biannual nutrient database 2003-2004 Started 27 October 1994
Collection date 19 November 2003 Secchi depth = 16.0 m
Code Depth pH EC @25oC Temp DO SS VSS Chlor_a DRP DOP PP TP NH4-N NO3-N DON UREA PN* TN DOC PC PN** m mS cm-1 oC g m-3 g m-3 g m-3 mg m-3 mg m-3 mg m-3 mg m-3 mg m-3 mg m-3 mg m-3 mg m-3 mg m-3 mg m-3 mg m-3 mg m-3 mg m-3 mg m-3
EU1 1 7.84 119 13.96 9.9 <0.5 <0.5 0.8 1.7 2.3 2.3 6.3 8.0 0.8 42.2 1 14.8 65.8 476 90.5 10.5 EU2 10 7.84 120 13.79 9.9 <0.5 <0.5 0.9 1.6 1.4 2.5 5.5 0.3 0.3 52.4 1 14.4 67.4 461 147.5 15.0 EU3 20 7.83 120 13.78 9.8 <0.5 <0.5 0.7 1.8 1.2 3.4 6.4 0.4 0.1 46.5 1 19.4 66.4 466 151.0 20.5 EU4 30 7.84 120 13.70 9.5 <0.5 <0.5 0.9 1.8 2.2 3.8 7.8 0.4 0.3 42.3 1 26.3 69.3 450 133.0 18.5 EU5 40 7.69 120 12.30 9.3 <0.5 <0.5 1.5 2.6 1.4 3.3 7.3 0.7 0.2 35.1 1 20.6 56.6 437 133.0 17.0 EU6 50 7.63 121 11.35 9.0 <0.5 <0.5 1.2 2.8 1.2 1.9 5.9 0.4 0.5 37.1 1 11.9 49.9 470 92.5 11.0 EU7 60 7.58 121 11.28 8.9 <0.5 <0.5 0.7 3.3 0.7 1.5 5.5 1.0 3.2 27.8 2 9.6 41.6 503 69.5 8.0 EU8 70 7.59 121 11.23 8.7 <0.5 <0.5 0.6 3.5 0.5 1.1 5.1 3.4 4.8 25.8 1 6.2 40.2 465 47.0 <6 EU9 80 7.6 121 11.19 8.6 <0.5 <0.5 0.5 3.6 0.4 1.1 5.1 0.6 5.9 29.5 2 5.1 41.1 430 65.0 <6
EU10 90 7.57 121 11.16 8.6 <0.5 <0.5 0.5 3.9 0.1 1.2 5.2 1.0 7.0 27 3 6.4 41.4 391 39.5 <6 EU11 100 7.59 121 11.15 8.6 <0.5 0.7 0.4 4.1 0.9 1.2 6.2 0.8 7.8 33.4 2 4.0 46.0 405 46.5 <6 EU12 110 7.6 121 11.12 8.4 <0.5 <0.5 0.4 4.1 0.9 1.1 6.1 1.1 11.8 29.1 3 3.4 45.4 428 45.5 <6 EU13 120 7.57 120 11.11 8.4 <0.5 <0.5 0.4 4.6 0.4 1.2 6.2 0.7 13.6 32.7 2 3.0 50.0 439 37.0 <6 EU14 130 7.53 121 11.09 8.3 <0.5 <0.5 0.3 5.1 0.4 1.2 6.7 0.8 16.1 32.7 3 3.7 53.3 408 33.0 <6 EU15 140 7.57 121 11.09 8.2 <0.5 <0.5 0.3 5.3 0.7 1.2 7.2 0.4 18.1 32.5 3 5.1 56.1 440 54.5 <6 EU16 150 7.54 120 11.09 8.0 0.5 <0.5 0.5 5.6 1.4 1.5 8.5 2.4 20.7 32.9 4 6.4 62.4 481 44.0 <6
Collection date 31 March 2004 Secchi depth = 16.0 m Code Depth pH EC @25oC Temp DO SS VSS Chlor_a DRP DOP PP TP NH4-N NO3-N DON UREA PN* TN DOC PC PN**
m mS cm-1 oC g m-3 g m-3 g m-3 mg m-3 mg m-3 mg m-3 mg m-3 mg m-3 mg m-3 mg m-3 mg m-3 mg m-3 mg m-3 mg m-3 mg m-3 mg m-3 mg m-3 MB1 1 7.86 118 16.49 9.2 <0.5 <0.5 0.7 0.9 4.1 1.4 6.4 1 0 69 - 9.7 79.7 622 91.0 - MB2 10 7.83 118 16.29 9.1 <0.5 <0.5 1.2 0.5 3.5 2.0 6.0 0 0 47 - 12.4 59.4 548 141.5 17.0 MB3 20 7.83 118 16.23 9.0 <0.5 <0.5 1.1 0.6 3.4 2.1 6.1 1 0.2 47.8 - 14.8 63.8 561 140.5 17.0 MB4 30 7.83 118 16.19 9.0 <0.5 <0.5 1.1 0.8 3.2 1.9 5.9 1 0.2 50.8 - 13.5 65.5 749 131.5 15.5 MB5 40 7.66 118 16.15 8.9 <0.5 <0.5 0.9 1.5 1.5 1.9 4.9 1 2.8 71.2 - 11.6 86.6 560 114.5 14.0 MB6 50 7.46 120 12.51 8.2 <0.5 <0.5 0.5 3.3 2.7 1.5 7.5 1 12.1 58.9 - 7.2 79.2 467 109.0 7.5 MB7 60 7.41 121 11.59 8.0 <0.5 <0.5 0.3 4.7 2.3 1.0 8.0 1 18.0 41 - 4.2 64.2 394 54.5 7.0 MB8 70 7.36 121 11.40 8.0 <0.5 <0.5 0.2 4.5 1.5 0.8 6.8 1 19.1 36.9 - 3.7 60.7 404 45.0 <4 MB9 80 7.42 121 11.34 8.0 <0.5 <0.5 0.2 5.0 1.0 0.8 6.8 1 20.2 31.8 - 5.3 58.3 464 41.0 <4
MB10 90 7.36 121 11.30 7.9 <0.5 <0.5 0.1 5.2 1.8 0.7 7.7 3 22.1 35.9 - 3.9 64.9 453 52.0 <4 MB11 100 7.31 122 11.27 7.8 <0.5 <0.5 0.1 5.6 2.4 0.8 8.8 2 23.9 38.1 - 3.0 67.0 477 36.5 <4 MB12 110 7.29 122 11.26 7.7 <0.5 <0.5 <0.1 5.8 2.2 1.0 9.0 1 25.0 30 - 6.2 62.2 392 36.5 5.5 MB13 120 7.31 121 11.24 7.6 <0.5 <0.5 0.1 5.9 3.1 0.8 9.8 1 25.0 59 - 3.6 88.6 373 53.5 <4 MB14 130 7.3 121 11.22 7.5 <0.5 <0.5 <0.1 6.3 2.7 0.9 9.9 0 27.0 35 - 3.3 65.3 393 61.0 <4 MB15 140 7.3 121 11.21 7.4 <0.5 <0.5 <0.1 6.6 3.4 0.8 10.8 0 27.8 46.2 - 3.3 77.3 356 35.0 <4 MB16 150 7.31 120 11.21 7.1 <0.5 <0.5 0.1 7.2 2.8 1.0 11.0 0 30.1 48.9 - 4.0 83.0 394 34.0 <4
NH4, NO3, DON, Urea all as N * = PN by wet digestion method, ** = PN by combustion furnace method. Detection limits: DRP 0.5; NO3-N 0.5; NH4-N 1.0 mg m-3 New Analytical instrument (Flow Injection Analysis) from January 2002, gives greatly improved resolution at low levels. FIA instrument results are given as a better indication of likely absolute low levels of DRP, NO3-N, and NH4-N below nominal detection limit.

Lake Taupo Long-Term Monitoring Programme 2007-2008 73
Lake Taupo biannual nutrient 2002-2003 Started 27 October 1994
Collection date 13 November 2002 Secchi depth = 18.0 m
Code Depth pH EC @25oC Temp DO SS VSS Chlor_a DRP DOP PP TP NH4-N NO3-N DON UREA PN* TN DOC PC PN** m mS cm-1 oC g m-3 g m-3 g m-3 mg m-3 mg m-3 mg m-3 mg m-3 mg m-3 mg m-3 mg m-3 mg m-3 mg m-3 mg m-3 mg m-3 mg m-3 mg m-3 mg m-3
NZ1 1 7.87 122 12.58 10.2 0.6 <0.5 0.6 1.3 1.7 2.2 5.2 0.8 0.6 65.6 2 15.3 82.3 620 160.0 12.5 NZ2 10 7.86 120 12.58 10.3 0.5 <0.5 0.7 1.2 1.8 2.1 5.1 0.7 0.0 49.3 1 13.7 63.7 573 180.5 13.5 NZ3 20 7.93 120 12.49 10.2 1.0 <0.5 0.7 1.1 1.9 2.2 5.2 0.5 0.1 61.4 1 15.8 77.8 536 157.5 12.0 NZ4 30 7.85 121 12.38 10.2 <0.5 <0.5 0.8 0.9 3.1 2.6 6.6 0.7 0.5 74.8 2 17.7 93.7 657 242.0 14.0 NZ5 40 7.81 119 12.16 10.1 <0.5 <0.5 0.7 1.2 1.8 1.9 4.9 0.6 0.7 58.7 1 12.9 72.9 506 164.5 8.0 NZ6 50 7.83 120 12.00 10.1 <0.5 <0.5 0.7 1.6 1.4 1.7 4.7 1.6 0.0 55.4 1 11.5 68.5 505 170.0 9.5 NZ7 60 7.78 119 11.81 10.0 <0.5 <0.5 0.6 1.5 1.5 1.5 4.5 1.2 0.0 64.8 2 9.5 75.5 531 108.5 6.5 NZ8 70 7.72 120 11.51 9.9 <0.5 <0.5 0.6 2.8 1.2 1.3 5.3 3.4 2.2 42.4 7 7.1 55.1 514 53.5 5.0 NZ9 80 7.67 120 11.32 9.7 <0.5 <0.5 0.4 2.7 1.3 1.1 5.1 3.3 0.9 38.8 2 5.9 48.9 578 61.0 4.5
NZ10 90 7.77 121 11.13 9.6 <0.5 <0.5 0.4 2.8 1.2 1.0 5.0 3.7 0.4 44.9 4 6.6 55.6 487 41.0 <2 NZ11 100 7.53 122 11.08 9.4 <0.5 <0.5 0.2 3.0 2.0 0.8 5.8 4.2 3.7 65.1 5 6.1 79.1 525 31.0 <2 NZ12 110 7.64 121 11.05 9.4 <0.5 <0.5 0.1 3.3 1.7 0.7 5.7 3.4 5.4 57.2 4 4.4 70.4 472 38.0 <2 NZ13 120 7.55 122 11.01 9.3 <0.5 <0.5 0.2 3.6 0.4 1.0 5.0 3.0 7.0 51.0 6 5.9 66.9 473 64.5 4.0 NZ14 130 7.32 123 10.99 9.2 <0.5 <0.5 0.1 3.6 0.4 1.0 5.0 2.9 7.5 45.6 5 6.7 62.7 555 70.5 3.5 NZ15 140 7.47 121 10.97 9.1 0.5 <0.5 0.1 3.7 1.3 0.9 5.9 2.5 10.5 60.0 16 6.7 79.7 460 54.5 3.0 NZ16 150 7.46 121 10.96 9.0 <0.5 <0.5 0.2 4.3 1.7 1.0 7.0 0.5 12.9 58.6 4 6.4 78.4 461 52.5 3.0
Collection date 3 April 2003 Secchi depth = 13.5 m
Code Depth pH EC @25oC Temp DO SS VSS Chlor_a DRP DOP PP TP NH4-N NO3-N DON UREA PN* TN DOC PC PN** m mS cm-1 oC g m-3 g m-3 g m-3 mg m-3 mg m-3 mg m-3 mg m-3 mg m-3 mg m-3 mg m-3 mg m-3 mg m-3 mg m-3 mg m-3 mg m-3 mg m-3 mg m-3
UJ1 1 8.01 119 19.20 8.8 3.0 0.5 0.7 0.8 3.2 1.8 5.8 5 0.4 75.6 5 18.8 99.8 546 219.0 19.5 UJ2 10 8.07 146 18.71 8.8 0.7 1.0 1.4 0.9 4.1 2.5 7.5 <1 0.6 45.4 1 24.0 70.0 511 304.5 29.0 UJ3 20 8.15 120 18.60 8.6 1.0 0.7 1.3 0.6 3.4 2.3 6.3 <1 0.6 40.4 1 23.7 64.7 520 270.0 31.5 UJ4 30 7.93 119 16.93 8.3 <0.5 <0.5 1.5 0.8 3.2 1.8 5.8 <1 0.3 39.7 1 20.4 60.4 503 181.0 39.0 UJ5 40 7.66 118 13.31 8.0 <0.5 <0.5 1.3 1.7 3.3 1.7 6.7 <1 0.8 39.2 1 12.2 52.2 443 115.0 54.0 UJ6 50 7.61 122 12.39 7.9 <0.5 1.0 0.7 2.9 2.1 1.3 6.3 <1 4.8 35.2 3 8.6 48.6 410 92.5 5.5 UJ7 60 7.57 138 11.80 7.7 <0.5 <0.5 0.5 3.9 2.1 1.1 7.1 <1 10.7 32.3 1 5.9 48.9 366 86.5 4.5 UJ8 70 7.42 121 11.50 7.6 <0.5 <0.5 0.2 4.4 1.6 0.9 6.9 <1 16.3 27.7 1 6.1 50.1 404 109.5 4.0 UJ9 80 7.39 121 11.32 7.5 <0.5 <0.5 0.1 4.5 1.5 1.0 7.0 <1 19.3 41.7 1 6.2 67.2 365 37.0 4.0
UJ10 90 7.32 121 11.20 7.3 <0.5 <0.5 0.1 4.7 1.3 0.8 6.8 <1 21.9 24.1 2 4.5 50.5 360 40.0 <4 UJ11 100 7.29 121 11.19 7.3 <0.5 <0.5 <0.1 5.3 2.7 0.9 8.9 <1 23.9 27.1 2 4.6 55.6 387 92.5 <4 UJ12 110 7.26 120 11.12 7.2 <0.5 <0.5 <0.1 5.5 0.5 0.7 6.7 <1 25.2 30.8 1 2.9 58.9 366 28.5 <4 UJ13 120 7.33 122 11.11 7.0 <0.5 <0.5 <0.1 6.6 0.4 0.7 7.7 <1 28.8 36.2 5 2.5 67.5 409 40.0 <4 UJ14 130 7.27 123 11.09 6.9 <0.5 <0.5 <0.1 7.7 0.3 0.9 8.9 <1 30.9 29.1 3 3.2 63.2 382 15.5 <4 UJ15 140 7.28 122 11.10 6.8 <0.5 <0.5 <0.1 7.6 0.4 0.8 8.8 <1 30.4 47.6 4 4.3 82.3 384 47.5 <4 UJ16 150 7.29 122 11.09 6.5 <0.5 <0.5 <0.1 9.0 5.0 1.6 15.6 <1 36.4 30.6 2 6.5 73.5 371 38.5 <4
NH4, NO3, DON, Urea all as N * = PN by wet digestion method, ** = PN by combustion furnace method. Detection limits: DRP 0.5; NO3-N 0.5; NH4-N 1.0 mg m-3 New Analytical instrument (Flow Injection Analysis) from January 2002, gives greatly improved resolution at low levels. FIA instrument results are given as a better indication of likely absolute low levels of DRP, NO3-N, and NH4-N below nominal detection limit.

Lake Taupo Long-Term Monitoring Programme 2007-2008 74
Lake Taupo biannual nutrient database 2001-2002 Started 27 October 1994 Collection date 12 November 2001 Secchi depth = 15.5 m
Code Depth pH EC @25oC Temp DO SS VSS Chlor_a DRP DOP PP TP NH4-N NO3-N DON UREA PN* TN DOC PC PN** m μS cm-1 oC g m-3 g m-3 g m-3 mg m-3 mg m-3 mg m-3 mg m-3 mg m-3 mg m-3 mg m-3 mg m-3 mg m-3 mg m-3 mg m-3 mg m-3 mg m-3 mg m-3
XH1 1 7.85 122 14.23 9.5 0.5 <0.5 0.6 0.9 1.1 1.55 3.6 <1 <0.5 29 2 6 35 500 146.5 12.0 XH2 10 7.86 122 14.16 9.8 0.5 <0.5 0.7 1.1 0.9 4.3 6.3 <1 <0.5 32 2 16.5 49 520 212.0 31.3 XH3 20 7.82 119 13.37 9.4 <0.5 <0.5 1.0 1.1 <0.5 3.5 4.6 <1 <0.5 28 1 20 48 510 340.5 26.8 XH4 30 7.6 116 12.85 9.4 0.6 0.7 1.3 1.6 <0.5 3.1 4.7 <1 1.0 29 1 14.5 45 480 264.5 24.7 XH5 40 7.44 122 11.87 8.9 <0.5 <0.5 1.3 2.2 <0.5 2.8 5.0 1 2.5 25.5 2 11.5 41 470 200.5 21.7 XH6 50 7.46 121 11.57 9.0 <0.5 <0.5 0.9 2.6 <0.5 1.75 4.4 <1 7.2 26.8 2 6 40 470 136.5 12.6 XH7 60 7.41 121 11.24 8.7 1.3 1.2 0.7 2.6 <0.5 1.4 4.0 <1 8.0 24 2 <2 32 440 104.5 9.1 XH8 70 7.4 122 11.13 8.8 <0.5 <0.5 0.5 2.9 <0.5 1.15 4.1 <1 12.3 21.7 2 <2 34 450 142.0 7.2 XH9 80 7.38 122 11.03 8.6 <0.5 <0.5 0.4 3.2 <0.5 1.15 4.4 <1 13.6 29.4 4 <2 43 440 103.0 8.1
XH10 90 7.4 119 11.01 8.8 <0.5 <0.5 0.4 3.2 <0.5 1.05 4.3 <1 15.1 21.9 2 <2 37 420 79.0 6.2 XH11 100 7.35 120 10.99 8.6 <0.5 <0.5 0.3 3.8 <0.5 1.05 4.9 <1 17.8 25.2 2 4 47 460 98.0 6.6 XH12 110 7.36 122 10.97 8.6 <0.5 <0.5 0.3 4.0 <0.5 1.1 5.1 <1 19.5 24.5 2 <2 44 490 116.5 5.8 XH13 120 7.35 126 10.95 8.4 <0.5 <0.5 0.3 4.5 <0.5 1.3 5.8 <1 22.0 22 2 <2 44 490 93.5 5.6 XH14 130 7.38 127 10.94 8.4 <0.5 <0.5 0.3 4.4 <0.5 1.1 5.5 <1 21.1 21.9 2 <2 43 420 113.5 5.5 XH15 140 7.34 126 10.94 8.2 <0.5 <0.5 0.3 5.2 <0.5 1.3 6.5 <1 24.7 25.3 2 <2 50 440 93.5 7.3 XH16 150 7.38 127 10.94 8.1 1.3 0.6 0.3 5.3 <0.5 1.3 6.6 <1 25.2 26.8 3 <2 52 480 83.5 7.7
Collection date 4 April 2002 Secchi depth = 19.0 m
Code Depth pH EC @25oC Temp DO SS VSS Chlor_a DRP DOP PP TP NH4-N NO3-N DON UREA PN* TN DOC PC PN** m μS cm-1 oC g m-3 g m-3 g m-3 mg m-3 mg m-3 mg m-3 mg m-3 mg m-3 mg m-3 mg m-3 mg m-3 mg m-3 mg m-3 mg m-3 g m-3 mg m-3 mg m-3
EJ1 1 7.91 119 17.45 8.8 <0.5 <0.5 0.72 0.5 0.5 1 2.0 1.1 0.3 44.6 7.85 53.9 0.5 187.0 10.0 EJ2 10 7.94 118 17.38 8.9 <0.5 <0.5 0.96 0.6 1.4 1.4 3.4 0.2 0.1 44.7 9.4 54.4 0.6 164.5 10.5 EJ3 20 7.88 119 17.18 8.8 <0.5 <0.5 1.02 0.5 1.5 1.35 3.4 0.3 0.0 38.7 9.45 48.5 0.8 154.5 11.0 EJ4 30 7.85 119 16.83 8.7 <0.5 <0.5 0.95 0.7 2.3 1.45 4.5 0.4 0.1 40.5 8.4 49.4 0.5 136.5 10.5 EJ5 40 7.65 121 12.9 8.3 <0.5 <0.5 0.89 1.4 0.6 1.2 3.2 0.4 0.8 32.8 7.95 42.0 0.4 100.0 8.0 EJ6 50 7.66 120 12.09 8.2 <0.5 <0.5 0.85 2.1 0.9 1.3 4.3 0.4 3.5 35.1 7.8 46.8 0.4 114.0 9.0 EJ7 60 7.60 123 11.51 8.1 <0.5 <0.5 0.50 3.9 2.1 1 7.0 0.9 12.3 30.8 5.7 49.7 0.4 75.0 6.0 EJ8 70 7.42 123 11.3 8.0 <0.5 <0.5 0.26 4.5 0.5 0.95 6.0 0.0 20.9 30.1 5.65 56.7 0.5 49.5 4.0 EJ9 80 7.46 121 11.24 7.9 <0.5 <0.5 0.24 4.6 0.4 1.1 6.1 0.2 24.8 29 7.55 61.6 0.3 50.0 5.0
EJ10 90 7.38 121 11.19 7.8 <0.5 <0.5 0.19 5.3 <0.5 0.75 6.1 0.3 28.1 23.6 4.45 56.5 0.4 48.0 4.0 EJ11 100 7.33 121 11.17 7.8 <0.5 <0.5 0.11 5.4 0.6 0.8 6.8 0.1 28.6 30.3 5.05 64.1 0.3 76.0 5.5 EJ12 110 7.37 122 11.14 7.7 <0.5 <0.5 0.10 6.0 <0.5 0.8 6.8 0.5 31.7 23.8 6.15 62.2 0.6 67.5 7.5 EJ13 120 7.36 122 11.14 7.7 <0.5 <0.5 0.10 6.3 <0.5 0.6 6.9 0.2 32.2 24.6 3.25 60.3 0.3 46.5 4.0 EJ14 130 7.32 122 11.13 7.6 <0.5 <0.5 0.09 6.5 <0.5 0.45 7.0 0.1 32.2 26.7 0.8 59.8 0.5 48.0 5.5 EJ15 140 7.34 122 11.13 7.1 <0.5 <0.5 0.07 7.0 <0.5 0.7 7.7 1.1 34.0 29.9 4.9 69.9 0.4 44.0 4.0 EJ16 150 7.44 122 11.13 7.0 <0.5 <0.5 0.09 8.7 <0.5 0.9 9.6 0.8 36.3 24.9 4.45 66.5 0.4 75.5 4.0
NH4, NO3, DON, Urea all as N * = PN by wet digestion method, ** = PN by combustion furnace method. Detection limits: DRP 0.5; NO3-N 0.5; NH4-N 1.0 mg m-3 New Analytical instrument (Flow Injection Analysis) from January 2002, gives greatly improved resolution at low levels. FIA instrument results are given for Autumn as an indication of likely absolute low levels of DRP, NO3-N, and NH4-N.

Lake Taupo Long-Term Monitoring Programme 2007-2008 75
Lake Taupo biannual nutrient database 2000-2001 Started 27 October 1994 Collection date 26 October 2000 Secchi depth = 11 m
Code Depth pH EC @25oC Temp DO SS VSS Chlor_a DRP DOP PP TP NH4-N NO3-N DON UREA PN* TN DOC PC PN** m μS cm-1 oC g m-3 g m-3 g m-3 mg m-3 mg m-3 mg m-3 mg m-3 mg m-3 mg m-3 mg m-3 mg m-3 mg m-3 mg m-3 mg m-3 g m-3 mg m-3 mg m-3
FX1 1 7.87 120 12.5 9.1 0.5 <0.5 0.4 <1 3 2 5.0 1 <1 25 4 9 35 0.5 104.5 4.0 FX2 10 7.85 120 11.5 8.7 0.8 0.5 1.1 1 4 3 8.0 <1 <1 33 2 23 56 0.5 196.0 12.0 FX3 20 7.79 120 11.4 8.7 <0.5 <0.5 1.3 <1 2 4 6.0 <1 <1 41 2 29 70 0.5 237.0 19.0 FX4 30 7.74 120 11.3 8.7 1.1 0.5 1.3 <1 2 3 5.0 <1 <1 36 1 24 60 0.5 183.0 11.0 FX5 40 7.69 119 11.3 9.1 0.9 0.5 1.5 <1 2 3 5.0 1 <1 38 2 18 57 0.5 90.5 7.0 FX6 50 7.63 120 11.3 9.1 0.8 <0.5 1.4 1 2 2 5.0 2 <1 64 2 14 80 0.4 79.5 6.0 FX7 60 7.54 120 11.3 8.7 0.9 <0.5 1.2 1 1 2 4.0 <1 <1 45 2 14 59 0.4 58.0 5.0 FX8 70 7.52 120 11.2 8.7 <0.5 <0.5 1.2 1 1 2 4.0 4 1 38 4 14 57 0.5 61.5 5.0 FX9 80 7.52 120 11.2 8.7 0.9 <0.5 1.1 2 2 2.5 6.5 5 2 44 2 13 64 0.5 44.5 <4 FX10 90 7.59 120 11.2 8.7 0.9 <0.5 1.1 2 2 2 6.0 6 3 37 2 14 60 0.5 58.5 5.5 FX11 100 7.47 120 11.1 8.7 <0.5 <0.5 1.4 1 1 3 5.0 3 4 39 4 16 62 0.4 48.5 6.0 FX12 110 7.41 121 11.1 8.7 0.9 <0.5 1.2 2 2 3 7.0 3 4 38 3 15 60 0.4 29.5 <4 FX13 120 7.40 121 11.0 8.2 0.5 <0.5 0.8 2 2 2 6.0 6 7 38 5 8 59 0.4 104.0 5.5 FX14 130 7.42 121 11.0 8.5 0.6 <0.5 0.2 2 2 2 6.0 6 7 41 4 11 65 0.4 71.0 6.5 FX15 140 7.36 121 11.0 8.6 0.8 <0.5 0.6 4 1 3 8.0 5 11 40 3 11 67 0.4 65.5 5.0 FX16 150 7.32 121 11.0 8.5 0.6 <0.5 1.4 4 2 4 10.0 8 13 47 9 18 86 0.4 110.5 8.0 Collection date 8 April 2001 Secchi depth = 13.5 m
Code Depth pH EC @25oC Temp DO SS VSS Chlor_a DRP DOP PP TP NH4-N NO3-N DON UREA PN* TN DOC PC PN** m μS cm-1 oC g m-3 g m-3 g m-3 mg m-3 mg m-3 mg m-3 mg m-3 mg m-3 mg m-3 mg m-3 mg m-3 mg m-3 mg m-3 mg m-3 g m-3 mg m-3 mg m-3
NZ1 1 7.94 120 17.0 8.3 <0.5 <0.5 1.0 <1 2 2 4.0 2 1 40 7 20.0 63.0 0.6 201.0 15.5 NZ2 10 7.97 120 16.9 8.3 <0.5 <0.5 1.4 <1 1 2 3.0 <1 <1 29 1 19.0 48.0 0.6 189.0 13.0 NZ3 20 7.99 120 16.8 8.4 <0.5 <0.5 1.5 <1 1 2 3.0 <1 <1 36 1 19.0 55.0 0.6 208.5 14.5 NZ4 30 7.96 124 15.8 8.0 <0.5 <0.5 1.2 <1 2 2 4.0 1 <1 42 1 16.0 59.0 0.6 156.0 10.5 NZ5 40 7.76 120 13.1 7.8 <0.5 <0.5 1.2 <1 1 1.5 2.5 1 1 22 2 12.0 36.0 0.5 145.0 8.5 NZ6 50 7.69 119 12.4 7.5 <0.5 <0.5 1.0 2 0 1 3.0 1 2 22 2 10.0 35.0 0.5 100.0 5.5 NZ7 60 7.60 120 11.8 7.2 <0.5 <0.5 0.8 1 1 1 3.0 <1 9 16 2 7.0 32.0 0.5 82.0 <2 NZ8 70 7.57 120 11.7 7.1 <0.5 <0.5 0.4 3 0 <1 3.0 <1 19 25 2 5.5 49.5 0.4 80.5 <2 NZ9 80 7.44 121 11.5 6.9 <0.5 <0.5 0.3 3 0 <1 3.0 2 24 15 3 5.0 46.0 0.6 70.0 <2 NZ10 90 7.39 121 11.5 6.9 <0.5 <0.5 0.2 3 1 <1 4.0 2 26 14 4 4.0 46.0 0.5 57.5 <2 NZ11 100 7.38 122 11.4 6.8 <0.5 <0.5 0.2 4 0 <1 4.0 2 29 16 1 4.0 51.0 0.5 47.5 <2 NZ12 110 7.39 122 11.4 6.8 <0.5 <0.5 0.1 4 1 <1 4.0 2 31 18 4 3.5 54.5 0.5 42.5 <2 NZ13 120 7.41 121 11.3 6.7 <0.5 <0.5 0.1 5 0 <1 5.0 1 33 16 4 5.0 55.0 0.4 40.0 <2 NZ14 130 7.42 122 11.3 6.6 <0.5 <0.5 0.1 5 0 <1 5.0 1 33 20 4 5.0 59.0 0.5 42.5 <2 NZ15 140 7.34 123 11.3 6.4 <0.5 <0.5 0.1 6 1 <1 7.0 2 38 12 5 4.5 56.5 0.5 55.0 <2 NZ16 146 7.30 123 11.3 6.3 <0.5 <0.5 0.1 7 2 1 10.0 2 43 22 5 6.5 73.5 0.5 70.5 <2 NH4, NO3, DON, Urea all as N Detection limits: DRP 0.5; NO3-N 0.5; NH4-N 1.0 mg m-3 * = PN by wet digestion method, ** = PN by combustion furnace method.
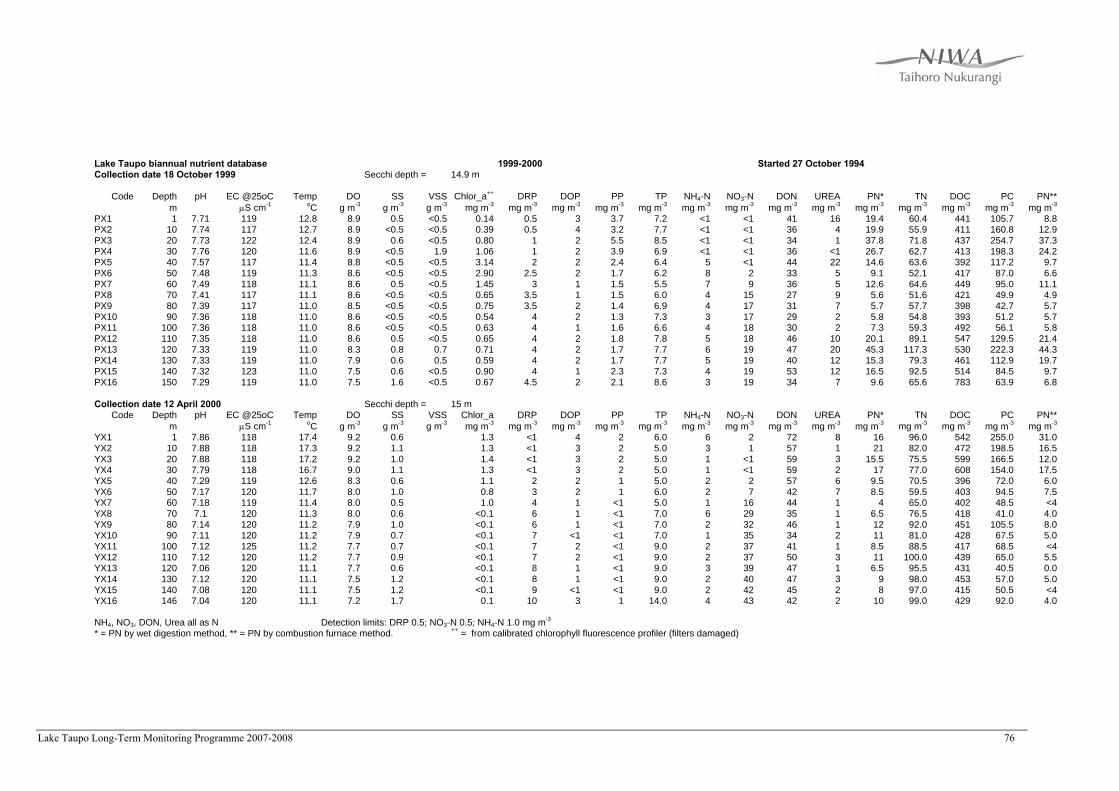
Lake Taupo Long-Term Monitoring Programme 2007-2008 76
Lake Taupo biannual nutrient database 1999-2000 Started 27 October 1994 Collection date 18 October 1999 Secchi depth = 14.9 m
Code Depth pH EC @25oC Temp DO SS VSS Chlor_a++ DRP DOP PP TP NH4-N NO3-N DON UREA PN* TN DOC PC PN**
m μS cm-1 oC g m-3 g m-3 g m-3 mg m-3 mg m-3 mg m-3 mg m-3 mg m-3 mg m-3 mg m-3 mg m-3 mg m-3 mg m-3 mg m-3 mg m-3 mg m-3 mg m-3 PX1 1 7.71 119 12.8 8.9 0.5 <0.5 0.14 0.5 3 3.7 7.2 <1 <1 41 16 19.4 60.4 441 105.7 8.8 PX2 10 7.74 117 12.7 8.9 <0.5 <0.5 0.39 0.5 4 3.2 7.7 <1 <1 36 4 19.9 55.9 411 160.8 12.9 PX3 20 7.73 122 12.4 8.9 0.6 <0.5 0.80 1 2 5.5 8.5 <1 <1 34 1 37.8 71.8 437 254.7 37.3 PX4 30 7.76 120 11.6 8.9 <0.5 1.9 1.06 1 2 3.9 6.9 <1 <1 36 <1 26.7 62.7 413 198.3 24.2 PX5 40 7.57 117 11.4 8.8 <0.5 <0.5 3.14 2 2 2.4 6.4 5 <1 44 22 14.6 63.6 392 117.2 9.7 PX6 50 7.48 119 11.3 8.6 <0.5 <0.5 2.90 2.5 2 1.7 6.2 8 2 33 5 9.1 52.1 417 87.0 6.6 PX7 60 7.49 118 11.1 8.6 0.5 <0.5 1.45 3 1 1.5 5.5 7 9 36 5 12.6 64.6 449 95.0 11.1 PX8 70 7.41 117 11.1 8.6 <0.5 <0.5 0.65 3.5 1 1.5 6.0 4 15 27 9 5.6 51.6 421 49.9 4.9 PX9 80 7.39 117 11.0 8.5 <0.5 <0.5 0.75 3.5 2 1.4 6.9 4 17 31 7 5.7 57.7 398 42.7 5.7 PX10 90 7.36 118 11.0 8.6 <0.5 <0.5 0.54 4 2 1.3 7.3 3 17 29 2 5.8 54.8 393 51.2 5.7 PX11 100 7.36 118 11.0 8.6 <0.5 <0.5 0.63 4 1 1.6 6.6 4 18 30 2 7.3 59.3 492 56.1 5.8 PX12 110 7.35 118 11.0 8.6 0.5 <0.5 0.65 4 2 1.8 7.8 5 18 46 10 20.1 89.1 547 129.5 21.4 PX13 120 7.33 119 11.0 8.3 0.8 0.7 0.71 4 2 1.7 7.7 6 19 47 20 45.3 117.3 530 222.3 44.3 PX14 130 7.33 119 11.0 7.9 0.6 0.5 0.59 4 2 1.7 7.7 5 19 40 12 15.3 79.3 461 112.9 19.7 PX15 140 7.32 123 11.0 7.5 0.6 <0.5 0.90 4 1 2.3 7.3 4 19 53 12 16.5 92.5 514 84.5 9.7 PX16 150 7.29 119 11.0 7.5 1.6 <0.5 0.67 4.5 2 2.1 8.6 3 19 34 7 9.6 65.6 783 63.9 6.8
Collection date 12 April 2000 Secchi depth = 15 m
Code Depth pH EC @25oC Temp DO SS VSS Chlor_a DRP DOP PP TP NH4-N NO3-N DON UREA PN* TN DOC PC PN** m μS cm-1 oC g m-3 g m-3 g m-3 mg m-3 mg m-3 mg m-3 mg m-3 mg m-3 mg m-3 mg m-3 mg m-3 mg m-3 mg m-3 mg m-3 mg m-3 mg m-3 mg m-3
YX1 1 7.86 118 17.4 9.2 0.6 1.3 <1 4 2 6.0 6 2 72 8 16 96.0 542 255.0 31.0 YX2 10 7.88 118 17.3 9.2 1.1 1.3 <1 3 2 5.0 3 1 57 1 21 82.0 472 198.5 16.5 YX3 20 7.88 118 17.2 9.2 1.0 1.4 <1 3 2 5.0 1 <1 59 3 15.5 75.5 599 166.5 12.0 YX4 30 7.79 118 16.7 9.0 1.1 1.3 <1 3 2 5.0 1 <1 59 2 17 77.0 608 154.0 17.5 YX5 40 7.29 119 12.6 8.3 0.6 1.1 2 2 1 5.0 2 2 57 6 9.5 70.5 396 72.0 6.0 YX6 50 7.17 120 11.7 8.0 1.0 0.8 3 2 1 6.0 2 7 42 7 8.5 59.5 403 94.5 7.5 YX7 60 7.18 119 11.4 8.0 0.5 1.0 4 1 <1 5.0 1 16 44 1 4 65.0 402 48.5 <4 YX8 70 7.1 120 11.3 8.0 0.6 <0.1 6 1 <1 7.0 6 29 35 1 6.5 76.5 418 41.0 4.0 YX9 80 7.14 120 11.2 7.9 1.0 <0.1 6 1 <1 7.0 2 32 46 1 12 92.0 451 105.5 8.0 YX10 90 7.11 120 11.2 7.9 0.7 <0.1 7 <1 <1 7.0 1 35 34 2 11 81.0 428 67.5 5.0 YX11 100 7.12 125 11.2 7.7 0.7 <0.1 7 2 <1 9.0 2 37 41 1 8.5 88.5 417 68.5 <4 YX12 110 7.12 120 11.2 7.7 0.9 <0.1 7 2 <1 9.0 2 37 50 3 11 100.0 439 65.0 5.5 YX13 120 7.06 120 11.1 7.7 0.6 <0.1 8 1 <1 9.0 3 39 47 1 6.5 95.5 431 40.5 0.0 YX14 130 7.12 120 11.1 7.5 1.2 <0.1 8 1 <1 9.0 2 40 47 3 9 98.0 453 57.0 5.0 YX15 140 7.08 120 11.1 7.5 1.2 <0.1 9 <1 <1 9.0 2 42 45 2 8 97.0 415 50.5 <4 YX16 146 7.04 120 11.1 7.2 1.7 0.1 10 3 1 14.0 4 43 42 2 10 99.0 429 92.0 4.0
NH4, NO3, DON, Urea all as N Detection limits: DRP 0.5; NO3-N 0.5; NH4-N 1.0 mg m-3 * = PN by wet digestion method, ** = PN by combustion furnace method. ++ = from calibrated chlorophyll fluorescence profiler (filters damaged)

Lake Taupo Long-Term Monitoring Programme 2007-2008 77
Lake Taupo biannual nutrient database 1998-1999 Started 27 October 1994 Collection date 1 November 1998 Secchi depth = 13.5 m
Code Depth pH EC @25oC Temp DO SS VSS Chlor_a DRP DOP PP TP NH4-N NO3-N DON PN* TN DOC PC PN**
m μS cm-1 oC g m-3 g m-3 g m-3 mg m-3 mg m-3 mg m-3 mg m-3 mg m-3 mg m-3 mg m-3 mg m-3 mg m-3 mg m-3 g m-3 mg m-3 mg m-3 DM1 1 7.91 118 13.6 10.4 0.8 <0.5 0.8 0.7 1.5 2.0 4.2 3.4 <0.5 35 10.8 49.2 133.5 12.0 DM2 10 7.87 117 13.2 10.7 0.8 <0.5 1.0 0.6 1.3 2.6 4.5 2.4 <0.5 36 15.2 53.6 180.5 15.0 DM3 20 7.82 118 12.7 10.7 0.5 <0.5 1.4 0.6 1.4 2.9 4.9 1.9 1.1 37 18.0 58.0 215.0 23.3 DM4 30 7.80 118 12.4 10.6 <0.5 <0.5 1.1 0.5 1.3 2.3 4.1 1.9 <0.5 34 14.1 50.0 128.0 13.5 DM5 40 7.75 118 12.4 10.4 <0.5 <0.5 0.6 0.6 1.2 1.7 3.5 2.5 <0.5 34 9.2 45.7 118.0 10.4 DM6 50 7.70 118 12.2 10.2 <0.5 <0.5 0.6 0.6 1.2 1.7 3.5 2.6 0.6 31 8.1 42.3 114.5 7.9 DM7 60 7.46 119 11.7 10.0 <0.5 <0.5 0.4 2.1 1.0 1.4 4.5 1.6 9.5 32 6.0 49.1 73.0 6.0 DM8 70 7.30 120 11.2 9.6 <0.5 <0.5 0.3 3.3 0.9 1.0 5.2 2.7 16.0 32 3.8 54.5 56.0 2.7 DM9 80 7.15 121 11.1 9.1 <0.5 <0.5 0.2 3.9 0.8 0.9 5.6 1.5 20.5 29 5.0 56.0 64.5 2.7 DM10 90 7.07 122 11.1 8.8 <0.5 <0.5 0.2 4.9 0.5 0.9 6.3 2.6 24.8 32 5.0 64.4 45.0 2.9 DM11 100 7.16 121 11.0 8.5 <0.5 <0.5 0.2 5.0 0.5 0.9 6.4 3.3 26.2 34 3.6 67.1 42.5 2.0 DM12 110 7.16 122 11.0 8.3 <0.5 <0.5 0.1 6.2 0.4 0.8 7.4 2.0 29.2 30 4.0 65.2 54.0 2.9 DM13 120 7.11 122 11.0 8.0 <0.5 <0.5 0.1 6.4 0.3 0.8 7.5 2.2 30.6 29 3.3 65.1 63.0 1.8 DM14 130 7.08 122 11.0 7.8 <0.5 <0.5 0.1 7.0 0.2 0.8 8.0 2.2 31.4 28 3.1 64.7 48.5 2.0 DM15 140 7.07 123 10.9 7.6 <0.5 <0.5 0.1 7.9 0.0 0.9 8.8 2.0 33.8 32 5.0 72.8 54.0 2.0 DM16 150 7.10 123 10.9 7.6 2.5 <0.5 0.2 8.2 0.4 3.7 12.3 2.7 35.4 34 12.8 84.9 140.5 10.5 Collection date 14 April 1999 Secchi depth = 13 m
Code Depth pH EC @25oC Temp DO SS VSS Chlor_a DRP DOP PP TP NH4-N NO3-N DON PN* TN DOC PC PN**
m μS cm-1 oC g m-3 g m-3 g m-3 mg m-3 mg m-3 mg m-3 mg m-3 mg m-3 mg m-3 mg m-3 mg m-3 mg m-3 mg m-3 g m-3 mg m-3 mg m-3 II1 1 119 18.3 8.9 <0.5 <0.5 1.2 0.6 1.8 2.4 3 <0.5 43 19.0 65.0 0.6 221.4 19.5 II2 10 118 18.3 8.8 <0.5 <0.5 1.2 0.5 1.8 2.3 1 <0.5 40 19.3 60.3 0.5 216.3 17.6 II3 20 118 18.3 8.8 <0.5 <0.5 1.2 0.5 1.7 2.2 1 2 41 19.0 63.0 0.5 132.3 8.9 II4 30 118 18.1 8.7 <0.5 <0.5 1.2 1.1 1.4 2.5 1 3 34 14.0 52.0 0.6 136.8 9.7 II5 40 118 12.9 8.4 <0.5 <0.5 0.7 2.3 0.9 3.2 1 6 31 8.9 46.9 0.7 91.2 6.5 II6 50 119 11.9 8.1 <0.5 <0.5 0.4 3.1 0.7 3.8 1 14 28 7.9 50.9 0.5 63.1 4.8 II7 60 121 11.6 8.0 <0.5 <0.5 0.3 4.3 0.7 5.0 1 19 33 7.3 60.3 0.6 42.3 5.0 II8 70 121 11.4 8.0 <0.5 <0.5 0.2 5.5 0.8 6.3 1 23 27 8.6 59.6 0.4 48.4 7.0 II9 80 122 11.3 7.8 <0.5 <0.5 0.1 5.9 0.8 6.7 2 28 29 8.3 67.3 0.5 51.5 6.1 II10 90 123 11.2 7.6 <0.5 <0.5 0.1 6.1 0.6 6.7 1 30 31 6.4 68.4 0.5 62.1 4.2 II11 100 122 11.2 7.4 <0.5 <0.5 0.1 6.1 0.5 6.6 2 27 28 6.1 63.1 0.6 33.1 1.5 II12 110 120 11.2 7.2 <0.5 <0.5 0.1 6.6 0.5 7.1 2 28 27 6.1 63.1 0.5 35.7 2.9 II13 120 122 11.2 7.1 <0.5 <0.5 0.1 6.4 0.5 6.9 2 24 26 5.2 57.2 0.6 34.1 2.2 II14 130 122 11.1 6.8 <0.5 <0.5 <0.1 7.5 0.5 8.0 2 28 31 6.3 67.3 0.6 46.9 5.5 II15 140 122 11.1 6.3 <0.5 <0.5 0.1 8.8 0.9 9.7 2 33 31 6.4 72.4 0.5 63.4 3.0 II16 150 116 11.1 5.9 <0.5 <0.5 <0.1 8.6 0.9 9.5 4 28 60 7.7 99.7 0.9 51.1 1.1 NH4, NO3, DON, Urea all as N Detection limits: DRP 0.5; NO3-N 0.5; NH4-N 1.0 mg m-3 * = PN by wet digestion method, ** = PN by combustion furnace method.

Lake Taupo Long-Term Monitoring Programme 2007-2008 78
Lake Taupo biannual nutrient database 1997-1998 Started 27 October 1994 Collection Date 30 October 1997 Secchi depth = 12.5 m ID Depth pH EC @25oC Temp DO SS VSS Chlor_a DRP DOP PP TP NH4 NO3 DON UREA PN* TN DOC PC PN** SO4
m μS cm-1 C g m-3 g m-3 g m-3 mg m-3 mg m-3 mg m-3 mg m-3 mg m-3 mg m-3 mg m-3 mg m-3 mg m-3 mg m-3 mg m-3 g m-3 mg m-3 mg m-3 g m-3 TT1 1 7.70 116.9 12.2 10.7 0.61 0.30 1.28 1.0 1.3 1.5 3.8 2.1 2.9 36 1.1 14.3 55.3 0.71 168.3 17.2 TT2 10 7.71 117.8 12.0 10.2 0.54 0.29 1.49 0.7 1.9 1.9 4.5 1.3 7.3 32 1.1 18.7 59.7 0.82 160.7 18.8 TT3 20 7.65 118.1 11.5 10.2 0.59 0.32 1.58 0.8 1.6 1.7 4.0 1.6 0.7 36 1.1 14.0 52.0 0.60 133.0 16.5 TT4 30 7.64 118.2 11.5 10.0 0.52 0.25 1.19 0.4 1.5 1.9 3.8 1.5 1.3 31 0.9 15.8 49.8 0.60 146.9 16.0 TT5 40 7.62 117.1 11.4 10.0 0.55 0.28 1.31 0.6 1.5 1.6 3.7 1.7 0.3 33 1.0 14.1 49.1 0.62 126.3 13.4 TT6 50 7.63 116.9 11.1 9.9 0.37 0.20 1.10 0.4 1.5 1.4 3.2 2.2 0.3 32 0.8 12.3 46.3 0.51 112.1 12.1 TT7 60 7.54 117.7 11.1 9.8 0.21 0.10 0.93 1.4 0.7 1.5 3.5 3.3 0.7 34 1.6 14.3 52.3 0.74 80.6 9.0 TT8 70 7.45 117.8 10.8 9.8 0.41 0.12 0.79 1.1 1.1 1.1 3.2 8.2 1.3 31 1.5 7.9 47.9 0.65 58.4 4.8 TT9 80 7.36 118.3 10.7 9.9 0.31 0.04 0.54 1.5 1.1 0.8 3.3 6.1 2.3 31 0.6 6.0 45.0 0.57 57.6 9.0 TT10 90 7.48 117.8 10.6 9.3 0.44 0.27 0.74 1.1 1.2 1.2 3.5 7.9 4.8 33 0.7 12.4 58.4 0.52 69.3 12.2 TT11 100 7.29 118.5 10.5 9.2 0.25 0.11 0.40 2.0 1.2 0.8 4.1 8.4 5.0 30 1.1 5.7 48.7 0.63 64.5 8.3 TT12 110 6.97 119.3 10.4 9.0 0.21 0.06 0.29 2.3 1.0 1.1 4.3 10.8 5.6 29 2.5 6.7 51.7 0.59 53.0 5.5 TT13 120 7.00 119.1 10.5 9.0 0.29 0.26 0.27 2.0 1.2 1.0 4.1 9.9 6.7 31 6.1 5.8 53.8 0.58 37.5 5.3 TT14 130 6.80 119.8 10.5 8.8 0.28 0.26 0.28 2.2 1.2 1.3 4.7 10.6 7.1 32 1.5 8.2 58.2 0.56 49.0 6.4 TT15 140 7.23 117.9 10.4 8.8 0.25 0.20 0.26 2.7 1.4 1.1 5.2 10.8 9.5 37 2.0 10.9 67.9 0.63 66.0 8.5 TT16 150 7.29 118.9 10.4 8.8 0.50 0.27 0.32 2.5 1.1 1.0 4.5 11.6 9.6 37 3.0 7.6 65.6 0.54 69.0 9.2 Collection Date:- 7 April 1998 Secchi depth = 13.5 m
ID Depth pH EC @25oC Temp DO SS VSS Chlor_a DRP DOP PP TP NH4 NO3 DON UREA PN* TN DOC PC PN** SO4 m μS cm-1 C g m-3 g m-3 g m-3 mg m-3 mg m-3 mg m-3 mg m-3 mg m-3 mg m-3 mg m-3 mg m-3 mg m-3 mg m-3 mg m-3 g m-3 mg m-3 mg m-3 g m-3
YE1 1 8.00 118 17.7 9.1 0.40 0.10 0.67 0.8 1.4 1.3 3.5 2.9 4.6 53 3.7 9.9 70.4 0.83 156.5 14.4 7.7 YE2 10 7.99 119 17.7 9.1 0.49 0.12 1.04 0.9 1.4 1.8 4.1 1.9 2.5 52 4.6 13.7 70.1 0.78 179.5 16.0 8.1 YE3 20 8.00 119 17.7 9.1 0.32 0.32 1.07 0.7 1.5 1.7 3.9 2.4 1.5 48 3.7 12.6 64.5 0.71 162.5 15.2 8.5 YE4 30 7.99 120 17.5 9.1 0.30 0.20 1.06 0.7 1.7 1.6 4.0 2.0 1.2 48 3.7 12.7 63.9 0.78 138.5 14.5 8.0 YE5 40 7.60 120 13.7 9.3 0.13 0.13 1.18 1.2 1.0 1.2 3.4 2.0 3.1 39 4.2 8.2 52.3 0.69 112.5 8.2 7.7 YE6 50 7.50 120 11.5 9.3 0.34 0.00 0.75 2.4 0.9 0.9 4.2 2.5 4.5 52 3.2 6.5 65.5 0.65 88.0 6.7 7.8 YE7 60 7.38 120 11.0 9.3 0.11 0.00 0.49 3.0 0.7 0.8 4.5 1.5 11.7 32 3.2 5.3 50.5 0.72 74.5 5.8 7.7 YE8 70 7.32 121 10.8 9.2 0.20 0.00 0.33 3.1 0.9 0.6 4.6 1.0 17.7 38 3.7 4.0 60.7 0.78 57.5 4.1 7.9 YE9 80 7.23 120 10.6 9.1 0.24 0.24 0.24 3.5 0.6 0.8 4.9 1.4 23.1 43 6.9 5.7 73.2 0.69 49.5 4.5 7.9 YE10 90 7.27 121 10.6 9.1 0.31 0.21 0.17 4.4 0.6 0.7 5.7 1.3 24.1 41 6.5 5.6 72.0 0.68 47.5 4.9 7.9 YE11 100 7.29 121 10.6 9.0 0.32 0.11 0.16 4.5 0.7 0.8 6.0 1.0 24.5 39 3.7 6.8 71.3 0.57 58.0 7.4 7.8 YE12 110 7.29 121 10.5 8.9 0.35 0.35 0.12 4.8 0.7 0.5 6.0 1.3 25.1 40 5.5 6.5 72.9 0.63 52.5 2.6 7.8 YE13 120 7.35 121 10.5 8.9 0.24 0.08 0.37 3.4 0.6 1.2 5.2 1.0 18.9 35 4.6 4.1 59.0 0.75 63.5 3.8 7.7 YE14 130 7.24 122 10.5 8.8 0.32 0.16 0.11 5.7 0.6 0.7 7.0 1.0 27.0 39 6.0 3.5 70.5 0.63 52.0 3.9 7.9 YE15 140 7.21 122 10.5 8.6 0.45 0.05 0.15 6.4 0.6 1.0 8.0 4.2 29.1 65 10.6 6.7 105.0 0.74 60.5 5.9 7.8 YE16 150 7.49 121 10.5 8.4 0.80 0.15 0.62 3.3 1.1 1.6 6.0 2.5 13.0 62 9.7 14.2 91.7 0.70 135.5 13.6 7.9 NH4, NO3, DON, Urea all as N Detection limits: DRP 0.5; NO3-N 0.5; NH4-N 1.0 mg m-3 * = PN by wet digestion method, ** = PN by combustion furnace method.

Lake Taupo Long-Term Monitoring Programme 2007-2008 79
Lake Taupo biannual nutrient database 1996-1997 Started 27 October 1994 Collection Date 24 October 1996 Secchi depth = 12.6 m ID Depth pH EC @25oC Temp DO SS VSS Chlor_a DRP DOP PP TP NH4 NO3 DON UREA PN* TN DOC PC PN** SO4
m μS cm-1 C g m-3 g m-3 g m-3 mg m-3 mg m-3 mg m-3 mg m-3 mg m-3 mg m-3 mg m-3 mg m-3 mg m-3 mg m-3 mg m-3 g m-3 mg m-3 mg m-3 g m-3 IG1 1 12.4 10.3 0.45 0.34 0.27 0.6 2.1 1.7 4.4 3.0 0.5 59.3 1.4 13.9 76.7 0.86 171 14.5 7.82 IG2 10 12.3 10.3 0.72 0.42 0.47 0.7 2.3 2.2 5.2 2.4 0.4 64.5 1.0 14.5 81.8 0.88 201 16.8 7.90 IG3 20 12.3 10.2 0.67 0.40 0.45 0.8 2.8 2.9 6.5 2.6 0.4 75.8 0.6 18.7 97.5 0.91 232 19.8 7.87 IG4 30 12.3 9.9 0.85 0.49 0.64 0.6 2.3 3.1 6.0 3.3 0.5 73.6 0.4 20.6 98.0 0.95 198 15.7 7.86 IG5 40 11.9 9.9 0.71 0.46 0.56 0.5 1.8 2.5 4.8 2.6 1.2 64.8 0.3 14.6 83.2 0.80 183 12.8 7.84 IG6 50 11.6 9.8 0.62 0.34 0.45 1.1 3.1 2.1 6.3 2.9 0.6 71.2 0.9 13.2 87.9 0.92 157 14.9 7.95 IG7 60 11.1 9.7 0.77 0.32 0.70 0.9 1.8 2.3 5.0 4.4 13.2 175.4 3.5 14.3 207.3 1.29 151 14.1 10.67 IG8 70 10.6 9.4 0.65 0.28 0.54 0.8 1.5 1.9 4.2 2.9 0.8 59.3 1.5 9.2 72.2 0.78 116 10.2 7.85 IG9 80 10.5 9.3 0.51 0.27 0.55 0.9 2.5 1.8 5.2 3.0 3.0 76.1 1.3 9.8 91.9 0.95 103 10.8 7.80 IG10 90 10.4 9.3 0.49 0.23 0.50 0.6 1.8 1.8 4.2 2.1 1.0 52.3 1.4 10.9 66.3 0.73 95 11.0 7.69 IG11 100 10.4 9.2 0.50 0.21 0.51 0.5 1.5 1.8 3.8 1.8 3.6 53.9 4.5 9.6 68.9 1.04 106 12.8 7.85 IG12 110 10.4 9.2 0.43 0.23 0.49 0.4 1.3 2.0 3.7 2.5 5.2 54.0 6.0 9.3 71.0 0.80 94 11.5 7.85 IG13 120 10.4 9.0 0.47 0.21 0.47 0.8 1.4 1.8 4.0 3.7 9.6 61.9 6.9 8.0 83.2 0.78 78 9.7 7.97 IG14 130 10.3 8.9 0.44 0.18 0.38 1.1 1.5 2.3 4.9 4.5 9.7 52.4 4.6 12.0 78.6 1.00 83 8.7 7.99 IG15 140 10.3 8.9 0.49 0.22 0.51 1.5 1.6 2.5 5.6 4.3 12.9 57.8 5.0 10.4 85.4 0.99 80 8.9 8.14 IG16 150 10.3 8.9 1.13 0.26 0.57 1.2 2.3 3.5 7.0 5.1 13.6 65.9 4.8 14.5 99.1 0.91 121 13.4 8.15 Collection Date:- 2 April 1997 Secchi depth = 16.0 m ID Depth pH EC @25oC Temp DO SS VSS Chlor_a DRP DOP PP TP NH4 NO3 DON UREA PN* TN DOC PC PN** SO4
m μS cm-1 C g m-3 g m-3 g m-3 mg m-3 mg m-3 mg m-3 mg m-3 mg m-3 mg m-3 mg m-3 mg m-3 mg m-3 mg m-3 mg m-3 g m-3 mg m-3 mg m-3 g m-3 NA1 1 8.02 118.4 17.3 9.4 0.30 0.30 0.63 0.9 2.2 1.5 4.6 4.0 0.6 67.4 4.9 18.1 90.1 0.82 186.5 17.3 7.80 NA2 10 8.01 118.3 17.3 9.2 0.20 0.10 0.69 0.9 1.3 1.6 3.8 1.7 0.3 51.0 3.3 14.4 67.4 0.77 190.0 17.1 7.86 NA3 20 8.03 118.2 17.2 8.9 0.40 0.30 0.63 0.6 1.2 1.6 3.4 1.8 0.3 51.8 2.2 17.6 71.5 0.75 192.0 19.1 7.85 NA4 30 7.98 118.4 17.2 8.8 0.40 0.40 0.52 0.7 1.0 1.5 3.2 2.5 0.6 47.5 2.7 15.2 65.8 0.56 207.5 20.3 7.90 NA5 40 7.52 118.5 14.2 8.8 0.20 0.20 0.72 0.8 1.8 1.4 4.0 2.7 0.3 53.2 4.1 13.3 69.5 0.69 158.0 15.2 7.91 NA6 50 7.32 119.3 11.3 8.6 0.00 0.00 0.39 1.5 1.4 1.0 3.9 11.2 3.1 54.7 4.5 9.7 78.7 0.62 116.5 10.6 7.88 NA7 60 7.18 120.2 10.9 8.6 0.20 0.20 0.16 1.7 1.3 0.8 3.8 3.7 10.1 48.9 2.1 10.5 73.2 0.86 100.0 13.8 7.88 NA8 70 7.13 119.6 10.6 8.5 0.10 0.10 0.12 1.9 1.7 0.8 4.4 4.3 11.8 58.3 2.2 8.0 82.4 0.83 75.0 8.7 7.87 NA9 80 7.12 120.1 10.5 8.5 0.10 0.10 0.05 3.3 1.4 0.7 5.4 6.9 26.9 82.4 16.9 6.7 122.9 0.98 77.5 9.9 7.90 NA10 90 7.12 120.4 10.5 8.5 0.00 0.00 0.25 3.6 2.2 0.7 6.5 28.9 22.9 108.3 7.4 8.1 168.2 0.63 110.5 8.8 8.00 NA11 100 7.10 120.4 10.5 8.4 0.20 0.20 0.04 4.4 1.2 0.8 6.4 10.7 22.5 72.0 5.2 7.1 112.3 0.85 71.0 8.3 7.97 NA12 110 7.07 120.6 10.4 8.3 0.20 0.20 0.02 3.7 2.0 0.8 6.5 2.9 21.9 52.5 3.8 6.4 83.7 1.01 77.0 9.6 7.93 NA13 120 7.07 120.5 10.4 8.2 0.30 0.20 0.02 3.3 2.4 0.8 6.5 6.4 22.8 56.4 4.2 13.0 98.6 0.70 113.5 15.4 7.88 NA14 130 7.08 120.4 10.4 8.0 0.20 0.20 0.01 4.3 1.6 0.8 6.7 6.2 27.9 56.7 6.2 8.2 99.0 0.81 118.5 11.0 7.97 NA15 140 7.10 121.1 10.4 7.6 0.40 0.40 0.04 4.5 1.7 1.2 7.4 3.9 28.9 58.5 7.9 24.7 116.0 0.80 212.5 28.8 7.91 NA16 150 7.10 122.1 10.4 7.5 1.20 0.40 0.07 5.0 1.0 2.7 8.7 8.6 29.0 61.5 11.8 20.2 119.3 2.07 234.5 22.1 7.97 NH4, NO3, DON, Urea all as N Detection limits: DRP 0.5; NO3-N 0.5; NH4-N 1.0 mg m-3 * = analysed by wet digestion method, ** = analysed by CHN combustion furnace method.

Lake Taupo Long-Term Monitoring Programme 2007-2008 80
Lake Taupo biannual nutrient database 1995-1996 Collection Date:- 30 October 1995 Secchi depth = 13.0 m ID Depth pH EC @25oC Temp DO BOD5 SS VSS Chlor_a DRP DOP PP TP NH4 NO3 DON UREA PN* TN DOC PC PN**
m μS cm-1 C g m-3 g m-3 g m-3 g m-3 mg m-3 mg m-3 mg m-3 mg m-3 mg m-3 mg m-3 mg m-3 mg m-3 mg m-3 mg m-3 mg m-3 g m-3 mg m-3 mg m-3 ZH1 1 7.40 115.1 13.7 10.3 0.80 0.60 0.38 0.45 <0.2 2.4 1.27 3.67 <0.2 <0.1 55.7 3 6.89 62.69 0.75 123 10.3 ZH2 10 7.59 116.1 11.9 10.5 0.40 0.95 0.53 0.96 <0.2 0.8 1.94 2.74 <0.2 <0.1 48.0 3 14.69 62.69 0.61 217 18.0 ZH3 20 7.39 117.8 11.4 10.6 -0.05 1.09 0.59 1.18 0.3 1.5 2.41 4.21 0.2 <0.1 51.5 4 19.47 71.17 0.58 285 22.3 ZH4 30 7.58 116.6 11.2 10.7 -0.15 1.15 0.58 1.26 0.2 0.7 2.21 3.11 <0.2 <0.1 44.6 2 17.83 62.43 0.45 242 19.4 ZH5 40 7.48 116.2 10.9 10.7 0.00 0.91 0.57 1.22 <0.2 1.1 1.88 2.98 <0.2 <0.1 41.9 2 13.00 54.90 0.44 183 15.8 ZH6 50 7.36 117.0 10.8 10.3 0.25 0.69 0.42 1.10 <0.2 0.8 1.71 2.51 <0.2 <0.1 41.7 3 8.55 50.25 0.43 116 10.3 ZH7 60 7.28 117.2 10.7 10.3 0.70 0.49 0.28 1.03 <0.2 0.8 1.55 2.35 <0.2 0.1 41.1 3 7.75 48.95 0.40 110 10.3 ZH8 70 7.25 117.8 10.5 10.2 0.50 0.64 0.43 1.03 <0.2 0.6 1.50 2.10 <0.2 0.2 40.4 2 7.27 47.87 0.38 108 9.9 ZH9 80 7.25 117.5 10.5 10.2 0.40 0.72 0.43 1.19 <0.2 0.8 1.58 2.38 <0.2 0.7 41.4 2 7.19 49.39 0.48 115 12.1 ZH10 90 7.30 118.0 10.5 10.1 0.00 0.72 0.40 1.27 0.3 0.6 1.59 2.49 <0.2 1.5 38.5 3 7.30 47.30 0.47 101 12.1 ZH11 100 7.25 117.5 10.5 10.0 0.15 0.71 0.39 1.30 <0.2 0.2 1.77 1.97 <0.2 2.4 36.4 3 10.67 49.47 0.49 107 12.5 ZH12 110 7.25 117.5 10.5 9.9 0.35 0.71 0.38 1.32 <0.2 0.9 1.69 2.59 0.5 4.6 44.3 3 10.26 59.66 0.52 93 13.1 ZH13 120 7.23 117.3 10.5 9.9 0.30 0.70 0.41 1.35 <0.2 1.3 1.55 2.85 0.5 5.6 51.3 9 7.99 65.39 0.51 99 12.9 ZH14 130 7.25 117.3 10.5 9.8 0.20 0.69 0.47 1.32 <0.2 0.4 1.89 2.29 1.3 6.6 49.7 7 13.42 71.02 0.55 112 18.5 ZH15 140 7.25 117.3 10.5 9.6 0.40 0.97 0.47 1.60 <0.2 0.2 2.54 2.74 5.7 11.7 60.6 9 11.77 89.77 0.57 113 15.8 ZH16 150 7.25 117.5 10.5 9.2 0.40 1.77 0.91 1.77 0.7 0.4 3.05 4.15 8.3 13.2 90.9 15 48.30 160.70 0.69 357 55.1 Collection Date:- 28 March 1996 Secchi depth = 14.6 m ID Depth pH EC @25oC Temp DO BOD5 SS VSS Chlor_a DRP DOP PP TP NH4 NO3 DON UREA PN* TN DOC PC PN**
m μS cm-1 C g m-3 g m-3 g m-3 g m-3 mg m-3 mg m-3 mg m-3 mg m-3 mg m-3 mg m-3 mg m-3 mg m-3 mg m-3 mg m-3 mg m-3 g m-3 mg m-3 mg m-3 DR1 1 8.02 117.4 16.8 8.7 0.15 0.31 0.18 0.48 1.3 1.8 0.93 4.03 <0.2 4.7 91.0 1.4 12.69 108.39 0.35 118 9.7 DR2 10 8.02 117.4 16.7 8.7 0.20 0.44 0.25 0.81 1.3 1.5 1.43 4.23 <0.2 7.4 111.0 6.2 12.60 131.00 0.42 149 12.3 DR3 20 7.95 117.6 16.6 8.8 0.25 0.34 0.23 0.76 1.0 1.8 1.30 4.10 0.6 <0.1 60.0 2.0 11.70 72.30 0.35 126 11.7 DR4 30 7.59 119.0 13.7 9.0 0.25 0.39 0.15 1.13 1.5 1.7 1.51 4.71 0.5 0.2 64.0 2.0 11.72 76.42 0.26 101 12.8 DR5 40 7.43 118.9 12.4 8.8 0.25 0.35 0.16 0.97 1.3 1.4 1.41 4.11 1.1 <0.1 51.0 2.2 11.77 63.87 0.22 68 8.6 DR6 50 7.34 119.5 11.6 8.6 0.10 0.32 0.14 0.71 1.8 1.5 1.17 4.47 0.8 5.0 68.0 3.5 8.76 82.56 0.18 60 6.4 DR7 60 7.32 119.4 11.4 8.5 0.25 0.27 0.10 0.48 2.2 1.0 1.06 4.26 1.8 5.9 59.0 1.8 8.32 75.02 0.17 46 5.7 FR8 70 7.29 120.4 11.6 8.5 0.25 0.23 0.13 0.28 2.3 1.5 0.80 4.60 <0.2 14.1 87.0 3.4 6.65 107.75 0.26 48 6.4 DR9 80 7.20 120.8 11.2 8.3 0.20 0.30 0.14 0.17 2.9 1.3 0.83 5.03 1.5 10.0 68.0 1.4 5.15 84.65 0.23 45 5.5 DR10 90 7.20 121.2 11.3 8.2 0.20 0.39 0.14 0.12 2.7 2.1 0.89 5.69 2.5 11.5 55.0 1.4 5.34 74.34 0.17 51 6.7 DR11 100 7.24 121.3 10.9 8.2 0.05 0.45 0.19 0.10 2.8 1.8 0.93 5.53 2.2 11.4 72.0 8.1 9.25 94.85 0.22 46 6.9 DR12 110 7.32 122.1 10.8 8.1 0.25 0.25 0.15 0.08 2.7 1.8 0.88 5.38 1.0 11.5 68.0 1.6 5.86 86.36 0.23 52 8.1 DR13 120 7.39 120.2 10.7 8.3 0.15 0.24 0.11 0.09 2.8 1.2 0.74 4.74 2.2 11.2 75.0 3.8 3.91 92.31 0.26 34 5.3 DR14 130 7.47 120.3 10.7 8.3 0.25 0.31 0.15 0.08 3.1 1.5 0.70 5.30 1.5 12.4 70.0 2.5 3.43 87.33 0.27 45 3.8 DR15 140 7.43 121.1 10.7 8.0 0.15 0.33 0.15 0.08 4.6 1.4 0.96 6.96 2.9 16.0 88.0 5.7 4.28 111.18 0.26 51 7.4 DR16 150 7.52 120.1 10.6 7.8 0.75 0.75 0.63 0.07 4.7 1.5 2.13 8.33 3.2 15.9 140.0 32.4 69.74 228.84 0.52 349 70.7 NH4, NO3, DON, UREA all as N Detection limits: DRP 0.5; NO3-N 0.5; NH4-N 1.0 mg m-3 * = analysed by wet digest method, ** = analysed by CHN combustion furnace method.
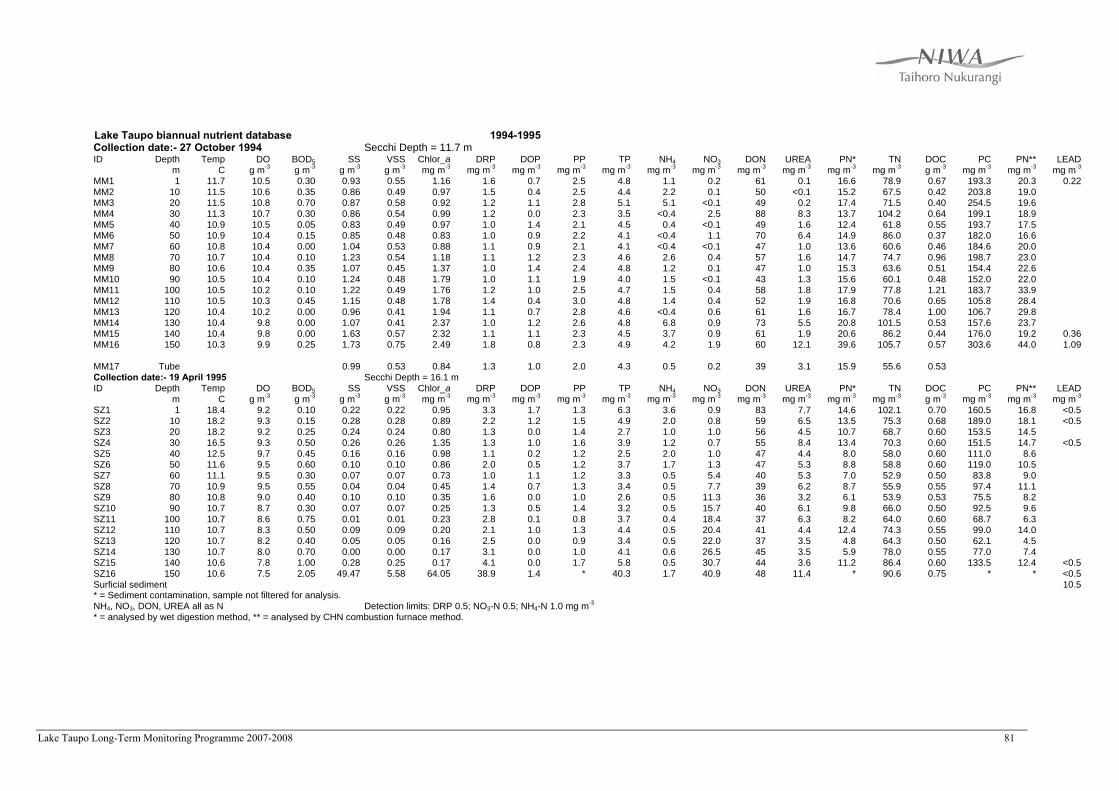
Lake Taupo Long-Term Monitoring Programme 2007-2008 81
Lake Taupo biannual nutrient database 1994-1995 Collection date:- 27 October 1994 Secchi Depth = 11.7 m ID Depth Temp DO BOD5 SS VSS Chlor_a DRP DOP PP TP NH4 NO3 DON UREA PN* TN DOC PC PN** LEAD
m C g m-3 g m-3 g m-3 g m-3 mg m-3 mg m-3 mg m-3 mg m-3 mg m-3 mg m-3 mg m-3 mg m-3 mg m-3 mg m-3 mg m-3 g m-3 mg m-3 mg m-3 mg m-3 MM1 1 11.7 10.5 0.30 0.93 0.55 1.16 1.6 0.7 2.5 4.8 1.1 0.2 61 0.1 16.6 78.9 0.67 193.3 20.3 0.22 MM2 10 11.5 10.6 0.35 0.86 0.49 0.97 1.5 0.4 2.5 4.4 2.2 0.1 50 <0.1 15.2 67.5 0.42 203.8 19.0 MM3 20 11.5 10.8 0.70 0.87 0.58 0.92 1.2 1.1 2.8 5.1 5.1 <0.1 49 0.2 17.4 71.5 0.40 254.5 19.6 MM4 30 11.3 10.7 0.30 0.86 0.54 0.99 1.2 0.0 2.3 3.5 <0.4 2.5 88 8.3 13.7 104.2 0.64 199.1 18.9 MM5 40 10.9 10.5 0.05 0.83 0.49 0.97 1.0 1.4 2.1 4.5 0.4 <0.1 49 1.6 12.4 61.8 0.55 193.7 17.5 MM6 50 10.9 10.4 0.15 0.85 0.48 0.83 1.0 0.9 2.2 4.1 <0.4 1.1 70 6.4 14.9 86.0 0.37 182.0 16.6 MM7 60 10.8 10.4 0.00 1.04 0.53 0.88 1.1 0.9 2.1 4.1 <0.4 <0.1 47 1.0 13.6 60.6 0.46 184.6 20.0 MM8 70 10.7 10.4 0.10 1.23 0.54 1.18 1.1 1.2 2.3 4.6 2.6 0.4 57 1.6 14.7 74.7 0.96 198.7 23.0 MM9 80 10.6 10.4 0.35 1.07 0.45 1.37 1.0 1.4 2.4 4.8 1.2 0.1 47 1.0 15.3 63.6 0.51 154.4 22.6 MM10 90 10.5 10.4 0.10 1.24 0.48 1.79 1.0 1.1 1.9 4.0 1.5 <0.1 43 1.3 15.6 60.1 0.48 152.0 22.0 MM11 100 10.5 10.2 0.10 1.22 0.49 1.76 1.2 1.0 2.5 4.7 1.5 0.4 58 1.8 17.9 77.8 1.21 183.7 33.9 MM12 110 10.5 10.3 0.45 1.15 0.48 1.78 1.4 0.4 3.0 4.8 1.4 0.4 52 1.9 16.8 70.6 0.65 105.8 28.4 MM13 120 10.4 10.2 0.00 0.96 0.41 1.94 1.1 0.7 2.8 4.6 <0.4 0.6 61 1.6 16.7 78.4 1.00 106.7 29.8 MM14 130 10.4 9.8 0.00 1.07 0.41 2.37 1.0 1.2 2.6 4.8 6.8 0.9 73 5.5 20.8 101.5 0.53 157.6 23.7 MM15 140 10.4 9.8 0.00 1.63 0.57 2.32 1.1 1.1 2.3 4.5 3.7 0.9 61 1.9 20.6 86.2 0.44 176.0 19.2 0.36 MM16 150 10.3 9.9 0.25 1.73 0.75 2.49 1.8 0.8 2.3 4.9 4.2 1.9 60 12.1 39.6 105.7 0.57 303.6 44.0 1.09
MM17 Tube 0.99 0.53 0.84 1.3 1.0 2.0 4.3 0.5 0.2 39 3.1 15.9 55.6 0.53 Collection date:- 19 April 1995 Secchi Depth = 16.1 m ID Depth Temp DO BOD5 SS VSS Chlor_a DRP DOP PP TP NH4 NO3 DON UREA PN* TN DOC PC PN** LEAD
m C g m-3 g m-3 g m-3 g m-3 mg m-3 mg m-3 mg m-3 mg m-3 mg m-3 mg m-3 mg m-3 mg m-3 mg m-3 mg m-3 mg m-3 g m-3 mg m-3 mg m-3 mg m-3 SZ1 1 18.4 9.2 0.10 0.22 0.22 0.95 3.3 1.7 1.3 6.3 3.6 0.9 83 7.7 14.6 102.1 0.70 160.5 16.8 <0.5 SZ2 10 18.2 9.3 0.15 0.28 0.28 0.89 2.2 1.2 1.5 4.9 2.0 0.8 59 6.5 13.5 75.3 0.68 189.0 18.1 <0.5 SZ3 20 18.2 9.2 0.25 0.24 0.24 0.80 1.3 0.0 1.4 2.7 1.0 1.0 56 4.5 10.7 68.7 0.60 153.5 14.5 SZ4 30 16.5 9.3 0.50 0.26 0.26 1.35 1.3 1.0 1.6 3.9 1.2 0.7 55 8.4 13.4 70.3 0.60 151.5 14.7 <0.5 SZ5 40 12.5 9.7 0.45 0.16 0.16 0.98 1.1 0.2 1.2 2.5 2.0 1.0 47 4.4 8.0 58.0 0.60 111.0 8.6 SZ6 50 11.6 9.5 0.60 0.10 0.10 0.86 2.0 0.5 1.2 3.7 1.7 1.3 47 5.3 8.8 58.8 0.60 119.0 10.5 SZ7 60 11.1 9.5 0.30 0.07 0.07 0.73 1.0 1.1 1.2 3.3 0.5 5.4 40 5.3 7.0 52.9 0.50 83.8 9.0 SZ8 70 10.9 9.5 0.55 0.04 0.04 0.45 1.4 0.7 1.3 3.4 0.5 7.7 39 6.2 8.7 55.9 0.55 97.4 11.1 SZ9 80 10.8 9.0 0.40 0.10 0.10 0.35 1.6 0.0 1.0 2.6 0.5 11.3 36 3.2 6.1 53.9 0.53 75.5 8.2 SZ10 90 10.7 8.7 0.30 0.07 0.07 0.25 1.3 0.5 1.4 3.2 0.5 15.7 40 6.1 9.8 66.0 0.50 92.5 9.6 SZ11 100 10.7 8.6 0.75 0.01 0.01 0.23 2.8 0.1 0.8 3.7 0.4 18.4 37 6.3 8.2 64.0 0.60 68.7 6.3 SZ12 110 10.7 8.3 0.50 0.09 0.09 0.20 2.1 1.0 1.3 4.4 0.5 20.4 41 4.4 12.4 74.3 0.55 99.0 14.0 SZ13 120 10.7 8.2 0.40 0.05 0.05 0.16 2.5 0.0 0.9 3.4 0.5 22.0 37 3.5 4.8 64.3 0.50 62.1 4.5 SZ14 130 10.7 8.0 0.70 0.00 0.00 0.17 3.1 0.0 1.0 4.1 0.6 26.5 45 3.5 5.9 78.0 0.55 77.0 7.4 SZ15 140 10.6 7.8 1.00 0.28 0.25 0.17 4.1 0.0 1.7 5.8 0.5 30.7 44 3.6 11.2 86.4 0.60 133.5 12.4 <0.5 SZ16 150 10.6 7.5 2.05 49.47 5.58 64.05 38.9 1.4 * 40.3 1.7 40.9 48 11.4 * 90.6 0.75 * * <0.5 Surficial sediment 10.5 * = Sediment contamination, sample not filtered for analysis. NH4, NO3, DON, UREA all as N Detection limits: DRP 0.5; NO3-N 0.5; NH4-N 1.0 mg m-3 * = analysed by wet digestion method, ** = analysed by CHN combustion furnace method.

Lake Taupo Long-Term Monitoring Programme 2007-2008 82
12. Appendix 5: Phytoplankton data
In this report phytoplankton abundance is reported in cell counts per ml and biovolume. In the previous system reporting only algal dominance, “Dominance” (rank 1 = dominant to rank 10 = rare), was calculated from algal biovolume. For continuance of the Dominance format, rank the species composition by biovolume.
Note: reporting counts as cells per ml rounded to a whole number may result in cell counts of “0” despite a large biovolume where the algal species is large or colonial e.g., Botryococcus braunii
The new algal data has been added to this report and the data from the previous year retained to accumulate, as has been done with temperature, DO, and nutrient data.

Lake Taupo Long-Term Monitoring Programme 2007-2008 83
Lake Taupo phytoplankton enumeration (10-m tube) 2007-08Cell counts and biovolumeCells per ml numbers may be affected by rounding
Sample code TZ2 TZ2 TZ4 TZ4 WF2 WF2 XX1 XX1 XX4 XX4 AM1 AM1 BM1 BM1 BM3 BM3 DT1 DT1 EO1 EO1 EO3 EO3 EO5 EO5Sampling date 8/08/2007 8/08/2007 23/08/2007 23/08/2007 11/09/2007 11/09/2007 9/10/2007 9/10/2007 30/10/2007 30/10/2007 15/11/2007 15/11/2007 4/12/2007 4/12/2007 20/12/2007 20/12/2007 17/01/2008 17/01/2008 31/01/2008 31/01/2008 14/02/2008 14/02/2008 27/02/2008 27/02/2008
Species composition by class Cell Biovolume Cell Biovolume Cell Biovolume Cell Biovolume Cell Biovolume Cell Biovolume Cell Biovolume Cell Biovolume Cell Biovolume Cell Biovolume Cell Biovolume Cell Biovolume(per ml) (µm3) (per ml) (µm3) (per ml) (µm3) (per ml) (µm3) (per ml) (µm3) (per ml) (µm3) (per ml) (µm3) (per ml) (µm3) (per ml) (µm3) (per ml) (µm3) (per ml) (µm3) (per ml) (µm3)
Blue greens (Cyanophyceae)Anabaena lemmermannii 2 64 3 108 1 27 17 696 51 2100 18 725 1 27 29 1175 28.7 1175 21.3 875 25.0 1025 85.8 3518Pseudanabaena limnetica 0 0 0 0 0 0 0 0 0 0 0 0 0 0 0 0 0.1 2 0.0 0 0.0 0 0.5 9
Chroococcus sp. 0 0 1 6 0 0 0 0 0 0 0 0 0 0 0 0 0.0 0 0.0 0 0.0 0 0.0 0Microcystis sp. 0 0 0 0 0 7 0 0 0 0 0 0 0 0 0 0 0.0 0 0.0 0 0.0 0 0.0 0
c.f Rivularia sp. 0 0 0 0 1 19 0 0 0 0 0 0 0 0 0 0 0 0 0 0 0 0 0 0Aphanothece sp. 0 0 1 15 0 1 0 0 0 0 0 0 0 0 0 0 0.0 0 0.0 0 0.0 0 0.0 0
Aphanizomenon sp. 2 30 0 0 0 0 0 0 0 0 2 32 3 48 4 78 0.0 0 0.0 0 0.0 0 4.0 76Leptolyngbya sp. 0 0 0 0 0 0 0 0 0 0 0 0 0 0 1 8 0.0 0 0.0 0 0.0 0 0.0 0
Greens (Chlorophyceae)Monoraphidium sp. / Ankistrodesmus falcatus 20 839 17 695 3 123 6 247 10 418 28 1189 18 737 114 4785 66 2764 0 0 0 0 0 0
Stichococcus contortus 175 0 97 1749 25 453 0 0 0 0 0 0 3 53 0 0 0 0 0 0 0 0 0 0Kirchneriella contorta 0 0 0 0 56 1853 0 0 0 0 0 0 0 0 0 0 0 0 0 0 0 0 0 0Botryococcus braunii 0 0 0 4800 0 0 0 0 0 0 0 0 0 1100 1 92840 0 0 0 0 0 0 0 259720Chlamydomonas sp. 0 0 0 0 0 0 0 0 0 0 0 0 0 0 0 0 0 0 0 0 0 0 0 0
Elakotothrix gelatinosa 0 0 0 0 0 0 0 0 0 0 0 0 0 0 5 532 0 0 0 0 0 0 2 246Eudorina elegans 0 0 0 0 0 0 0 0 1 300 0 0 0 0 0 0 2 624 4 1108 0 0 3 749
Lagerheimia sp. 0 0 0 0 0 0 0 0 0 0 0 0 0 0 0 0 0 0 0 0 0 0 0 0Oocytsis sp. 0 0 0 0 1 166 5 758 5 665 0 0 1 166 6 839 2 277 0 0 0 0 0 0
Planktosphaeria gelatinosa 0 0 0 0 0 0 0 0 0 0 0 0 0 0 0 0 0 0 0 0 0 0 0 0Quadrigula lacustrus 0 0 5 788 3 480 0 0 0 0 0 0 0 0 3 554 0 0 0 0 0 0 0 0
Westella botryoides 10 634 29 1909 0 0 0 0 9 608 0 0 0 0 0 0 17 1077 0 0 0 0 0 0Paulschulzia sp. 0 0 0 0 0 0 0 0 0 0 0 0 0 0 0 0 0 0 0 0 0 0 0 0
Diatoms (Bacillariophyceae)Asterionella formosa 275 77123 292 81787 753 210974 124 34838 62 17363 15 4187 4 983 2 473 50 14060 11 3181 0 0 2 655
Aulacoseira granulata 0 0 0 0 13 3990 0 0 16 5078 3 993 0 0 0 0 0 0 0 0 0 0 0 0Aulacoseira granulata var. angustissima 52 13436 11 2777 0 0 0 0 3 761 0 0 0 0 0 0 2 507 0 0 0 0 0 0
Cyclotella stelligera 14 2184 11 1709 8 1310 9 1452 11 1685 0 0 0 0 0 0 1 156 0 0 0 0 0 0Fragilaria crotonensis 57 20419 27 9750 0 0 0 0 0 0 2 574 1 209 9 3324 19 6806 5 1743 0 0 13 4607
Nitzschia sp. 0 0 5 2083 1 228 0 0 0 0 0 0 1 456 14 5596 1 380 0 0 0 0 2 684Synedra sp. 1 0 0 0 1 1638 0 0 1 0 0 0 0 0 0 0 0 0 0 0 0 0 0 0
Small unknown diatom sp. 0 0 0 0 0 0 0 0 0 0 0 0 0 0 0 0 0 0 1 60 0 0 0 0Desmids (Mesotaeniaceae, Desmidiaceae)
Closterium aciculare 0 0 0 0 0 0 0 160 0 0 1 320 1 350 1 506 0 0 0 0 0 0 0 0Closterium acutum var. variable 1 551 1 201 1 221 0 0 0 0 0 0 0 0 0 0 0 0 0 0 0 0 0 0
Chrysophtya (Chrysophyceae)Dinobryon sp. 21 1266 2 126 0 0 146 8633 297 17534 81 4789 76 4487 8 448 7 431 6 383 32 1915 73 4314
Cryptomonas sp. 0 0 1 77 0 0 1 77 0 0 0 0 0 0 0 0 0 0 0 0 0 0 0 0Mallomonas sp. 0 0 0 0 0 0 0 0 0 0 0 0 0 0 0 0 0 0 0 0 0 0 0 0
Dinoflagellates (Dinophyceae)Gymnodinium sp. 1 0 1463 0 0 0 0 1 3204 1 1755 0 0 1 1755 1 2532 0 0 6 17853 4 10820 16 49140Gymnodinium sp. 2 0 12188 1 13350 0 0 0 6675 0 0 0 0 0 7313 3 63300 0 6094 0 0 0 0 3 73125
Flagellates 5µmFlagellates < 5µm/unicells 153 6582 296 10354 112 3911 129 4504 93 3256 78 2729 125 4382 526 18403 83 2901 99 3465 39 1373 60 2109

Lake Taupo Long-Term Monitoring Programme 2007-2008 84
Sample code HT1 HT1 HT3 HT3 KB1 KB1 LB1 LB1 LB3 LB3 MW1 MW1 MW3 MW3 OL1 OL1 OL3 OL3 QA2 QA2 QA4 QA4 RL2 RL2Sampling date 13/03/2008 13/03/2008 26/03/2008 26/03/2008 17/04/2008 17/04/2008 7/05/2008 7/05/2008 22/05/2008 22/05/2008 5/06/2008 5/06/2008 18/06/2008 18/06/2008 1/07/2008 1/07/2008 15/07/2008 15/07/2008 7/08/2008 7/08/2008 20/08/2008 20/08/2008 4/09/2008 4/09/2008
Species composition by class Cell Biovolume Cell Biovolume Cell Biovolume Cell Biovolume Cell Biovolume Cell Biovolume Cell Biovolume Cell Biovolume Cell Biovolume Cell Biovolume Cell Biovolume Cell Biovolume(per ml) (µm3) (per ml) (µm3) (per ml) (µm3) (per ml) (µm3) (per ml) (µm3) (per ml) (µm3) (per ml) (µm3) (per ml) (µm3) (per ml) (µm3) (per ml) (µm3) (per ml) (µm3) (per ml) (µm3)
Blue greens (Cyanophyceae)Anabaena lemmermannii 92 3778 7.0 288 56.6 2319 120.6 4946 2.2 91 1.1 46 1.7 71 12.2 500 9.8 403 0.8 32 0.2 7 0.9 37Pseudanabaena limnetica 0.0 0 0.0 0 0.0 0 0.0 0 0.0 0 0.0 0 0.0 0 0.0 0 2.8 53 0.3 5 0.0 0 0.0 0
Chroococcus sp. 0.0 0 0.0 0 0.0 0 0.0 0 0.0 0 0.0 0 0.0 0 0.0 0 0.0 0 0.0 0 0.0 0 0.0 0Microcystis sp. 0.0 0 0.0 0 0.0 0 0.0 0 0.0 0 0.0 0 0.0 0 0.0 0 0.0 0 0.0 0 0.0 0 0.0 0
c.f Rivularia sp. 0 0 0 0 0 0 0 0 0 0 0 0 0 0 0 0 0 0 0 0 0 0 0 0Aphanothece sp. 0.0 0 0.0 0 0.0 0 0.0 0 0.0 0 0.0 0 0.0 0 0.0 0 0.0 0 0.0 0 0.0 0 0.0 0
Aphanizomenon sp. 0.0 0 0.0 0 0.0 0 0.0 0 0.0 0 0.0 0 0.0 0 0.0 0 0.0 0 0.0 0 0.0 0 0.0 0Leptolyngbya sp. 0.0 0 0.0 0 0.0 0 0.0 0 0.0 0 0.0 0 0.0 0 0.0 0 0.0 0 0.0 0 1.4 16 0.0 0
Greens (Chlorophyceae)Monoraphidium sp. / Ankistrodesmus falcatus 0 0 0 0 0 0 5 197 0 0 0 0 0.0 0 188 7907 0 0 73 3047 73 3071 130 5479
Stichococcus contortus 0 0 0 0 0 0 0 0 0 0 0 0 0.0 0 0 0 0 0 0.0 0 0 0 26 474Kirchneriella contorta 0 0 0 0 0 0 0 0 0 0 0 0 0.0 0 0 0 0 0 0.0 0 0 0 0 0Botryococcus braunii 0.1 469151 0 14435 0.04 259837 0 104870 0 28871 0 132806 0.0 3609 0 5774 0.1 226456 0.0 5413 0 0 0.0 17746Chlamydomonas sp. 0 0 0 0 0 0 0 0 0 0 0 0 0 0 0 0 0 0 0 0 0 0 0 0
Elakotothrix gelatinosa 2 246 6 676 1 123 4 369 2 246 1 123 0 0 1 114 0 0 0 0 0 0 0 0Eudorina elegans 8 2097 0 0 0 0 0 0 0 0 11 2696 0 0 0 0 0 0 0 0 9 2246 0 0
Lagerheimia sp. 0 0 0 0 0 0 0 0 0 0 0 0 0 0 0 0 0 0 0 0 0 0 7 1797Oocytsis sp. 0 0 0 0 1 166 5 665 2 332 0 0 0 0 6 914 0 0 5 665 7 997 0 0
Planktosphaeria gelatinosa 0 0 0 0 0 0 0 0 0 0 0 0 0 0 0 0 0 0 0 0 0 0 10 1412Quadrigula lacustrus 0 0 0 0 0 0 0 0 0 0 0 0 0 0 0 0 0 0 0 0 0 0 0 0
Westella botryoides 0 0 0 0 0 0 15 951 0 0 0 0 0 0 0 0 0 0 0 0 0 0 0 0Paulschulzia sp. 0 0 0 0 0 0 9 0 0 0 0 0 0 0 0 0 0 0 0 0 0 0 0 0
Diatoms (Bacillariophyceae)Asterionella formosa 19 5242 12 3276 5 1310 10 2785 28 7862 25 6880 22 6061 25 7043 102 28501 191 53399 79 22113 94 26208
Aulacoseira granulata 0 0 0 0 0 0 2 725 12 3808 13 4171 2 725 0 0 35 10700 151 46788 0 0 18 5622Aulacoseira granulata var. angustissima 0 0 0 0 0 0 4 913 0 0 0 0 0 0 25 6388 0 0 0 0 57 14754 0 0
Cyclotella stelligera 0 0 0 0 0 0 3 468 1 187 2 374 1 94 4 562 1 94 1 187 12 1872 18 2902Fragilaria crotonensis 0 0 15 5445 4 1466 0 0 57 20315 61 21781 84 29948 46 16545 30 10890 18 6283 49 17592 59 20943
Nitzschia sp. 1 228 1 342 3 1141 2 684 2 913 0 0 1 228 4 1369 4 1597 1 456 0 0 2 684Synedra sp. 0 0 0 0 0 0 0 0 0 0 0 0 0 0 0 0 0 0 0 0 0 0 0 0
Small unknown diatom sp. 0 0 0 0 0 0 0 0 0 0 0 0 0 0 0 0 0 0 0 0 0 0 0 0Desmids (Mesotaeniaceae, Desmidiaceae)
Closterium aciculare 0 0 0 0 0 0 0 0 0 0 0 0 0 0 0 0 0 0 0 0 0 0 2 1051Closterium acutum var. variable 0 0 0 0 0 0 0 0 0 0 0 0 0 0 1 221 0 0 1 441 0 0 0 0
Chrysophtya (Chrysophyceae)Dinobryon sp. 26 1519 2 104 4 242 8 483 8 466 9 518 0 0 9 518 0 0 0 0 0 0 20 1208
Cryptomonas sp. 1 84 0 0 1 84 1 168 1 84 1 84 2 337 0 0 2 337 0 0 0 0 0 0Mallomonas sp. 0 0 0 0 0 0 0 0 0 0 0 0 0 0 3 1053 0 0 0 0 0 0 0 0
Dinoflagellates (Dinophyceae)Gymnodinium sp. 1 6 19305 42 126360 12 36855 5 1843 35 12285 5 1638 4 1229 0 0 6 2048 0 0 0 0 0 0Gymnodinium sp. 2 0 0 0 0 0 0 0 0 0 0 1 29250 0 7313 0 0 1 14625 0 0 0 0 0 0
Flagellates 5µmFlagellates < 5µm/unicells 57 1986 56 1945 73 2539 131 4586 47 1638 63 2191 111 3890 121 4238 115 4013 87 3030 207 7228 104 3645

Lake Taupo Long-Term Monitoring Programme 2007-2008 85
Lake Taupo phytoplankton dominance plus enumeration (10-m tube) 2006-07Dominance by biovolume (rank 1 = dominant,…rank 10 = rare), plus cell counts and biovolume from May 2007
Sample code EM8 EM10 EM13 EM17 EM20 EM23 EM27 EM29 EM31 EM34 EM36 EM38 EM40 EM40 EM40 EM42 EM42 EM42 RY2 RY2 RY2 RY5 RY5 RY5Sampling date 26/09/2006 18/10/2006 1/11/2006 5/12/2007 14/12/2007 9/01/2007 8/02/2007 21/02/2007 21/03/2007 3/04/2007 19/04/2007 8/05/2007 22/05/07 22/05/07 22/05/07 14/06/07 14/06/07 14/06/07 27/06/07 27/06/07 27/06/07 18/07/2007 18/07/2007 18/07/2007
Species composition by class Rank Rank Rank Rank Rank Rank Rank Rank Rank Rank Rank Rank Rank Biovolume cell Rank Biovolume cell Rank Biovolume cell Rank Biovolume cellBlue greens (Cyanophyceae) (µm3) (per ml) (µm3) (per ml) (µm3) (per ml) (µm3) (per ml)
Anabaena lemmermannii 5 5 5 5 9 5 9 9 3 4 5 4 6 303 10 8 450 15 5 1091 36 4 3652 17Anabaena sp. 0 0 0 0 10 29 0 0 0
Aphanizomenon sp. 8 8 7 7 9 9 10 5 0 0 0 0 0 10 27 1Phormidium sp. 10 10 10 0 0 0 0 0 0 0 0
Greens (Chlorophyceae)Ankistrodesmus falcatus/ Schroederia sp. 9 120 5 0 0
Botryococcus braunii 7 2 2 3 3 1 1 1 1 1 5 3 1 1014600 0 1 38448 1 8 438 0 0 0Chlorosarcinopsis sp. 10 10
Elakotothrix gelatinosa 6 342 4 0 0 0 0 0 0Eudorina elegans 9 9 10 10 10 10 10 10 10 10 0 0 0 0 0 0 0 0
Kirchneriella contorta 0 0 10 157 7 0 0 10 21 1Monoraphidium sp/ Ankistrodesmus falcatus 10 10 10 10 10 10 10 10 8 8 9 7 5 561 19 2 20456 259 2 5061 46 5 2574 12
Oocytsis sp. 7 8 9 9 9 10 7 7 10 10 10 9 43 1 6 3210 11 4 1605 5 9 293 1Quadrigula lacustrus 9 0 0 0 0 0 0 0 0
Stichococcus contortus 0 0 0 0 7 534 4 6 1073 5Westella botryoides 9 9 9 10 10 10 10 10 0 0 0 0 0 0 0 0
Diatoms (Bacillariophyceae) 0Asterionella formosa 2 2 6 4 4 4 5 0 0 6 3173 10 3 4414 14 2 25087 81
Aulacoseira granulata 3 1 1 1 2 9 6 2 2 2 1 0 0 4 6760 22 1 7863 25 2 29167 94Aulacoseira granulata var. angustissima 2 3 5590 8 0 0 0 0 0 0
Cyclotella stelligera 5 5 9 7 6 6 5 6 0 0 8 427 3 10 71 0 8 468 3Fragilaria crotonensis 1 4 7 6 7 6 6 7 4 2294 6 3 13382 37 10 33 0 1 109152 107
Gomphonema sp. 5 5559 14 5 1042 3 7 952 2Nitzschia sp. 10 10 10 10 10 10 10 10 10 10 7 8 155 1
unknown diatom sp. 8 0 0 0 0 0 0 0 0Desmids (Mesotaeniaceae, Desmidiaceae)
Closterium acutum 9 10 10 9 9 7 8 8 10 10 0 0 7 1335 3 6 668 1 0 0Closterium acutum var. variable 10 10 10 9 8 8 8 8 0 0 0 0 0 0 7 731 1
Mougeotia sp. 10 0 0 0 0 0 0 0 0Staurastrum sp. 10 10 10 9 6 0 0 0 0 0 0 0 0
Chrysophtya (Chrysophyceae)Cryptomonas sp. 10 10 10 10 10 10 10 10 0 0 9 267 1 9 196 1 9 293 1
Dinobryon sp. 9 3 3 2 1 2 6 8 3 5 2 1 7 256 1 0 0 0 0 0 0Dinoflagellates (Dinophyceae)
Ceratium hirundinella 10 10 10 10 4 1 3 0 0 0 0 0 0 0 0Gymnodinium sp. 5 7 4 3 5 7 3 3 4 6 4 2 11748 1 0 0 0 0 0 0
Gymnodinium sp. 2 8 0 0 0 0 3 4450 0 0 0Flagellates 5µm
Flagellates < 5µm/unicells 3 6 8 6 6 6 2 4 5 4 3 4 4 2138 50 3 16227 381 1 7521 177 3 4133 97

Lake Taupo Long-Term Monitoring Programme 2007-2008 86
Lake Taupo phytoplankton species composition and biovolume (μm3) 2007-2008From Site A (Mid Lake) 30/10/2007
Sample code ZA1 ZA2 ZA3 ZA6 ZA8 ZA11 ZA16 ZA1 ZA2 ZA3 ZA6 ZA8 ZA11 ZA16Depth Surface 10m 20m 50m 70m 100m 150m Surface 10m 20m 50m 70m 100m 150m
Species composition by class cell cell cell cell cell cell cell Biovolume Biovolume Biovolume Biovolume Biovolume Biovolume Biovolume (per ml) (per ml) (per ml) (per ml) (per ml) (per ml) (per ml) (µm3) (µm3) (µm3) (µm3) (µm3) (µm3) (µm3)
Blue greens (Cyanophyceae)Anabaena lemmermannii 18.7 22.0 2.9 0.4 0.0 0.0 1.6 1683 1976 257 33 0 0 140
Chroococcus sp. 0.0 0.0 0.0 0.1 0.0 0.0 0.0 0 0 0 1 0 0 0Aphanocapsa sp. 0.0 0.0 0.0 6.9 0.0 5.8 6.6 0 0 0 62 0 52 59
Planktolyngbya sp. 21.3 0.0 0.0 0.0 0.0 0.0 0.0 192 0 0 0 0 0 0Pseudanabaena sp. 0.0 0.0 0.0 0.0 0.0 4.9 0.3 0 0 0 0 0 94 6
Greens (Chlorophyceae)Monoraphidium sp. / Ankistrodesmus falcatus 52 21 29 15 6 0 0 2187 885 1229 614 270 0 0
Stichococcus contortus 39 6 13 15 6 2 4 706 116 242 274 116 42 63Botryococcus braunii (colonies) 0 0 0 1 0 0 0 0 0 0 235139 0 804 0
Eudorina elegans 13 3 7 0 0 0 0 3295 749 1797 0 0 0 0 Crucigeniella sp. 0 2 8 5 5 0 0 0 152 532 304 304 0 0
Nephrocytium agardhianum 0 0 0 0 0 0 0 0 0 0 0 0 0 0Oocytsis sp. 9 4 0 1 0 9 1 1246 498 0 166 0 1246 166
Diatoms (Bacillariophyceae)Asterionella formosa 33 73 102 62 34 4 14 9173 20311 28665 17363 9500 983 3931
Aulacoseira granulata 15 37 91 25 9 25 13 4715 11606 28109 7617 2902 7617 4171Aulacoseira granulata var. angustissima 0 0 0 0 0 3 0 0 0 0 0 0 761 0
Cyclotella stelligera 6 8 22 9 5 9 10 1030 1217 3557 1404 842 1404 1591Fragilaria crotonensis 11 14 22 7 7 20 2 3770 5026 7958 2513 2513 7330 838
Nitzschia sp. 0 0 0 0 0 1 0 0 0 0 0 0 228 0
Desmids (Mesotaeniaceae, Desmidiaceae)Closterium aciculare 1 1 0 1 1 1 1 701 350 0 526 526 350 350
Closterium acutum var. variable 1 1 0 0 0 0 0 221 265 0 44 0 0 0
Chrysophtya (Chrysophyceae)Dinobryon sp. 275 182 227 135 108 1 0 16222 10734 13392 7938 6351 69 0
Cryptomonas sp. 0 0 1 1 0 0 0 0 0 168 168 0 0 0
Dinoflagellates (Dinophyceae)Gymnodinium sp. 1 0 1 1 1 1 0 0 0 3510 3510 1755 1755 0 0Gymnodinium sp. 2 0 1 0 1 0 0 0 0 14044 26750 1463 0 0 0
Flagellates 5µmFlagellates < 5µm/unicells 139 404 406 243 144 25 13 4853 14148 14210 8497 5037 860 450

Lake Taupo Long-Term Monitoring Programme 2007-2008 87
Lake Taupo phytoplankton species composition and biovolume (μm3) 2007-2008From Site A (Mid Lake) 17/04/2008
Sample code KA1 KA2 KA3 KA6 KA11 KA16 KA1 KA2 KA3 KA6 KA11 KA16Depth Surface 10m 20m 50m 100m 150m Surface 10m 20m 50m 100m 150m
Species composition by class cell cell cell cell cell cell Biovolume Biovolume Biovolume Biovolume Biovolume Biovolume (per ml) (per ml) (per ml) (per ml) (per ml) (per ml) (µm3) (µm3) (µm3) (µm3) (µm3) (µm3)
Blue greens (Cyanophyceae)Anabaena lemmermannii 44.8 46.9 24.3 0.0 6.5 1.4 4031 4220 2183 0 584 16
Pseudanabaena sp. 0.0 0.0 0.0 0.0 0.0 17.4 0 0 0 0 0 331
Greens (Chlorophyceae)Monoraphidium sp. / Ankistrodesmus falcatus 14 3 8 8 0 1 590 123 344 344 0 49
Stichococcus contortus 6 26 6 0 0 0 116 463 116 0 0 0Botryococcus braunii (colonies) 0 0 0 0 0 1 54 31352 6431 26908 1608 156759
Elakotothrix gelatinosa 0 1 1 0 1 0 0 154 123 0 123 0Eudorina elegans 0 6 0 0 0 0 75 1498 75 0 0 0 Crucigeniella sp. 0 0 0 1 0 0 0 0 0 76 0 0
Oocytsis sp. 2 10 2 0 2 1 332 1412 332 0 332 83Westella botryoides 0 0 0 0 0 0 0 0 0 8 0 0
Diatoms (Bacillariophyceae)Asterionella formosa 12 23 32 12 3 4 3276 6552 8935 3276 819 983
Aulacoseira granulata 5 16 5 12 5 9 1484 4946 1484 3808 1632 2720Cyclotella stelligera 2 6 2 5 1 1 340 936 340 749 94 94
Fragilaria crotonensis 4 10 39 1 1 1 1523 3427 14089 419 419 209Nitzschia sp. 0 0 22 0 0 0 0 0 8442 0 0 0
Small unknown diatom sp. 0 0 0 0 1 0 0 0 0 0 64 0
Desmids (Mesotaeniaceae, Desmidiaceae)Closterium aciculare 0 1 0 0 1 0 105 701 105 0 350 4
Closterium acutum var. variable 0 1 2 2 0 0 0 221 662 662 0 22
Chrysophtya (Chrysophyceae)Dinobryon sp. 64 164 101 0 0 0 3797 9664 5971 0 0 0
Cryptomonas sp. 1 1 1 3 0 0 84 84 84 421 0 0
Dinoflagellates (Dinophyceae)Gymnodinium sp. 1 1 1 1 0 0 0 3191 3191 3191 0 0 0Gymnodinium sp. 2 0 0 0 0 0 0 0 0 0 146 134 0
Flagellates 5µmFlagellates < 5µm/unicells 46 126 196 37 7 3 1619 4411 6850 1290 246 102

Lake Taupo Long-Term Monitoring Programme 2007-2008 88
Lake Taupo phytoplankton species composition and biovolume (μm3) 2006-2007From Site A (Mid Lake) 1/11/2006
Sample code HW1 HW3 HW6 HW11 HW16 HW1 HW3 HW6 HW11 HW16Depth surface 20 m 50 m 100 m 150 m surface 20 m 50 m 100 m 150 m
cell cell cell cell cell Biovolume Biovolume Biovolume Biovolume Biovolume (per ml) (per ml) (per ml) (per ml) (per ml) (µm3) (µm3) (µm3) (µm3) (µm3)
Species composition by classBlue greens (Cyanophyceae)
Anabaena lemmermannii 63 25 0 0 0 3488.1 1367 25 15 0Aphanocapsa sp. 0 0 2 3 0 0 0 14 31 0
Greens (Chlorophyceae)Botryococcus braunii (colonies) 0 0 0 0 0 5151 5901 7321 0 0
Chlorosarcinopsis sp. 3 0 2 2 0 259 0 182 208 0Eudorina elegans 2 5 6 0 0 621 1198 1498 0 0
Kirchneriella contorta 5 4 0 0 0 176 116 0 0 0Lagerheimia sp. 0 1 1 0 0 0 125 166 0 0
Monoraphidium sp. / Ankistrodesmus falcatus 3 0 0 0 0 143 0 0 0 0Oocytsis sp. 7 6 6 6 3 1034 872 831 831 415
Westella botryoides 0 0 7 0 0 0 0 0 0 0Diatoms (Bacillariophyceae)
Asterionella formosa 14 8 7 8 2 3806 2129 1884 2211 573Aulacoseira granulata 63 54 49 47 54 19413 16866 15052 14689 16594
Aulacoseira granulata var. angustissima 0 0 2 3 0 0 0 456 837 0Cyclotella stelligera 46 8 4 7 4 7301 1264 562 1123 655
Fragilaria crotonensis 5 0 2 8 3 1912 0 628 2723 1047Nitzschia sp. 2 1 1 0 0 947 342 342 0 0
Desmids (Mesotaeniaceae, Desmidiaceae)Closterium aciculare 0 0 0 0 0 0 35 175 0 0
Closterium acutum var. variable 0 0 0 0 0 0 0 110 0 0Chrysophtya (Chrysophyceae)
Dinobryon sp. 8 4 6 0 0 458 242 362 0 0Dinoflagellates (Dinophyceae)
Gymnodinium sp. 1 0 1 0 0 0 0 2633 1316 0 88Gymnodinium sp. 2 0 0 0 0 0 6068 0 0 0 0
Flagellates 5µmFlagellates < 5µm/unicells 50 19 31 23 4 1750 676 1085 788 143

Lake Taupo Long-Term Monitoring Programme 2007-2008 89
Lake Taupo phytoplankton species composition and biovolume (μm3) 2006-2007From Site A (Mid Lake) 2/04/2007
Sample code HW17 HW18 HW19 HW22 HW27 HW32 HW17 HW18 HW19 HW22 HW27 HW32Depth surface 10 m 20 m 50 m 100 m 150 m surface 10 m 20 m 50 m 100 m 150 m
cell cell cell cell cell cell Biovolume Biovolume Biovolume Biovolume Biovolume Biovolume (per ml) (per ml) (per ml) (per ml) (per ml) (per ml) (µm3) (µm3) (µm3) (µm3) (µm3) (µm3)
Species composition by classBlue greens (Cyanophyceae)
Anabaena lemmermannii 36 65 56 0 2 0 1493 2655 2286 5 86 10Greens (Chlorophyceae)
Botryococcus braunii (colonies) 1 0 0 0 0 0 27630 0 0 41446 0 0Monoraphidium sp. / Ankistrodesmus falcatus 49 17 17 0 1 0 2064 725 725 0 25 0
Oocytsis sp. 2 1 1 0 1 0 332 166 125 0 166 0Stichococcus contortus 0 0 0 0 0 1 0 0 0 0 0 21
Diatoms (Bacillariophyceae)Asterionella formosa 0 0 1 0 0 1 0 82 246 0 0 164
Aulacoseira granulata 2 0 0 5 11 8 544 0 0 1541 3264 2630Aulacoseira granulata var. angustissima 0 0 0 0 7 2 0 0 0 76 1901 608
Cyclotella stelligera 1 1 1 1 2 1 168 94 94 234 374 140Eunotia sp. 0 0 0 0 4 0 0 0 0 0 0 0
Fragilaria crotonensis 0 0 0 0 0 1 0 0 0 0 0 209Nitzschia sp. 2 0 1 0 0 0 799 114 228 0 0 0
Small unknown diatom sp. 0 0 0 0 1 0 0 0 0 0 64 0Desmids (Mesotaeniaceae, Desmidiaceae)
Closterium aciculare 0 0 0 1 4 0 0 0 0 350 2453 0Closterium acutum var. variable 0 0 0 1 0 0 0 0 0 331 0 0
Chrysophtya (Chrysophyceae)Cryptomonas sp. 0 1 1 4 0 0 0 211 126 590 0 0
Dinobryon sp. 0 0 0 1 0 0 0 0 0 86 0 0Dinoflagellates (Dinophyceae)
Gymnodinium sp. 1 1 0 0 0 0 0 2106 878 878 176 0 0Gymnodinium sp. 2 1 1 1 0 0 0 14625 21938 14625 0 0 0
Flagellates 5µmFlagellates < 5µm/unicells 185 97 84 127 16 10 6470 3389 2928 4433 573 338

Lake Taupo Long-Term Monitoring Programme 2007-2008 90
13. Appendix 6: Historical data
Historical data held by NIWA has frequently been referred to and included in some analysis or comparison of the data from the long-term monitoring programme. To ensure that this data is always readily available, copies of the relevant historical data are included in this report. These data are the spring and autumn profiles of NO3-N and DRP from 1974 to 1990 extracted from archived data books. The nitrate data for 27 September 1979 was taken from Vincent (1983). Subsequent data can be found in the appendices above.
Note that the profiles given are aligned with the spring data above the corresponding autumn data, by date. Note also that the early profiles were to a depth of 110 m rather than 150 m. Also, as there was no March or April data collected in 1976, for completeness, the last valid profile in that series (12 January 1976) has been included.
The elapsed time given is the number of days between the spring profile in about October and the autumn profile in March/April of the following year. The average elapsed time between the two samplings across all data from 1974 to 2006 is 165 days.
The historical data also include an un-paired profile from July 1987. As there were no data for April 1987 and the lake was still stratified in July, when the next period of monitoring began, the July 1987 may be used as an indication of the total mass of nutrient accumulation in that year. Because these data are for an un-paired profile in July and not April, if the data are converted to rate estimates the assumption must be made that there was no spring carryover and the elapsed time is longer being estimated as the average elapsed time plus three months.
Because the 1976 and 1987 data are for periods other than spring (October/November) to autumn (March/April), these data points have been excluded from any regression analysis of time-series data although the data points have been plotted as an indication of levels/rates for those years.

Lake Taupo Long-Term Monitoring Programme 2007-2008 91
Historical data from Site A in Lake TaupoNitrate concentrations (mg m-3) SpringDate 18/11/1974 16/10/1975 4/10/1977 10/10/1978 27/09/1979 5/10/1987 17/10/1988 6/10/1989Depth (m)
0 0.8 0.3 1.1 0.0 0.0 0.3 2.6 1.210 0.3 0.4 1.2 1.4 0.0 0.4 2.7 1.820 0.0 0.0 0.6 0.8 0.5 0.5 2.8 1.030 0.3 0.4 0.0 0.7 0.5 0.4 2.8 1.440 0.8 0.0 0.1 0.6 1.0 0.6 3.0 1.350 2.1 0.3 0.6 0.7 1.0 0.8 2.9 1.060 4.9 0.0 1.0 0.8 0.5 1.2 2.5 0.870 4.1 0.4 1.1 0.8 1.0 1.0 2.9 1.680 5.3 0.0 3.2 1.2 1.5 1.4 2.9 1.690 5.4 0.0 1.3 1.2 1.0 1.5 2.5 1.7
100 8.4 1.8 3.3 1.4 1.5 1.2 2.6 1.7110 12.0 4.1 2.8 1.4 1.5 6.0 2.4 0.8120 2.8 1.7 2.5 0.7 2.7 1.6130 2.7 2.1 5.0 1.2 2.7 1.1140 1.7 2.1 6.0 1.2 3.1 1.1150 1.4 2.5 7.0 1.1 2.4 0.3
AutumnDate 14/04/1975 12/01/1976 14/03/1978 10/04/1979 10/03/1980 7/07/1987 5/04/1988 4/04/1989 10/04/1990Depth (m)
0 0.8 0.5 0.0 0.3 0.0 2.0 1.1 2.1 0.110 0.4 1 0.0 0.0 0.3 1.6 1.3 2.5 0.620 0.2 0.2 0.0 0.0 0.0 1.0 1.3 2.4 1.330 0.1 0 0.0 0.0 0.0 0.2 1.1 2.5 1.240 0.3 0.2 0.0 0.3 0.2 0.9 2.2 2.4 1.750 0.5 0.3 0.0 1.0 0.8 1.1 4.0 4.9 4.960 4.2 1.3 0.0 7.3 4.9 14.5 12.3 5.2 3.470 5.6 1.5 2.2 11.1 6.2 16.4 14.6 5.1 12.080 9.2 8.3 4.9 12.7 9.4 16.1 16.9 10.9 11.290 11.2 11.1 5.8 13.5 13.5 18.5 19.0 13.5 12.4
100 12.4 14 7.4 15.0 14.4 19.8 20.7 17.1 17.1110 16.0 9.2 14.8 15.7 20.2 19.1 20.4 16.2120 10.1 15.0 16.7 20.9 18.6 23.3 18.2130 8.0 16.6 18.9 21.9 21.5 24.2 17.9140 11.0 17.3 19.4 22.1 25.4 27.1 22.4150 14.2 19.7 19.9 21.5 27.0 28.6 24.2
DRP concentrations (mg m-3) SpringDate 18/11/1974 16/10/1975 4/10/1977 10/10/1978 5/10/1987 17/10/1988 6/10/1989Depth (m) ???
0 8.7 1.1 0.3 0.6 0.2 0.2 0.010 8.0 1.2 0.0 0.6 0.1 0.1 0.220 8.3 1.1 0.1 0.5 0.2 0.0 0.130 7.5 0.9 0.0 0.3 0.3 0.1 0.040 8.4 0.8 0.3 0.2 0.2 0.1 0.050 7.6 0.8 0.2 0.3 0.4 0.1 0.060 8.3 0.7 0.0 0.3 0.3 0.2 0.070 7.7 0.7 1.1 0.4 0.3 0.2 0.080 8.1 0.8 0.7 0.5 0.3 0.2 0.390 7.9 1.0 0.8 0.4 0.2 0.3 0.1
100 8.5 1.7 0.4 0.4 0.2 0.3 0.1110 9.8 1.6 0.4 0.4 0.4 0.5 0.1120 0.5 0.4 0.4 0.4 0.0130 0.4 0.3 0.4 0.4 0.2140 0.6 0.3 0.4 0.5 0.3150 0.5 0.4 0.3 0.5 0.2
AutumnDate 14/04/1975 12/01/1976 14/03/1978 10/04/1979 10/03/1980 7/07/1987 5/04/1988 4/04/1989 10/04/1990Depth (m)
0 0.8 1.4 0.2 0.1 0.7 1.9 0.1 0.0 0.210 0.5 1.4 0.2 0.1 0.4 2.2 0.1 0.0 0.020 0.5 7.0 0.2 0.1 0.3 0.9 0.2 0.0 0.130 0.5 2.5 0.2 0.1 0.2 1.0 0.2 0.0 0.240 0.5 0.2 0.2 0.4 0.5 0.9 0.6 0.2 0.550 0.5 0.9 0.7 1.0 0.7 0.7 1.1 0.5 1.160 1.0 0.1 0.7 1.6 1.0 3.4 2.0 0.6 0.970 1.0 0.8 1.0 2.0 1.1 3.7 2.2 0.9 1.980 1.7 1.2 1.5 2.2 1.6 3.6 2.7 1.1 1.790 2.0 2.0 1.8 2.4 2.2 4.1 2.9 1.3 1.8
100 2.2 3.3 1.9 2.7 2.4 4.6 3.1 1.9 2.6110 2.9 2.4 2.8 2.6 4.5 2.9 2.7 2.1120 2.7 2.9 2.7 4.7 3.0 3.4 2.5130 2.1 3.0 3.7 5.1 3.4 3.8 2.4140 2.8 3.6 3.6 5.3 4.4 4.5 3.5150 0.9 3.8 3.8 5.0 4.6 4.8 4.0
Elapsed period (days) 147 88 161 182 165 270* 183 169 186
??? = possible analytical problem (e.g., Si interference)* = average period of 165 days plus 3 months