lake-effect over lakes smaller than the great lakes image:18 jan. 2003 burlington, vt neil laird...
TRANSCRIPT
Lake-Effect over Lakes Smaller than the Great Lakes
Image:18 Jan. 2003 Burlington, VT
Neil LairdAssociate ProfessorDepartment of Geoscience, Hobart & William Smith Colleges, Geneva, NY
Acknowledgement:
Jared Desrochers, Indiana Univ. Melissa Payer, Univ. at Albany
Ryan Sobash, Oklahoma Univ. Natasha Hodas, Rutgers Univ.
Jessica Popp, William Smith College Benjamin Albright, Penn State Univ.
Sara Ganetis, Univ. at Albany Andrew Stieneke, N. C. State Univ.
Alicia Bentley, Univ. at Albany Samantha Santeiu, Iowa State Univ.
Portions of this research were completed as part of the 2005, 2006, 2007, 2009 and 2010 undergraduate summer research program at Hobart & William Smith Colleges. Funding for these projects were provided by the National Science Foundation and the Provost's Office of Hobart & William Smith Colleges.
Image courtesy of CAMNET operated by the Northeast States for Coordinated Air Use Management
Lake-Effect over Small Lakes – Why should we care?
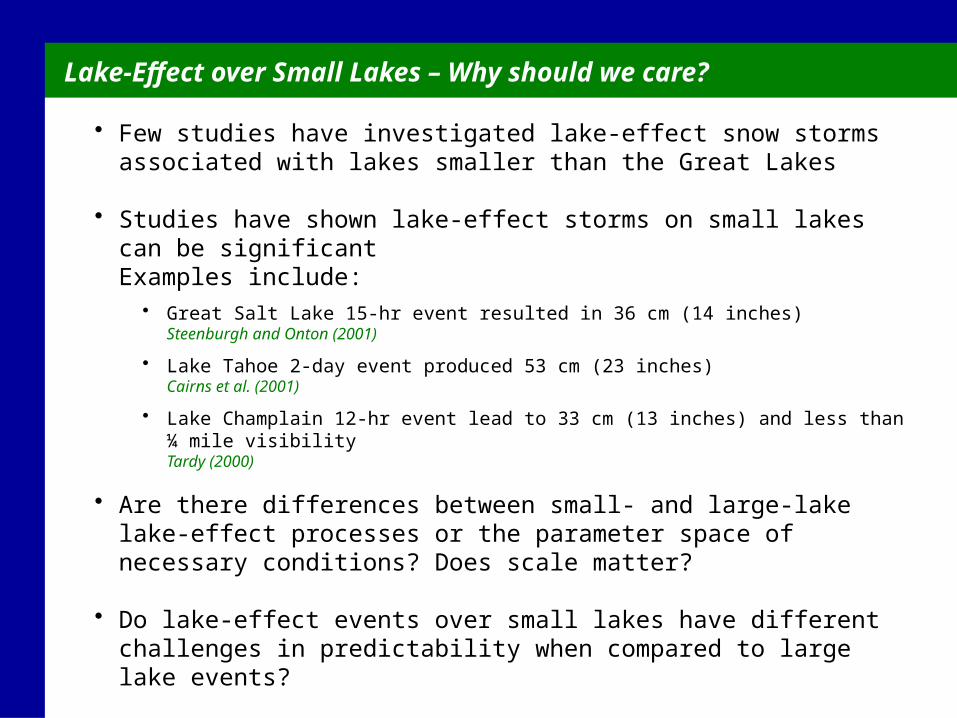
• Few studies have investigated lake-effect snow storms associated with lakes smaller than the Great Lakes
• Studies have shown lake-effect storms on small lakes can be significantExamples include:
• Great Salt Lake 15-hr event resulted in 36 cm (14 inches)Steenburgh and Onton (2001)
• Lake Tahoe 2-day event produced 53 cm (23 inches) Cairns et al. (2001)
• Lake Champlain 12-hr event lead to 33 cm (13 inches) and less than ¼ mile visibilityTardy (2000)
• Are there differences between small- and large-lake lake-effect processes or the parameter space of necessary conditions? Does scale matter?
• Do lake-effect events over small lakes have different challenges in predictability when compared to large lake events?
• Small lake environment likely more sensitive to climate variations than large lake systems (mesoscale - climate connection)
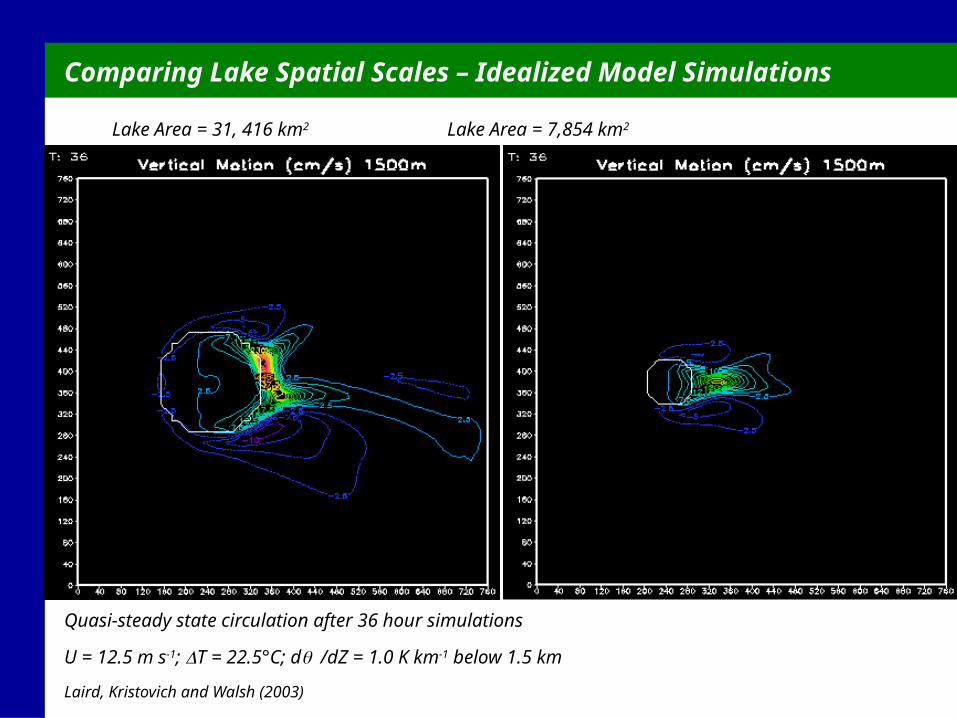
Comparing Lake Spatial Scales – Idealized Model Simulations
Lake Area = 31, 416 km2 Lake Area = 7,854 km2
Quasi-steady state circulation after 36 hour simulations
U = 12.5 m s-1; DT = 22.5°C; d q /dZ = 1.0 K km-1 below 1.5 km
Laird, Kristovich and Walsh (2003)
Carpenter, D.M., 1993: The Lake Effect of the Great Salt Lake: Overview and Forecast Problems. Wea. Forecasting, 8, 181–193.
Steenburgh et al., 2000: Climatology of lake-effect snowstorms of the Great Salt Lake. Mon. Wea. Rev., 128, 709–727.
Steenburgh and Onton, 2001: Multiscale Analysis of the 7 December 1998 Great Salt Lake–Effect Snowstorm. Mon. Wea. Rev., 129, 1296–1317.
Onton and Steenburgh, 2001: Diagnostic and Sensitivity Studies of the 7 December 1998 Great Salt Lake–Effect Snowstorm. Mon. Wea. Rev., 129, 1318–1338.
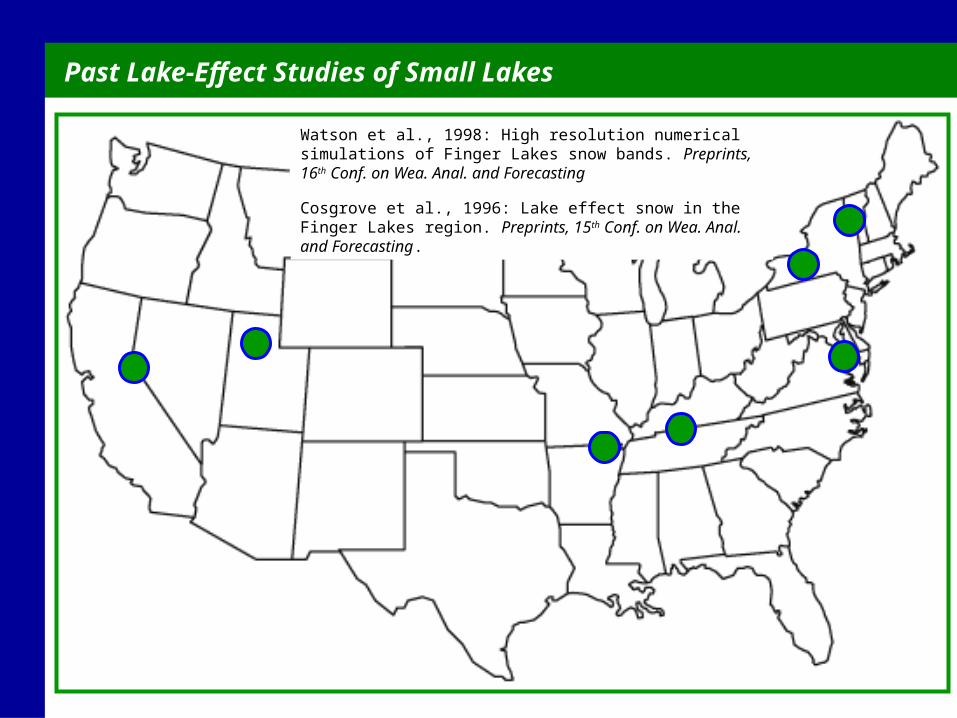
Past Lake-Effect Studies of Small Lakes
Tardy, 2000: Lake effect and lake enhanced snow in the Champlain Valley of Vermont. NWS/NOAA technical attachment (NO. 2000-05). 27 pp.
Wilken, 1997: A lake-effect snow in Arkansas. NWS/NOAA technical attachment (SR/SSD 97-21). 3 pp.Sikora and Halverson, 2002: Multiyear observations of cloud lines associated with the Chesapeake and Delaware Bays. J. Appl. Meteor., 41, 825-831.
Schultz et al., 2004: Snowbands during the cold-air outbreak of 23 January 2003. Mon. Wea. Rev., 132, 827-842.Huggins et al., 2001: A lake effect snowfall in Western Nevada - Part II: Radar Characteristics and quantitative precipitation estimates. Preprints, 18th Conf. on Weather Analysis and Forecasting/14th Conf. on Numerical Weather Prediction.
Watson et al., 1998: High resolution numerical simulations of Finger Lakes snow bands. Preprints, 16th Conf. on Wea. Anal. and Forecasting
Cosgrove et al., 1996: Lake effect snow in the Finger Lakes region. Preprints, 15th Conf. on Wea. Anal. and Forecasting.
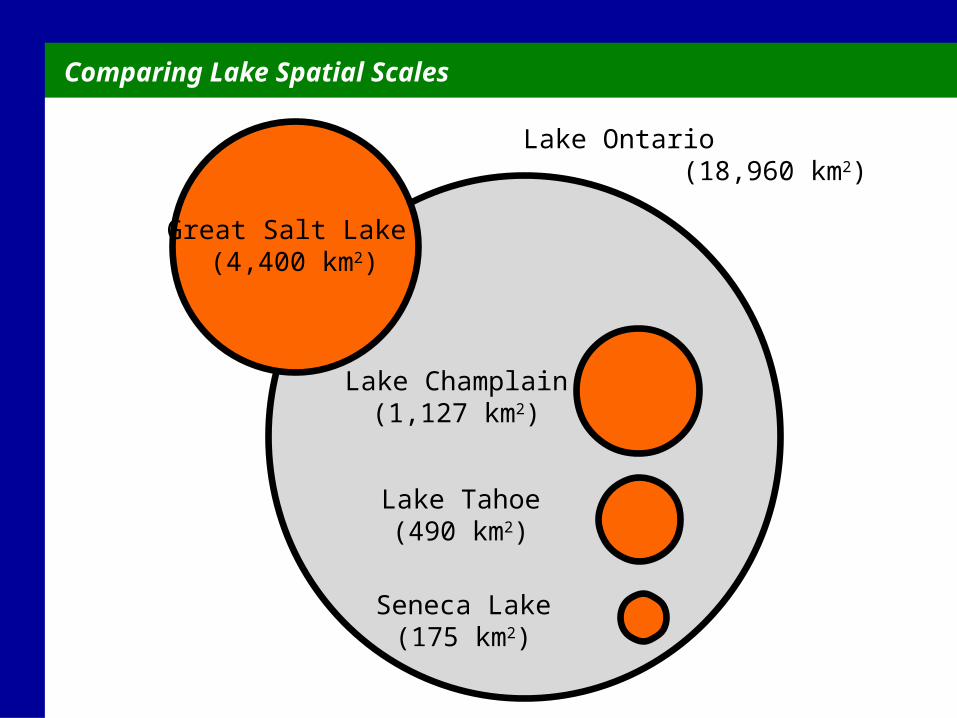
Comparing Lake Spatial Scales
Lake Tahoe(490 km2)
Lake Ontario (18,960 km2)
Great Salt Lake (4,400 km2)
Lake Champlain(1,127 km2)
Seneca Lake(175 km2)

Lake Champlain & New York State Finger Lakes
Lake Champlain
EasternNYS Finger Lakes
EasternLake Ontario
satellite map courtesy of Google Maps
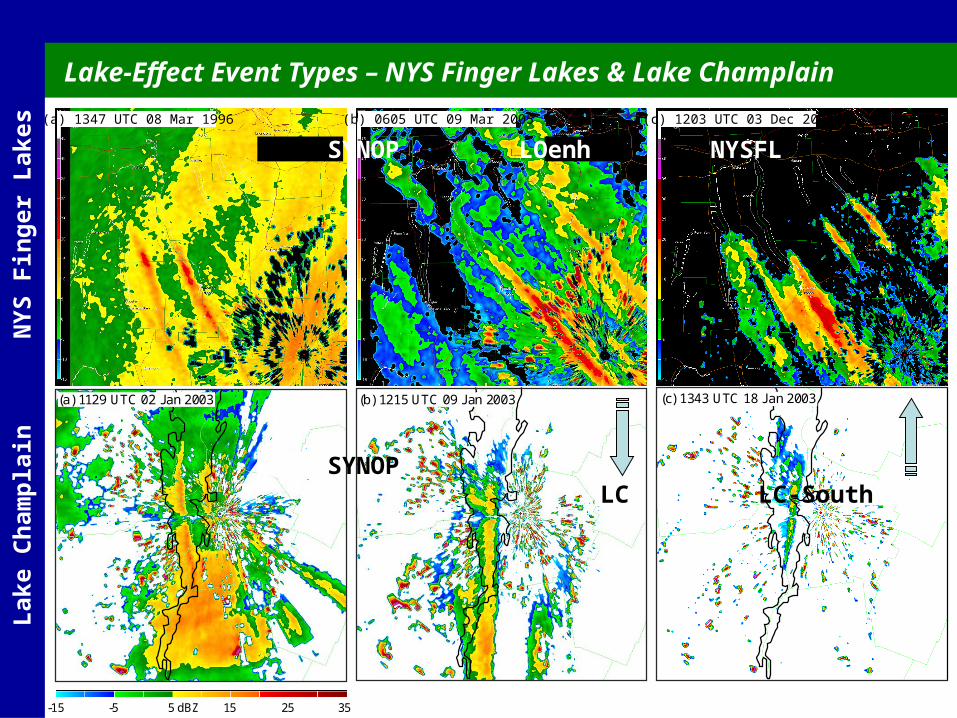
Lake-Effect Event Types – NYS Finger Lakes & Lake Champlain
Lak
e C
ham
pla
inN
YS
Fin
ger
Lak
es
(a) 1129 UTC 02 Jan 2003 (b) 1215 UTC 09 Jan 2003 (c) 1343 UTC 18 Jan 2003
-15 -5 5 dBZ 15 25 35
(a) 1347 UTC 08 Mar 1996 (c) 1203 UTC 03 Dec 2003(b) 0605 UTC 09 Mar 2005
SYNOP LOenh NYSFL
SYNOP LC LC-South

Lake-Effect Frequency – Lake Champlain & NYS Finger Lakes
N o
f C
ham
pla
in
N o
f N
YS
Fin
ger
Lak
es
Laird, Desrochers and Payer (2009)Laird, Sobash and Hodas (2009)
NYS Finger Lakes Lake Champlain (11 winters) (9 winters)
2.92.7
1.9
1.0
1.5
1.3
2.0
3.9
0.9

Finger Lakes Lake-Effect Frequency – Individual Lakes

Lake-Effect Event Duration & Timing
End Time
Start Time
75%
Duration
Mean: 9.4 hrs
50454035302520151050
Duration (hours)
15
10
5
0
Freq
uenc
y
Mean =13.0117Std. Dev. =9.24561
N =60
75%
90%
Event Duration
0:0018:0012:006:000:00
Start Time (UTC)
14
12
10
8
6
4
2
0
Start Time
0:0018:0012:006:000:00
End Time (UTC)
14
12
10
8
6
4
2
0
End Time
NYS Finger Lakes Lake Champlain
Mean: 12.1 hrs

Lake-Effect Event – Finger Lakes – SLP composites
NYSFL
HL
LOenh
HL
SYNOPH
L

Lake-Effect Event – Lake Champlain – SLP composites
(a) (b)SYNOP - Sea-Level Pressure (hPa) SYNOP - Surface Temperature (C)
H
L
(d)(c)LC-North - Sea-Level Pressure (hPa) LC-North - Surface Temperature (C)
HL
(e) (f)LC-South - Sea-Level Pressure (hPa) LC-South - Surface Temperature (C)
H
L

Lake Champlain & New York State Finger Lakes
Lake Champlain
EasternNYS Finger Lakes
EasternLake Ontario
SYRROC
PEO
ITH
BTV
PLB
CHYU
VMCR
satellite map courtesy of Google Maps

Surface Temperatures (based on hourly observations during events)
NYS Finger Lakes Lake Champlain

Lake – Air Temperature Difference
NYS Finger Lakes Lake Champlain
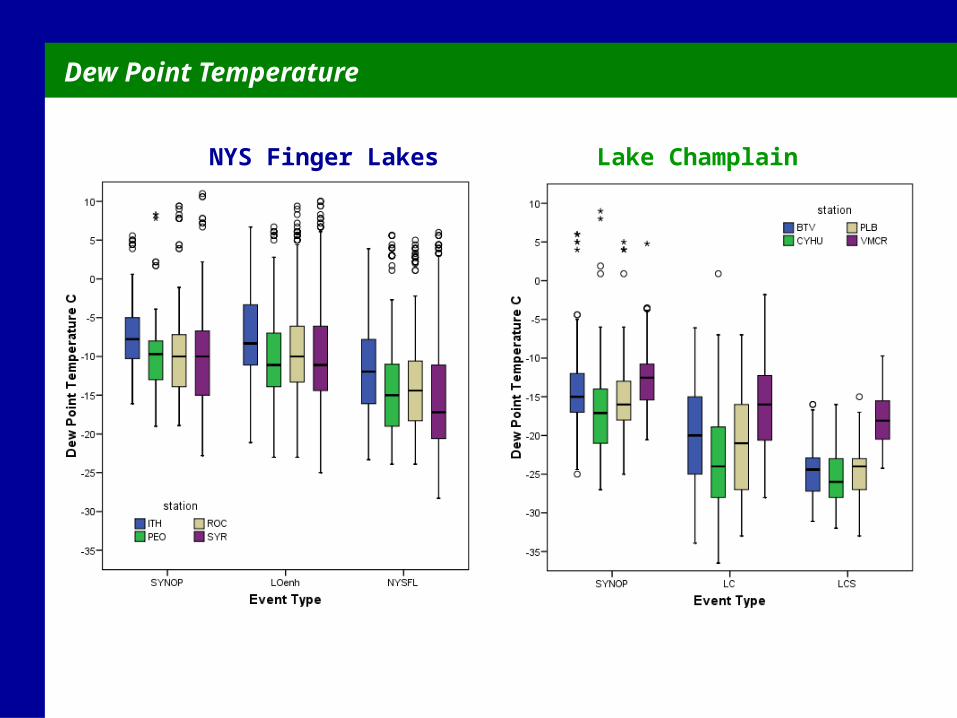
Dew Point Temperature
NYS Finger Lakes Lake Champlain
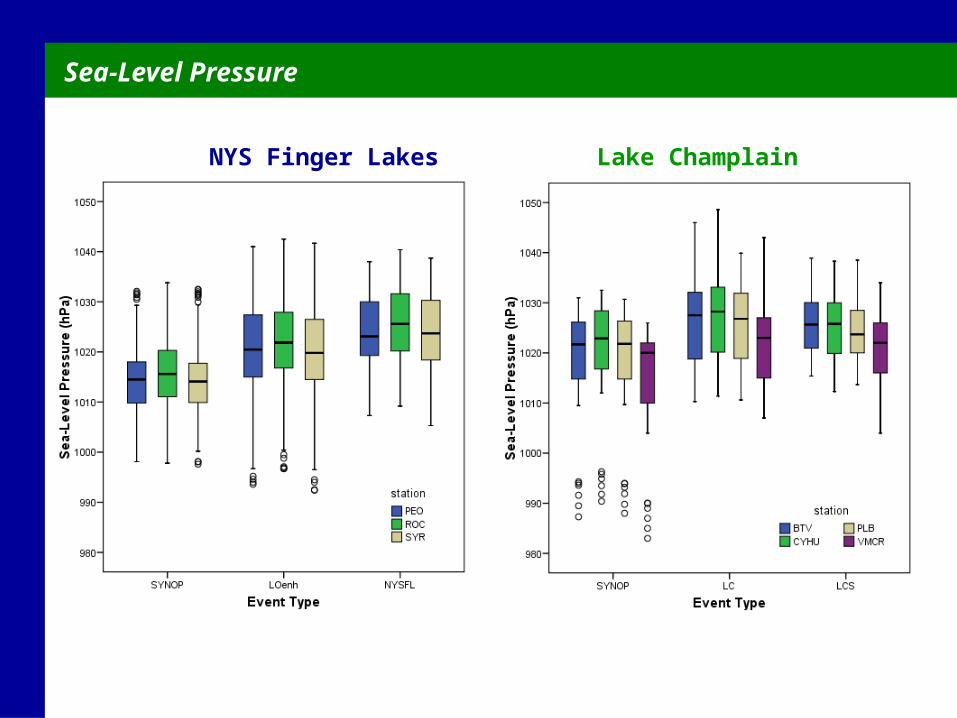
Sea-Level Pressure
NYS Finger Lakes Lake Champlain
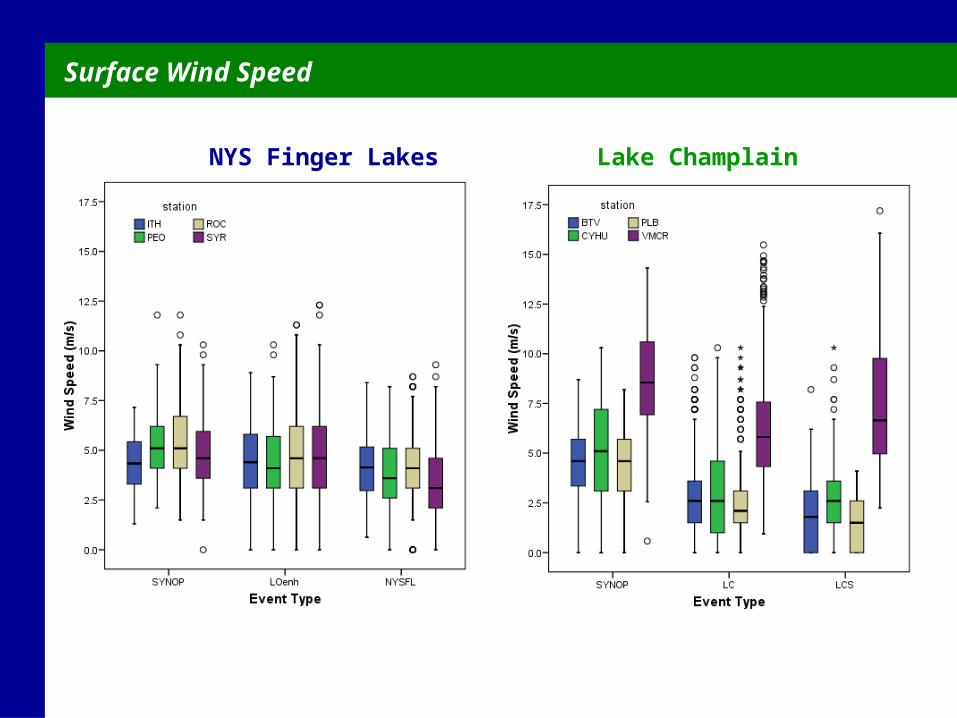
Surface Wind Speed
NYS Finger Lakes Lake Champlain

Finger Lakes Lake-Effect: Depth of Stable Layer
(a) 1347 UTC 08 Mar 1996 (c) 1203 UTC 03 Dec 2003(b) 0605 UTC 09 Mar 2005
SYNOP LOenh NYSFL

Finger Lakes Lake-Effect
Enhanced Lake Ontario Event
Finger Lakes Event
Lake Ontario convection extends inland and weakens slightly from increased friction
Enhancement of Lake Ontario bands by individual Finger Lakes
Lake Ontario snow bands develop (typically HCRs with northerly flow)
Lake Ontario convection weakens & dissipates from increased friction and lowered mix layer
Isolated Finger Lakes snow bands develop
Lake Ontario snow bands develop (typically HCRs with northerly flow)
Upwind temperature profile w/ deep surface inversion layer
Upwind temperature profile w/ shallow surface inversion layer
North South
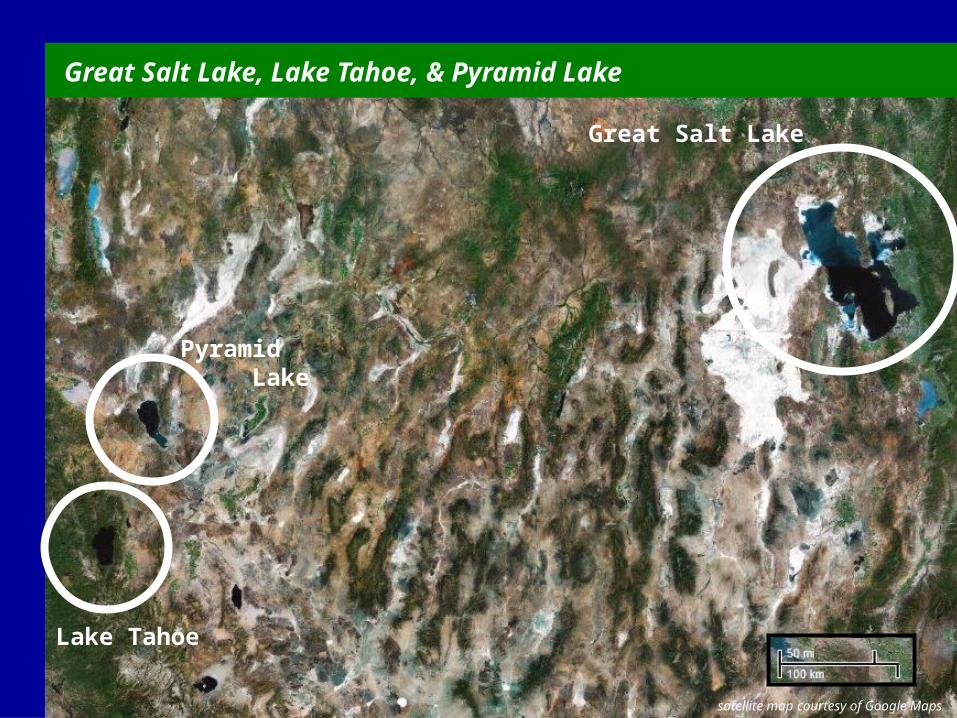
Great Salt Lake, Lake Tahoe, & Pyramid Lake
Great Salt Lake
Lake Tahoe
Pyramid Lake
satellite map courtesy of Google Maps
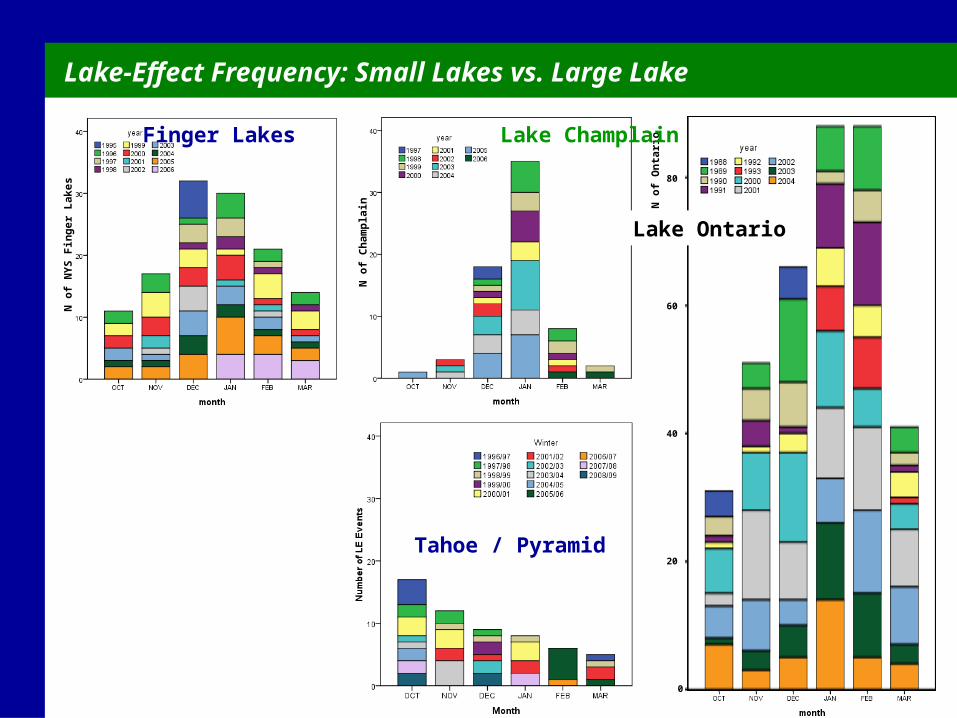
Lake-Effect Frequency: Small Lakes vs. Large Lake
N o
f C
ham
pla
in
N o
f N
YS
Fin
ger
Lak
es
80
60
40
20
0
N o
f O
nta
rioFinger Lakes Lake Champlain
Lake Ontario
Tahoe / Pyramid

Summary
• Lake-effect occurs on NYS Finger Lakes with an average of 11 events per winter• Lake Champlain - 7 events per winter• Lake Tahoe / Pyramid Lake - 4 events per winter
• Although NYS Finger Lakes are smaller than Lake Champlain, favorable lake-effect forcing conditions are more easily reached more events
• Attribute to Lake Ontario being upstream providing source of heat, moisture and pre-existing lake-effect circulations
• Lake-effect type and associated conditions linked to evolutional stage of synoptic pattern and southward establishment of polar air mass
• SYNOP LOenh NYSFL (NYS Finger Lakes)• SYNOP LC-North LC-South (Lake Champlain)
• Narrow set of conditions necessary for lake-effect on small lakesOpen question: How do these compare to Great Lakes lake-effect conditions?Open question: What is the predictability of small lake LE events? Null cases?
• Link between mesoscale events and regional climate variabilityOpen question: Given the narrow set of conditions for lake-effect on small lakes, can the frequency and variability of these events be an indicator for changes in climate or demonstrate what might happen with regional climate changes?