kms technologies – kjt enterprises...
TRANSCRIPT
KMS Technologies – KJT Enterprises Inc.
Wang, Z., Martinez, Y., Strack, K., and Yu, G.
Applications of NMR Mud Logging technology in China
2007
Publication copy
SPWLA 48th Annual Logging Symposium, Expanded Abstract, X
SPWLA 48th Annual Logging Symposium, June 3-6, 2007
1
APPLICATIONS OF NMR MUD LOGGING TECHNOLOGY IN CHINA
Zhizhan Wang, Department of Geology, Northwest University
Geologging Company, Shengli Oil Field
Yardenia Martinez, Kurt Strack, and Gang Yu, KMS Technologies
Copyright 2007, held jointly by the Society of Petrophysicist and Well Log
Analysts (SPWLA) and the submitting authors.
This paper was prepared for presentation at the SPWLA 48th Annual Logging
Symposium held in Austin, Texas, United States, June 3-6, 2007.
ABSTRACT Nuclear Magnetic Resonance (NMR) mud logging technology has been widely used in Chinese oilfields and successfully solved many critical problems such as low SNR from small cuttings, well site reservoir characterization, rapid formation evaluation, and long sample preparation time for conventional core measurement. This technology realizes the transformation of reservoir petrophysical analysis from laboratory to drilling site, and extends the analysis samples from conventional cores to small fresh cuttings, sidewall cores and formation fluids. The formation petrophysical properties of small cuttings measured by NMR mud logging system include total porosity, effective porosity, absolute permeability, probable minimum and maximum permeability, irreducible water (liquid) saturation Swirr, free water (fluid) saturation, oil saturation, etc. When used in the laboratory, it can deliver the most standard NMR petrophysical parameters. In addition, mud logging NMR has many advantages such as small sample quantity, short analysis time, low cost, nondestructive, multiple parameters from a single sample, high accuracy, excellent repeatability, measurement and analysis while drilling. It is a low-cost alternative for log calibration and even a replacement when it is difficult to obtain NMR logs from a wireline tool.
With NMR mud logging we can effectively evaluate the formation petrophysical properties, reserve and capacity of interstitial liquid by rapidly and accurately analyzing petrophysical parameters, such as porosity, permeability, FFI, BVI, oil saturation, etc., from cuttings, core plugs and sidewall cores on the drilling site, and then provide valuable and critical information for onsite decision-making of drilling and well completion. In recent years, a few thousands of cuttings and core samples have been measured by the NMR mud logging system and excellent application results of this technology have been achieved in such aspects as petrophysics evaluation, pore structure evaluation, pore fluid features evaluation, testing layer determination, and geopressure evaluation. The technology has been incorporated in the mud logging industry in six Chinese oilfields. INTRODUCTION Oil and gas reservoirs are the formation of interest in exploration and production (E&P) activities; its properties controls hydrocarbon reserves, output and production capacities (Fang et al., 2003). Reservoir evaluation is very important in the course of E&P. With the rapid development of E&P technologies and the improvements of drilling techniques, the drilling rate is getting faster. At the same time, drilling cost (especially offshore) is increasing. Therefore, we must improve the reliability and authenticity of well evaluation results, as well as turn-around time.
X

SPWLA 48th Annual Logging Symposium, June 3-6, 2007
2
Often, reservoir evaluation data comes from core analysis done in the laboratory or from well log interpretation. Limited by the availability of cores, the data volume of conventional core analysis is very small, and the analysis turn-around is slow. Especially, clay bound water and capillary bound water of core samples could not be measured by conventional core analysis techniques (Wang et al., 2005). Well logging is only conducted after the well has been drilled and completed, the timelines and accuracy can not meet the demands of E&P. Although some models have been developed to quantitative evaluate the reservoir formation at the well site, one model is only for one parameter such as porosity or permeability. In the past, measuring the NMR petrophysical properties of drill cuttings has been very difficult because small rock samples yield only a small NMR signal which corresponds to a small signal-to-noise ratio and the procedures for sample preparation and processing did not allow fast enough turn-around time. The combination of these two factors prevented NMR measurement of drill cuttings from becoming a mud logging routine. From technical viewpoint, it is demanded to rapidly evaluate petrophysical parameters and interstitial liquid characteristics on the drilling site. NMR mud logging technology has been developed during the last two decades, and the latest one successfully solves key problems as low SNR from the samples and long sample preparation time. This technology realized the transfer of petrophysical analysis from laboratory to drill site, and extended the analysis samples from cores to cuttings, sidewall core and fluid. The parameters measured by NMR mud logging system includes total porosity, effective porosity, permeability, irreducible water saturation, free fluid saturation, oil saturation, and oil content in drilling fluid. In addition, the system has many advantages such as small dosage of sample, rapid analysis speed, low cost, nondestructive, many parameters for one sample, high accuracy, strong continuity, and analysis while drilling. It has become the best and fastest
reservoir evaluation technology currently available in the industry. NMR mud logging technology is widely used by the Geologging companies, research institutes, oil fields as Shengli, Liaohe, Jilin, Tuha, etc. in China. Recent progress in Low Field NMR applications brought forward more effective methods for petrophysics evaluation, pore structure evaluation, pore fluid features evaluation, geopressure evaluation, and testing layer determination. While the work was mostly done for the core plugs, similar approaches can be applied for NMR measurements on cuttings. PETROPHYSICS EVALUATION
The petrophysical information from cuttings depends on the size of cuttings that are available for measurements. Recent studies on cuttings for acoustic parameters of rocks demonstrated the ability to use cuttings as small as 1 mm. Porosity and permeability are the most important parameters for petrophysical evaluation of reservoir formation. Oil and gas reserves depend on reservoir porosity and geometry of the reservoir (reservoir capacity), while filtration ability/mobilization of hydrocarbons depends on permeability of the reservoir (for produced hydrocarbons) and regimes of the reservoir exploitation. Porosity evaluation: When the pore space of a sample is saturated with 100% fluid, total porosity includes the pore space occupied by clay bound fluid, capillary bound fluid and movable fluid. If the times between echoes, TE (the time between two sequential 180-degree in the CPMG sequence) larger than 0.3 ms, the information from small pores will be partially lost, so the total porosity is not accurate (Mirotchnik et al., 2001). Total porosity is independent of T2 cutoff value. Effective porosity is the rate between the volume
SPWLA 48th Annual Logging Symposium, June 3-6, 2007
3
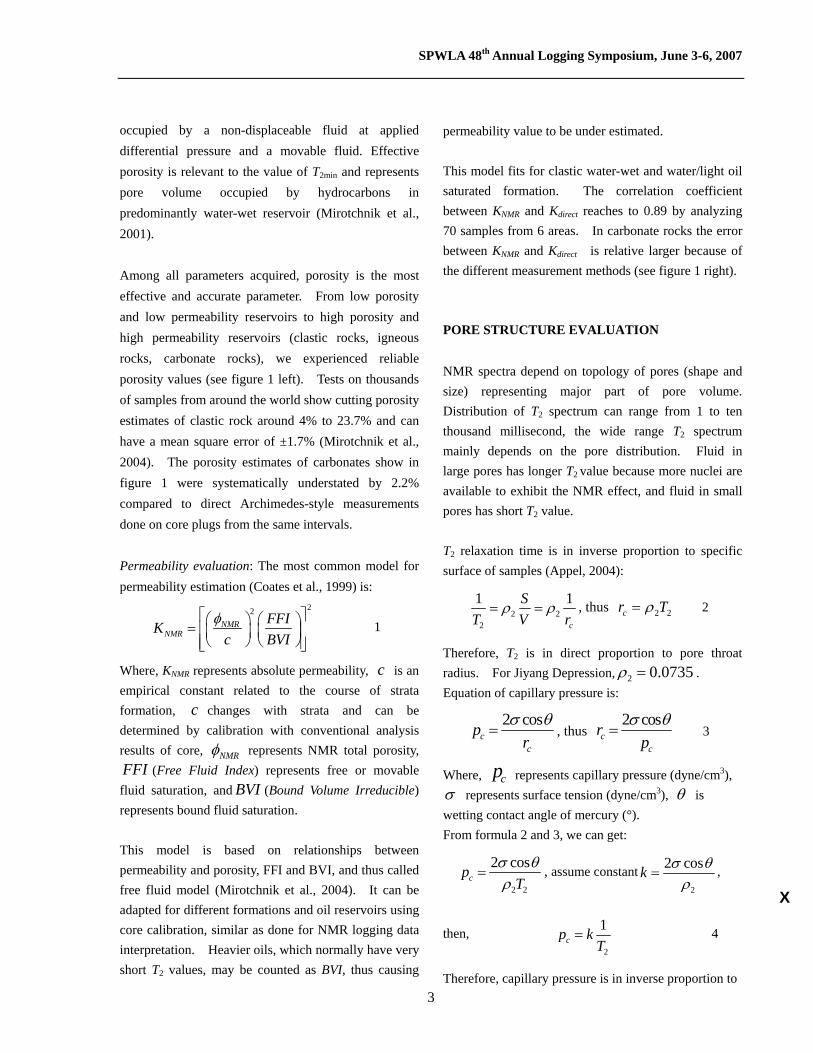
occupied by a non-displaceable fluid at applied differential pressure and a movable fluid. Effective porosity is relevant to the value of T2min and represents pore volume occupied by hydrocarbons in predominantly water-wet reservoir (Mirotchnik et al., 2001). Among all parameters acquired, porosity is the most effective and accurate parameter. From low porosity and low permeability reservoirs to high porosity and high permeability reservoirs (clastic rocks, igneous rocks, carbonate rocks), we experienced reliable porosity values (see figure 1 left). Tests on thousands of samples from around the world show cutting porosity estimates of clastic rock around 4% to 23.7% and can have a mean square error of ±1.7% (Mirotchnik et al., 2004). The porosity estimates of carbonates show in figure 1 were systematically understated by 2.2% compared to direct Archimedes-style measurements done on core plugs from the same intervals. Permeability evaluation: The most common model for permeability estimation (Coates et al., 1999) is:
22NMR
NMRFFIK
c BVIφ⎡ ⎤⎛ ⎞ ⎛ ⎞= ⎢ ⎥⎜ ⎟⎜ ⎟
⎝ ⎠⎝ ⎠⎢ ⎥⎣ ⎦ 1
Where, KNMR represents absolute permeability, c is an empirical constant related to the course of strata formation, c changes with strata and can be determined by calibration with conventional analysis results of core, NMRφ represents NMR total porosity, FFI (Free Fluid Index) represents free or movable fluid saturation, and BVI (Bound Volume Irreducible) represents bound fluid saturation. This model is based on relationships between permeability and porosity, FFI and BVI, and thus called free fluid model (Mirotchnik et al., 2004). It can be adapted for different formations and oil reservoirs using core calibration, similar as done for NMR logging data interpretation. Heavier oils, which normally have very short T2 values, may be counted as BVI, thus causing
permeability value to be under estimated. This model fits for clastic water-wet and water/light oil saturated formation. The correlation coefficient between KNMR and Kdirect reaches to 0.89 by analyzing 70 samples from 6 areas. In carbonate rocks the error between KNMR and Kdirect is relative larger because of the different measurement methods (see figure 1 right). PORE STRUCTURE EVALUATION NMR spectra depend on topology of pores (shape and size) representing major part of pore volume. Distribution of T2 spectrum can range from 1 to ten thousand millisecond, the wide range T2 spectrum mainly depends on the pore distribution. Fluid in large pores has longer T2 value because more nuclei are available to exhibit the NMR effect, and fluid in small pores has short T2 value. T2 relaxation time is in inverse proportion to specific surface of samples (Appel, 2004):
2 22
1 1
c
ST V r
ρ ρ= = , thus 2 2cr Tρ= 2
Therefore, T2 is in direct proportion to pore throat radius. For Jiyang Depression, 2 0.0735ρ = . Equation of capillary pressure is:
2 cosc
c
pr
σ θ= , thus
2 cosc
c
rp
σ θ= 3
Where, cp represents capillary pressure (dyne/cm3), σ represents surface tension (dyne/cm3), θ is wetting contact angle of mercury (°). From formula 2 and 3, we can get:
2 2
2 coscp
Tσ θρ
= , assume constant2
2 cosk σ θρ
= ,
then, 2
1cp k
T= 4
Therefore, capillary pressure is in inverse proportion to
X

SPWLA 48th Annual Logging Symposium, June 3-6, 2007
4
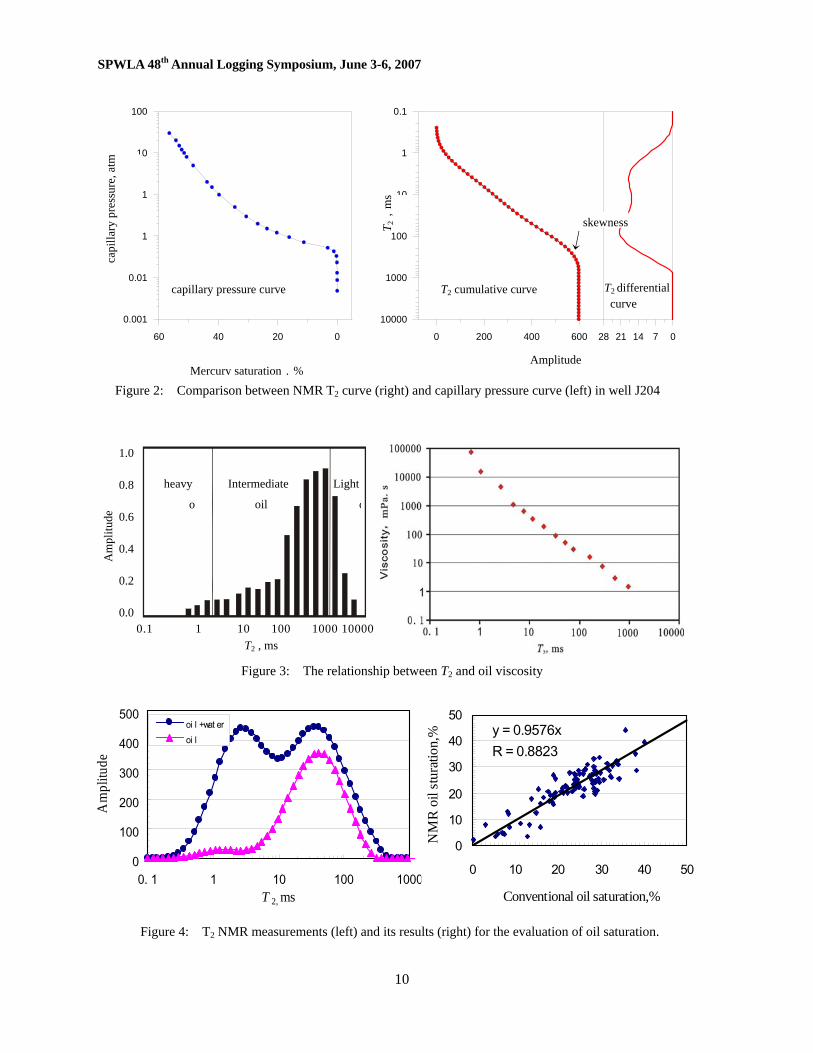
T2. For Jiyang Depression, 10k = . T2 differential curves (T2 spectra) have good relationship with the distribution of pore and pore throat radii. Generally, wider distribution range of T2 spectrum and lower amplitudes represent poor sorting of pores and smaller pore throat (He et al., 2005). In addition, higher amplitudes for higher T2 cutoff values represent larger pores, and thus the reservoir formation is potentially better. T2 cumulative curves have good relationship with capillary pressure curves. The shape of T2 cumulative curves looks like a step, the position of skewness represents the size of pore and pore throats, and the length of horizontal line represents the pore sorting and pore throats. Different samples have different pore structure, and the same for the lithology. These differences lead to the difference of T2 differential curves and cumulative curves. Therefore, the size, sort and distribution of pore throats can be evaluated according to T2 curves of saturated samples. Seeing from a sand sample from the depth of 3800.9 m of well J204 in Huimin Sag, T2
curves match capillary pressure curves very well because capillary pressure is in inverse proportion to T2; both curves have such features as little coarse skewness, poor pore sorting and pore throat from medium to big pores as shown in figure 2. Distribution of pores and pore throat is also represented by T2 geometric mean. Good correlation can be seen between T2 geometric mean and pore throat mean from mercury-injection measurements under high mineralization of water saturating samples. Because the two different methods represent two different topological parameters of porous media (pore nodes (NMR) and pore throats (Mercury Injection)), the results are related to two different physic-chemical environments regarding surface/fluid interaction. Therefore a certain degree of data mismatches by both methods is expected.
EVALUATION ON PORE FLUID PROPERTY Unlike many other methods, NMR is most suitable to study the fluids inside the pore space. We focus on the hydrocarbon related key fluids properties, but certainly not just limited to these. FFI and BVI: In a unit pore volume, volume percent accounted by movable fluid is named free fluid index (FFI). In a similar way, volume percent accounted by bound fluid is named bound volume irreducible (BVI).
2 max
2
2max
0
( )100%
( )cutoff
T
TT
A t dtFFI
A t dt= ×∫∫
5
2
2max
0
0
( )100%
( )
cutoffT
T
A t dtBVI
A t dt= ×∫∫
6
Where, ( )A t is signal amplitude when transverse relaxation time is t or T2 (Wang, et al., 2006). A total of 15 samples were tested for BVI with a correlation coefficient between NMR results and direct analysis results of 0.98. Oil property: Oil viscosity is inversely correlated to relaxation time (Freedman et al., 2004). Heavier oiliness means shorter relaxation time, and vice versa as shown in figure 3. After NMR instrument is correctly calibrated, we can calculate oil viscosity according to relaxation time yielding a quantitative oil property characterization. Oil saturation: Several steps yield oil saturation: First, we test the sample under the condition that the pore space is fully saturated by brine, and we measure the total signal of oil and water; second, we dip these samples in manganese chloride solution with 10000 mg/l concentration. Manganese chloride is a paramagnetic substance, and can help eliminating water signal. Then we test the manganese chloride saturated sample again to obtain oil signal (figure 4). We can derive the oil saturation by following calculation (Wang,

SPWLA 48th Annual Logging Symposium, June 3-6, 2007
5
et al., 2006): 2 max
2 max
o0
ow0
( )100% 100%
( )
T
t oo T
t
A t dtS
A t dt
φφ−= × = ×∫
∫ 7
Where, So is oil saturation, Aow represents oil and water signal amplitude at first test when transverse relaxation time is t, Ao represents oil signal amplitude at second test when transverse relaxation time T2 is t, t oφ − is the total porosity at second test, and tφ is total porosity at first test. The analysis results in Shengli Oil Field show that the relative difference between NMR oil saturation of cuttings and the conventional oil saturation is generally less than 10%, and correlation coefficient reaches up to 0.88 (compare figure 4 right). This difference can be related to oil volumes represented by two different saturation conditions: total/initial oil saturation and residual oil saturation in porous media. Evaluation on property of pay formation: Based on NMR petrophysical parameters and estimated fluid properties, we can effectively evaluate properties of the pay formation using a diagram as shown in figure 5 where we have a crossplot of oil saturation and movable fluid saturation (Shao et al., 2004). It allows us to characterize the fluids. Success rate about oil and water pay evaluation achieves 90% in many cases for Shengli, Liaohe, Jilin and Daqing Oil Fields. NMR mud logging technology has good applications in evaluation of low resistivity oil layers and water flooded layers. Taking well G898 in Dongying sag of Jiyang Depression as an example, a pay zone between 2,617.0 meter and 2,624.7 meter was drilled. Well logging resistivity (1.2-1.8 Ω•m) in this interval is the same as that of near water layer, the water saturation is 72~100%, and the conclusion of the interpretation is that it is a water with oil layer. NMR interpretation says it is an oil layer due to high oil saturation. The result of testing is 17.6 m3 pure oil per day.
DETERMINATION OF WELL TEST TARGETS We interpreted the oil/gas/water layer with reasonable reliability given the data that came from the mud logging, rock pyrogenation, quantitative fluorescence, and others. The movability of pore fluid could not be determinate with similar accuracy. This resulted in 10 percent of wells where interpretation results did not match well testing. The NMR parameters are a reliable reference for defining well test targets on the basis of defining the pay zone, because we use parameters such as hydrocarbon content and capacity. For deep reservoirs, hydrocarbons are often lightweight, and the drilling fluid density always overweight pore pressure due to the effects of salt and gypsum layers and the drilling safety requirement. Thus oil and gas shows are difficult to find by mud logging. In this case, we need to test some candidate layers for their NMR data. Well FS2 in Jiyang Depression as an example, where a wildcat well aimed to find oil and gas shows in conglomerate rock below salt layer structure. The pore pressure of an interest interval between 5,400 meter to 5, 672 meter is normal, but the density of drilling fluid was 1.92 ~ 1.95 which was affected by salt and gypsum layers and led to twice lose circulations. While there were no oil and gas indications in mud logging data, we needed to do a test according to good petrophysics standard (high FFI). The results are shown in figure 6. FORMATION PRESSURE EVALUATION On the basis of continuous and accurate NMR porosity, NMR mud logging technology was applied to pore pressure evaluation and fracture pressure calculation. Pore pressure evaluation: Under equilibrium
X

SPWLA 48th Annual Logging Symposium, June 3-6, 2007
6
compaction and lateral compressive stress are two main causal mechanisms of overpressure. Both of them could result in the change of pore volume, the difference between is that the former could increase pore volume, but the latter could decrease pore volume (Swarbrick et al., 1994). NMR mud logging technology can be used to evaluate pore pressure while drilling, because it rapidly analyzes porosity of cuttings on well site. For example, the overpressure in Sahejie Formation of Jiyang Depression was caused by under equilibrium compaction. High porosity obviously exists in overpressure formation as can be seen at greater depth in both logs in figure 7.
Fracture pressure calculation: The accurate calculation of fracture pressure is important for the design of drilling fluid, determination of casing structure and depth, design of cementing and compression fracture, drilling safety, and oil and gas layer protection. Many calculation methods such as Eaton, Stephen and Huang Rongzun depend on Poisson's ratio which is hard to determinate (Wang, 2006). According to the presumption about compression fracture with formation water proposed by Wang (2006), underground stress generally takes 3-dimension asymmetry stress as main; fracture pressure is not less than the smallest main stress minσ :
f min pP Pσ= + 8
but:
min (1 ) ( )(1 )v ob pP Pσ σ φ φ= − = − − 9
then:
( )(1 ) (1 )f ob p p p obP P P P P Pφ φ φ= − − + = + − 10
Where, fp is fracture pressure, vσ is weight of over lithology, pp is pore pressure, obp is overburden pressure, φ is total porosity. Therefore, fracture pressure gradient can be rapidly and accurate calculated by formula 10 on the basis of NMR porosity.
Taking well C660 in Jiyang Depression as an example table 1 shows a commercial analysis of sidewall stability that expresses that the drilling fluid density leading breakdown is 1.9~2.2 g/cm3, and the smallest drilling fluid density leading mud loss is 2.0~2.2 g/cm3. Fracture pressure calculated by formula 10 and based on NMR mud logging analysis is 2.22~2.25g/cm3. This shows that the method concern about NMR porosity is feasible and effective. CONCLUSIONS We have carried out many NMR mud logging tests in various oil field in China. They show us that the new NMR mud logging technology can provide timely and reliable petrophysics parameters, and evaluate a reservoir rapidly and accurately as it could not be done before. Therefore, we can evaluate reservoir rock and fluid properties, as well as reservoir parameters in real time while drilling at the well site (and also post-drilling in the laboratory). Using the automated petrophysical interpretation software on drill cuttings during mud logging allows petrophysicists to determine formation petrophysical properties, such as total and effective porosity, absolute permeability, probable minimum and maximum permeability, irreducible water saturation Swirr and free water saturation on the well site. Certainly, when the instrument is used in the laboratory, it can deliver most standard NMR petrophysical parameters. NMR mud logging technology, with high accuracy, can meet the needs of rapid on-site evaluation of hydrocarbon-saturated intervals. In addition to evaluating petrophysical parameters, it can be used to identify and estimate the pay zone capacity. NMR results can provide reliable guidance for drilling optimization and completion testing, and provide sufficient reference for accuracy in reserves estimation.

SPWLA 48th Annual Logging Symposium, June 3-6, 2007
7
Especially NMR mud logging technology can be effectively applied for deep reservoirs where reservoir rocks parameters can not be identified because of low signal-to-noise ratios of seismic data caused by large buried depth and complicated subsurface geology. Logging tools applications are also limited in this type of reservoir and can be significantly affected by in-situ conditions (high temperature and pressure). Based on rapid and low cost evaluation of reservoir properties in situ, we can predict petrophysics parameters of deeper reservoirs which provide guidance for drilling and consequently lower exploration risks and increase success ratios.
REFERENCES
Appel, M., 2004, Nuclear magnetic resonance and formation porosity: Petrophysics, 45, 296-307.
Coates, G. R., Xiao, L., and Prammer, M. G., 1999, NMR logging principles and applications: Halliburton Energy Services, Houston.
Fang, S. X., and Hou, F. H., 2003, Reservoir Geology About Oil and Gas: Press of University of Petroleum China, Dongying, China.
Freedman, R., and Heaton, N., 2004, Fluid characterization using Nuclear Magnetic Resonance Logging: Petrophysics, 45, 241-250.
He, Y. D., Mao, Z. Q., Xiao, L. Z., and Ren, X. J., 2005, An improved method of using T2 distribution to evaluate pore size distribution: Chinese Journal of Geophysics, 2, 373-378.
Mirotchnik, K., Allsopp, K., Kantzas, A., Curwen, D., and Badry, R., 2001, Low-Field NMR Method for Bitumen Sands Characterization: A New Approach, SPE Reservoir Evaluation & Engineering, SPE Paper 71208, Vol. 4, No 2, 88-96.
Mirotchnik, K., Kryuchkov, S. and Strack, K., 2004, A novel method to determine NMR petrophysical parameters from cuttings: SPWLA 45th Annual Logging Symposium.
Shao, W. Z., Liang, Q. F., Ding, W. J., and Wang, Q. M., 2004, On evaluation of waterflooded zones with NMR Logging and its application: Well Logging Technology, 1, 34-38.
Swarbrick, R. E., and Osborne, M. J., 1994, Mechanisms that generate abnormal pressures: an overview: AAPG MEMOIR 70, 13-30.
Wang, Z. Z., Zhai, S. D., Zhou, L. F., Deng, M. Y., and Wang, S. J., 2005, Application of Nuclear Magnetic Resonance logging technology in physical property analysis of rock: Petrolrum Geology & Experiment, 6, 619-623.
Wang, Z. Z., 2006, Abnormal pressure regimes in sedimentary basins and their prediction and detection: a case study of Jiyang Depression: Northwest University, Xian, China.
Wang, Z. Z., Deng, M. Y., Zhai S. D., and Zhou, L. F., 2006, Factors affecting NMR T2 spectra of oil well samples and methods for determining the T2 cutoff value: Chinese Journal of Magnetic Resonance, 1, 143-151.
X
SPWLA 48th Annual Logging Symposium, June 3-6, 2007
8
About the Authors Zhizhan Wang received a Ph. D from Department of
Geology, Northwest University, Xi’an, China. He is Senior engineer of SINOPEC and holds the position as manager of the 2nd evaluation department of Geologging Company, Shengli Oil Field, China. Currently engage in Geological research and evaluation and research of latest mud logging technology.
Yardenia Martinez received her bachelor’s degree in
geologic engineering from the National University of Mexico (U.N.A.M.), and then she completed her master’s degree from the Geosciences Department, University of Houston. She is currently working as petrophysicist for KMS Technologies in Houston.
Kurt Strack holds a doctorate in geophysics from
university of Cologne and an M.Sc. in geophysics from Colorado School of Mines. He is president of KMS Technologies and adjunct professor at University of Houston and Yangtze University, China. He specializes in electromagnetic technology for marine exploration, appraisal drilling and production monitoring.
Gang Yu holds a B.Sc. (Exploration Geophysics) and a
M.Sc. (Geophysical Instrumentation) from Chengdu University of Technology of China, and a Ph.D from Macquarie University of Australia. He is the Operations and Business Development Manager for KMS Technologies – KJT Enterprises, Inc.

SPWLA 48th Annual Logging Symposium, June 3-6, 2007
9
Tables
Figures
Table 1 The calculation table of fracture pressure gradient of well C660 in Jiyang Depression
Depth (m)
NMR porosity (%)
Pore Pressure gradient(g/cm3)
Overburden pressure gradient(g/cm3)
NMR fracture pressure gradient(g/cm3)
4193.00 2.64 1.0890 2.2500 2.2194
4196.60 3.84 1.7770 2.2500 2.2318
4238.70 1.45 0.9600 2.2520 2.2332
4244.00 3.03 1.5800 2.2520 2.2317
4299.70 0.95 1.3720 2.2540 2.2457
Figure 1: Applications in carbonate formation of Chuandong area. NMR porosity and permeability are compared with direct laboratory measurements
0.01 0.1 1 10 100 1000Direct Permeability,mD
0.01
0.1
1
10
100
1000
10000
NM
R P
erm
eabi
lity,
mD
Y=3.3415XR2=0.8966
0 4 8 12 16Direct Porosity,%
0
4
8
12
16
NM
R P
oros
ity,%
Y=0.9763XR2=0.9714
X
SPWLA 48th Annual Logging Symposium, June 3-6, 2007
10
Am
plitu
de
heavy
o
Intermediate
oil
Light
o
0.1 1 10 100 1000 10000T2 , ms
1.0 0.8 0.6 0.4 0.2 0.0
Figure 3: The relationship between T2 and oil viscosity
0
100
200
300
400
500
0. 1 1 10 100 1000T 2, ms
Am
plitu
de
oi l +wat eroi l
y = 0.9576xR = 0.8823
0
10
20
30
40
50
0 10 20 30 40 50
Conventional oil saturation,%
NM
R o
il st
urat
ion,
%
Figure 4: T2 NMR measurements (left) and its results (right) for the evaluation of oil saturation.
60 40 20 0
0.001
0.01
0.1
1
10
100
0 200 400 600
10000
1000
100
10
1
0.1
28 21 14 7 0
T 2,
ms
capi
llary
pre
ssur
e, a
tm
Mercury saturation,% Amplitude
Figure 2: Comparison between NMR T2 curve (right) and capillary pressure curve (left) in well J204
skewness
capillary pressure curve T2 cumulative curve T2 differential curve

SPWLA 48th Annual Logging Symposium, June 3-6, 2007
11
Dept h( m)
Tot al gas, % 0 15
C1, % 0 15
Li t hol ogy Sect i on
MR- ML por osi t y, %0 5
FFI ,%100 0
Pr oposal t est i ng i nt er val
Test i ng i nt er val
5500
5550
5600
5650
Figure 6: Sample plot of mud logging and testing interval
Figure 5: Interpretation plate of NMR Mud Logging in Dongying sag.
X

SPWLA 48th Annual Logging Symposium, June 3-6, 2007
12
Figure 7: The relationship between pressure coefficient,porosity and depth in Jiyang Depression
0 10 20 30 40 50500
1000
1500
2000
2500
3000
3500
4000
0 0.4 0.8 1.2 1.6 2
Pressure coefficient Porosity, %
Dep
th, m

KMS Technologies – KJT Enterprises Inc. 6420 Richmond Ave., Suite 610
Houston, Texas, 77057, USA Tel: 713.532.8144
Please visit us http://www.kmstechnologies.com