k kapoor, sv ramana rao, k itisri, b prahlad, n saibaba saibaba nuclear fuel complex
TRANSCRIPT

Zirconium In Nuclear Industry, 3-7 Feb 2013, Hyderabad
Study on Effect of Processing on Texture Development in Zirconium-2.5% Niobium Alloy Tubes
K Kapoor, S V Ramana Rao, K Itisri, B Prahlad, N SaibabaN Saibaba
Nuclear Fuel Complex, Hyderabad, [email protected]@ g

Critical Out-of-Pile Properties of Zirconium Alloy Tubes for Nuclear Application Chemical composition (alloy elements and Impurities)Mechanical propertiesRoom temperature and Elevated temperature tensileRoom temperature and Elevated temperature tensile Closed end burst (fuel tube)Hardness
C i (W t /St t l t d t t )Corrosion (Water/Steam at elevated temperature)Hydride orientationTextureMicrostructure (grain size, SPP-size and morphology)Dislocation densityFracture ToughnessFracture ToughnessCreep (structurals)Soundness by NDT (Ultrasonic and Eddy current )Vi l d S f fi i hVisual and Surface finishDimensional (OD, ID and WT)

Outline of the talk o Current understanding on role of texture in Zr-2.5Nb pressure tubeo Experimental Techniques used for Characterization of Textureo Results of Texture Development during Processing of Zr-2.5Nb pressure
tubes- Ingot processing (Comparison on 3 different routes)g p g (C p 3 )- Hot Extrusion (Comparison on 3 different routes)- Cold Working (Comparison on 3 different routes)
Heat treatment- Heat-treatmento Discussion
- Microstructure Development during the processing- Modeling of Texture using VPSC approach-Texture-microstructure relationship- SummarySummary
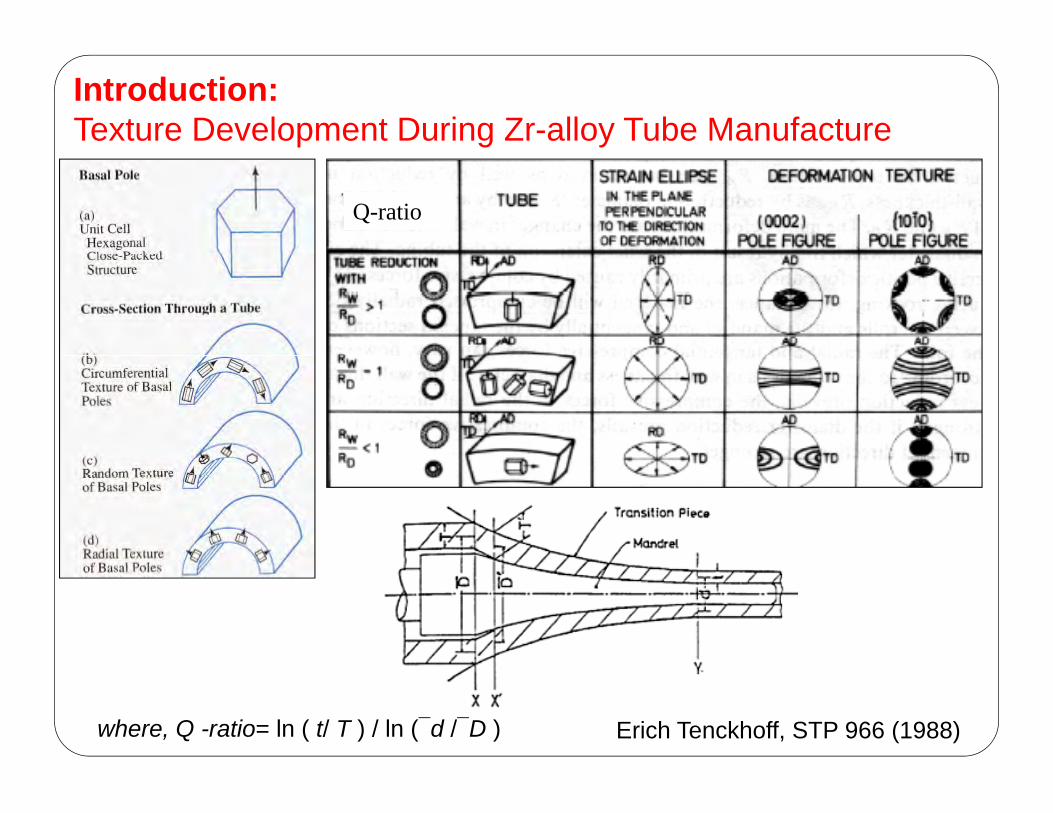
Introduction: Texture Development During Zr-alloy Tube Manufacture
Q-ratio
where, Q -ratio= ln ( t/ T ) / ln (d /D ) Erich Tenckhoff, STP 966 (1988)

Introduction: Role of Texture in Irradiation Creep in Zr-2.5% Nb Pressure Tubesp
b. U
nits
)Irr
ad. C
reep
(arb
fT-fR
INFERENCE: High Transverse Texture (basal pole in transverse direction) for reducing transverse creep (diametric expansion)
T R
R.A. Holt et.al , JNM 317 (2003)

Introduction: Role of Texture in Delayed Hydrogen Crackingy y g g
Threshold stress intensity for DHC:
DHC Velocity, da/dt = C1 exp.C2 F exp. (Q/RT), where C1 and C2 are microstructure and texture dependent parameters;
Kim, JNM 349 (2006)
microstructure and texture dependent parameters;

Introduction: Role of Texture in Hydride Orientation in the Zircaloy-4 Tubesy y
Extruded
TransverseFi l CWSR
Radial
Final CWSR
INFERENCE: High Radial Texture (basal pole in radial direction) for low radial hydride
Transversefraction
K. Vaibhaw et.al JNM, 383(2008) Radial

Introduction: R l f T t i St C i C kiRole of Texture in Stress Corrosion CrackingStress corrosion crack growth rate da/dt = C(KI)n
The KI and n are related to texture parameter
INFERENCE: High Radial Texture (basal pole in radial direction) for better SCC
Hwang, SK, Met. Trans. A 1991; 22A: 2247-56
INFERENCE: High Radial Texture (basal pole in radial direction) for better SCC

Introduction: Role of Texture in Mechanical anisotropy and pyThermal expansion
Related Property
Constituted equations Reference
Mechanical i t
(R*(ND - TD )2 + R*P*(TD - RD )2 + P*( )2}/P*(R 1) 2
K Linga Murty, Progress i N l E 48anisotropy P*(ND - RD )2}/P*(R+1) = g
2
R and P are texture dependentin Nuclear Energy 48 (2006)
Thermal expansion
Pref = fref P[0001] + (1- fref) P [0001] Kearns JJ. Report WAPD TM 472 1965;expansion WAPD-TM- 472, 1965;

Experimental: Macro and Micro Texture Measurement
Crystallographic Texture
Experimental Techniques
X-Ray DiffractionMACROTEXTURE
EBSD (SEM)MICROTEXTURE
GoniometerPowder Diffraction
Texture Quantification
Orientation Distribution Function
Pole FigureKearn’s ‘f’ parameter
Channeling Contrast
Microstructure and MicrostrainOrientation Distribution Function
CPF IPF %(hkil)<uvtw>
Microstructure and Microstrain

Experimental: Quantification of Crystallographic Texture- Kearn’s fQ y g p
The Kearn’s ‘f ’parameter is the fraction of basal poles oriented in the three principal directions i e Longitudinal Transverse and Normalthree principal directions i.e. Longitudinal, Transverse and Normal (fL, fT and fN) in the sample such that fL+ fT + fN = 1,
2/
0
2cos Vi
i
i
f
2
0
2 d . cos . sin ).( I
f
2
0
d . sin ).( I
f

Experimental:Quantification of of Crystallographic Texture: ODF and Pole fig.ODF R t tiODF Representation: For hexagonal crystal symmetry and triclinic sample symmetry, the dimension of the unit cube is
Key for crystallite directions (2= 0)
dimension of the unit cube is defined as {0 ≤ 1 ≤ /2, 0 ≤ ≤ /2, 0 ≤ 2 ≤ /3}
ODF Quantification: a) A texture component f(g) with {1, , 2} being the orientation ) p (g) {1, , 2} gb) Volume fraction of texture component f(g) = dv/V = 1/82 ∫∫∫f(g)dgwhere, dv/V is the volume fraction fraction of crystallite having an orientation in the range dg defined as {1, , 2}c) Pole Figure representation: An orientation in three dimensional space isc) Pole Figure representation: An orientation in three-dimensional space is represented by Euler angles as 1
hkl, hkl, 2hkl, can then may be expressed in terms
of pole density function as,
1Phkl(,) = hklhklhklhkl df 221 ),,(
21

ROUTE 1 (a and b) ROUTE 2 ROUTE 3
V A l i V A l i V A l i
Process Routes of Pressure Tube
INGOT PRO
Vacuum Arc melting Vacuum Arc melting Vacuum Arc melting↓ ↓ ↓
Hot Extrusion to Billet Forge I Double Forged
OCESSIN
G
↓ ↓↓
Beta quenching Beta quenching
↓ ↓Forge II Beta quenching
Hot
Processing
↓ ↓Hot Extrusion for Blank
(ER 1:8)Hot Extrusion for Blank
(ER 1:8)Hot Extrusion for Blank
(ER 1:12)
↓ ↓ ↓ ↓↓ ↓ ↓ ↓
Cold Pro
Cold Pilger I Cold Pilger I Cold Pilger I Cold Pilger I
↓ ↓ ↓
Annealingα+β
Q hiAnnealingocessing and H
↓Quenching
↓ ↓↓
Cold Pilger II Cold Pilger II Cold Pilger IIHT ↓ ↓ ↓
Autoclave Ageing(HT) Autoclave Autoclave

Results: 1.0 Effect of Ingot Processing Route
Route 1: Ingot Extrusion to Billet -quenchStress relieve
Route 2: Ingot Hot forge to intermediate -quench Hot-forge to BilletR t 3 I t H t f t i t di t h H t f t Bill t hRoute 3: Ingot Hot forge to intermediate -quench Hot-forge to Billet -quench
(a1)
XRD patterns (a) Ingot (b) JCPDS (c) powder Ingot sample (d) Billet route 1 (e) Billet route 2, a1) ODF at IngotInference: Ingot processing texture is destroyed by beta quenching

Results: 2.0 Effect of Hot Extrusion RatioBeta Quenched Billet : : ROUTE 1a
Extrusion (ER1:8)
Mother Hollow ( )
Beta Quenched billet : : ROUTE 3
Extrusion (ER1:12)
Mother Hollow
Microstructure and Texture (EBSD) of As extruded (Route 1a)
Longitudinal sectionLongitudinal section
Transverse section
Pole Figure and ODF Section. Microstructure

Results: 2.0 Texture and Microstructure (EBSD) of as-extruded (Route 3) Microstructure( )
Pole Figure and ODF Section.
Longitudinal section
Transverse sectionTransverse section
Inference: Higher Extrusion ratio leads to higher Transverse Texture

Results: 3.0 Texture Evolution During Cold Deformation -Quenched billets: ROUTE 1 a
Extrusion (ER1:8)
1 Pilger (60% CW)
Anneal 823K
2 pilger (25% CW)
Stress relieve 673 KROUTE 1 a (Zr-2.5Nb/ Zircaloy-4)
(ER1:8) (60% CW) 823K (25% CW)
-Quenched billets: ROUTE 3 (Zr 2 5%Nb)
Extrusion (ER1:12)
Cold drawing ( 25 % CW)
Stress relieve 673 K
(Zr-2.5%Nb)
As-extruded I pass pilger + anneal II pass pilger + SRZr-2.5Nb fT/ fR 1.47 1.42 1.41
Route 1a: Texture Evolution (Single phase Vs Two-phase)
Zr 2.5Nb fT/ fR 1.47 1.42 1.41 Zircaloy-4 fT/ fR 1.12 0.53 0.37
Zr 2 5NbZr-2.5Nb
Zircaloy-4
Inference: No texture change with cold pilgering in Two-phase Zr-2.5Nb, while the texture change predominantly in single phase Zircaloy-4

Results: 3.0 Texture Kerns ‘f’ and ODF on Cold Deformation Kearns ‘f ‘ Parameter Route 1a Route 3
Condition fr ft fa Condition fr ft fa
Hot extruded (ER 1:8) 0.38 0.56 0.06 Hot extruded (ER 1:12) 0.29 0.66 0.05
I Pass Pilgered & Annealed
0.40 0.57 0.03 NA
ODFs (with 2 section at =0) for Route 3
II Pass Pilgered & Autoclaved
0.41 0.57 0.02Pilgered & Autoclaved 0.29 0.66 0.05
As-extruded As-autoclaved
Orientation Components
Volume fraction of orientationsExtruded I Pilger and anneal As-autoclaved
Route 1a Route 3 Route 1a Route 3 Route 1a Route 3(11 22)<1 100> 18 79 10 10 7 96 27 53 19 87(11-22)<1-100> 18.79 10.10 7.96
NA27.53 19.87
(11-24)<1-100> 2.79 4.25 4.95 8.13 7.6(33-61)<1-100> 3.70 4.86 2.03 10.09 15.85
Inference: No texture change with cold pilgering (two pass/single pass) in Two-phase Zr-2.5Nb

Results: 4.0 Texture Evolution Heat Treated Route-Quenched billets: ROUTE 1 b
Extrusion (ER1:9.4)
1 Pilger(41% CW)
α+βQuench
2 pilger(25% CW)
Ageing(HT)
Kearn’s ‘f’ Texture parameter (as aged) Microstructure
ROUTE 1 b (Zr-2.5Nb)
(ER1:9.4) (41% CW) Quench (25% CW)
fr ft faAs-extruded 0.38 0.56 0.06As- Quenched 0.33 0.37 0.35
Aged 0.36 0.50 0.14
Pole Figure and ODF (as aged)As- Quenched
AgedSaibaba et.al, 2010, under publication

Route 1a: Ingot Extrusion to final -quenchHot Extrude Cold Pilger
Stress relieve
Route 2: Ingot Hot forge to intermediate -quench Hot-forge to final
Results: Microstructure Development and Mechanical properties
Bill t St E t d d bl k Fi l t li
Final Mechanical PropertiesMicrostructural evolution
relieveRoute 3: Ingot Hot forge to intermediate -quench Hot-forge to final -quench
Billet Stage Extruded blank Final stress relieve
1% Elongation
Process 1 (samples 176)
2
UTS (in MPA)Process 1 (samples 176)
56 2 5 - 6 6 0
26
8749
302
0 50 100
12-14
16-18
20-22
%
No. of tubes
551
3716
62
0 20 40 60 80
4 5 0 - 4 8 5
4 8 5 - 5 2 0
5 2 0 - 5 5 5
5 5 5 - 5 9 0
5 9 0 - 6 2 5
UTS
No. of tubes
2% Elongation
Process 2 (samples 206)
4499
10
14 16
18-20
%
UTS (in MPA)Process 2 (samples 206)
365
5 5 5 - 5 9 0
5 9 0 - 6 2 5
S
143944
0 50 100 150
10-12
14-16%
No. of tubes 206
547
113
0 50 100 150
4 5 0 - 4 8 5
4 8 5 - 5 2 0
5 2 0 - 5 5 5
UTS
No. of tubes

Discussion: Morphological evolution of phase
Increasing time
Morphological evolution of rod shaped structures with thermo mechanical deformation [ by Cline, Ho and Weatherly]
Processingroute 1a and 3
Processingroute 2
Billet Stage Extruded blank Stage
Billet soaked at high temperature
Final Stage
Morphological evolution of phase during themo mechanical processing

Modelling: Texture in two-phase ( + ) Zr-2.5Nb alloy
a) Taylor-Bishop-Hill model Results on modeling of texture of ) y p
b) Self-Consistent Viso-Plastic modelZircaloy and Zr-2.5Nb [R A Lebenson and C N Tome, Acta. Mat. 1993]
Inference: FC model gives satisfactory results only in case of single phase Zircaloy-2 material
VPSC models texture well in case of Zr-2.5Nb and Zircaloy-2 materials

Modeling of Texture – application of VPSC Model on two-phase ( + ) Zr-2.5Nb alloyViscoplastic Self-consistent simulations based on Eshelby’s inclusion
problem Initial texture as inputpChoose slip and/or twin systems Choose CRSS and hardening parameters for individual slip and twin system Impose strain boundary condition (‘Q’ parameter for pilgering) Impose strain boundary condition ( Q parameter for pilgering)Match experimental and simulated texture
I l i
Homogeneous Equivalent Medium
Inclusion
C. N. Tome and R. Lebensohn, VPSC-7 manual 2008

General MethodologyModeling of Texture using VPSC approach: General methodology of Investigation
Material
Test/Deformation Process
S l Ch i i b XStructural Characterization by X-ray diffraction
Understanding D f ti
Bulk Texture from X-ray diffractionDeformation Mechanisms
Microtexture and Microstructure from EBSD
Simulations

Modeling of Texture – application of VPSC Model on two-phase ( + ) Zr-2.5Nb alloy
VPSC allows to use 2 site model, Consider a pair of alpha and betaMicrostructural morphology can be incorporated in simulations In addition to crystallographic texture, morphology of lamellas can also
be incorporated : random vs aligned
Aspect ratio in 3D
alpha
alphabeta
Morphology
Longitudinal directionLongitudinal direction

Modeling of Texture – application of VPSC Model on two-phase ( + ) Zr-2.5Nb alloy
Successful in showing difference in texture evolution for single phase and two-phase ( + ) Zr-2.5Nb alloy.
Kiran Kumar et al* showed similar results with negligible texture evolution in alpha phase of Zr-2.5% Nb during cold rolling Attributed to rigid body rotation of alphacold rolling. Attributed to rigid body rotation of alpha platelets
No strain partitioning between alpha and beta phase p g p pwith the beta phase accommodating all the strain
Gurao et al** incorporated morphology of microstructure in VPSC simulations of HCP + BCC TiNbZr alloy
*Kiran Kumar et al Acta Materialia 51 (2003) 625*Kiran Kumar et al. Acta Materialia 51 (2003) 625.**N. P. Gurao, PhD thesis IISc, Bangalore

Results of Modeling: Texture-microstructure relationshipp
In single phase materials direct grain to grain contact leads to full constraint on deformationcontact leads to full constraint on deformation
In two-phase material (with soft GB phase), the softer phase carries most of the strain.softer phase carries most of the strain.
Cold deformation of single phase material is accommodated by combination of twinning and slipy g p
Twinning is retarded due to lamellar morphology of HCP phase in two-phase Zr-2.5%Nb materialp p

Concluding Remarks Texture plays a dominant role in the in in-pile performance
of Zr-2.5Nb structural material. Ingot processing texture is destroyed by beta quenching Ingot processing texture is destroyed by beta quenching Processing flow sheet is tailored to give the required
texture in the tubing. High transverse texture for Zr-2.5Nb pressure tube is achieved by higher Extrusion Ratio.
No change in texture is observed during CW in Two-phase Zr 2 5Nb material Presence of second phase atphase Zr-2.5Nb material. Presence of second phase at the grain boundary influences the texture development.
VPSC model is used to explain the texture development p pduring cold working

ACKNOWLIDGEMENTS
Prof. N. P. Gurao, IIT(K) for help in Texture Modeling
Dr. Ubhi Singh Harvinder, Oxford Instruments, for help in EBSD

Thank Youhank You