jun 2009 tatum survey
TRANSCRIPT
Survey of Business Conditions06.01.2009
2
Click Here to Add Slide Headline
2
Click Here to Add Slide Headline
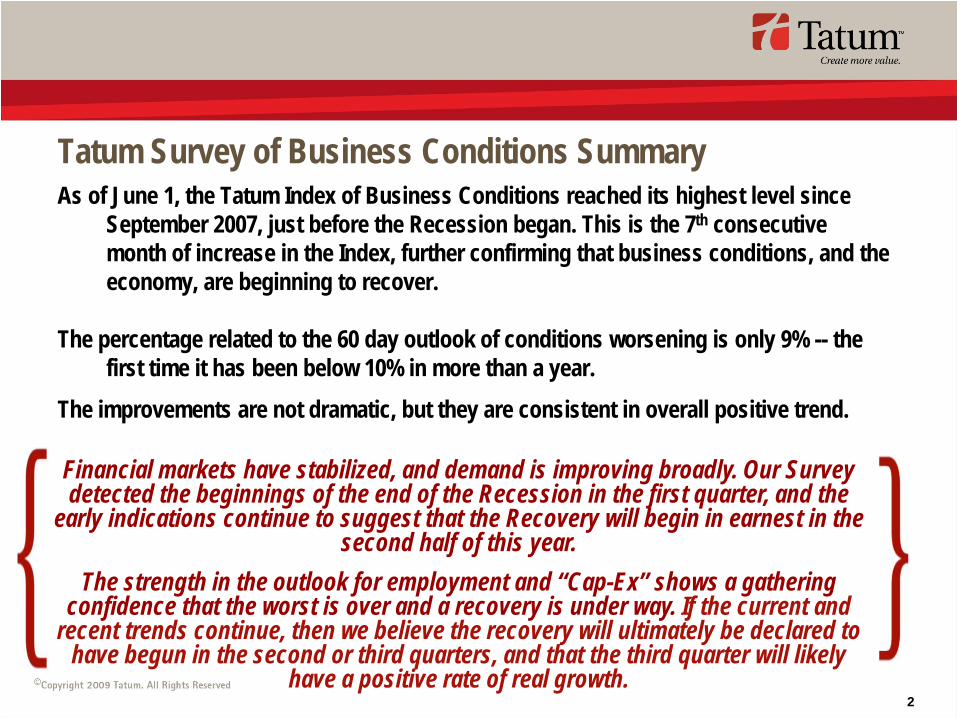
Tatum Survey of Business Conditions SummaryAs of June 1, the Tatum Index of Business Conditions reached its highest level since
September 2007, just before the Recession began. This is the 7th consecutive month of increase in the Index, further confirming that business conditions, and the economy, are beginning to recover.
The percentage related to the 60 day outlook of conditions worsening is only 9% -- the first time it has been below 10% in more than a year.
The improvements are not dramatic, but they are consistent in overall positive trend.
Financial markets have stabilized, and demand is improving broadly. Our Survey detected the beginnings of the end of the Recession in the first quarter, and the
early indications continue to suggest that the Recovery will begin in earnest in the second half of this year.
The strength in the outlook for employment and “Cap-Ex” shows a gathering confidence that the worst is over and a recovery is under way. If the current and
recent trends continue, then we believe the recovery will ultimately be declared to have begun in the second or third quarters, and that the third quarter will likely
have a positive rate of real growth.

3
Click Here to Add Slide Headline
3
Click Here to Add Slide Headline
Tatum Index of Business ConditionsThe Tatum Index of Business Conditions is a simple average of the ratio of our
respondents who are reporting improvement versus those who are reporting a worsening in business conditions for the past 30 days and the next 60 days.
As of June 1st, the Tatum Index of Business Conditions increased for the seventh month in a row from 2.29 to 3.01. The three-month moving average is now above 2 for the first time in 9 months. It increased from 1.58 to 2.32.
The Index clearly shows businesses are seeing measurable improvements. Confidence about the near term future is the highest
it has been in over a year, and it is heading in the right direction.

4
Click Here to Add Slide Headline
4
Click Here to Add Slide Headline
Tatum Index of Business Conditions
5.5 4.8
9.8 9.5
8.5
12.3
5.4 5.2 6.0
5.1
2.2 2.1 1.7 2.0 1.4 1.2 1.5
2.1 2.7 2.6
1.7 2.0
0.9 0.4 0.4 0.5 0.6 0.8
1.7 2.3
3.0
0
4
8
12
16
12/06
01/07
02/07
03/07
04/07
05/07
06/07
07/07
08/07
09/07
10/07
11/07
12/07
01/08
02/08
03/08
04/08
05/08
06/08
07/08
08/08
09/08
10/08
11/08
12/08
01/09
02/09
03/09
04/09
05/09
06/09
Index 3 Mo. Avg.
5
Click Here to Add Slide Headline
5
Click Here to Add Slide Headline
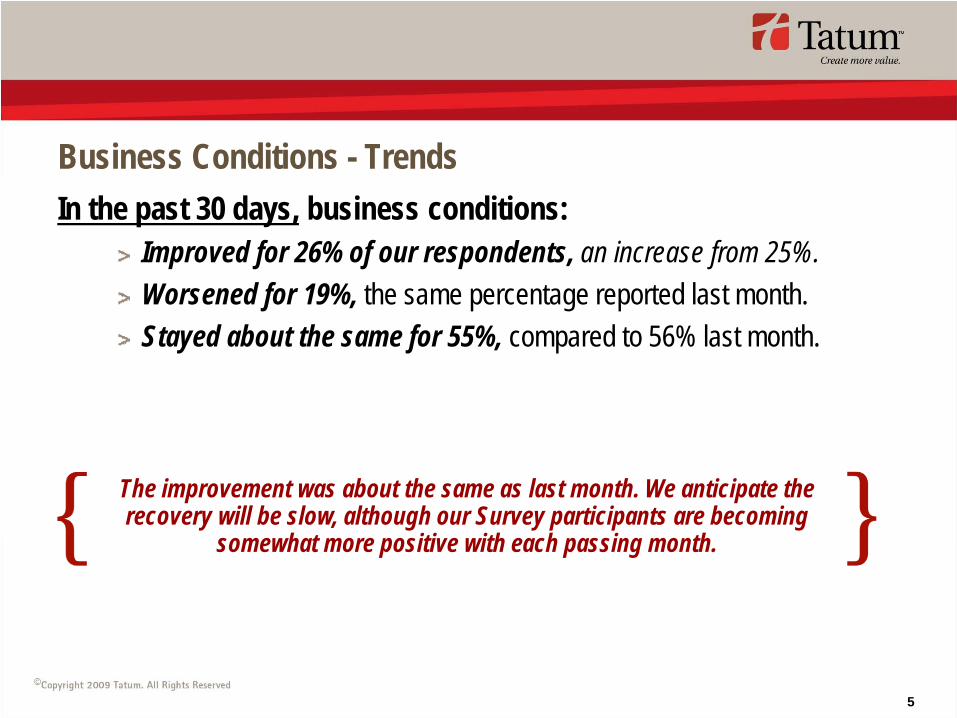
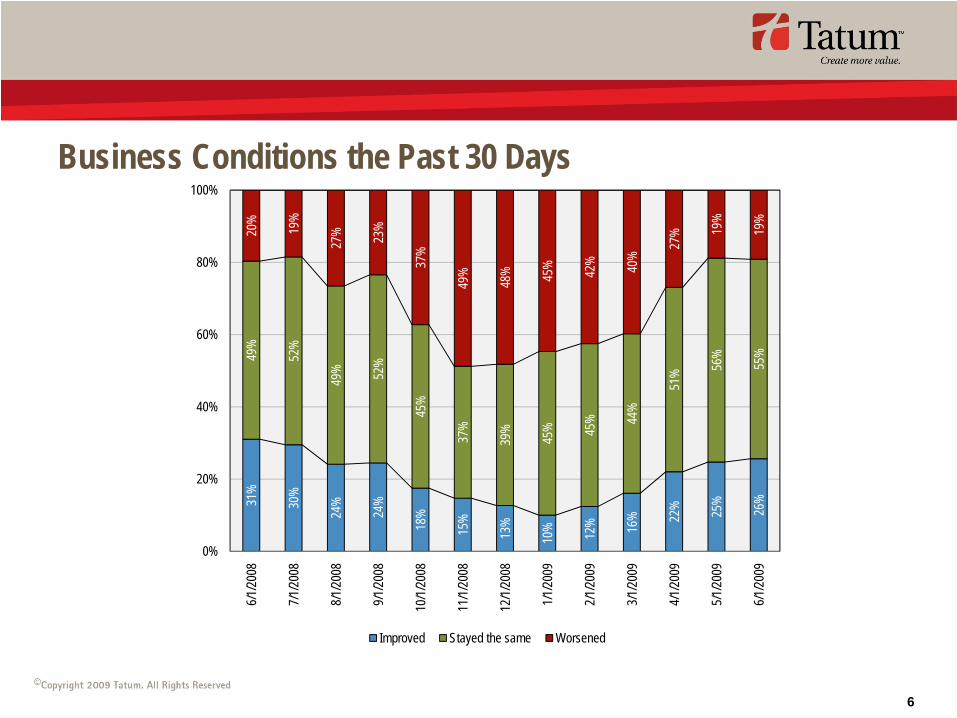
Business Conditions - TrendsIn the past 30 days, business conditions:
Improved for 26% of our respondents, an increase from 25%.Worsened for 19%, the same percentage reported last month. Stayed about the same for 55%, compared to 56% last month.
The improvement was about the same as last month. We anticipate the recovery will be slow, although our Survey participants are becoming
somewhat more positive with each passing month.
6
Click Here to Add Slide Headline
6
Click Here to Add Slide Headline
Business Conditions the Past 30 Days
31%
30%
24%
24%
18%
15%
13%
10% 12% 16
% 22% 25%
26%
49%
52%
49% 52
%
45%
37%
39%
45% 45
% 44%
51% 56
%
55%
20%
19%
27% 23%
37%
49%
48% 45
% 42% 40%
27% 19
%
19%
0%
20%
40%
60%
80%
100%
6/1/20
08
7/1/20
08
8/1/20
08
9/1/20
08
10/1/
2008
11/1/
2008
12/1/
2008
1/1/20
09
2/1/20
09
3/1/20
09
4/1/20
09
5/1/20
09
6/1/20
09
Improved Stayed the same Worsened
7
Click Here to Add Slide Headline
7
Click Here to Add Slide Headline
Business Conditions - Trends
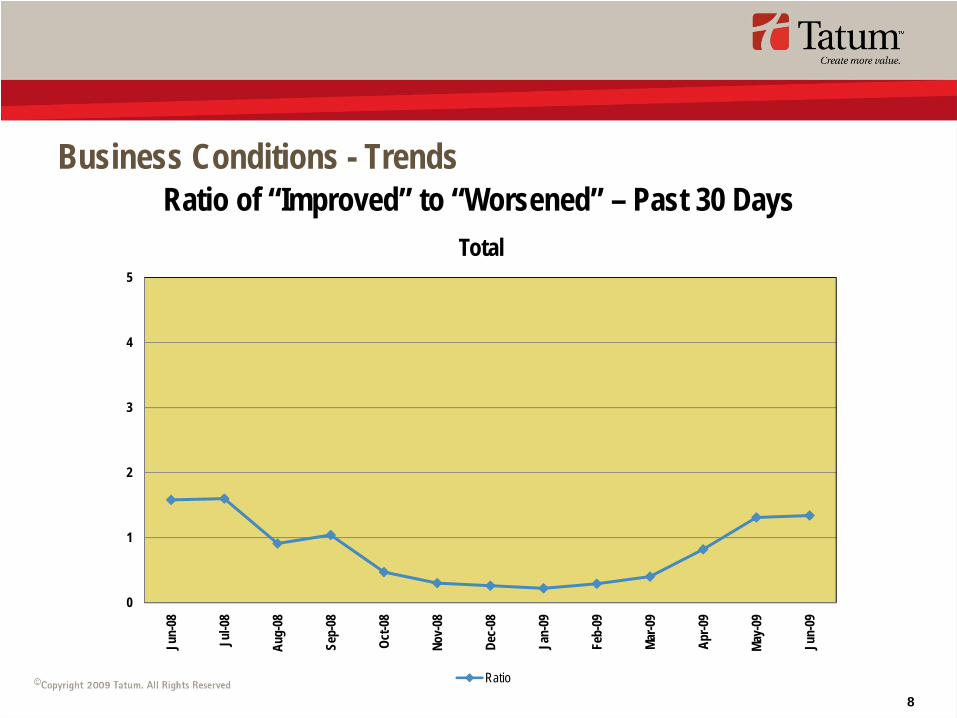
The ratio of “Improved-to-Worsened” in the last 30 days increased slightly from 1.31 to 1.34. This is the second month in a row the ratio has been above one (1).
A very slight improvement from the prior month.
8
Click Here to Add Slide Headline
8
Click Here to Add Slide Headline
Business Conditions - TrendsRatio of “Improved” to “Worsened” – Past 30 Days
0
1
2
3
4
5
Jun-
08
Jul-0
8
Aug-
08
Sep-
08
Oct-0
8
Nov-
08
Dec-
08
Jan-
09
Feb-
09
Mar-0
9
Apr-0
9
May-
09
Jun-
09
Total
Ratio

9
Click Here to Add Slide Headline
9
Click Here to Add Slide Headline
Business Conditions - TrendsIn the next 60 days, business conditions are expected:
To improve for 42% of our respondents, an increase from 39% reported last month. To get worse for 9%, a decrease from 11% reported last month. To remain about the same at 49% compared to the 50% reported last month.
The results of the 60-day outlook improved noticeably from last month. The “Will Worsen” percentage is now in single digits.

10
Click Here to Add Slide Headline
10
Click Here to Add Slide Headline
Business Conditions - TrendsNext 60 Days
46%
44%
42%
42%
32%
20%
21% 26
%
27% 29% 35
% 39% 42
%
41%
43%
41% 45%
42%
38% 40
%
43% 43% 47
%
50% 50
% 49%
12%
13%
17% 14%
26%
42% 39
% 31%
30% 24
% 14% 11% 9%
0%
20%
40%
60%
80%
100%6/1
/2008
7/1/20
08
8/1/20
08
9/1/20
08
10/1/
2008
11/1/
2008
12/1/
2008
1/1/20
09
2/1/20
09
3/1/20
09
4/1/20
09
5/1/20
09
6/1/20
09
Improve Stay the same Worsen
11
Click Here to Add Slide Headline
11
Click Here to Add Slide Headline
Business Conditions - TrendsIn the next 60 days:The ratio of “Will Improve” to “Will Worsen” increased from 3.27 to 4.68.
This is a very sensitive measurement that can shift dramatically. Therefore the 3-month moving average index of business conditions makes it easier to see the overall trend.
This is the seventh month in a row this ratio has increased. The ratio is at its highest level since September 2007.

12
Click Here to Add Slide Headline
12
Click Here to Add Slide Headline
Business Conditions - TrendsRatio of “Will Improve” to “Will Worsen” – Next 60 Days
0
2
4
6
8
10
12
Jun-
08
Jul-0
8
Aug-
08
Sep-
08
Oct-0
8
Nov-
08
Dec-
08
Jan-
09
Feb-
09
Mar-0
9
Apr-0
9
May-
09
Jun-
09
Total
Ratio

13
Click Here to Add Slide Headline
13
Click Here to Add Slide Headline
Business Conditions – Current ResultsOrder Backlogs
In the past 30 days:The percentage of respondents who reported an improvement in backlogs decreased from 26% to 24%. The percentage reporting lower backlogs remained at 23%.
In the next 60 days:The percentage of respondents who indicated expectations of higher backlogs increased from 38% to 43%. The “Will Worsen” percentage decreased from 11% to 8%. This is the first time in a year the “Will Worsen” percentage has been in single digits.
The outlook for order backlogs is at the highest level in the last 13 months. This is the fifth month in a row the percentages for the next
60 days have improved. Businesses are seeing more orders and rebuilding inventories accordingly.

14
Click Here to Add Slide Headline
14
Click Here to Add Slide Headline
Business Conditions – Current Results
Order Backlog Analysis
Past 30 Days
Next 60 Days
0%
20%
40%
60%
80%
100%
6/1/20
08
7/1/20
08
8/1/20
08
9/1/20
08
10/1/
2008
11/1/
2008
12/1/
2008
1/1/20
09
2/1/20
09
3/1/20
09
4/1/20
09
5/1/20
09
6/1/20
09
Improved Stayed the same Worsened
0%
20%
40%
60%
80%
100%
6/1/20
08
7/1/20
08
8/1/20
08
9/1/20
08
10/1/
2008
11/1/
2008
12/1/
2008
1/1/20
09
2/1/20
09
3/1/20
09
4/1/20
09
5/1/20
09
6/1/20
09
Will improve Will stay the same Will worsen

15
Click Here to Add Slide Headline
15
Click Here to Add Slide Headline
Business Conditions – Current ResultsCapital Expenditure Commitments
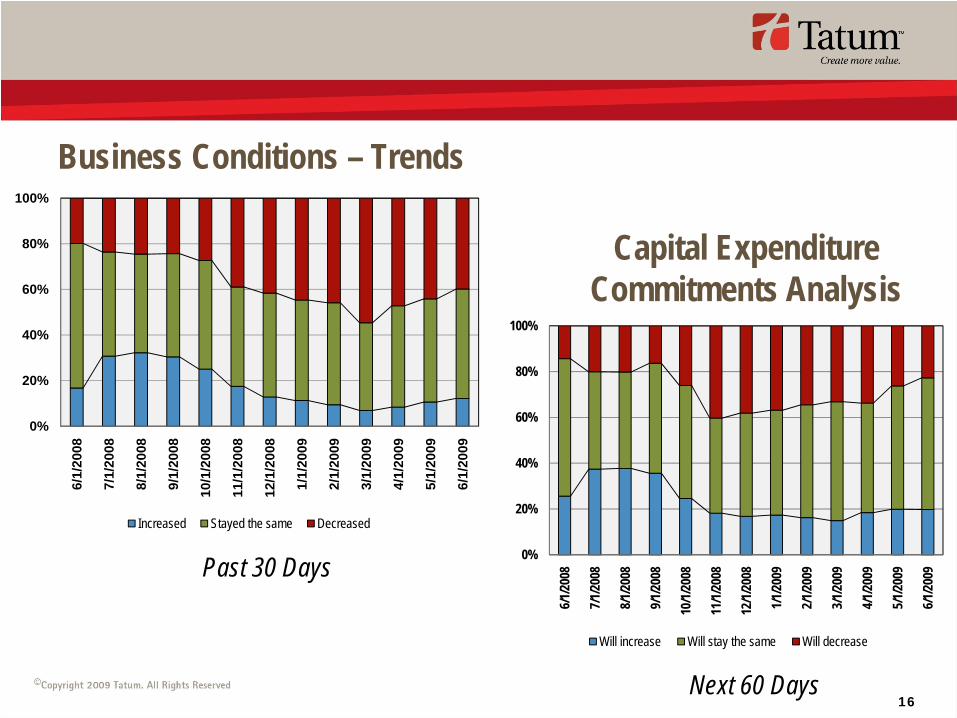
In the past 30 days:The percentage of respondents committing more on capital equipment increased from 11% to 12%. The percentage that committed less on capital decreased from 44% to 40%.
In the next 60 days:The percentage of respondents who said they plan to commit more for capital assets in the next 60 days remained at 20%. The percentage who expected to commit less decreased from 26% to 23%.
For the third month in a row, businesses are showing a willingness to spend money for capital goods. This is an
encouraging trend. When both capital expenditure commitments and employment results show improvement, this is the strongest indicator the Recession has passed the bottom as these tend to
be lagging indicators.
16
Click Here to Add Slide Headline
16
Click Here to Add Slide Headline
Business Conditions – Trends
Capital Expenditure Commitments Analysis
Past 30 Days
Next 60 Days
0%
20%
40%
60%
80%
100%
6/1/
2008
7/1/
2008
8/1/
2008
9/1/
2008
10/1
/200
8
11/1
/200
8
12/1
/200
8
1/1/
2009
2/1/
2009
3/1/
2009
4/1/
2009
5/1/
2009
6/1/
2009
Increased Stayed the same Decreased
0%
20%
40%
60%
80%
100%
6/1/20
08
7/1/20
08
8/1/20
08
9/1/20
08
10/1/
2008
11/1/
2008
12/1/
2008
1/1/20
09
2/1/20
09
3/1/20
09
4/1/20
09
5/1/20
09
6/1/20
09
Will increase Will stay the same Will decrease

17
Click Here to Add Slide Headline
17
Click Here to Add Slide Headline
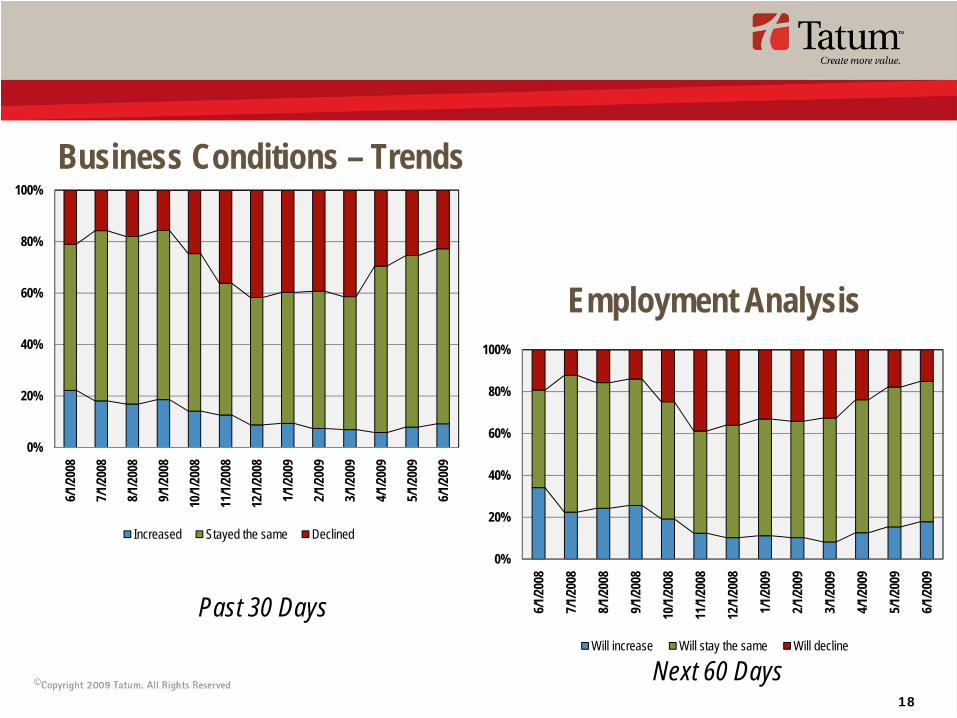
Business Conditions – Current ResultsEmployment
In the past 30 days:The percentage of respondents hiring more workers rose slightly from 8% to 9%. The percentage that indicated they did less hiring decreased from 25% to 23%.
In the next 60 days:The percentage indicating they plan to increase hiring rose from 15% to 18% last month. The percentage who expect to reduce hiring decreased from 18% to 15%.
As we commented last month, our respondents are experiencing an improvement in the employment picture. In June, this outlook strengthened. Because of the lag in reporting results, we expect the unemployment statistics may have already peaked, pending
the fallout from the auto industry restructurings.
18
Click Here to Add Slide Headline
18
Click Here to Add Slide Headline
Business Conditions – Trends
Employment Analysis
Past 30 Days
Next 60 Days
0%
20%
40%
60%
80%
100%
6/1/20
08
7/1/20
08
8/1/20
08
9/1/20
08
10/1/
2008
11/1/
2008
12/1/
2008
1/1/20
09
2/1/20
09
3/1/20
09
4/1/20
09
5/1/20
09
6/1/20
09
Increased Stayed the same Declined
0%
20%
40%
60%
80%
100%
6/1/20
08
7/1/20
08
8/1/20
08
9/1/20
08
10/1/
2008
11/1/
2008
12/1/
2008
1/1/20
09
2/1/20
09
3/1/20
09
4/1/20
09
5/1/20
09
6/1/20
09
Will increase Will stay the same Will decline

19
Click Here to Add Slide Headline
19
Click Here to Add Slide Headline
Business Conditions – Current ResultsCapital Availability and Pricing
The past 30 days:The percentage of respondents indicating an improvement increased from 22% to 25%. The percentage who indicated conditions worsened increased from 10% to 13%.
In the next 60 days:The percentage of the respondents who expect improvement in financing conditions in the next 60 days decreased from 38% to 36% The percentage saying conditions will get worse decreased from 11% to 9%.
Overall for both time periods there was no change from last month. We believe this reflects a stabilization in capital markets and confidence on the part of borrowers to whom the banks are capable and willing to lend money,
albeit with stricter terms and conditions, and at higher rates.

20
Click Here to Add Slide Headline
20
Click Here to Add Slide Headline
Business Conditions – Trends
Capital Availability /Pricing Analysis
Past 30 Days
Next 60 Days
0%
20%
40%
60%
80%
100%
6/1/20
08
7/1/20
08
8/1/20
08
9/1/20
08
10/1/
2008
11/1/
2008
12/1/
2008
1/1/20
09
2/1/20
09
3/1/20
09
4/1/20
09
5/1/20
09
6/1/20
09
Improved Stayed the same Worsened
0%
20%
40%
60%
80%
100%
6/1/20
08
7/1/20
08
8/1/20
08
9/1/20
08
10/1/
2008
11/1/
2008
12/1/
2008
1/1/20
09
2/1/20
09
3/1/20
09
4/1/20
09
5/1/20
09
6/1/20
09
Will improve Will stay the same Will worsen

21
Click Here to Add Slide Headline
21
Click Here to Add Slide Headline
Survey Participation Demographics – IndustryManufacturing/Processing 23%Service 22%Technology 14%Healthcare 11%Financial 7%Wholesale 4%Construction 3%Real Estate 3%Bio-Tech/Life Sciences 3%Transportation 3%Other 7%
22
Click Here to Add Slide Headline
22
Click Here to Add Slide Headline
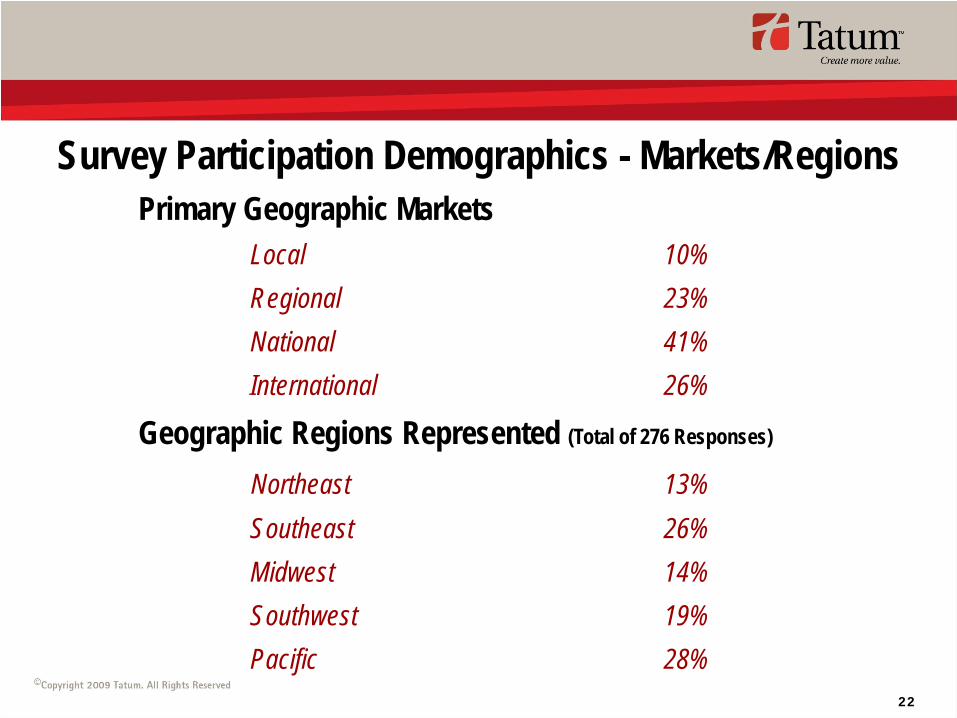
Survey Participation Demographics - Markets/RegionsPrimary Geographic Markets
Local 10%Regional 23%National 41%International 26%
Geographic Regions Represented (Total of 276 Responses)
Northeast 13%Southeast 26%Midwest 14%Southwest 19%Pacific 28%

23
Click Here to Add Slide Headline
23
Click Here to Add Slide Headline
Survey Participation Demographic Summary
The following are on relative scales from our respondents:
Regions: Industries*:Strongest – Southwest Strongest – Financial
Weakest – Pacific Weakest – Service* With statistically significant participation
Markets Served: Company Size:Strongest – National Strongest – Pre-Revenue/Large
Weakest – Regional/International Weakest – Small/Mid-Market

24
Click Here to Add Slide Headline
24
Click Here to Add Slide Headline
Survey of Business Conditions
Compiled and Analyzed bySam Norwood – Senior Partner
Glen Passin – Partner
Any use or reproduction of the contents of this report without the written consent of Tatum, LLC is strictly prohibited. The authors are not engaged in rendering legal,
investment or other professional services by publication of this report. Information contained in this report should not be used as a substitute for professional advice, legal,
investment or otherwise, on any particular issue.