survey on perceptions and knowledge of corruption (jun 2014)
TRANSCRIPT

Strengthening Transparency and Governance in Mongolia Program
SURVEY ON PERCEPTIONS AND
KNOWLEDGE
OF CORRUPTION
June 2014

This survey is made possible by the generous support of the American people
through the United States Agency for International Development (USAID). The Asia
Foundation and the Sant Maral Foundation have implemented the survey, which does
not necessarily reflect the views of USAID and the United States Government.
Сант Марал сан

1SURVEY ON PERCEPTIONS AND KNOWLEDGE OF CORRUPTION
I. INTRODUCTION 2
II. KEY FINDINGS 3
III. METHODOLOGY 4
1. MAJOR PROBLEMS 6
2. TRENDS IN PEOPLE’S ATTITUDES FROM 2006 TO 2014 9
3. CORRUPTION LEVEL 15
4. FAIR TREATMENT 17
5. GENERAL OR PETTY CORRUPTION 19
6. SECTORS OR AGENCIES AFFECTED BY CORRUPTION 22
7. UNDERSTANDING GRAND CORRUPTION 25
8. LEAD AGENCY AGAINST CORRUPTION 28
9. DEALING WITH CORRUPTION 33
10. INDIVIDUAL ACTIONS AGAINST CORRUPTION 36
11. DATA SEGREGATED BY GENDER, AREA, INCOME AND AGE 41
IV. SURVEY INSTRUMENT 58
TABLE OF CONTENTS

2 SURVEY ON PERCEPTIONS AND KNOWLEDGE OF CORRUPTION
I. INTRODUCTION
STAGE, the USAID-funded Strengthening Transparency and Governance in Mongo-
lia project, is back with the fourth installment of the semi-annual Survey on Percep-
tions and Knowledge of Corruption (SPEAK). The Asia Foundation implements the
SPEAK survey in partnership with the Sant Maral Foundation. Building on the earlier,
semi-annual benchmarking survey under the USAID-funded Mongolian Anti-Cor-
ruption Support project, the SPEAK survey captures data on citizens’ perceptions of
corruption, their actual experience of corruption at the household level, and Grand
Corruption.
The SPEAK survey, together with the Study of Private Perceptions of Corruption, or
STOPP, has been a defining feature of the STAGE project that continues to stimulate
anti-corruption programs both in state agencies and in the private and non-profit
sectors—for example, anti-corruption action plans in government agencies and pri-
vate businesses. Thus far, at least 5,000 copies of the SPEAK survey reports have
been distributed. Further dissemination efforts have reached out to tens of thou-
sands more people across Mongolia, shaping public discussion of national policies
and programs. The evidence-based results from these surveys have influenced the
project’s interventions at various stages, bolstering advocacy and monitoring ef-
forts, and expediting the development and implementation of reforms at the state
level.

3SURVEY ON PERCEPTIONS AND KNOWLEDGE OF CORRUPTION
II. KEY FINDINGS
- As in the three earlier surveys, corruption was named the third most important
problem in the country in 2014, and over 8 percent of respondents believed
corruption to be the most important problem in the country.
- In March 2014, “corruption in law enforcement bodies” was the most commonly
cited obstacle to the fight against corruption. In earlier surveys, “the habit of
solving problems through corrupt practices” was the most commonly cited
obstacle.
- Land utilization, local procurement tenders, and mining continued to be
considered the three most corrupt agencies or sectors. Political parties fell from
the top five.
- The public’s expectation of fair treatment from law enforcement and the judiciary
was significantly low.
- Respondents in general, are not satisfied with the actions against corruption,
but long-term observation since 2006 shows perceptions have improved.
- The incidence of reported cases of corruption significantly decreased.
- Men were consistently found to be more aware of public affairs, while women
were found to be more concerned with household or private affairs.
- Urban respondents had stronger opinions on corruption than rural
respondents.

4 SURVEY ON PERCEPTIONS AND KNOWLEDGE OF CORRUPTION
III. METHODOLOGY
The survey used structured, face-to-face interviews with adults 18 years of age and
above. Multi-stage, random sampling with probability sampling in area clusters was
used in the following stages.
In the first stage, Ulaanbaatar and up to two provinces (aimags) from each of the
four regions were randomly selected, followed by the selection of sub-districts
(khoroos) in Ulaanbaatar and of counties (soums) in aimags.
In the second stage, the Primary Sampling Units (PSU) were randomly selected in
Ulaanbaatar from among the sub-district sections (kheseg). In the aimag centers,
PSUs were randomly selected at the bag level (a bag is the smallest administrative
division of an aimag). In soum centers, the interview supervisor determined a block
of apartments or units, with eight households making up a PSU.
In the third stage, starting points and households were determined. Interviewers
in sub-districts of Ulaanbaatar were provided with apartment addresses (building
and flat numbers), whereas in ger districts, field executives provided interviewers
with street numbers and starting points. From the starting point, the interviewers
used the right hand rule and moved door to door, skipping two houses each time.
In aimags and soums, starting points were determined by supervisors. Interviewers
then followed the right hand rule and again selected every third household. At the
household level, the head of household or the household member who was most
familiar with household matters was selected for the interview.
This report discusses the findings of the SPEAK IV survey, started on March 15,
2014, and completed on March 30, 2014. The enumerators canvassed 170 PSUs,
comprising 1,360 households in seven districts of Ulaanbaatar and in 21 soums of
six aimags.1 The sample distribution is shown in the following table:
1 Results are based on face-to-face interviews with 1,360 adults age 18 and older. For results based on the total national sample of adults, the margin of sampling error is ±1.6 percentage points (if p=10 percent and 1-p=90 percent) to ±2.6 percentage points (if p=40 percent and 1-p=60 percent) at a confidence level of 95 percent. In addition to sampling error, question wording and practical difficulties in conducting surveys can introduce error or bias into the findings of public opinion polls.

5SURVEY ON PERCEPTIONS AND KNOWLEDGE OF CORRUPTION
Table A. Sample Distribution
Region City/Aimag District/Soum Interviewed households
1. Ulaanbaatar 560
Ulaanbaatar
Khan-Uul 64
Bayanzurkh 120
Sukhbaatar 64
Chingeltei 80
Bayangol 80
Songinokhairkhan 128
Nalaikh 24
Aimags 800
Western Region
2. Zavkhan 199
Uliastai (central soum) 80
Aldarkhaan 24
Durvuljin 24
Tosontsengel 40
Telmen 31
Khangai Region
3. Bulgan 120
Bulgan (central soum) 56
Burenkhangai 32
Orkhon 32
4. Bayankhongor 160
Bayankhongor (central soum) 57
Galuut 40
Bayan-Ovoo 32
Buutsagaan 31
Central Region
5. Umnugobi 105
Dalanzadgad (central soum) 48
Tsogttsetsii 32
Bayan-Ovoo 25
6. Selenge 120
Sukhbaatar (central soum) 56
Zuunburen 32
Javkhlant 32
Eastern Region
7. Sukhbaatar 96
Baruun-Urt (central soum) 40
Uulbayan 32
Asgat 24
Total 1,360

6 SURVEY ON PERCEPTIONS AND KNOWLEDGE OF CORRUPTION
1. MAJOR PROBLEMS
In order to present a more comprehensive picture of the corruption situation, these
analyses use some of the results from Sant Maral Foundation’s Politbarometer (PB)
surveys.
According to the PBs, “dealing with corruption” was identified as the “biggest suc-
cess” for the last two successive governments since 2012 (Table 1.2). During that
same period, the SPEAK survey also found growing approval of the state’s handling
of corruption.
The STOPP survey of December 2013 found that the recent economic crisis in Mon-
golia did not affect the general population as much as it did the private sector
(businesses). While the private sector’s confidence in the business environment was
not encouraging (STOPP, Dec. 2013), monthly household incomes had steadily risen
since March 2013, as reported in the last few SPEAK surveys (Table 1.1). This growth
was outpaced by inflation, however, and real incomes fell below 2012 levels.
Tellingly, “inflation” as a major problem rose significantly, from 7.5 percent in March
2013 to 21.5 percent in September 2013. Although it fell in March 2014 to 17.2
percent, it was still twice as high as in March 2013 (Figure 1.1). The ranking of “pov-
erty” showed a significant decline from 2012, while “corruption” held steady in
third place. Since 2006, concern about both “corruption” and “unemployment” has
decreased. “Unemployment” decreased from 35.6 percent in March 2006 to 26.5
percent in March 2014, and “corruption” decreased from 28.8 percent in March
2006 to 8.3 percent in March 2014 (Figures 1.2 and 1.3).
Table 1.1: Monthly income as reported by the SPEAK survey
SurveyMean (average of incomes
reported in MNT)N (number of respondents)
Std. Deviation (variation from the mean)2
November 2012 565159 1270 527378
March 2013 556815 1304 452935
September 2013 660370 1344 607425
March 2014 643978 1300 473821
2 The standard deviation shows how much variation or dispersion from the average exists. A low standard devia-tion indicates that the data points tend to be very close to the mean; a high standard deviation indicates that the data points are spread out over a large range of values.

7SURVEY ON PERCEPTIONS AND KNOWLEDGE OF CORRUPTION
Figure 1.1: Major problems, comparisons from 2012 - 2014
Nov-12 30,1% 8,7% 8,0% 9,3% 9,0% 1,3% 2,7% 3,0% 3,5% 0,7%
Mar-13 33,8% 7,5% 7,4% 7,2% 6,0% 0,5% 4,5% 4,3% 3,9% 0,8%
Sep-13 24,4% 21,5% 7,0% 4,3% 3,7% 4,0% 2,6% 3,4% 3,8% 2,5%
Mar-14 26,5% 17,2% 8,3% 5,6% 4,6% 4,0% 3,5% 3,4% 3,3% 2,4%
0,0%
5,0%
10,0%
15,0%
20,0%
25,0%
30,0%
35,0%
40,0%
Unem-ployment
Inflation Corruption Poverty EcologyNational Economy
Living Standard
Bureau-cracy
Alcoho- lism
Low income
Bureaucracy Alcoholism
Table 1.2: Government biggest success (Source: the SMF’s Politbarometer survey)
April 2012 April 2013 March 2014
Agriculture 25.1Dealing with
Corruption14.0
Dealing with
Corruption10.9
Economy \manufacturing\
mining10.5 Agriculture 7.2 Agriculture 10.3
Education 8.1
Economy\
manufacturing\
mining
6.3
Economy\
manufacturing\
mining
7.4
Reduction of
unemployment3.2 Education 5.5 Education 6.1
Improving of standard of
living\poverty\income2.6
Reduction of
unemployment4.0
Reduction of
unemployment5.8

8 SURVEY ON PERCEPTIONS AND KNOWLEDGE OF CORRUPTION
Figure 1.2: 2006-2013 Attitudes toward unemployment as the greatest concern (trends over time)
Mar-06
Sep-06
Mar-07
Sep-07
Mar-08
Sep-08
Mar-09
Sep-09
Mar-10
Sep-10
Apr-11
Nov-12
Mar-13
Sep-13
Mar-14
Unempl. 35.6% 39.0% 35.2% 29.4% 24.3% 24.6% 33.2% 35.2% 33.1% 36.0% 39.5% 30.1% 33.8% 24.4% 26.5%
0.0%
5.0%
10.0%
15.0%
20.0%
25.0%
30.0%
35.0%
40.0%
45.0%
Figure 1.3: 2006-2013 Attitudes toward corruption as the greatest concern (trends over time)
Mar-06
Sep-06
Mar-07
Sep-07
Mar-08
Sep-08
Mar-09
Sep-09
Mar-10
Sep-10
Apr-11
Nov-12
Mar-13
Sep-13
Mar-14
Corruption 28.8%27.6%16.3%22.2%18.2%12.5% 8.5% 14.3%10.1% 7.4% 4.5% 8.0% 7.4% 7.0% 8.3%
0.0%
5.0%
10.0%
15.0%
20.0%
25.0%
30.0%
35.0%

9SURVEY ON PERCEPTIONS AND KNOWLEDGE OF CORRUPTION
2. TRENDS IN PEOPLE’S ATTITUDES FROM 2006 TO 2014
Although a single survey chosen from the last eight years might paint a different
picture, the trend over time suggests that people’s attitude towards corruption is
improving, or in other words, that they believe that corruption in general is being
tackled satisfactorily.
In March 2014, for example, 81.3 percent of respondents believed “corruption is a
common practice in our country.” This is more than four fifths of respondents, but
it is still 10 percent fewer than the 91.1 percent respondents who agreed to this
proposition in the first survey in March 2006 (Figure 2.1). Although unemployment
still ranks as the most important problem, its importance has also gradually declined
over time (Figure 1.2).
In 2006, new anti-corruption legislation was introduced. Since then, the public’s
assessment of corruption has been rather volatile. A large number of respondents
believe that the existing anti-corruption legislation cannot curb corruption satisfac-
torily.
With the recent surge of anti-corruption activities, there has been a decline since
2006 in the number who believe there is no political will to tackle corruption, yet
opinion remains predominantly negative, with 76.6 percent of respondents in March
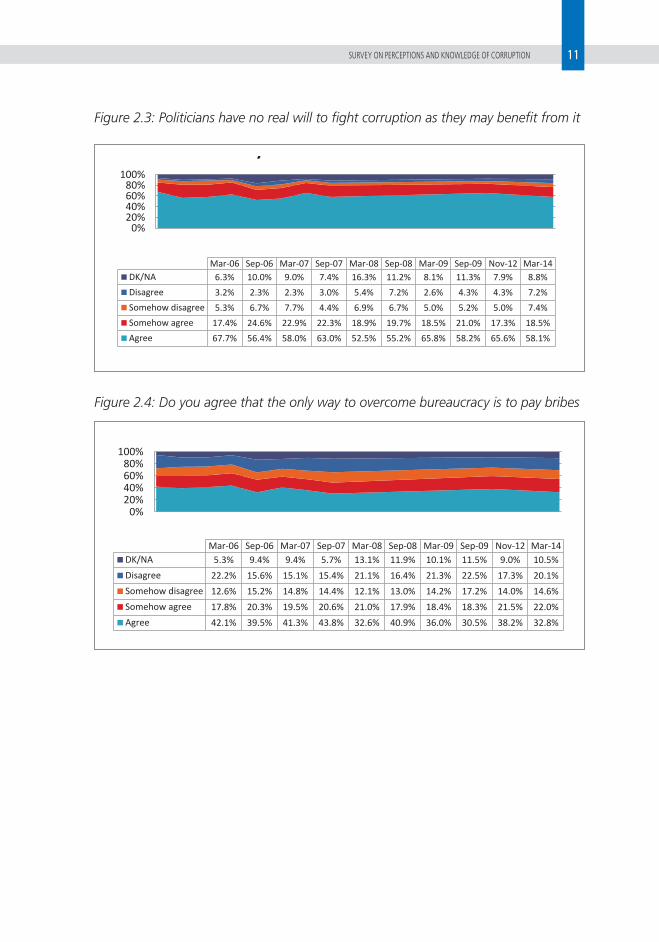
2014 still believing that political will is lacking (Figure 2.3).
A small variation is noted in “a bribe is the only way to overcome bureaucratic red
tape.” 54.8 percent of respondents in March 2014 agreed, compared to 59.9 per-
cent in 2006 (Figure 2.4). In contrast, “giving a bribe helps to overcome unjust regu-
lations” showed substantial progress, dropping about 12 points from 66.8 percent
in 2006 to 54.3 percent in 2014 (Figure 2.7).
Respondents continued to believe that small and medium businesses are more neg-
atively affected by corruption than large businesses. There has been a change of
less than one percentage point since 2006, with 76.4 percent agreeing in 2014 that
large businesses are less affected (Figure 2.5).
Similarly, despite growing public debate, nearly three fourths of Mongolians still
believe that givers and takers of bribes are equally culpable—74.1 percent in 2006,
and 74.8 percent in 2014 (Figure 2.10).
The good news is that the number of respondents who believe some level of cor-
ruption “is acceptable” has dropped slightly, from 36.8 percent in 2006 to 33.9 per-
cent in 2014 (Figure 2.6), but the current figure is still much worse than September
2009, when it was at a low of 22.8 percent.
One of the more positive observations is a steady improvement in the assessment of
local administrative officials. 53.4 percent of respondents now believe they can rely
on the performance of administrative officials, compared to 38.2 percent in 2006

10 SURVEY ON PERCEPTIONS AND KNOWLEDGE OF CORRUPTION
(Figure 2.8). Also, the number of respondents who believe some level of corruption
“is expected” (i.e., petty corruption) has declined from 68.8 percent in 2006 to 56.9
percent in 2014, a drop of nearly 12 percentage points. (Figure 2.9).
Figure 2.1: Corruption is a common practice in our country
0%10%20%30%40%50%60%70%80%90%
100%
Mar-06 Sep-06 Mar-07 Sep-07 Mar-08 Sep-08 Mar-09 Sep-09 Nov-12 Mar-14DK/NA 1.4% 3.0% 3.0% 1.5% 4.3% 3.9% 3.3% 3.3% 4.7% 6.4%
Disagree 2.7% 3.3% 4.0% 4.0% 4.3% 5.2% 3.9% 4.2% 4.5% 6.0%
Somehow disagree 4.8% 4.2% 4.2% 5.2% 6.6% 7.5% 5.4% 6.5% 6.2% 6.3%
Somehow agree 13.1% 15.8% 18.2% 14.5% 22.4% 19.8% 17.6% 19.2% 20.2% 18.6%
Agree 78.0% 73.7% 70.7% 74.7% 62.5% 63.7% 69.8% 66.8% 64.4% 62.7%
Figure 2.2: The existing legislation on corruption is not working effectively
0%
20%
40%
60%
80%
100%
Mar-06 Sep-06 Mar-07 Sep-07 Mar-08 Sep-08 Mar-09 Sep-09 Nov-12 Mar-14DK/NA 4.7% 9.3% 12.8% 7.3% 10.6% 11.6% 10.8% 13.8% 9.0% 8.8%
Disagree 3.3% 4.2% 2.2% 3.9% 7.1% 4.5% 4.5% 6.5% 4.5% 3.8%
Somehow disagree 3.2% 6.3% 5.1% 6.3% 6.9% 8.9% 6.1% 9.3% 7.4% 8.1%
Somehow agree 15.2% 21.8% 17.5% 17.1% 15.2% 15.1% 14.2% 17.3% 16.5% 19.5%
Agree 73.5% 58.4% 62.5% 65.4% 60.2% 59.9% 64.4% 53.0% 62.6% 59.9%
11SURVEY ON PERCEPTIONS AND KNOWLEDGE OF CORRUPTION
Figure 2.3: Politicians have no real will to fight corruption as they may benefit from it
0%20%40%60%80%
100%
y
Mar-06 Sep-06 Mar-07 Sep-07 Mar-08 Sep-08 Mar-09 Sep-09 Nov-12 Mar-14DK/NA 6.3% 10.0% 9.0% 7.4% 16.3% 11.2% 8.1% 11.3% 7.9% 8.8%
Disagree 3.2% 2.3% 2.3% 3.0% 5.4% 7.2% 2.6% 4.3% 4.3% 7.2%
Somehow disagree 5.3% 6.7% 7.7% 4.4% 6.9% 6.7% 5.0% 5.2% 5.0% 7.4%
Somehow agree 17.4% 24.6% 22.9% 22.3% 18.9% 19.7% 18.5% 21.0% 17.3% 18.5%
Agree 67.7% 56.4% 58.0% 63.0% 52.5% 55.2% 65.8% 58.2% 65.6% 58.1%
Figure 2.4: Do you agree that the only way to overcome bureaucracy is to pay bribes
Mar-06 Sep-06 Mar-07 Sep-07 Mar-08 Sep-08 Mar-09 Sep-09 Nov-12 Mar-14DK/NA 5.3% 9.4% 9.4% 5.7% 13.1% 11.9% 10.1% 11.5% 9.0% 10.5%
Disagree 22.2% 15.6% 15.1% 15.4% 21.1% 16.4% 21.3% 22.5% 17.3% 20.1%
Somehow disagree 12.6% 15.2% 14.8% 14.4% 12.1% 13.0% 14.2% 17.2% 14.0% 14.6%
Somehow agree 17.8% 20.3% 19.5% 20.6% 21.0% 17.9% 18.4% 18.3% 21.5% 22.0%
Agree 42.1% 39.5% 41.3% 43.8% 32.6% 40.9% 36.0% 30.5% 38.2% 32.8%
0%20%40%60%80%
100%

12 SURVEY ON PERCEPTIONS AND KNOWLEDGE OF CORRUPTION
Figure 2.5: Small and medium business are more negatively affected by corruption than are the large businesses
0%
50%
100%
Mar-06 Sep-06 Mar-07 Sep-07 Mar-08 Sep-08 Mar-09 Sep-09 Nov-12 Mar-14DK/NA 10.7% 19.5% 15.8% 15.2% 20.2% 14.7% 16.9% 20.2% 10.1% 13.5%
Disagree 4.6% 3.5% 5.4% 4.7% 6.8% 8.0% 4.5% 6.8% 3.5% 3.5%
Somehow disagree 7.7% 5.9% 10.4% 13.1% 12.1% 9.2% 6.8% 9.0% 7.6% 6.7%
Somehow agree 22.6% 21.5% 23.9% 22.6% 18.7% 19.2% 22.6% 25.8% 19.1% 17.4%
Agree 54.4% 49.7% 44.5% 44.4% 42.1% 48.8% 49.2% 38.2% 59.7% 59.0%
Figure 2.6: Some level of corruption is acceptable
0%
50%
100%
Mar-06
Sep-06Mar-
07Sep-07
Mar-08
Sep-08Mar-
09Sep-09
Mar-10
Sep-10Nov-
12Mar-
14DK/NA 5.9% 7.7% 8.7% 7.1% 11.4% 12.4% 10.2% 11.2% 5.9% 5.8% 8.1% 7.5%
Disagree 41.8% 38.8% 34.2% 34.6% 44.4% 32.8% 44.1% 44.0% 43.5% 41.9% 38.0% 42.6%
Somehow disagree 15.4% 16.8% 19.4% 14.3% 16.4% 17.3% 14.9% 22.0% 17.6% 16.6% 17.4% 16.0%
Somehow agree 22.5% 18.8% 17.9% 19.3% 16.4% 15.3% 17.3% 15.5% 18.2% 21.5% 20.4% 17.9%
Agree 14.3% 18.0% 19.9% 24.7% 11.3% 22.2% 13.5% 7.3% 14.8% 14.2% 16.2% 16.0%

13SURVEY ON PERCEPTIONS AND KNOWLEDGE OF CORRUPTION
Figure 2.7: Giving a bribe helps to overcome unjust regulations
0%20%40%60%80%
100%
Mar-06 Sep-06 Mar-07 Sep-07 Mar-08 Sep-08 Mar-09 Sep-09 Nov-12 Mar-14DK/NA 9.9% 15.4% 12.6% 9.7% 16.1% 13.2% 15.3% 14.7% 12.7% 18.5%
Disagree 13.5% 8.9% 12.5% 9.2% 14.1% 13.0% 15.2% 16.2% 13.6% 14.3%
Somehow disagree 9.7% 10.4% 8.9% 14.6% 16.4% 14.0% 13.8% 16.3% 12.6% 12.9%
Somehow agree 24.6% 25.8% 27.3% 25.3% 22.3% 21.3% 19.9% 24.0% 24.9% 24.7%
Agree 42.2% 39.6% 38.7% 41.2% 31.0% 38.5% 35.8% 28.8% 36.2% 29.6%
Figure 2.8: Local administration in general are reliable and responsible people
0%
20%
40%
60%
80%
100%
Mar-06 Sep-06 Mar-07 Sep-07 Mar-08 Sep-08 Mar-09 Sep-09 Nov-12 Mar-14DK/NA 8.0% 10.5% 9.6% 8.9% 16.4% 11.7% 10.8% 9.5% 9.9% 10.8%
Disagree 25.4% 24.6% 21.1% 21.6% 23.4% 22.2% 23.2% 18.8% 22.3% 17.2%
Somehow disagree 28.5% 23.2% 25.7% 24.6% 17.4% 17.5% 21.5% 25.8% 21.8% 18.5%
Somehow agree 19.4% 21.7% 22.5% 26.1% 23.2% 24.9% 23.6% 25.8% 22.2% 24.3%
Agree 18.8% 19.9% 21.1% 18.8% 19.6% 23.5% 20.9% 20.0% 23.8% 29.1%

14 SURVEY ON PERCEPTIONS AND KNOWLEDGE OF CORRUPTION
Figure 2.9: Some level of corruption is expected
0%
20%
40%
60%
80%
100%
Mar-06 Sep-06 Mar-07 Sep-07 Mar-08 Sep-08 Mar-09 Sep-09 Nov-12 Mar-14DK/NA 7.2% 11.6% 9.7% 6.1% 18.0% 14.2% 12.0% 15.5% 12.9% 14.4%
Disagree 13.2% 10.1% 11.4% 14.8% 14.9% 10.2% 15.7% 11.0% 14.8% 15.7%
Somehow disagree 10.8% 10.4% 11.0% 11.6% 12.9% 11.2% 10.2% 10.7% 13.2% 12.9%
Somehow agree 26.8% 28.9% 29.5% 22.4% 21.6% 21.2% 20.2% 26.2% 27.1% 23.9%
Agree 42.0% 39.1% 38.4% 45.2% 32.7% 43.1% 41.9% 36.7% 32.1% 33.0%
Figure 2.10: The person who gives a bribe is equally responsible as the one who accepts it
0%20%40%60%80%
100%
Mar-06
Sep-06Mar-
07Sep-07
Mar-08
Sep-08Mar-
09Sep-09
Mar-10
Sep-10Nov-
12Mar-
14DK/NA 7.4% 9.9% 9.8% 7.6% 12.5% 11.5% 7.9% 10.2% 9.6% 6.1% 8.0% 8.2%
Disagree 9.8% 12.6% 12.8% 11.7% 8.1% 9.5% 8.2% 11.5% 15.5% 16.1% 8.3% 8.1%
Somehow disagree 8.7% 7.6% 11.4% 9.4% 9.4% 10.7% 8.3% 7.0% 11.9% 11.1% 9.6% 8.9%
Somehow agree 13.5% 14.8% 14.1% 17.1% 12.9% 14.5% 11.2% 17.5% 13.3% 17.1% 22.1% 17.9%
Agree 60.6% 55.2% 51.9% 54.2% 57.2% 53.8% 64.4% 53.8% 49.7% 49.6% 52.1% 56.9%
15SURVEY ON PERCEPTIONS AND KNOWLEDGE OF CORRUPTION
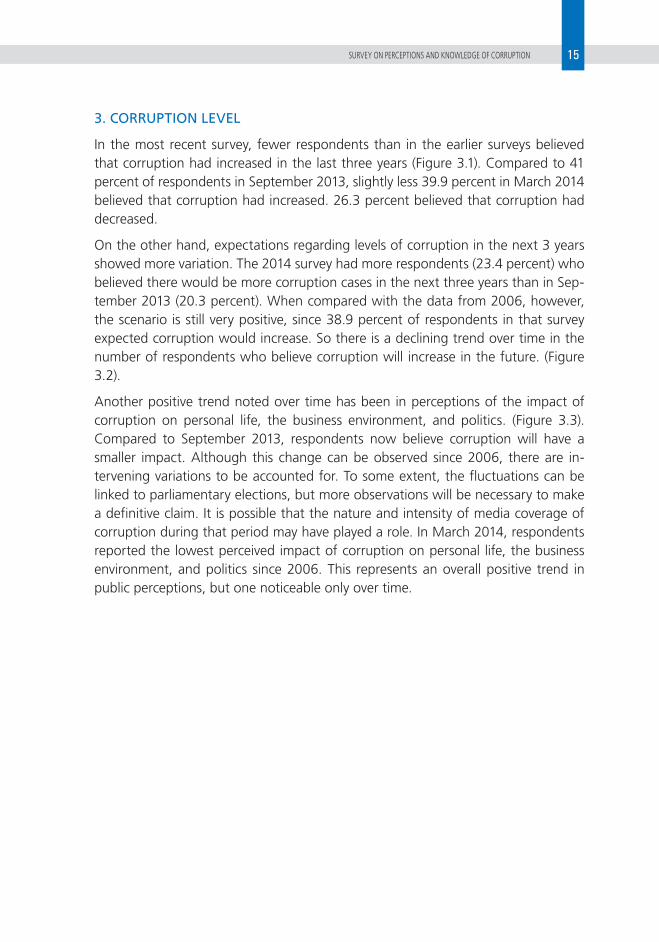
3. CORRUPTION LEVEL
In the most recent survey, fewer respondents than in the earlier surveys believed
that corruption had increased in the last three years (Figure 3.1). Compared to 41
percent of respondents in September 2013, slightly less 39.9 percent in March 2014
believed that corruption had increased. 26.3 percent believed that corruption had
decreased.
On the other hand, expectations regarding levels of corruption in the next 3 years
showed more variation. The 2014 survey had more respondents (23.4 percent) who
believed there would be more corruption cases in the next three years than in Sep-
tember 2013 (20.3 percent). When compared with the data from 2006, however,
the scenario is still very positive, since 38.9 percent of respondents in that survey
expected corruption would increase. So there is a declining trend over time in the
number of respondents who believe corruption will increase in the future. (Figure
3.2).
Another positive trend noted over time has been in perceptions of the impact of
corruption on personal life, the business environment, and politics. (Figure 3.3).
Compared to September 2013, respondents now believe corruption will have a
smaller impact. Although this change can be observed since 2006, there are in-
tervening variations to be accounted for. To some extent, the fluctuations can be
linked to parliamentary elections, but more observations will be necessary to make
a definitive claim. It is possible that the nature and intensity of media coverage of
corruption during that period may have played a role. In March 2014, respondents
reported the lowest perceived impact of corruption on personal life, the business
environment, and politics since 2006. This represents an overall positive trend in
public perceptions, but one noticeable only over time.

16 SURVEY ON PERCEPTIONS AND KNOWLEDGE OF CORRUPTION
Figure 3.1: Corruption in the last three years
Mar-06
Mar-07
Mar-08
Mar-09
Mar-10
Nov-12
Sep-13
Mar-06
Sep-06
Mar-07
Sep-07
Mar-08
Sep-08
Mar-09
Sep-09
Mar-10
Sep-10
Nov-12
Mar-13
Sep-13
Mar-14
Increased a lot 63.1%50.7%54.0%52.1%48.9%54.9%34.0%38.6%48.8%43.3%38.9%22.7%18.2%17.4%
Increased a little 18.2%23.9%22.6%24.3%19.9%17.4%25.3%21.4%22.0%26.9%21.5%25.6%22.8%22.5%
Is the same 15.1%21.1%20.7%20.8%23.2%21.9%28.0%29.5%22.5%21.0%25.8%34.1%31.5%33.8%
Decreased a little 3.4% 4.3% 2.6% 2.6% 7.1% 5.4% 11.7% 9.8% 6.1% 8.5% 12.9%16.7%25.7%25.0%
Decreased a lot 0.2% 0.0% 0.0% 0.2% 1.0% 0.4% 1.0% 0.8% 0.6% 0.3% 0.9% 0.9% 1.8% 1.3%
Figure 3.2: What will be the situation of corruption in the next three years
0% 10% 20% 30% 40% 50% 60% 70% 80% 90% 100%
Mar-06
Sep-06
Mar-07
Sep-07
Mar-08
Sep-08
Mar-09
Sep-09
Mar-10
Sep-10
Nov-12
Mar-13
Sep-13
Mar-14
Mar-06
Sep-06
Mar-07
Sep-07
Mar-08
Sep-08
Mar-09
Sep-09
Mar-10
Sep-10
Nov-12
Mar-13
Sep-13
Mar-14
Increase a lot 26.0%27.6%21.1%24.3%18.8%30.4%22.2%20.3%26.8%22.1%12.5% 9.1% 8.5% 9.4%
Increase a little 12.9%16.4%14.3%17.7%15.4%15.3%17.8%11.6%15.2%18.0%14.0%11.0%11.8%14.0%
Remain the same 35.3%27.8%29.8%27.4%32.8%25.5%27.2%32.9%32.7%31.7%28.9%31.1%27.1%30.8%
Decrease a little 23.9%25.1%29.3%26.7%29.1%23.0%26.2%27.4%21.5%24.5%38.5%42.9%43.6%38.6%
Decrease a lot 1.9% 3.2% 5.5% 3.9% 3.9% 5.9% 6.5% 7.9% 3.8% 3.7% 6.1% 5.9% 8.9% 7.2%

17SURVEY ON PERCEPTIONS AND KNOWLEDGE OF CORRUPTION
Figure 3.3: Impact of corruption on personal life, business environment, and politics
4. FAIR TREATMENT
After 2010,3 there is a visible trend in expectations of fair treatment in the educa-
tion and healthcare sectors (fig 3.4). A majority continues to believe the education
sector is the fairest. The healthcare sector has shown gradual improvement since
2010, but a majority still does not expect fair treatment from the healthcare sector.
This may be related to the perception that healthcare workers are more frequent
bribe-takers.
The expectation of fair treatment from local and national administrations has con-
siderably improved. It is possible that the delivery of public services and the behavior
of service providers have improved in recent times.
In contrast to these improvements, public expectations of fair treatment from law
enforcement and the judiciary are much worse than from other agencies. It is pos-
sible that respondents have not seen any improvement in service from these insti-
tutions. In all the surveys, for example, respondents were least likely to pick “po-
lice” to report bribery. Although the reported number of bribes given to police and
judges is low, the amounts reported are noticeably high. This contributes to a fear
of the weakening of the rule of law. With regard to the judiciary, there was some
improvement in respondents’ expectations of fair treatment from March 2010 to
March 2013, but this improvement was uneven, and the trend since then has been
negative.
3 The block of questions on “fairness” was introduced in 2010.

18 SURVEY ON PERCEPTIONS AND KNOWLEDGE OF CORRUPTION
Fig: 3.4 Expectation of fair treatment from different government agencies
67.4%
63.5%
61.4%
54.2%
63.2%
59.1%
32.6%
36.5%
38.6%
45.8%
36.8%
40.9%
Mar-10
Sep-10
Nov-12
Mar-13
Sep-13
Mar-14
Healthcare system Not Fair Fair
76.7%
74.2%
74.5%
68.8%
69.9%
70.1%
23.3%
25.8%
25.5%
31.2%
30.1%
29.9%
Mar-10
Sep-10
Nov-12
Mar-13
Sep-13
Mar-14
Judiciary Not Fair Fair
64.2%
52.9%
58.7%
51.2%
35.8%
47.1%
41.3%
48.8%
Nov-12
Mar-13
Sep-13
Mar-14
Local Government Not Fair Fair
60.1%
55.8%
54.6%
44.7%
55.6%
48.3%
39.9%
44.2%
45.4%
55.3%
44.4%
51.7%
Mar-10
Sep-10
Nov-12
Mar-13
Sep-13
Mar-14
Educational system Not Fair Fair
74.3%
73.2%
75.9%
67.1%
69.8%
69.9%
25.7%
26.8%
24.1%
32.9%
30.2%
30.1%
Mar-10
Sep-10
Nov-12
Mar-13
Sep-13
Mar-14
Law enforcement Not Fair Fair
63.9%
54.7%
60.5%
52.6%
36.1%
45.3%
39.5%
47.4%
Nov-12
Mar-13
Sep-13
Mar-14
National Government Not Fair Fair

19SURVEY ON PERCEPTIONS AND KNOWLEDGE OF CORRUPTION
5. GENERAL OR PETTY CORRUPTION4
A majority of respondents consider it corruption to use a public position for per-
sonal gain, including to help friends and relatives (Figures 5.1 and 5.2). This view
has been stable and largely unanimous. Respondents have shown a similarly stable
consensus that it is corruption to give presents or money to civil servants to obtain
services one is entitled to. (Figure 5.5).
The consensus is weaker for other cases, however. Giving a gift in an election cam-
paign, and diverting state funds to one’s own electorate are considered corruption
by a smaller (though still substantial) number of respondents (Figures 5.3 and 5.4).
Responses in these categories also show more variability over time, and are prob-
ably influenced by elections. In particular, diverting state funds to one’s own elec-
torate shows the widest variability of all indicators since the beginning of the survey
in 2006. Perhaps because it involves complex assessments of costs and benefits, this
question may be the most difficult for respondents to decide.
After falling from November 2012 to March 2013, the number of respondents be-
lieving that private financing of political parties is corrupt has again increased. This
category is also unstable, since it is also more likely to be influenced by elections
(Figure 5.6).
Figure 5.1: Using public position to collect gifts, money
0.0
20.0
40.0
60.0
80.0
100.0
Mar
-06
Jul-0
6
Nov
-06
Mar
-07
Jul-0
7
Nov
-07
Mar
-08
Jul-0
8
Nov
-08
Mar
-09
Jul-0
9
Nov
-09
Mar
-10
Jul-1
0
Nov
-10
Mar
-11
Jul-1
1
Nov
-11
Mar
-12
Jul-1
2
Nov
-12
Mar
-13
Jul-1
3
Nov
-13
Mar
-14
Mar-06 Sep-06 Mar-07 Sep-07 Mar-08 Sep-08 Mar-09 Sep-09 Nov-12 Mar-13 Mar-14Yes 98.5 96.5 97.7 96.3 97.3 98.1 96.4 98.8 97.9 98.1 95.8%
4 In the December 2013 report, it was noted that September 2013 results showed no change from earlier surveys, but that this may have been due to changes in question design. In analysis, for example, only “yes” responses were considered. In the later measurement, in March 2014, it was determined that methodological changes had indeed had an effect. Therefore, the September 2013 results for this block of questions were deemed methodologically incompatible with the rest of the results and were excluded from the trend lines.

20 SURVEY ON PERCEPTIONS AND KNOWLEDGE OF CORRUPTION
Figure 5.2: Using a public position to help friends, relatives (such as giving jobs, licenses)
0.0
20.0
40.0
60.0
80.0
100.0
Mar
-06
Jul-0
6
Nov
-06
Mar
-07
Jul-0
7
Nov
-07
Mar
-08
Jul-0
8
Nov
-08
Mar
-09
Jul-0
9
Nov
-09
Mar
-10
Jul-1
0
Nov
-10
Mar
-11
Jul-1
1
Nov
-11
Mar
-12
Jul-1
2
Nov
-12
Mar
-13
Jul-1
3
Nov
-13
Mar
-14
Mar-06 Sep-06 Mar-07 Sep-07 Mar-08 Sep-08 Mar-09 Sep-09 Nov-12 Mar-13 Mar-14Yes 96.7 96.4 96.3 96.9 98.0 97.9 97.3 99.1 97.8 97.4 96.0%
Figure 5.3: Distributing gifts in an election campaign
0.0
20.0
40.0
60.0
80.0
100.0
Mar
-06
Aug
-06
Jan-
07
Jun-
07
Nov
-07
Apr
-08
Sep-
08
Feb-
09
Jul-0
9
Dec
-09
May
-10
Oct
-10
Mar
-11
Aug
-11
Jan-
12
Jun-
12
Nov
-12
Apr
-13
Sep-
13
Feb-
14
Mar-06 Sep-06 Mar-07 Sep-07 Mar-08 Sep-08 Mar-09 Sep-09 Nov-12 Mar-13 Mar-14Yes 94.2 88.7 86.0 92.8 91.8 91.6 90.6 94.3 81.1 87.7 85.5
Figure 5.4: Politicians diverting state funds to their own electorate
0.0
20.0
40.0
60.0
80.0
100.0
Mar
-06
Aug-
06
Jan-
07
Jun-
07
Nov
-07
Apr-
08
Sep-
08
Feb-
09
Jul-0
9
Dec
-09
May
-10
Oct
-10
Mar
-11
Aug-
11
Jan-
12
Jun-
12
Nov
-12
Apr-
13
Sep-
13
Feb-
14
Mar-06 Sep-06 Mar-07 Sep-07 Mar-08 Sep-08 Mar-09 Sep-09 Nov-12 Mar-13 Mar-14Yes 80.4 73.4 72.8 78.4 84.8 87.0 84.4 89.9 78.0 69.9 71.9

21SURVEY ON PERCEPTIONS AND KNOWLEDGE OF CORRUPTION
Figure 5.5: Giving presents or money to civil servants to obtain services entitled to
96.0% 95.9% 94.4%
Nov 12 Mar 13 Mar-14
Yes
Figure 5.6: For private people to finance political party activity
91.2%86.9% 89.4%
Nov 12 Mar 13 Mar-14
Yes

22 SURVEY ON PERCEPTIONS AND KNOWLEDGE OF CORRUPTION
Figure 5.7: Respondents agreement whether the given scenario is a case of corruption ‘to a large extent’
0.0%10.0%20.0%30.0%40.0%50.0%60.0%70.0%
Mar
-06
Jul-0
6N
ov-0
6M
ar-0
7Ju
l-07
Nov
-07
Mar
-08
Jul-0
8N
ov-0
8M
ar-0
9Ju
l-09
Nov
-09
Mar
-10
Jul-1
0N
ov-1
0M
ar-1
1Ju
l-11
Nov
-11
Mar
-12
Jul-1
2N
ov-1
2M
ar-1
3Ju
l-13
Nov
-13
Mar
-14
Mar-06
Sep-06
Mar-07
Sep-07
Mar-08
Sep-08
Mar-09
Sep-09
Nov-12
Mar-13
Mar-14
Using public position to collectmoney
49.8% 45.1% 50.5% 53.7% 47.7% 44.0% 46.9% 43.7% 55.0% 42.1% 39.1%
Using public position to helpfriends
56.3% 49.1% 58.8% 57.3% 54.4% 51.2% 56.4% 57.0% 62.8% 53.8% 46.5%
Distributing gifts in Electioncampaign
36.1% 34.0% 31.3% 36.5% 36.9% 34.3% 42.9% 38.1% 36.7% 31.0% 25.6%
To divert state funds to ownElectorate
20.6% 15.8% 17.9% 23.5% 26.4% 25.9% 29.6% 26.8% 28.5% 18.5% 20.1%
6. SECTORS OR AGENCIES AFFECTED BY CORRUPTION
Since November 2012, land utilization, state mining, and local procurement offices
have consistently been ranked as the three most corrupt agencies or sectors. In
March 2013, the mining sector was divided into two categories, private and state-
owned, to see whether respondents distinguished between the two. Respondents
identified the public sector as more corrupt, which agrees with findings from the
STOPP survey (Table 6.1).
In 2014 customs appeared among the top five most corrupt agencies climbing to
3.62 from 3.53 in September 2013. Political parties fell in the corruption rankings
from 3.69 to 3.49, down from fourth to eighth place, possibly because elections
were over. They were replaced by the judiciary, which moved into fourth position
from seventh with a rating increase from 3.59 to 3.63 (Figure 6.1).

23SURVEY ON PERCEPTIONS AND KNOWLEDGE OF CORRUPTION
Tab 6.1: Top five corrupt agencies or sectors
Survey 1 rank 2 rank 3 rank 4 rank 5 rank
Mar-06 Land
Utilization
Customs Mining Judges Police
Sep-06 Land
Utilization
Customs Mining Judges Police
Mar-07 Land
Utilization
Customs Mining Judges Registry and
Permit Service
Sep-07 Land
Utilization
Mining Customs Registry
and Permit
Service
Judges
Mar-08 Land
Utilization
Mining Customs Registry
and Permit
Service
Judges
Sep-08 Land
Utilization
Mining Customs Judges Prosecutors
Mar-09 Land
Utilization
Mining Judges Customs Prosecutors
Sep-09 Land
Utilization
Judges Police Prosecutors Mining
Mar-10 Land
Utilization
Mining Political Parties Customs Parliament/
Legislature
Sep-10 Land
Utilization
Mining Judges Customs Political Parties
Apr-11 Land
Utilization
Mining Judges Customs Political Parties
Nov-12 Land
Utilization
Mining Local
Procurement
Tenders
Professional
Inspection
Agency
Political Parties
Mar-13 Land
Utilization
State-owned
Mining
Local
Procurement
Tenders
Political
Parties
Customs
Sep-13 Land
Utilization
State-owned
Mining
Local
Procurement
Tenders
Political
Parties
Private
companies in
Mining Sector
Mar-14 Land
Utilization
State-owned
Mining
Local
Procurement
Tenders
Judges Customs

24 SURVEY ON PERCEPTIONS AND KNOWLEDGE OF CORRUPTION
Figure 6.1: Extent of Corruption (from 1: “not at all” to 5: “extreme”)
State regulated mining sectorLocal Procurement Tenders
Private companies in Mining SectorParliament / Legislature
Judicial SystemCustoms
Health SystemRegistry and Permit Service
Banking System
September 2013
4.05
3.93
3.75
3.69
3.62
3.61
3.59
3.53
3.51
3.51
3.47
3.45
3.33
3.31
3.21
3.15
2.54
State regulated mining sectorLocal Procurement Tenders
Judicial SystemCustoms
Private companies in Mining Sector
Health System
Parliament / Legislature
Registry and Permit Service
Banking System
March 2014
4.05
3.90
3.78
3.63
3.62
3.57
3.51
3.49
3.49
3.48
3.35
3.22
3.19
3.16
3.09
2.99
2.59

25SURVEY ON PERCEPTIONS AND KNOWLEDGE OF CORRUPTION
7. UNDERSTANDING GRAND CORRUPTION
After two years of observing attitudes toward Grand Corruption (GC), some trends
are apparent (Figure 7.1). The definition respondents most commonly associated
with GC in March 2014 was “cases involving high-level public officials.” From the
earliest to the most recent surveys, the number of respondents with this conception
of GC has been the most preferred one barring September 2013. GC was defined
as “cases where the bribe amount is very large” by 16.7 percent in 2014, closely fol-
lowed by the “cases with strong political interests” (16.3 percent). “Cases where big
local and foreign businesses are involved” has steadily declined from 14.9 percent in
November 2012 to 11.3 percent in March 2014.
Additionally, since the beginning in 2012, respondents have perceived a decline in
GC in Mongolia (Figure 7.2). About 53 percent of respondents in November 2012
believed that there was a significant level of GC in Mongolia, while in March 2014,
46 percent believed so. The good news is that more respondents than before are
paying attention and are familiar with the term “Grand Corruption” (Figure 7.3).
Compared to the 16 percent of respondents who said they “often” heard about GC
cases in November 2012, 22 percent said so in March 2014. Similarly, more respon-
dents are saying that GC has an impact on household economy (Figure 7.4). While
32 percent said that GC had no impact on their households in November 2012, just
22 percent held that view in March 2014.
Figure 7.1: Understanding Grand Corruption
26.9%
24.8%
16.7%
26.9%
21.8%
17.6%
24.2%
16.3%
14.9%
14.5%
12.0%
11.3%
12.4%
16.1%
16.9%
14.2%
12.0%
11.9%
15.2%
16.7%
11.4%
14.6%
14.3%
14.1%
0.5%
0.4%
0.6%
0.5%
0% 10% 20% 30% 40% 50% 60% 70% 80% 90% 100%
Nov-12
Mar-13
Sep-13
Mar-14
Cases with involvement of high level public o cials Cases with strong poli cal interest
Cases where big local and foreign businesses are involved Cases with high level damage to the country
Bribe amount is a very big one Cases which organized crime is involved in
Other

26 SURVEY ON PERCEPTIONS AND KNOWLEDGE OF CORRUPTION
Figure 7.2: What do you think about the level of Grand Corruption in Mongolia?
There is no GC in Mongolia
There are only few cases of GC
There are some cases of GC
There is a significant amount of GC
53%30%
16%1%
Nov-12
47%
36%
16%1%
Mar-13
There is no GC in Mongolia
There are only few cases of GC
There are some cases of GC
There is a significant amount of GC
There is no GC in Mongolia
48%
37%
14% 1%
Sep-13There are only few cases of GC
There are some cases of GC
There is a significant amount of GC
46%
40%
13% 1%
Mar-14

27SURVEY ON PERCEPTIONS AND KNOWLEDGE OF CORRUPTION
Figure 7.3: How frequently do you hear about Grand Corruption incidences?
16%
Rarely53%
Never12%
DK19%
Nov-12
22%
Rarely53%
Never13%
DK12%
Mar-13
26%
Rarely51%
Never9%
DK14%
Sep-13
22%
Rarely52%
Never11%
DK15%
Mar-14
Figure 7.4: Do you think that GC has any negative impact on you and your family?
Very strong12%
Some42%
Small14%
Not at all
32%
Nov-12
Very strong15%
Some45%
Small20%
Not at all
20%
Mar-13
Very strong10%
Some45%Small
21%
Not at all
24%
Sep-13
Very strong15%
Some42%
Small21%
Not at all
22%
Mar-14

28 SURVEY ON PERCEPTIONS AND KNOWLEDGE OF CORRUPTION
8. LEAD AGENCY AGAINST CORRUPTION
In 2006, when a special unit to combat corruption was being discussed, the Corrup-
tion Benchmarking Survey showed that almost half of respondents (46.6 percent)
preferred the government as the lead agency to combat corruption (Figure 8.1). But
apparently because of the ineffectiveness of existing measures, a still non-existent
“Special Elite Unit” received almost the same support (40.7 percent). This suggested
a high demand for such a unit, which later figured in the creation of the Indepen-
dent Authority Against Corruption or IAAC.
Come 2007, however, the newly founded IAAC had problems gaining public confi-
dence as the scope of work far outgrew its capacity. The 2010 assessment showed
that 69.6 percent of respondents were not confident in the IAAC. Lack of confi-
dence reached an all-time high of 73 percent in 2011. Nonetheless, public percep-
tions significantly shifted to IAAC’s favor in November 2012, and lack of confidence
gradually declined to 61.6 percent in 2013, and then 54.3 percent in March 2014
(Figures 8.6 and 8.7).
These results are supported by additional data. In March 2010, only 7.8 percent of
respondents evaluated the IAAC positively (either “good” or “very good”), but in
November 2012, that number had nearly doubled to 15.6 percent. In March 2014,
favorable evaluations of the IAAC had reached 22.6 percent, a nearly threefold in-
crease over March 2010 (Figure 8.5).
One of the major challenges for the IAAC over the years has been to overcome the
public perception that it is politically motivated, a view held by slightly more than
three fourths of respondents in March 2010 (78.3 percent). The IAAC, however,
through its educational and public outreach programs, has gradually managed to
improve public perception. The number of respondents who believe the IAAC is
politically motivated declined to 74 percent in November 2012, and reached a new
low of 65.3 percent in March 2014 (Figure 8.8).5
A plurality of Mongolians now believe the IAAC should take the lead in combating
corruption (Figure 8.6). Public confidence in civil society is low and has shown no
signs of improvement. Expectations of the president have risen slightly, but he has
no real means to deal with the problem. The scenario is somewhat different, how-
ever, in the case of Grand Corruption.
The number of respondents who prefer the IAAC to lead in cases of GC is about half
the number that prefer the IAAC in cases of general corruption, with nearly 52 per-
cent still unable to form an opinion on GC (Figure 8.4). With a majority of respon-
dents linking GC to the public sector and high-level public officials, it is clear that the
IAAC needs to do something meaningful about GC to gain more public trust.
5 The recent debate between the IAAC and Prime Minister Altanhuyag, who said that IAAC is disrupting the government’s constructive activity, happened after the data were collected, and so did not affect the findings.

29SURVEY ON PERCEPTIONS AND KNOWLEDGE OF CORRUPTION
Figure 8.1: In your opinion, who should organize and lead the effort to combat corruption (2 choices)
46.6%
13.5%
26.4%
11.1%
28.2%
8.8% 8.6%
40.7%
2.5%
(2006, 2 choices)
Figure 8.2: In your opinion, who should organize and lead the effort to combat corruption (1 choice)
Nov
Ma
Sep
Ma
IAA
v-12 44.
r-13 39.
p-13 42.
r-14 40.
ACG
.4%
.4%
.2%
.4%
NationalGovernment
13.1%
13.2%
14.5%
18.5%
Civil Socie
9.5%
16.0%
9.5%
10.1%
Top 5
ety Pre
%
%
esident L
2.6%
3.7%
6.8%
7.6%
Law Enforceme
9.0%
6.8%
6.5%
6.3%
ent

30 SURVEY ON PERCEPTIONS AND KNOWLEDGE OF CORRUPTION
Figure 8.3: In your opinion, who should organize and lead the effort to combat corruption (1 choice)
40,4%
18,5%
10,1%7,6% 6,3%
4,0% 2,8% 2,7% 2,6% 1,6% 1,2% 0,3% 0,1% 1,6%
(March 2014)
IAA
C
Na
tion
al G
ove
rnm
en
t
Civ
il S
oci
ety
Pre
sid
en
t’s O
ffic
e
La
w E
nfo
rce
me
nt
Min
istr
y o
f Ju
stic
e
Pa
rlia
me
nt
Lo
cal G
ove
rnm
en
t
Co
urt
s
NG
Os
All
ab
ove
me
ntio
ne
d
Oth
er
Th
e P
riva
te S
ect
or
DK
/NA
Figure 8.4: In your opinion, who should organize and lead the effort to combat grand corruption (1 choice)
IAACGovernment
Civil Society President Law Enforcement
Mar-13 20,7% 13,8% 8,2% 3,3% 4,2%
Sep-13 22,7% 12,2% 4,0% 3,5% 3,3%
Mar-14 21,0% 15,4% 3,1% 5,3% 3,2%

31SURVEY ON PERCEPTIONS AND KNOWLEDGE OF CORRUPTION
Figure 8.5: Evaluation of IAAC performance
Very
Good
Not g
Bad
Very
Mar-10
Sep-10
Apr-11
Nov-12
Mar-13
Sep-13
Mar-14
good
d
good, not bad
bad
Mar-101.0%
6.8%
29.8%
39.3%
23.1%
Sep-10 A0.3%
7.7%
38.4%
32.5%
21.0%
Apr-11 No1.2% 1
7.9% 14
33.6% 38
32.9% 25
24.4% 19
ov-12 Ma1.1% 0.9
4.5% 19.
8.7% 42.
5.8% 26.
9.9% 10.
r-13 Sep-19% 1.7%
.4% 27.7
.0% 38.4
.8% 24.4
.9% 7.7%
13 Mar-14% 1.7%
7% 20.9%
4% 40.1%
4% 25.8%
% 11.5%
4
%
%
%
%
Figure 8.6: Confidence in IAAC
Confi
Rathe
Rathe
Not c
Mar-10
Sep-10
Apr-11
Nov-12
Mar-13
Sep-13
Mar-14
ident
er confident
er not confiden
confident at all
0
0
1
2
3
3
4
Mar-102.5%
28.0%
nt 47.4%
l 22.2%
Sep-101.8%
27.1%
49.4%
21.8%
Apr-11 N1.6%
25.4%
43.3%
29.7%
Nov-12 Ma1.9% 2
36.5% 38
38.8% 41
22.8% 17
ar-13 Sep-.0% 3.8
8.6% 42.7
1.8% 39.4
7.7% 14.0
-13 Mar-1% 2.9%
7% 42.8%
4% 39.8%
0% 14.5%
4
%
%
%

32 SURVEY ON PERCEPTIONS AND KNOWLEDGE OF CORRUPTION
Figure 8.7: Confidence trend line in IAAC
69.6% 71.2% 73.0%
61.6% 59.5% 53.5% 54.3%
30.4% 28.8% 27.0%
38.4% 40.5% 46.5% 45.7%
Mar
-10
May
-10
Jul-1
0
Sep-
10
Nov
-10
Jan-
11
Mar
-11
May
-11
Jul-1
1
Sep-
11
Nov
-11
Jan-
12
Mar
-12
May
-12
Jul-1
2
Sep-
12
Nov
-12
Jan-
13
Mar
-13
May
-13
Jul-1
3
Sep-
13
Nov
-13
Jan-
14
Mar
-14
Not confinet/Rather not Confident Confident/Rather ConfidentNot Confi dent/Rather not Confi dent
Figure 8.8: Are you confident that IAAC is an impartial law enforcement body?
21.7% 21.9% 26.0% 30.4% 33.4% 34.7%
78.3% 78.1% 74.0% 69.6% 66.6% 65.3%
0.0%
10.0%
20.0%
30.0%
40.0%
50.0%
60.0%
70.0%
80.0%
90.0%
100.0%
Mar-10 Sep-10 Nov-12 Mar-13 Sep-13 Mar-14
Yes No

33SURVEY ON PERCEPTIONS AND KNOWLEDGE OF CORRUPTION
9. DEALING WITH CORRUPTION
There has been a shift in this survey as to which factors respondents identify as
obstacles to fighting corruption. The factor most often identified over the years has
been the “habit to solve problems through corrupt practices.” Now, the number
one obstacle is identified as the “corruption in law enforcement bodies,” corrobo-
rating the observation in the “fair treatment” section that respondents have low
expectations of fair treatment from law enforcement. “Public passivity” has also
risen in importance, pushing “imperfect legislation” to fourth place (Figure 9.1).
“Strong enforcement measures and punishment” are still believed to be the most
effective measure against corruption, followed by “consistency in implementation
of the rule of law” (Figure 9.2). There has been a considerable increase in demand
for raising salaries of public employees to avoid corruption, which may have been
influenced by rising inflation. As noted earlier in the first section, respondents have
identified “inflation” as the second most important problem in the country (Figure
1.1).
The findings on civil society are somewhat inconsistent. On the one hand, there is
a steady growth in demand for “building public awareness on corruption.” On the
other hand, there is a significant drop in preference for “civil control over public ad-
ministration” (Figure 9.2). This may be somehow connected to the low confidence
in civil society organizations (Table 9.1).
Nevertheless, there is a visible positive change in public attitudes towards conflict
of interest among public officials. While 47.5 percent of the respondents in March
2010 believed that public officials are “always” in violation of conflict-of-interest
laws, this dropped to 28.1 percent in March 2014 (Figure 9.3). This can be linked
to the declining number of reported cases of petty corruption observed in the last
few surveys.

34 SURVEY ON PERCEPTIONS AND KNOWLEDGE OF CORRUPTION
Figure 9.1: Factors hindering fight against corruption (Sep 2013)
2.59
2.99
2.99
3.07
3.11
3.12
3.13
2.57
3.08
3.15
3.05
3.10
3.29
3.15
2.74
3.19
3.18
3.26
3.09
3.37
3.29
2.94
3.21
3.25
3.28
3.31
3.45
3.41
Low professionalism in the delivery ofstate services
Absense of will to control corruptionfrom political leadership at a national
level
Absense of will to control corruptionfrom political leadership at a local level
Imperfect legislation or sanctions againstcorruption
Public passivity
The habit to solve problems throughcorrupt practices
Corruption in law enforcement bodies
Nov-12 Mar-13 Sep-13 Mar-14
Figure 9.2: Measures necessary to be taken against corruption
19.7%
15.2%
15.5%
8.6%
18.0%
5.5%
15.8%
1.6%
23.0%
14.8%
15.0%
10.0%
12.0%
6.9%
16.5%
1.8%
22.6%
16.2%
12.8%
12.2%
13.6%
7.7%
13.2%
1.7%
20.9%
15.9%
14.2%
12.9%
12.0%
11.6%
11.1%
1.5%
Strong enforcement measures and punishment
Consistency of implementation of rule of law
Transparency in administrative decision-making
Building public awareness
Strengthening state control over publicadministration
Increasing public employees' salaries
Strengthening civil (non-government) control overpublic administration
Other
Nov-12 Mar-13 Sep-13 Mar-14

35SURVEY ON PERCEPTIONS AND KNOWLEDGE OF CORRUPTION
Figure 9.3: In your opinion, how often public officials are acting in violation of conflicts of interest?
Mar-10
Sep-10
Apr-11
Nov-12
Mar-13
Sep-13
Mar-14
Mar-10 Sep-10 Apr-11 Nov-12 Mar-13 Sep-13 Mar-14Always 47.5% 43.3% 49.2% 40.8% 32.3% 33.9% 28.1%
Sometimes 45.1% 46.5% 36.0% 50.7% 52.6% 53.6% 56.7%
Rarely 6.4% 8.6% 10.1% 7.3% 11.4% 10.1% 11.8%
Never 0.9% 1.6% 4.7% 1.2% 3.7% 2.4% 3.4%
Table 9.1: Confidence in state institutions (Source: SMF Politbarometers, March 2014)
President ParliamentJudiciary System
Government admin
Political parties
Civil society
Confident 29.2 13.2 10.9 23.4 6.9 16.3
Rather
confident32.5 29.4 28.5 40.9 26.1 36.2
Rather not
confident20.7 29.0 27.8 21.4 28.8 22.2
Not
confident11.3 19.3 23.3 8.7 28.3 15.7
(No answer) 1.7 2.7 2.8 1.8 2.6 2.8
(Don’t
know)4.8 6.4 6.8 3.8 7.3 6.9

36 SURVEY ON PERCEPTIONS AND KNOWLEDGE OF CORRUPTION
10. INDIVIDUAL ACTIONS AGAINST CORRUPTION
Public awareness of the IAAC’s hotline has steadily decreased (Figure 10.1). Now,
only 25 percent of respondents are aware of it. This is a significant decrease from
March 2010, when 48 percent of respondents reported knowledge of the hotline.
There may be a partial correlation with the gradual decline in reported cases of petty
corruption since 2006. From March 2010 to March 2014, households that reported
paying a bribe in the last three months decreased by half, from 16 to 8 percent (Fig-
ure 10.5). The percent of respondents who said they would report it if asked for a
bribe also decreased. In March 2010, 20.5 percent of respondents said they would
report it, whereas only 12.9 percent said they would do so in March 2014 (Figure
10.3). From November 2012 to March 2014, the number of respondents willing to
report corruption if IAAC would accept anonymous information hovered around 60
percent (Figure10.2). Consequently, the lower willingness may be linked to respon-
dents’ declining confidence in the impartiality of the IAAC (Figure 8.8).
Figure 10.3 shows that the decrease in those willing to report has been accompa-
nied by an increase in those who will not pay a bribe if asked, from 28.7 percent in
March 2010 to 38.7 percent in March 2014. Together with other categories, it sug-
gests considerable weakness in Mongolia’s legal system. The implications of these
results may include the following:
Possible action if asked for a
bribe%
Relation to the legal environment (possibilities)
I will not pay 38.7 May either ignore or distrust the legal system
I will report 12.9 May believe in the legal framework
I shall pay if I have money 22.7 May act in violation of legal regulations
I should look for somebody who
may help me to avoid payment13.3
May prioritize convenience. May or may not
use legal help
I will do nothing just wait if
situation changes6.0
May completely distrust the legal system
DK/No Answer 6.3 May not have opinions
Among places to report a bribe, over 50 percent of respondents in the last four
surveys named the IAAC. However, in March 2014 there was also a big rise in those
who would report to the management (Figure 10.4).
There was little difference in the number and size of reported bribes from Septem-
ber 2013 to March 2014 (Figure 10.5). Eight percent of households reported giving

37SURVEY ON PERCEPTIONS AND KNOWLEDGE OF CORRUPTION
a bribe both in September 2013 and March 2014. In that same period, the average
size of the bribes differed by a mere MNT 5000 (Table 10.1).
Interestingly, this corresponds to a slight decline in respondents’ reports that bribes
“seriously” damaged the household budget. In March 2014, only 22.3 percent of
respondents said so, compared to 26.7 percent in September 2013 (Figure 10.6).
Throughout the survey period, teachers, health workers and clerks in the national
administration have been among the top three receivers of petty bribes (Table 10.2).
Health workers had a considerable lead, ranking at the top 75 percent of the time.
Teachers and clerks in the national administration were each in the top two 50
percent of the time. The sizes of bribes are not shown, because the sample was too
small to allow for accurate generalization6, but earlier surveys and later estimates
have consistently shown legal and law enforcement agencies in the lead by this
measure.
Figure 10.1: Are you aware of operating telephone hotline on reporting corruption?
47.8% 43.4% 47.8%
28.7% 28.5% 24.7% 25.2%
52.2% 56.6% 52.2%
71.3% 71.5% 75.3% 74.8%
0.0%
10.0%
20.0%
30.0%
40.0%
50.0%
60.0%
70.0%
80.0%
90.0%
100.0%
Mar-10 Sep-10 Apr-11 Nov-12 Mar-13 Sep-13 Mar-14
Yes No
6 The subsample is too small to generalize with accuracy. Methodologically, generalizing from a small number of observations is subject to high sampling error.

38 SURVEY ON PERCEPTIONS AND KNOWLEDGE OF CORRUPTION
Figure 10.2: Would you report a corruption case if the IAAC would accept anonymous information?
Yes No Don't know/No answer
Nov-12 61.3% 17.9% 20.9%
Mar-13 62.8% 18.6% 18.6%
Sep-13 61.7% 18.1% 20.2%
Mar-14 57.2% 18.3% 24.5%
0.0%
10.0%
20.0%
30.0%
40.0%
50.0%
60.0%
70.0%
Figure 10.3: If you face a situation in which you are directly asked for a bribe from a public or private official, what could be your most possible action?
0.0% 10.0% 20.0% 30.0% 40.0% 50.0% 60.0% 70.0% 80.0% 90.0% 100.0%
Mar-10
Sep-10
Apr-11
Nov-12
Mar-13
Sep-13
Mar-14
Mar-10 Sep-10 Apr-11 Nov-12 Mar-13 Sep-13 Mar-14I will not pay 28.7% 33.8% 35.7% 32.5% 34.3% 36.0% 38.7%
I will report 20.5% 16.3% 12.9% 16.7% 15.5% 11.7% 12.9%
I shall pay if I have money 23.1% 23.3% 22.5% 24.0% 25.9% 26.0% 22.7%
I will look for help 16.0% 16.5% 15.2% 14.2% 14.4% 13.5% 13.3%
I will do nothing just wait 7.0% 5.3% 7.0% 6.4% 5.7% 6.4% 6.0%
DK/NA 4.7% 4.8% 6.7% 6.3% 4.1% 6.3% 6.3%

39SURVEY ON PERCEPTIONS AND KNOWLEDGE OF CORRUPTION
Figure 10.4: If you report than where?
Mar-10
Sep-10
Apr-11
Nov-12
Mar-13
Sep-13
Mar-14
Mar-10 Sep-10 Apr-11 Nov-12 Mar-13 Sep-13 Mar-14Management 18.0% 12.9% 18.7% 29.5% 27.5% 18.2% 29.5%
IAAC 55.5% 56.4% 54.5% 53.7% 52.6% 62.9% 52.3%
Police 12.0% 15.3% 4.9% 7.5% 4.7% 6.9% 9.1%
Media 13.0% 15.3% 21.1% 7.9% 14.7% 11.3% 8.5%
Figure 10.5: In the past three months have you or anyone of your household paid a bribe in any form? (Yes)
26% 28%
23% 22%
19% 21%
15%
20%
16%
13%
9%
12%
9% 8% 8%

40 SURVEY ON PERCEPTIONS AND KNOWLEDGE OF CORRUPTION
Table 10.1: Households bribe statistics
Mar-06 Sep-06 Mar-07 Mar-07 Mar-08 Sep-08 Mar-09 Sep-09
Average bribe (in 1000 MNT)
181 136 102 187 180 298 397 308
percent of households giving bribes
26% 28% 23% 22% 19% 21% 15% 20%
Total amount paid (in billion MNT)
28.8 23.3 14.8 26 23.2 42.4 40.3 41.7
Number of households
611000 611000 632500 632500 645700 645700 677800 677800
Statistical Yearbook
2005 2005 2006 2006 2007 2007 2008 2008
Mar-10 Sep-10 Apr-11 Nov-12 Mar-13 Sep-13 Mar-14
Average bribe (in 1000 MNT) 195 416 319 391 502 525 520
percent of households giving bribes 16% 13% 8.80% 12.40% 8.75% 7.64% 7.57%
Total amount paid (in billion MNT) 21.2 38.8 20.8 35.9 32.6 30.8 30.2
Number of households 677800 717000 742000 742000 742000 768300 768300
Statistical Yearbook 2008 2009 2010 2010 2010 2012 2012
Figure 10.6 Percent of respondents whose household was ‘seriously’ damaged by giving bribes (only for respondents who reported giving a bribe)
16.5%
24.8%
42.5%
29.4% 28.5%
33.6%
28.4%
16.8%
26.7%
22.3%
Mar-08 Sep-08 Mar-09 Sep-09 Mar-10 Sep-10 Nov-12 Mar-13 Sep-13 Mar-14

41SURVEY ON PERCEPTIONS AND KNOWLEDGE OF CORRUPTION
Table 10.2 To whom have you paid bribes in the past 3 months? (ranked by number of cases)
Nov 2012 Mar 2013 Sep 2013 Mar 2014
Health sector
employee48
Health sector
employee34 Teacher 40
Health sector
employee35
Teacher 47Clerk in national
administration25
Health sector
employee25
Clerk in national
administration18
Policeman 27 Teacher 23Clerk in national
administration21 Teacher 15
Clerk in national
administration20 Police officer 20 Police officer 11 Police officer 7
Local government
official 10 Tax officer 5
Local government
official5 Judge 5
11. DATA SEGREGATED BY GENDER, AREA, INCOME AND AGE
The following analyses were performed on the most recent survey, but the findings
can be traced throughout the SPEAK project’s surveys from 2012 to 2014. Respon-
dents were segregated by four profiles: gender, area type, income, and age.
Corruption perception segregated by gender
Throughout the period there were no significant differences by profile in respon-
dents’ opinions on most issues related to corruption. From the differences that were
noted, it can be deduced that men tend to be more involved in and aware of public
affairs, while women are more concerned with private or family affairs.
As noted in earlier surveys, male respondents preferred extreme options such as
“totally,” “very,” and “a lot.” In comparison, female respondents opted for milder
options such as “rather,” “some,” or “a little.” In addition, more female respondents
had no opinion or expressed uncertainty than males. The responses “don’t know”
and “no answer,” for example, were not presented as options to respondents, but
were recorded when respondents expressed a definite no-opinion. In many assess-
ments, initial analysis appeared to find some statistical differences related to gen-
der; however, on closer inspection those options created some variation. When the
same calculations were done excluding these options, the responses of males and
females were nearly identical.7 The rest of the variations fell within the margin of
error.
7 The differences were tested in two steps. The first step included the testing of observed responses (all response options) by nominal contingency coefficient (symmetric measures). If differences were found, a second step was taken in which the “don’t know” and “no answer” options were excluded from the computation (valid responses only) and the analysis was repeated. For most cases, this resulted in nearly identical responses for men and women and shrank the level of differences significantly. Therefore, the following analysis lists differences that have been found statistically significant from both observed and valid response options.

42 SURVEY ON PERCEPTIONS AND KNOWLEDGE OF CORRUPTION
Similarly, men responded more frequently than women, but for most inquiries their
attitudes were not very different. One notable and statistically significant difference
was that more women cited the “low salary among civil servants” as an issue. This
supports the notion that women are more concerned about private or household
affairs than men. Men, on the other hand, deal with the questions surrounding
public and, at times, abstract issues more often than women.
It also seems that men are more likely either to give a bribe or to report it if asked
for a bribe. Women are more likely to refuse (Figure 11.1.1).
Figure 11.1.1: If directly asked for a bribe …
37.9%
39.3%
14.6%
11.5%
23.9%
21.7%
13.2%
13.4%
4.5%
7.4%
5.9%
6.7%
0% 20% 40% 60% 80% 100%
Male
FemaleI will not pay
I will report
I shall pay if I have money
I should look for somebody whomay help me to avoid payment
I will do nothing just wait if
DK/No Answer
Corruption perception segregated by area
For analysis, responses were divided by urban and rural areas. The exposure to cor-
ruption varies for each group. Availability of services also creates differences. This
affects all levels of perception, but most significantly the chances of encountering
corruption through direct experience. Regarding the effects of corruption on per-
sonal life, nearly half of rural residents (46 percent) reported that corruption does
not affect them at all, while just about a quarter of urban residents (23.9%) believed
so (Figure 11.2.1).

43SURVEY ON PERCEPTIONS AND KNOWLEDGE OF CORRUPTION
Figure 11.2.1: Impact of corruption on personal life (segregated by area)
23.9%
46.0%
27.7%
23.3%
34.3%
18.3%
8.8% 2.4%
5.4% 10.1%
Urban Rural
Not at all To small extent To a moderate extent To a large extent
Concerning the business environment and political life, urban residents seemed to
be more affected by corruption (Figures 11.2.2 and 11.2.3). Urban residents are
more likely to have more sources of information and exposure.
Figure 11.2.2: Impact of corruption on business environment (segregated by area)
5.7% 7.0%16.1% 15.4%
37.1% 36.0%
31.4% 23.5%
9.6% 18.1%
Urban Rural
Not at all To small extent To a moderate extent To a large extent DK/NA

44 SURVEY ON PERCEPTIONS AND KNOWLEDGE OF CORRUPTION
Figure 11.2.3: Impact of corruption on political life (segregated by area)
3.9% 4.8%10.9% 11.0%
28.4% 30.4%
43.6% 35.9%
13.2% 18.0%
Urban Rural
Not at all To small extent To a moderate extent To a large extent DK/NA
Urban respondents were more likely to report corruption incidents, but also to be
skeptical of anti-corruption efforts. Among scenarios offered to respondents, the
urban respondents were more likely to acknowledge “using public position to col-
lect gifts/money” or “using public position to help friends, relatives” as corruption.
Such cases of favoritism and nepotism (“ariin khalga”) were less likely to be con-
sidered corruption by rural respondents (Figures 11.2.4 and 11.2.5). One possible
explanation is the stronger ties of kinship in rural communities.
Figure 11.2.4: Using public position to collect gifts, money (segregated by area)
2.7% 4.8%13.0%
19.9%
36.3% 34.6%
43.2% 31.3%
4.8% 9.5%
Urban Rural
No, not at all Yes, to small extent
Yes, to a moderate extent Yes, to a large extent
DK/NA

45SURVEY ON PERCEPTIONS AND KNOWLEDGE OF CORRUPTION
Figure 11.2.5: Using public position to help friends, relatives (such as giving jobs, licenses) (segregated by area)
3.6% 4.0%11.4% 13.1%
33.9% 35.6%
48.4% 41.6%
2.7% 5.6%
Urban Rural
No, not at all Yes, to small extent
Yes, to a moderate extent Yes, to a large extent
DK/NA
Vote buying by politicians and the diversion of state funds to their own electorates
were more commonly seen as corruption by urban respondents. Rural respondents
were nearly twice as likely to find this unobjectionable. Vote buying, for example, is
not corruption to 15.1 percent of rural and 8.6 percent urban respondents (Figure
11.2.6). Similarly, diverting state funds to a politician’s own electorate is not corrup-
tion to 27.6 percent of rural and 14.8 percent of urban residents (Figure 11.2.7).
Figure 11.2.6: Distributing gifts, money in Election campaign (segregated by area)
8.6% 15.1%
19.1% 22.5%
32.1% 28.6%
27.5% 17.9%
12.7% 15.9%
Urban Rural
No, not at all Yes, to small extent
Yes, to a moderate extent Yes, to a large extent
DK/NA

46 SURVEY ON PERCEPTIONS AND KNOWLEDGE OF CORRUPTION
Figure 11.2.7: To divert state funds to own Electorate (segregated by area)
14.8% 27.6%
15.2%
18.1% 28.2%
21.6%
22.5% 11.5%
19.3% 21.1%
Urban Rural
No, not at all Yes, to small extent
Yes, to a moderate extent Yes, to a large extent
DK/NA
Despite the above, more urban residents consider giving presents to civil servants to
obtain services a form of corruption. Among the urban group, 36.3 percent believe
so, in contrast to 21.3 percent among the rural group (Figure 11.2.8).
Figure 11.2.8: To give presents or money to civil servants to obtain services entitled to (segregated by area)
3.9% 5.8%13.6%
18.9%
38.9% 41.5%
36.3% 21.3%
7.3% 12.6%
Urban Rural
No, not at all Yes, to small extent
Yes, to a moderate extent Yes, to a large extent
DK/NA
When asked about their most probable action when directly asked for a bribe,
urban respondents expressed more willingness to pay bribes. Nearly half of rural re-
spondents said they would not pay (45.6 percent), compared to less than a third of
urban respondents (28.8 percent). At the same time, 19.5 percent of rural residents

47SURVEY ON PERCEPTIONS AND KNOWLEDGE OF CORRUPTION
said that they would pay if they had the money, compared to 27.3 percent urban
residents (Figure 11.2.9).
Figure 11.2.9: If you face a situation in which you are directly asked for a bribe from a public or private official, what could be your most possible action? (Segregated by area)
28.8%
45.6%
14.3%
12.0% 27.3%
19.5%
15.2% 12.0%
7.9% 4.8% 6.6% 6.1%
Urban Rural
DK/No Answer
I will do nothing just wait ifsituation changes
I should look for somebody whomay help me to avoid payment
I shall pay if I have money
I will report
I will not pay
While the majority of respondents agreed that large businesses are a main source
of corruption, and that small and medium businesses are more negatively affected
by it, rural respondents supported these propositions more strongly (Figures 11.2.10
and 11.2.11).
Figure 11.2.10: Small and medium business are the more negatively affected by corruption than large businesses (segregated by area)
53.2% 63.0%
21.3% 14.6%
9.3% 4.9%4.8% 2.5%
11.4% 15.0%
Urban Rural
Agree Somehow agree Somehow disagree Disagree DK/NA

48 SURVEY ON PERCEPTIONS AND KNOWLEDGE OF CORRUPTION
Figure 11.2.11: Do you agree that large business is one of the main sources of corruption (segregated by area)
46.3% 57.6%
20.4%
17.4% 10.7%
4.9%6.8% 4.4%
15.9% 15.8%
Urban Rural
Agree Somehow agree Somehow disagree Disagree DK/NA
In addition, urban respondents are more inclined to expect unfair treatment from
the judicial system, law enforcement, and local and national government adminis-
trations. In comparison, rural respondents were more likely to express no opinion
(Figure 11.2.12). This tendency may be the result of urban residents’ more frequent
contact with these institutions, as well as their greater exposure to news and infor-
mation.
Figure 11.2.12: Fair treatment (segregated by area)
Fair treatment: Judicial system
33.0% 24.1%
23.6% 23.1%
17.9% 14.8%
5.0% 6.3%
20.5% 31.8%
Urban Rural
Not fair Rather not fair Rather Fair
Fair DK/ No Answer
Fair treatment: Law Enforcement
30.9% 25.0%
27.0% 25.8%
18.0% 15.9%
5.5% 6.9%
18.6% 26.5%
Urban Rural
Not fair Rather not fair Rather Fair
Fair DK/ No Answer

49SURVEY ON PERCEPTIONS AND KNOWLEDGE OF CORRUPTION
18.0% 14.0%
30.5% 25.9%
26.6% 27.9%
9.1% 17.5% 15.7% 14.8%
Urban Rural
Not fair Rather not fair Rather Fair
Fair DK/ No Answer
Fair treatment: Local Government
17.1% 13.6%
27.1% 22.3%
25.4% 26.8%
6.6% 11.1%
23.8% 26.3%
Urban Rural
Not fair Rather not fair Rather Fair
Fair DK/ No Answer
On the issue of conflict of interest (Figure 11.2.13), urban respondents are also more
likely to believe that public officials “always” have conflicts of interest (26.8 percent
urban vs. 17.1 percent rural).
Figure 11.2.13: In your opinion, how often public officials are acting in violation of conflict of interests? (Segregated by area)
26.8% 17.1%
40.2%
44.1%
6.6% 10.4%
1.1% 3.6%
25.4% 24.8%
Urban Rural
Always Sometimes Rarely Never DK/ No Answer

50 SURVEY ON PERCEPTIONS AND KNOWLEDGE OF CORRUPTION
Corruption perception segregated by income
In the analysis, we divided respondents into four clusters of monthly incomes: under
MNT 250 thousand, MNT 250 to 450 thousand, MNT 450 to 750 thousand, and
MNT 750 thousand or more.
It should be noted that the nomadic or semi-nomadic respondents were subject to
seasonal earnings. Nonetheless, some respondents in these groups acknowledged
non-monetary transactions as bribes and reported them.7
The percent of respondents that chose no-opinion (“don’t know” or “no answer”)
was slightly higher in the lower income groups. This may be related to levels of edu-
cation, since lower income groups are more likely to have lower education levels.
Conversely, respondents in the higher income groups were more likely to express an
opinion on corruption. As a result, significant differences were found between the
lowest and highest income groups.
Higher income respondents also showed greater awareness of existing anti-corrup-
tion legislation and the telephone hotline, and greater willingness to report corrup-
tion (Figures 11.3.1, 11.3.2, 11.3.3, and 11.3.4).
Figure 11.3.1: Since the introduction of the new law on corruption in 2006 are you aware of any officials being prosecuted by the justice system on a corruption charge?
36.0% 49.5% 46.8% 53.3%
64.0% 50.5% 53.2% 46.7%
< 250 000 250 000 - 450 000 450 000 - 750 000 750 000 +
Yes No
7 The most common non-monetary bribes were sheep.

51SURVEY ON PERCEPTIONS AND KNOWLEDGE OF CORRUPTION
Figure 11.3.2: Are you aware of the conflict of interest law passed?
20.6% 25.1% 27.8% 41.1%
79.4% 74.9% 72.2% 58.9%
< 250 000 250 000 - 450 000 450 000 - 750 000 750 000 +
Yes No
Figure 11.3.3: Are you aware of operating telephone hotline on reporting corruption?
12.2% 16.4% 26.0%
35.5%
87.8% 83.6% 74.0%
64.5%
< 250 000 250 000 - 450 000 450 000 - 750 000 750 000 +
Yes No

52 SURVEY ON PERCEPTIONS AND KNOWLEDGE OF CORRUPTION
Figure 11.3.4: Would you report a corruption case if the IAAC would accept anonymous information?
53.4% 55.9% 56.8% 61.1%
18.5% 17.7% 19.5% 16.5%
28.0% 26.4% 23.7% 22.4%
< 250 000 250 000 - 450 000 450 000 - 750 000 750 000 +
Yes No Don't know/No answer
Another notable difference was in how respondents said they would react if directly
asked for a bribe. Over half of respondents (51.9 percent) in the lowest income
group said they would not pay, compared to just a third in the highest income
group (32.1 percent). Furthermore, while only 16.9 percent of respondents in the
lowest income group said they would pay if they had money, 28 percent in the high-
est income group said they would do so. A higher proportion of the higher income
groups also said they would look for somebody to help them avoid paying (Figure
11.3.5).
Figure 11.3.5: If you face a situation in which you are directly asked for a bribe from a public or private official, what could be your most possible action?
51.9%
38.3% 40.1%32.1%
10.1%
16.1% 11.3%
13.1%
16.9%23.2%
20.6%28.0%
9.0% 13.5%13.4% 14.1%
5.8%5.1%
6.7% 5.8%
6.3% 3.9% 8.0% 6.8%
< 250 000 250 000 - 450 000450 000 - 750 000 750 000 +
DK/No Answer
I will do nothing just wait ifsituation changes
I should look for somebody whomay help me to avoid payment
I shall pay if I have money
I will report
I will not pay

53SURVEY ON PERCEPTIONS AND KNOWLEDGE OF CORRUPTION
Respondents in the lowest income group were more inclined to report corruption
to management (57.9 percent). Over half of respondents in the other three income
groups chose the IAAC. The police were the least likely choice of both the lowest
and the highest income groups (Figure 11.3.6).
Figure 11.3.6: If you report than where?
57,9%
22,0% 22,7%29,6%
26,3%
58,0% 52,3%
57,4%
5,3% 12,0%11,4%
7,4%10,5% 8,0%
11,4%5,6%2,3%
< 250 000 250 000 - 450 000 450 000 - 750 000 750 000 +
Management IAAC Police Media Other
Income differences also determined where respondents got their information about
corruption (Figure 11.3.7). Roughly two thirds of the two lower income groups in-
dicated that TV was their main source, compared to just over half of the highest
income group. The proportion of respondents who got their information from the
Internet and social media was highest in the highest income group (15.1 percent)
and lowest in the lowest income group (2.6 percent).
Figure 11.3.7: What is your main source of information about corruption?
69.8% 71.4% 65.3%
56.9%
12.2% 10.3%
10.0%
7.5%
2.6% 6.1% 8.7%
15.1%
2.6% 5.8%
5.9% 8.0%
4.8% 3.2%
5.4% 6.3% 4.2%
2.9% 3.1% 5.6% 3.7% 0.3% 1.5% 0.5%
< 250 000 250 000 - 450 000 450 000 - 750 000 750 000 +
No answer
Other
Newspapers magazines
Internet/Social Media
Words of mouth
TV

54 SURVEY ON PERCEPTIONS AND KNOWLEDGE OF CORRUPTION
Corruption perception segregated by age
In general, generational differences produced variations in responses. In the analysis,
respondents were divided into three groups: under 30, 30 to 49, and 50 or older.
The middle age group constitutes the most active part of the population, and tend-
ed to give stronger and more negative assessments of corruption than the other
two groups.
It is also noteworthy, however, that in a situation where a bribe is directly requested,
the oldest respondents were most likely not to pay (Figure 11.4.1).
Figure 11.4.1: If directly asked for a bribe …..
27,6%35,4%
52,7%
17,4%11,8%
10,9%22,6%27,3%
16,0%17,9%
11,8%11,7%
6,8% 6,1%5,3%7,6% 7,6% 3,4%
Under 30 30 to 49 50 +
DK/No Answer
I will do nothing just wait if
I should look for somebody whomay help me to avoid payment
I shall pay if I have money
I will report
I will not pay
Otherwise, generational differences were most apparent in sources of information
about corruption. Television was the main source for all age groups, but even more
so for those over 50 (Figure 11.4.2).
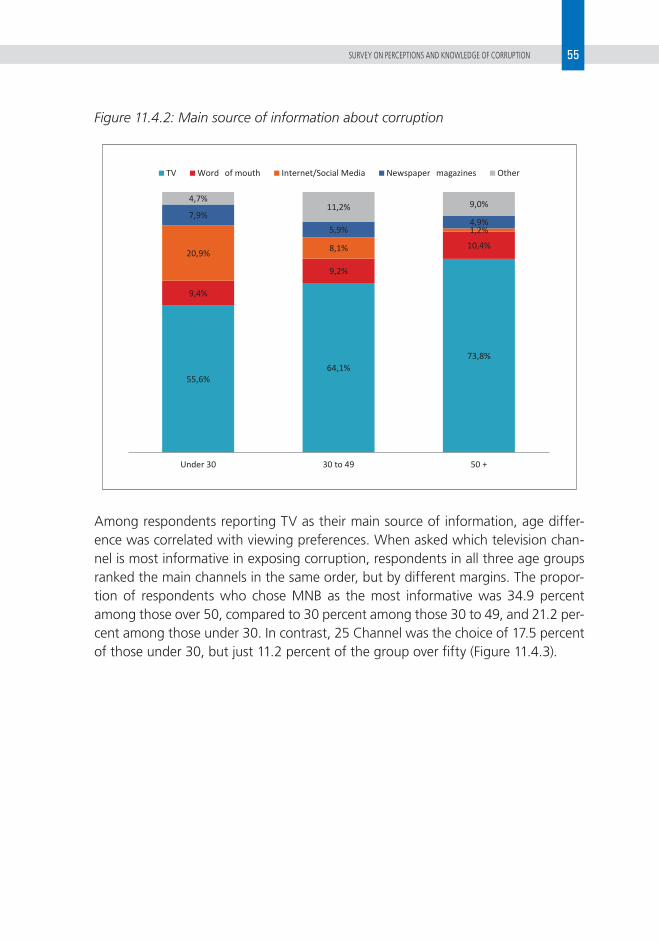
55SURVEY ON PERCEPTIONS AND KNOWLEDGE OF CORRUPTION
Figure 11.4.2: Main source of information about corruption
55,6%64,1%
73,8%
9,4%
9,2%
10,4%20,9% 8,1%
1,2%
7,9%
5,9%4,9%
4,7%11,2% 9,0%
Under 30 30 to 49 50 +
TV Words of mouth Internet/Social Media Newspapers magazines Other
Among respondents reporting TV as their main source of information, age differ-
ence was correlated with viewing preferences. When asked which television chan-
nel is most informative in exposing corruption, respondents in all three age groups
ranked the main channels in the same order, but by different margins. The propor-
tion of respondents who chose MNB as the most informative was 34.9 percent
among those over 50, compared to 30 percent among those 30 to 49, and 21.2 per-
cent among those under 30. In contrast, 25 Channel was the choice of 17.5 percent
of those under 30, but just 11.2 percent of the group over fifty (Figure 11.4.3).

56 SURVEY ON PERCEPTIONS AND KNOWLEDGE OF CORRUPTION
Figure 11.4.3: If TV is the main source which channel is most informative in exposing corruption?
21,2%30,0%
34,9%
38,6%
40,0%39,1%
17,5%
12,3%11,2%4,8%
4,9%5,3%
6,9%3,3%
2,3%4,2% 3,6% 2,6%6,3% 4,9% 3,9%0,5% 1,0% 0,7%
Under 30 30 to 49 50 +
DK/No answer
Other channels
TV5
TV8
Eagle
25 Channel
TV9
MNTV
There were too few respondents over 50 who used the Internet and social media as
a main source of information to be statistically reliable. Facebook was more popular
among respondents under 30 as a source of information, while information sites
were more popular among those 30 to 49 (Figure 11.4.4).
Figure 11.4.4: If Internet or Social Media is the main source which site is most informative in exposing corruption?
42,3%32,7%
5,6%8,2%
50,7% 59,2%
1,4%
Under 30 30 to 49
Facebook Other

SURVEY ON PERCEPTIONS &
KNOWLEDGE OF CORRUPTION
Strengthening Transparency and Governance in Mongolia Program
Survey instrument

58 SURVEY ON PERCEPTIONS AND KNOWLEDGE OF CORRUPTION
Part A. General
1. In your opinion what is the most important social, economic, or political
problem in the country today?
2. Some people believe that corruption affects different spheres of life in
Mongolia. In your view, does corruption affect … not at all, to a small extent, to
a moderate extent or to a large extent?
Spheres not at all to a small extent
to a moderate extent
to a large extent
Don’t know/No answer
2.1 Your personal and family life 1 2 3 4 9
2.2 Business environment 1 2 3 4 9
2.3 Political life 1 2 3 4 9
3. In your opinion what could be regarded as a case of corruption. If yes, to
which extent it is present in Mongolia?
Spheres No, not at all
Yes, to a small extent
Yes, to a moderate extent
Yes, to a large extent
Don’t know/No answer
3.1. Using a public position to
collect gifts, money1 2 3 4 9
3.2. Using a public position to
help friends, relatives (such
as giving jobs, licenses, or
favoring in bids)
1 2 3 4 9
•
•
•

59SURVEY ON PERCEPTIONS AND KNOWLEDGE OF CORRUPTION
3.3. Distributing gifts, money in
election campaign1 2 3 4 9
3.4. For politicians to divert state
funds to their electorate 1 2 3 4 9
3.5. To give presents or money
to civil servants to obtain
services entitled to
1 2 3 4 9
3.6. For private people to
finance political party
activity
1 2 3 4 9

60 SURVEY ON PERCEPTIONS AND KNOWLEDGE OF CORRUPTION
4. Could you express your opinion on the following statements?
AgreeSomehow
agreeSomehow disagree
DisagreeDon’t Know/No Answer
4.1 Corruption is a common practice in our country.
1 2 3 4 9
4.2 The existing political system1 is having success in stopping corruption
1 2 3 4 9
4.3a Civil society can prevent corruption 1 2 3 4 9
4.3b Only government institutions may help to prevent corruption.
1 2 3 4 9
4.4 Fighting corruption is being led by citizens and NGOs these days
1 2 3 4 9
4.5 Politicians have no real will to fight corruption as they may benefit from it
1 2 3 4 9
4.6. Do you agree that the only way to overcome bureaucracy is to pay bribes
1 2 3 4 9
4.7 Small and medium business are the more negatively affected by corruption than large businesses
1 2 3 4 9
4.8 Some level of corruption is acceptable
1 2 3 4 9
4.9 Do you agree that large business is one of the main sources of corruption
1 2 3 4 9
4.10 Giving a bribe helps to overcome
unjust regulations 1 2 3 4 9
4.11 Local administration officers in general are reliable and responsible people
1 2 3 4 9
4.12 Citizens should be responsible to reduce corruption
1 2 3 4 9
4.13 The existing legislation on corruption is not functioning effectively.
1 2 3 4 9
4.14 Decision-makers are less affected by corruption than ordinary people who are more affected by corruption.
1 2 3 4 9
1 triangular semi-presidential system: President- Parliament- Government

61SURVEY ON PERCEPTIONS AND KNOWLEDGE OF CORRUPTION
5. In the past three years, how has the level of corruption in Mongolia changed?
Increased a lot 1.
Increased a little 2.
Is the same 3.
Decreased a little 4.
Decreased a lot 5.
Don’t know/No answer 9.
6. How do you expect the level of corruption in the next three years to change? Will it?
Increase a lot 1.
Increase a little 2.
Remain the same 3.
Decrease a little 4.
Decrease a lot 5.
Don’t know/No answer 9.
4.15 Low salary is the main reason for bribes among public civil servants
1 2 3 4 9
4.16 A deterrent to corruption will be stronger punishment for public officials convicted of corruption.
1 2 3 4 9
4.17 Some level of corruption is expected 1 2 3 4 9
4.18 The person who gives the bribe is in the same way responsible as the one who accepts it
1 2 3 4 9
4.19 Implementation of anti-corruption policies are politically unbiased.
1 2 3 4 9

62 SURVEY ON PERCEPTIONS AND KNOWLEDGE OF CORRUPTION
Part B. Combating Corruption
7. In your opinion, who should organize and lead the effort to combat corruption (1 choice)
National Government 1.
Local Government 2.
Law Enforcement 3.
Civil Society 4.
Parliament 5.
Courts 6.
NGOs 7.
President’s Office 8.
IAAC 9.
Ministry of Justice 10.
The Private Sector 11.
Other (specify) 12.
8. How do you think the current government will perform compared to its predecessor in fighting corruption:
Will deal better with corrup-tion
1.
Will stay the same 2.
Will do worse 3.
Don’t know/No answer 9.
9. In your opinion, how much is the impact, of the following factors, hindering
efforts to combat corruption?
Not at all
Little Moderate A lot Don’t know/No answer
9.1 Low professionalism in the delivery of state services
1 2 3 4 9
9.2 Absence of will to control corruption from political leadership at a national level
1 2 3 4 9

63SURVEY ON PERCEPTIONS AND KNOWLEDGE OF CORRUPTION
9.3 Absence of will to control corruption from political leadership at a local level
1 2 3 4 9
9.4 The habit to solve problems through corrupt practices
1 2 3 4 9
9.5 Corruption in law enforcement bodies 1 2 3 4 9
9.6 Public passivity 1 2 3 4 9
9.7 Imperfect legislation or sanctions/pen-alties against corruption
1 2 3 4 9
10. What should be done to prevent corruption? (1 choice)
Strong enforcement measures and punish-ment
1.
Increasing public employees’ salaries 2.
Transparency in administrative decision-mak-ing
3.
Strengthening state control over public ad-ministration
4.
Strengthening civil (non-government) control over public administration
5.
Building public awareness 6.
Consistency of implementation of rule of law 7.
Other (specify) 8.
11. Since the introduction of the new law on corruption in 2006 are you aware of any officials being prosecuted by the justice system on a corruption charge?
Yes 1.
No 2.
12. Are you aware of a telephone hotline to report corruption at
IAAC?
Yes 1.
No 2.
13. Would you report a corruption case if the IAAC would
accept anonymous information?
Yes 1.
No 2.
Don’t know/No
answer
3.

64 SURVEY ON PERCEPTIONS AND KNOWLEDGE OF CORRUPTION
Block C. Institutions
14. How do you evaluate the IAAC’s performance in fighting corruption?
Very good 1.
Good 2.
Nor good, nor bad 3.
Bad 4.
Very bad 5.
Don’t know/No answer 9.
15. How much confidence do you have in the IAAC in fighting corruption?
Confident 1.
Rather confident 2.
Rather not confident 3.
Not confident 4.
Don’t know/No answer 9.
16. Are you confident that IAAC is an impartial law enforcement body?
Yes 1.
No 2.
Don’t know/No answer 3.
17. To what extent do you perceive the following areas or institutions in this country
to be affected by corruption?
Corrupt:Sectors
Not at all
A little Don’t know/No answer
1) Customs 1 2 3 4 5 9
2) Education system 1 2 3 4 5 9
3) Health system 1 2 3 4 5 9
4) Judicial system 1 2 3 4 5 9
5) Law Enforcement Officers 1 2 3 4 5 9
6) Political parties 1 2 3 4 5 9
7) Legislature 1 2 3 4 5 9
8) National Government adminis-tration
1 2 3 4 5 9
9) Local Government administra-tion
1 2 3 4 5 9
10) Registry and permit service (civil registry for birth, marriage, licenses, permits)
1 2 3 4 5 9
11) Taxation system 1 2 3 4 5 9
12) Private companies in mining sector
1 2 3 4 5 9
13) State entities regulating mining sector
1 2 3 4 5 9
14) Land and Property 1 2 3 4 5 9

65SURVEY ON PERCEPTIONS AND KNOWLEDGE OF CORRUPTION
Block E. Personal experience
19. If you face a situation in which you are directly asked for a bribe from a public or private of-ficial, what could be most your possible action?
I will not pay 1.
I will report (answer Q20) 2.
I shall pay if I have money 3.
I should look for somebody who may help me to avoid payment
4.
I will do nothing and just wait if the situation changes
5.
Don’t know/No answer 9.
20. If you report then where?(only one choice)
Management 1.
IAAC 2.
Police 3.
Media 4.
Other 5.
21. What is your main source of information about corruption? (only one choice)
TV (answer Q22) 1.
Newspapers magazines 2.
Internet or Social Media (an-swer Q23)
3.
Radio 4.
Personal Experience 5.
Friends/ relatives 6.
Word of mouth 7.
Other sources (specify) 8.
22. If TV is the main source which channel is most informative in exposing corruption?
MNTV 1.
25 Channel 2.
Eagle 3.
TV9 4.
TV5 5.
UBS 6.
Other sources (specify) 7.
15) Professional Inspection agency 1 2 3 4 5 9
16) Local Procurement Tenders 1 2 3 4 5 9
17) Banks & financial institutions 1 2 3 4 5 9
18. Could you name another area or institution strongly affected by corruption:
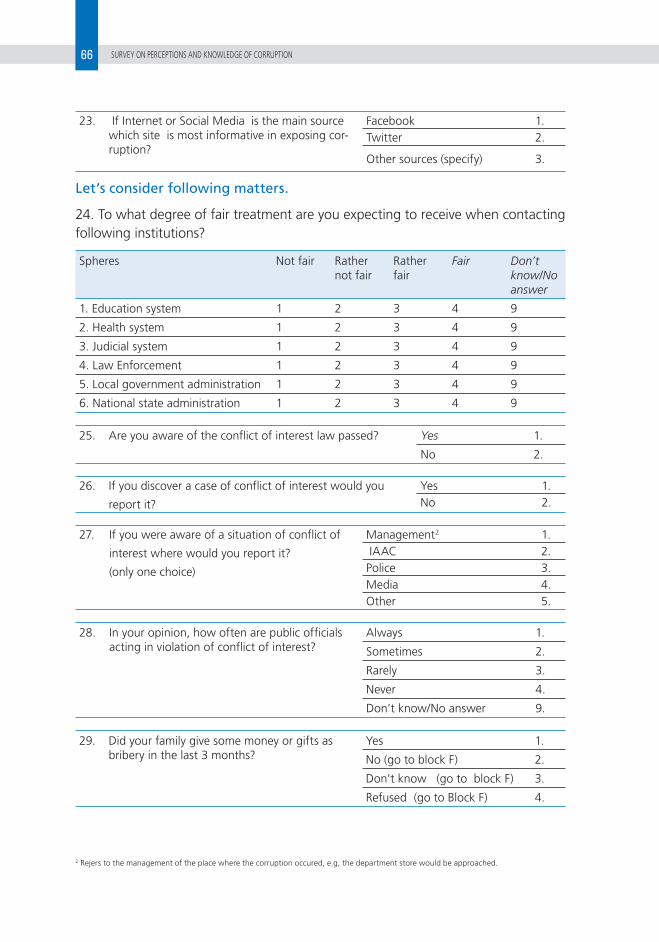
66 SURVEY ON PERCEPTIONS AND KNOWLEDGE OF CORRUPTION
23. If Internet or Social Media is the main source which site is most informative in exposing cor-ruption?
Facebook 1.
Twitter 2.
Other sources (specify) 3.
Let’s consider following matters.
24. To what degree of fair treatment are you expecting to receive when contacting
following institutions?
Spheres Not fair Rather not fair
Rather fair
Fair Don’t know/No answer
1. Education system 1 2 3 4 9
2. Health system 1 2 3 4 9
3. Judicial system 1 2 3 4 9
4. Law Enforcement 1 2 3 4 9
5. Local government administration 1 2 3 4 9
6. National state administration 1 2 3 4 9
25. Are you aware of the conflict of interest law passed? Yes 1.
No 2.
26. If you discover a case of conflict of interest would you
report it?
Yes 1.
No 2.
27. If you were aware of a situation of conflict of
interest where would you report it?
(only one choice)
Management2 1.
IAAC 2.
Police 3.
Media 4.
Other 5.
28. In your opinion, how often are public officials acting in violation of conflict of interest?
Always 1.
Sometimes 2.
Rarely 3.
Never 4.
Don’t know/No answer 9.
29. Did your family give some money or gifts as bribery in the last 3 months?
Yes 1.
No (go to block F) 2.
Don’t know (go to block F) 3.
Refused (go to Block F) 4.
2 Rejers to the management of the place where the corruption occured, e.g, the department store would be approached.

67SURVEY ON PERCEPTIONS AND KNOWLEDGE OF CORRUPTION
30 . To whom have you paid bribes in the past 3 months? (multiple)
31. If paid how much did it cost approximately? (multiple)
1. Teacher
2. Health Sector Employee
3. Clerk in national state administration
4. Policeman
5. Judge
6. Advocate/Lawyer
7. Prosecutor
8. Tax officer
9. Utilities service personal
10. Custom’s officer
11. Local government official
12. Media (newspapers, TV, Radio)
13. Other
32. How much does the total amount of bribes paid affect your family budget?
Not at all 1.
A little 2.
Somehow 3.
Seriously 4.
Don’t know/No answer 9.
33. Which of the following mostly applies to the bribes paid in the past three months?
A bribe was directly asked for 1.
A bribe was offered to avoid a problem with the authorities
2.
A bribe was offered to receive a service entitled
3.
None of above 4.

68 SURVEY ON PERCEPTIONS AND KNOWLEDGE OF CORRUPTION
Block F: State Administration
34. In your opinion when it comes to decisions affecting citizens life, are state adminis-tration and officials consulting with citizens?
А. National level В. Local Level
1. Yes, always 1. Yes, always
2. Sometimes 2. Sometimes
3. Rarely 3. Rarely
4. Never 4. Never
9. Don’t Know/Refused 9. Don’t Know/Refused
35. When it comes to these decisions do you think they are in line with rules and regulations?
A. National level B. Local Level
1. Yes, always 1. Yes, always
2. Sometimes 2. Sometimes
3. Rarely 3. Rarely
4. Never 4. Never
9. Don’t Know/Refused 9. Don’t Know/Refused
36. Are those decisions transparent and clear to public?
A. National level B. Local Level
1. Yes, always 1. Yes, always
2. Sometimes 2. Sometimes
3. Rarely 3. Rarely
4. Never 4. Never
9. Don’t Know/Refused 9. Don’t Know/Refused
37. Is government administration and officials effective in resolving public complaints?
A. National level B. Local Level
1. Yes, always 1. Yes, always
2. Sometimes 2. Sometimes
3. Rarely 3. Rarely
4. Never 4. Never
9. Don’t Know/Refused 9. Don’t Know/Refused

69SURVEY ON PERCEPTIONS AND KNOWLEDGE OF CORRUPTION
Block G: Grand Corruption
38. What is your understanding of
grand corruption?
Cases with strong political interest 1.
Cases with involvement of high level public
officials
2.
Cases where big local and foreign businesses
are involved
3.
Cases with high level damage to the country 4.
Cases which organized crime is involved in 5.
Bribe amount is a very big one 6.
Other (specify): 7.
Don’t Know/Refused 9.
39. What do you think about the level of grand corruption in Mongolia?
There is a significant amount of GC 1.
There are some cases of GC 2.
There are only few cases of GC 3.
There is no GC in Mongolia 4.
Don’t know/No answer 9.
40. If there are cases of grand
corruption, why do you think
that there is grand corruption in
Mongolia
Because the Mongolian legal system is still
in formation and not able to deal with such
issues
1.
Because there is a lot of poorly controlled
money in the Mongolian economy
2.
Because of the lack of the transparency at a
high government level
3.
Because large foreign companies operating
in Mongolia are frequently using corrupt
practices
4.
Because large Mongolian companies
operating in Mongolia are frequently using
corrupt practices
5.
Because it is happening due to the merger of
business and political interests
6.
Don’t Know/Refused 9.
41. Do you have any idea about the
size of grand corruption bribes?
Yes 1.
No (go to Q44) 2.
Don’t Know/Refused (go toQ44) 9.

70 SURVEY ON PERCEPTIONS AND KNOWLEDGE OF CORRUPTION
42. If yes, in your opinion what could be a lowest limit of a bribe in grand corruption?
43. What could be an upper limit of a bribe?
44. How frequently do you hear about grand
corruption incidences?
Often 1.
Rarely 2.
Never (go to Q46) 3.
Don’t know/No answer
(go to Q46)
4.
45. If you heard, which way the bribe was given? (multiple responses)
Cash 1.
Major gift such as apartment or car
2.
Partnership or block of stock in a company
3.
Foreign travel 4.
Position in administration 5.
Other(specify):6.
Don’t know/No answer 7.
46. Do you think that GC has any negative impact
on you and your family?
Very strong 1.
Some 2.
Small 3.
Not at all (go to Demography) 4.
Don’t know/No answer 5.
47. If there is a negative impact, can you be specific about what sort of impact it has on you and
your family?
Life level deteriorating 1.
Family business degrading 2.
Bureaucracy, non transparency 3.
Public services down 4.
Price increase 5.
Impact on environment 6.
Other 7.
Don’t know/No answer 8.

71SURVEY ON PERCEPTIONS AND KNOWLEDGE OF CORRUPTION
Block H: Demography
1. Year of birth: 19...2. Gender: male / female3. Education:
· Did not go to school..........1· Primary/not completed
secondary..........................2· Secondary..........................3· Vocational..........................4· High....................................5
4. Employment
· Full time job.........................1
· Part time job.......................2
· Professional training......... .3
· Unemployed...................... 4
· Home-based Caretaker .....5
· Retired/on allowance..........6
· Army..................................7
· Student..............................8
if selected retired,
army or student than go to 7
5. Social statute
- Worker.........................1
- office worker...............2
- self-employed.............3
- herder/farmer..............4
- intelligentsia................5
6. Sector
• Public/ state officer.....1
• Public/ state service....2
• Private/mixed sector....3
• NGO.............................4
7. Marital status:
• Married..............................1
• Living with partner, but not
married..............................2
• Single.................................3
• Separated or divorced.......4
• Widowed...........................5
8. Number of people in
household:
9. Number of household
employed:
10. Estimated Income of
Household:
Monthly: Annual:
11. District/Aimag Khoroo/Sum
12. Interviewer

NOTE

