journal of technical analysis (jota). issue 19 (1984, november)
TRANSCRIPT

~I~~~~lANS ASSOCIATION
JOURNAL Issue 19 November 1984


MTA Journal/November 1984 1

MTA Journal/November 1984 2

MARKET TECHNICIANS ASSOCIATION JOURNAL Issue 19 November, 1984
Editor: James M. Yates Bridge Data Company 10050 Manchester Road St. Louis, Missouri 63122
Contributors: James Dines Lewis Habash William J. Kamperman Bruce McCurtain Arthur Merrill Theodore M. Theodore
Publisher: Market Technicians Association 70 Pine Street New York, New York 10005
MTA Journal/November 1984 3

@Market Technicians Association 1984
MTA Journal/November 1984 4

MTA JOURNAL - NOVEMBER, 1984 TABLE OF CONTENTS
Title Page
MTA OFFICERS . . . . . . . . . . . . . . . . . . . . . . . . . . . . . . . . . . . . . . . . . . . . . . . . . . . . . . . . . . . . . . . . . . . . . . 6
MEMBERSHIP AND SUBSCRIPTION INFORMATION . . . . . . . , . . . . . . . . . . . . . . . . . . . . . . . . . . . . . 7
STYLE SHEET FOR SUBMISSION OF ARTICLES . . . . . . . . . . . . . . . . . . . . . . . . . . . . . . . . . . . . . . . . 8
MTA LETTER FROM THE EDITOR . . . . . , . . . . . . . . . . . . . . . . . . . . . . . . . . . . . . . . . . . . . . . . . . . . . . . . 9 James M. Yates
ELECTION YEAR STOCK MARKET PAT-TERNS . . . . . . . . . . . . . . . . . . . . . . . . . . . . . . . . . . . . . . . . . . 11 William J. Kamperman
HOW TECHNICAL ANALYSIS BENEFITS PORTFOLIO STRATEGY IMPLEMENTATION . . . . . . . . 15 Lewis C. Habash
TRACKING THE “QUALITY” OF INVESTMENTS WITH THE MOST ACTIVE MONEY FLOW . . . . 17 Bruce McCurtain
MANDWWAVES-MOREDATA . . . . . . . . . . . . . . . . . . . . . . . . . . . . . . . . . . . . . . . . . . . . . . . . . . . . . . 23 Arthur A. Merrill
SPEECH GIVEN BY JAMES DINES BEFORE THE MARKET TECHNICIANS ASSOCIATION/ TECHNICAL SECURITIES ANALYSTS OF SAN FRANCISCO . . . . . . . . . . . , . . . . . . . . . . . . . . . 31 James Dines
PERCEPTIONS AND THE TECHNICIAN . . . . . . . . . . . . . . . . . . . . . , . . . . . . . . . . . . . . . , . . . . . . . . . . . 47 Theodore M. Theodore
MTA Journal/November 1984 5
1983-84 MARKET TECHNICIANS ASSOCIATION
PRESIDENT Fred Dickson Millburn Corp. 212/398-8489
VICE PRESIDENT John Greeley 212/747-l 520
VICE PRESIDENT (SEMINAR) Richard Yashewski Butcher & Singer 516/627-l 600
OFFICERS
PROGRAMS John Greeley 212/747-l 520
NEWSLETTER Robert Prechter 404/536-0309
JOURNAL James Yates 3 14/82 l-5660
CERTIFICATION Charles Comer 212!825-4367
MEMBERSHIP Cheryl Stafford 617/227-9500
LIBRARY Ralph Acampora 212i747-2355
SECRETARY Gail Dudack Pershing & Co. 212/902-3322
TREASURER Robert Simpkins Delafield Harvey Tabell 609/924-9660
COMMIT-TEE CHAIRPERSONS
ETHICS & STANDARDS/PUBLIC RELATIONS Tony Tabell 609/924-9660
PLACEMENT John Brooks 404/266-6262
COMPUTER SPECIAL INTEREST GROUP John McGinley 203/762-0229
FUTURES SPECIAL INTEREST GROUP John Murphy 212/724-6982
SAN FRANCISCO TECHNICAL SOCIETY SPECIAL INTEREST GROUP
Henry Pruden 415/459-l 319
EDUCATION
MTA Journal/November 1984 6

MARKET TECHNICIANS ASSOCIATION
REGULAR MEMBERSHIP - $50 per year plus $10 one-time application fee.
Receives the MTA Journal, the monthly MTA Newsletter, invitations to all meetings, voting member status, and a dis- count on the Annual Seminar fee. Eligibility requires that the emphasis of the applicant’s professional work involve technical analysis.
SUBSCRIBER STATUS - $50 per year.
Receives the MTA Journal and the MTA Newsletter, which contains shorter articles on technical analysis. The sub- scriber receives special announcements of the MTA meetings open to The New York Society of Security Analysts and/or the public, plus a discount on the Annual Seminar fee.
ANNUAL SUBSCRIPTION TO THE MTA JOURNAL - $35 per year.
SINGLE ISSUES OF THE MTA JOURNAL (including back issues) - $15
The Market Technicians Association Journal is scheduled to be published three times each fiscal year in approxi- mately November, February, and May.
An ANNUAL SEMINAR is held each Spring.
Inquiries for REGULAR MEMBERSHIP and SUBSCRIBER STATUS should be directed to:
Membership Chairman Market Technicians Association 70 Pine Street New York, New York 10005
MTA Journal/November 1984 7

STYLE SHEET FOR THE SUBMISSION OF ARTICLES
MTA Editorial Policy
The Market Technicians Association Journal is published by the Market Technicians Associ- ation, 70 Pine Street, New York, New York 10005 to promote the investigation and analysis of price and volume activities of the world’s financial markets. The MTA Journal is distributed to individuals (both academic and practitioner) and libraries in the United States, Canada, Europe and several other countries. The Journal is copyrighted by the Market Technicians Association and registered with the Library of Congress. All rights are reserved. Publication dates are February, May, and November.
Style for the MTA Journal
All papers submitted to the MTA Journal are requested to have the following items as pre- requisites to consideration for publication.
Short (one paragraph) biographical presentation for inclusion at the end of the accepted article upon publication. Name and affiliation will be shown under the title.
All charts should be provided in camera ready form and be properly labeled for text reference.
All tables should be properly labeled and in camera ready form.
Paper should be submitted typewritten, double-spaced in completed form on 8% by 11 inch paper. If both sides are used, care should be taken to use sufficiently heavy paper to avoid reverse side images. Footnotes and references should be put in the end of the article.
Greek characters should be avoided in the text and in all formulae.
One submission copy is satisfactory.
Manuscripts of any style will be received and examined, but upon acceptance, they should be prepared in accordance with the above policies.
MTA Journal/November 1984 8

MTA LElTER FROM THE EDITOR
Some random comments seem appropriate at the conclusion of 1984’s random market.
Moving your household rates among the top five stress producers. Hopefully, this doesn’t apply to moving libraries. The collective brainpower of the MTA, with a little luck, will find a safe haven for its literary roots. Work on it. The library is important even if you haven’t used it lately
Applause for those brave souls who have volunteered to assist the MTA in various capacities. It is important for more people to be more involved.
A special thanks to Martin Pring, Ian McAvity, and Richard Bookstaber for their excellent participation in the Financial Management Association Panel in Toronto. A tape of the proceedings is available for interested parties. Some interesting points of view were reflected in the question and answer period. More on that in a later Journal.
On “Wall $treet Week’ Joe Granville was heard saying his historians have determined that every ninth market call of his is incorrect, therefore, he is still perfect if you simply do the opposite of what he says every ninth time and follow him the rest of the time. Just don’t miscount or you’re in real trouble. Maybe that should be called the Granville Wave Theory?
Think of the marvelous information flow that would occur if each MTA member wrote just two pages on a technical idea that they have had in the back of their mind. It might stimulate some interesting cocktail conversation if nothing else. Ideas, after all, are the roots of finished products.
Our thanks to the Seminar speakers this last May who contributed their written remarks. The trailers are presented in this issue. With a little effort, the May, 1985, Hilton-Head Issue will contain a reasonably complete compendium of presentations. An excellent reference during and after the proceedings.
Once again, the MTA Journal owes a debt of gratitude to Sally Ruppert and Pam Hollrah for their assistance in pulling it all together.
Happy holidays and an accurate 1985.
James M. Yates EDITOR
MTA Journal/November 1984 9

This page left intentionally blank for notes, doodling, or writing articles and comments for the MTA Journal.
MTA Journal/November 1984 10

ELECTION YEAR STOCK MARKET PATTERNS
William J. Kamperman
Election years have tended to be good for stock prices. In the fourteen election years since 1928 prices have risen in eleven of those years. Only three years were bear market years (where prices were declining coming into the year and continued falling during the election year). Dur- ing the eleven years when prices were rising, they never peaked before June of the election year. The average gain from June to the subsequent market peak was 20 percent. (See Chart a
A review of the quarterly patterns during the election years shows a strong tendency for prices to rise in each quarter. In all of the eleven bull market years no calendar quarter of the election year had a ratio that was worse than eight up quarters to three down quarters. More interesting and relevant to the current cycle is that during three of the eleven years when the market was down in the first quarter (1948, 1968, and 1980) prices rose sharply in the second quarter. In only one of the eleven election years was the market declining for two consecutive quarters (the third and fourth quarters of 1948).
CONCLUSION: We expect the market to be better after the first quarter.
WHAT HAPPENS AFTER JUNE
Given that the risk of a bear market increases as we approach the election and also that we should not have a peak before June (see Chart l), we looked at the simple strategy of selling at the average price of the Standard and Poor’s 500 Composite for May of each election year. The results are shown on Chart 2. The average rise in the market from May (point A) to the peak in each cycle (point B) was 20 percent. The market took nineteen months on average to return to the price at which we sold in May (point C). This return was followed by a drop of 16 percent on average to the subsequent bear market low (point D).
A return of 20 percent over a nineteen month period (assuming we could time the peak exactly but not counting any returns on cash generated) would be equal to a return of 12.6 percent per annum during the nineteen month period.
When compared with cash returns of around 10 percent and possibly higher over the nineteen months following May and considering the difficulty with timing the peak exactly, the simple strategy of raising cash in May appears attractive.
WHO GETS ELECTED
We thought it might be interesting to see if the election results themselves had some relation- ship to what happened in the stock market. Looking separately at those years when the in- cumbent was re-elected versus those when a new president took office, we found some interesting results. The years 1932, 1940, and 1960 were excluded because they were bear market years. In 1936,1948,1956, and 1972 the incumbent was re-elected. During these mar-
MTA Journal/November 1984 11

ket cycles, prices peaked out on average one month prior to the election and the peak never came later than three months after the election. In the remaining election years when a new president was installed (this includes the year 1944 since Roosevelt only served till April 1945 and was succeeded by Truman) the peak in price ranged from -2 to 18 months from the elec- tion, with an average about six months after the election. In three of these election cycles the market was able to sustain an advance greater than ten months past the election. In 1928, Hoover was elected and the market rose for ten months. Truman took over in 1945 and the market continued to rise eighteen months past election time. In 1964, Johnson was elected and the market continued to rise for fourteen months.
The market, it seems, prefers some new blood and new ideas to keep it rolling along.
UPDATE
During the last year there have been many articles in the press and various journals dealing with the behavior of stock prices during election years.
The intent of this article, which was written during the first quarter of this year when stock prices were severely depressed, was to devise a simple strategy for investing during the election year. Obviously, the patterns described were general in nature. Our conclusions were to remain fully invested until June at the earliest based on past patterns. However, when stock prices failed to rally by June we remained 100% invested waiting for the rally. This paid off in August, and we began reducing our exposure immediately after the August rally.
These studies are always fun to do but should be taken with a “grain of salt” and an eye to current events. We include studies like this along with many other technical, and funda- mental indicators in our “zone analysis” approach to market timing.
In our view, the general pattern described in this article is still valid and along with other information suggests a zone of moderate risk for stock prices over the coming year.
THERE HAS BEEN A STRONG TENDENCY FOR STOCK PRICES TO RISE IN ELECTION YEARS
1928 35% 1952 10% 1976 18%
32 -20 56 3 80 15
36 32 60 - 5.2
40 -14 64 13
44 29 68 12
48 1 72 20
Chart 1
MTA Journal/November 1984 12
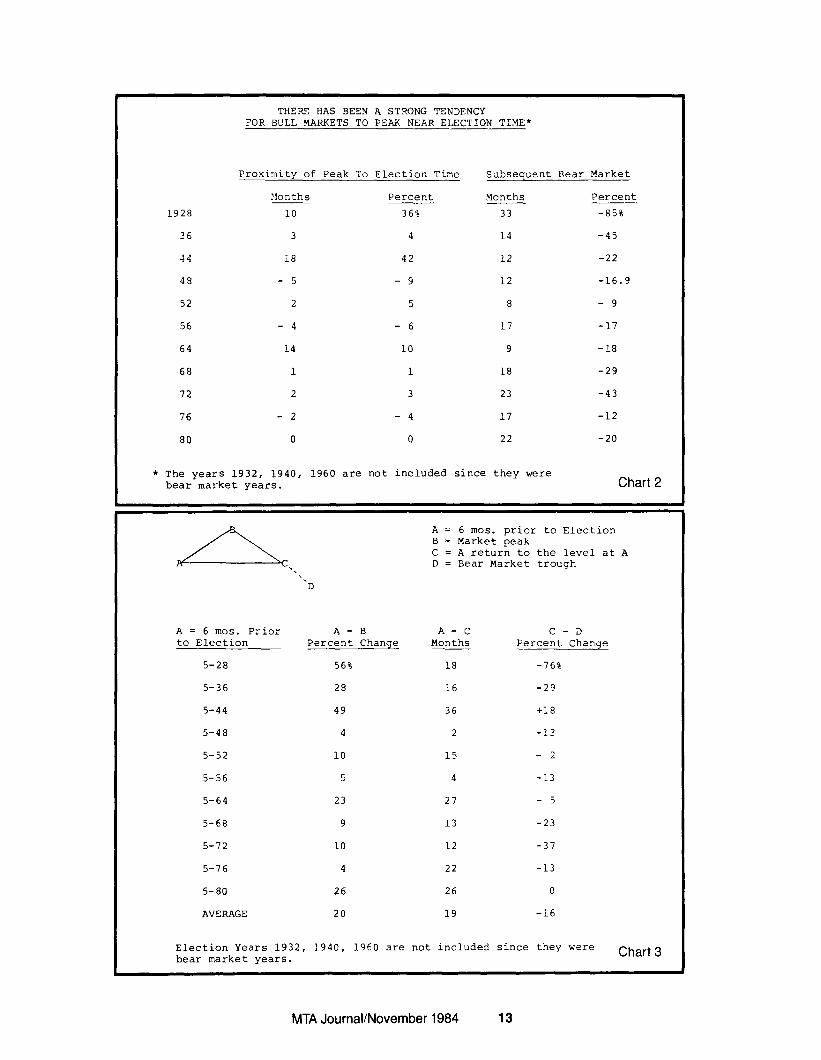
THERE HAS SEEN A STRONG TENDENCY FOR BC'LL MARKETS TO PEAK NEAR ELECTION TIME*
Proximity of Peak To Election Time
Months Percent
1928 10 364
36 3 4
44 18 42
5 - 9
2 5
4 -6
43
52
56
64
68
72
76
Subsequent Bear Market
Months L Percent -- 33 -85%
14 -45
12 -22
12 -16.9
8 - 9
17 -17
14 10 9 -18
1 1 18 -29
2 3 23 -43
2 -4 17 -12
80 0 0 22 -20
* The years 1932, 1940, 1960 are not included since they were bear market years. Chart 2
At. ‘\ D
A = 6 mos. Prior to Election
5-28
5-36
5-44
5-48
5-52
5-56
5-64
5-68
5-72
5-76
S-80
AVERAGE
A-B Percent Change
56%
28
49
4
10
5
23
9 13
10 12
4 22
26 26
20 19
A = 6 mos. prior to Election B = Market peak C = A return to the level at A D = Bear Market trough
A-C Months --
18
16
36
2
15
4
27
C-D Percent Change
-76%
-29
+18
-13
- 2
-13
-5
-23
-37
-13
0
-16
Election Years 1932, 1940, 1960 are not included since they were bear market years. Chart 3
MTA Journal/November 1984 13

BIOGRAPHY
William Kamperman is Director of investment for F. Martin Koenig & Co. He is responsible for all funds under management using equity and options strategies. Prior to joining Koenig & Co., Bill spent 10 years at Chase with Martin Koenig where he was involved with equity and option portfolio management.
MTA Journal/November 1984 14

HOW TECHNICAL ANALYSIS BENEFITS PORTFOLIO STRATEGY IMPLEMENTATION
I.
II.
III.
IV
v.
VI.
VII.
Lewis C. Habash
LOOKING FORWARD - The need to anticipate events and prepare a plan to best position your portfolios.
a. Recognize change b. Anticipate the meaning c. Modify your strategy
STRIVING FOR SUPERIOR PERFORMANCE
a. Right attitude to change b. Look for opportunities c. Make the needed adjustments
ESTABLISH INVESTMENT OBJECTIVES
a. Investment policy b. Strategy c. Timing
S.E.M.A.C.S. - Security Evaluation Monitor and Control System.
a. Identifies major trend and characteristic of each security and ranks them
BULL MARKET OR BEAR MARKET
a. Recommended portfolio Balance Index b. Identifies market environment C. Identifies strong industries d. Identifies improving or deteriorating performance e. Charts N.Y.S.E. and A.S.E.
SUPERIOR PERFORMANCE MUST RESULT IF YOU APPLY THE EVALUATIONS INTO DECISION
“LAW OF THE UNIVERSE”
MTA Journal/November 1984 15

VIII. BUY STRONG AND IMPROVING - Reduce neutral and deteriorating - Sell and avoid weak and deteriorating.
IX. HOW DO YOU MAKE THESE EVALUATIONS?
X. SYMBOLIC CHART OF BULL-BEAR CYCLE
a. Stages of identification of major trend b. Each security or the general market can be identified as
to location within its major trend c. A “new indicator” developed by evaluating the percentage of
securities in each stage d. Very meaningful because it’s sensitive to significant price
movements. e. Illustrative charts - major trend and intermediate trend
1. Demand - Improving stages 2. Supply - Deteriorating stages 3. Differential - Demand-supply
Xl. SEMACS - Portfolio Monitor
a. Ranks portfolio selection by performance relative to each other. The strongest at the top and the weakest at the bottom
b. Focuses attention of significant changes in major trend, support, supply and urgency of that change
c. Helps upgrade portfolio on a continuing basis
MTA Journal/November 1984 16

TRACKING THE “QUALITY” OF INVESTMENTS WITH THE MOST ACTIVES MONEY FLOW
Bruce McCurtain
For years the advance/decline indicator (AD) has been a basic tool which many technical an- alysts have used to estimate the relative “health” of the stock market at a given time. On count- less occasions (such as June, 1983, when the AD line began to deteriorate in spite of a stronger Dow Jones Average), the AD line predicted a changing climate in the marketplace even though the more visible “external” pricing had yet to reverse direction.
Unfortunately, the AD line often has such a long lead time that it is of little precise use in “timing” the market. As a consequence, the indicator functions best as a disparity indicator, but even then its signals can be deceptive.
A new market barometer “The Most Actives Money Flow” (MAM) tends to perform better than the AD as a disparity indicator by emphasizing the market’s accumulation and distribution bias. In addition, the tool can be used more accurately than the AD as an overbought/oversold indicator.
Essentially, MAM emphasizes the “quality” of buying and selling. During a period of rising prices, if MAM is also advancing, a money manager might assume that “intelligent” money is com- fortable with stocks of lesser quality. On the other hand, if the market advance is characterized by a declining MAM, the health of that advance would be suspect since the evidence would hint that those same investors are skeptical about the prospects of higher prices in stocks of marginal value. In a major decline, so long as MAM is in “sync” with the market, prices will continue to drop. Conversely, if the market makes new lows without a commensurate confir- mation by MAM, the chances would increase significantly for a termination of the downtrend.
To gain a clearer understanding of how MAM functions, it will be helpful to get a longer term perspective of the indicator’s behavior. An examination of how it acted just prior to the August, 1982, bull market lows and during the period just before the 170 point decline in January, 1984, will achieve this.
On the weekly chart (Chart l), the relationship between the Dow Jones Industrials and MAM can be seen as the chart stretches back to July, 1981 (also refer to the accompanying monthly chart, Chart 2). Notice how MAM, except for brief dips, was trending upwards--on balance-- for nearly a year while the Dow meandered between 800 and 900--at least until August, 1982. At that time when the major bull rally began, MAM rose rapidly, hit new near term highs, and proceeded to keep in step with the senior averages until June 24, 1983, when MAM hit a major high (see daily chart, Chart 3). After a brief contraction, MAM rallied again towards its June pinnacle but stalled again in late September and early October. Thereafter, MAM began to de- teriorate dramatically (signalling radical distribution) and indicated that “smart” money was no longer comfortable with stocks of lesser quality. When the Dow finally peaked during the week of January 13 at 1295.44, MAM had already signalled that the market was very sick internally. The rest is history--at least 170 points of downside history.
Following the January-March, 1984, decline, MAM reached a bottom on February 21. Three weeks later when the Dow tested its February 24 lows, MAM held substantially above its trough to signify accumulation. Two weeks later, however, after a brief rally, on March 26 the indicator failed to confirm a new short term high in the Dow to suggest that the market might be weaker than the external prices were revealing. As of March 30, the lack of follow through over the
MTA Journal/November 1984 17

short term hinted that the market continued to reflect bearish overtones in that “smart” money was still not convinced “B” grade stocks should be owned for price appreciation.
MAM can also be used as a market thermometer. By referring to the long term weekly chart (Chart 1) it is possible to observe how the oscillator, which was derived from the indicator’s internal statistics, provided overbought and oversold readings. (See bottom of Chart 1.) Usu- ally, notations below 1 .OO indicate an unhealthy market, and measurements above that level suggest that all is well with the marketplace. In addition, at the lowest reaches of the scale (readings under 0.50) indicate that a buying opportunity is imminent. Readings above 3.50 (although somewhat less reliable than the downside extremes) hint that the market has gotten overextended and is due for some hesitation.
In sum, by measuring the “quality” of dollars flowing into the market at a given time (that is, dollars which reflect the psychological outlook of investors as they view lesser quality secu- rities) it is possible to judge whether the market should resolve itself in favor of the bulls or the 3ears.
Chart 1
MTA Journal/November 1984 18
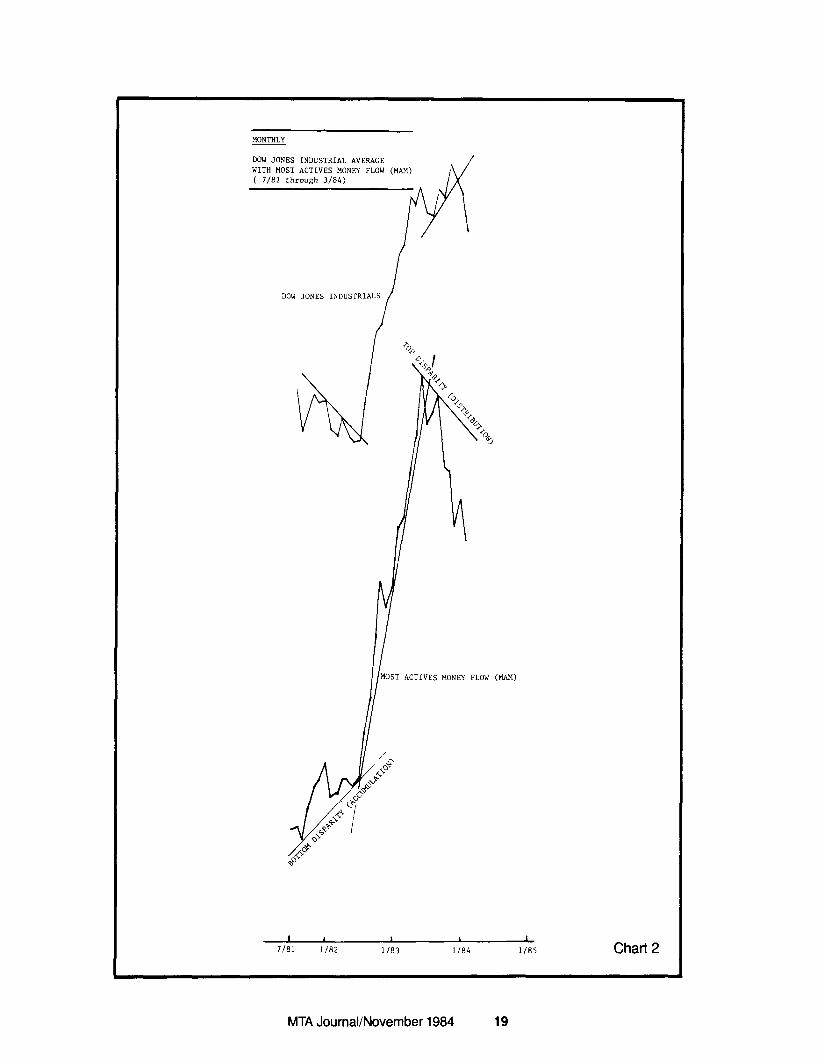
MONTHLY
DOW JONES INDUSTRIAL AVERAGE WITH MOST ACTIVES MONEY FLOW (MAM) ( 7/81 through 3/84)
I 1 I 1 I L
7/81 l/82 l/83 1184 l/85 Chart 2
MTA Journal/November 1984 19

Chart 3
MTA Journal/November 1984 20

UPDATE
Once February 21, 1984, lows in MAM were established, the gradual erosion of Dow Jones Industrial Average through late June 1984 was not confirmed by indicators. MAM’s bias toward accumulation culminated in 150 point Dow Jones rally in late June 1984. The indicator peaked during the week of August 10,1984, and has been drifting lower since then. In early December, although MAM was treacherously close to a major uptrend, no primary sell signal had been given.
BIOGRAPHY
Bruce McCurtain is Chief Technical Analyst at Technical Data Corporation, a Boston-based technical and statistical data resource company. He also worked as a market technician for Heim Investment Services, a West Coast investment advisory service, and for Kidder, Pea- body and Co. as a registered representative.
MTA Journal/November 1984 21

This page left intentionally blank for notes, doodling, or writing articles and comments for the MTA Journal.
MTA Journal/November 1984 22

M AND W WAVES - MORE DATA August 19, 1984
Arthur A. Merrill
In the February, 1980, Market Technicians Journal, a method was outlined for positively iden- tifying five point wave patterns. One of 32 possible labels could be unequivocally attached to any wave.
Since the identification is precise and definite, the historical record can then be searched for identical patterns. The market performance after each pattern can be noted to see if the pattern has a bullish or a bearish bias.
Since the 1980 article, I’ve noted and classified some 2000 patterns of the moves of individual stocks. The results are in the following paragraphs. In addition, a method will be noted for trans- lating point and figure charts into the wave classification.
THE CLASSIFICATION:
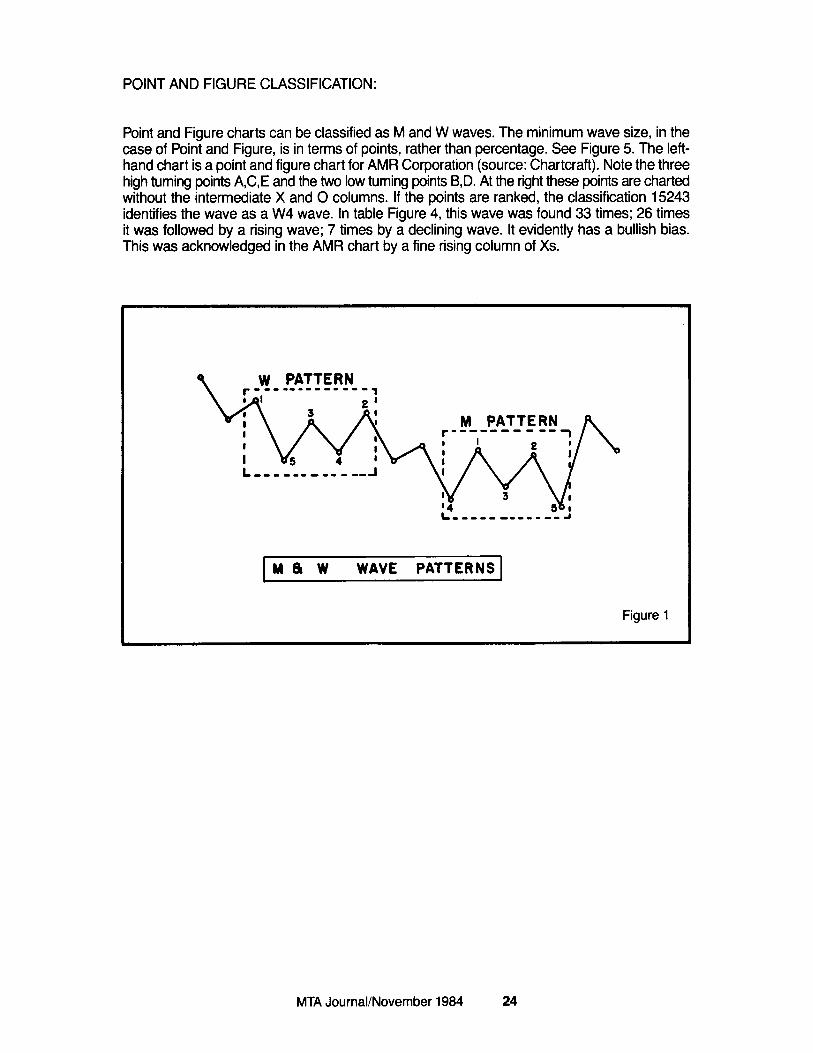
The first step in classification is to establish a boundary line. The minimum swing size is spec- ified; all waves of a smaller magnitude are ignored or filtered out. The remaining waves are considered through a span of five turning points. See Figure 1. If the first swing is downward, the patterns form a W; if the first swing is upward the pattern forms an M. In Figures 2 and 3 I’ve classified all possible patterns as 16 M and 16 W patterns.
Positive identification is possible by a method suggested by Robert Levy in 1971. Rank the points from 1 for the highest to 5 for the lowest; read the ranks from left to right and you have a five digit identification number.
THE TEST
To check the patterns, they were considered in pairs. The left-hand pattern in each pair was the forecasting pattern; the right-hand pattern described behavior following the forecasting pat- tern. The right-hand pattern was considered bullish behavior if its far right-hand point was higher than its far left-hand point. If the far right-hand point was lower, it was considered bearish be- havior. For example, Ml is a bearish period; Ml0 is a bullish period.
It was then a simple job for the computer to count the number of bullish and the number of bearish periods following each pattern. The result is in Figure 4, which tabulates the perfor- mance of 2036 common stock M and W waves, using a 10 percent filter. For example, the Ml pattern was found 57 times. On 24 occasions the next pattern was a rising or bullish period; it was a declining or bearish period on 33 occasions. The bullets mark significance at the 95 per- cant confidence level.
MTA Journal/November 1984 23
POINT AND FIGURE CLASSIFICATION:
Point and Figure charts can be classified as M and W waves. The minimum wave size, in the case of Point and Figure, is in terms of points, rather than percentage. See Figure 5. The left- hand chart is a point and figure chart for AMR Corporation (source: Chartcraft). Note the three high turning points A,C,E and the two low turning points B,D. At the right these points are charted without the intermediate X and 0 columns. If the points are ranked, the classification 15243 identifies the wave as a W4 wave. In table Figure 4, this wave was found 33 times; 26 times it was followed by a rising wave; 7 times by a declining wave. It evidently has a bullish bias. This was acknowledged in the AMR chart by a fine rising column of Xs.
w PATTERN
M PATTERN r-------- --
MB w WAVE PATTERNS
Figure 1
MTA Journal/November 1984 24

I53 4 31425 3 I524
32415 3 25 I4 4 I 3 2 5 4 I523
M9
PI I MI0 Mll I
[M12
v I L
42315 4 25 I3 4 3 6 I 2 5 1324
Ml3 I Ml4
I lz!l Ml5 -Tic--I
!!!I AAM 51423 523 I4 52413 53412
Figure 2
MTA Journal/November 1984 25
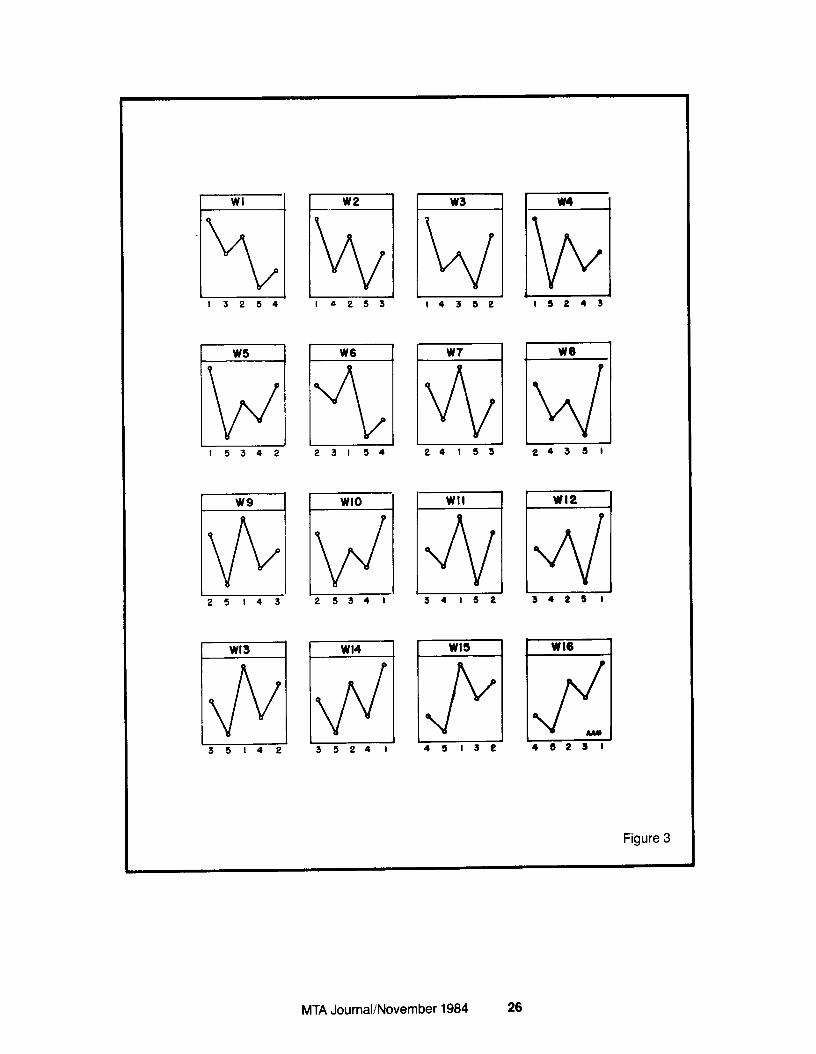
WI
-m
I 3254.
w5
lI7l 15342
w9
m 25143
WI3
m 35142
W6
Tl I
23154
WI0 LA
25341
WI4
M 35241
Wf
vii 24153
WII 1
4 1
3 415 2
WI5
LEEJ!l 45132
w4
El IS2 4 3
L
W6
4 I
24351
WI2
34261
wlel
sl 48231
MTA Journal/November 1984 26

Figure4
M WAVES WAVE UP M 1 24 M 2 15 ii 3 4 37 68
5 5 6 19 10
ii 8 7 38 I4 M 9 24 M 10 25 M II 23 M I2 42 M 13 40 M 14 29 M 15 105 M 16 64
DW 33 22 42
;: 13 16 7
24 16 22 30 15 22 80 36
%UP 42.11. 40.54. 61.82 52.11 48.72 43.48 70.37e 66.67 50.00 60.98 51.11 58.33 72.73. 56.86 56.76 64.00
w WAVES WAVE UP
: 2 1 34 66 W 3 30
: 5 4 26 36 W 6 14 W 7 33 W 8 27 W 9 16 w 10 47 w 11 11 W 12 18 W 13 48 W 14 84 W 15 27 W 16 58
DWN %UP 30 53.13 59 52.80 26 53.57
7 78.79e 31 53.73 15 48.28 29 53.23 29 48.21 10 61.54 33 58.75
7 61.11 21 46.15 29 62.34 62 57.53 22 55.10 42 58.00
MTAJournaVNovember1984 27

15243 x X
A
d
X X
x0 x0 ::
xo /c E x” x0x xoxolt x xoxoxox
oxoxox 0x0 0 Q
t B D
AMR Corp.
Figure 5
5 2 4 3
c
E b D
B
w4 WAVE
MTA Journal/November 1984 28

BIOGRAPHY
Arthur Merrill was awarded the coveted MTA annual award in 1977. Art is the publisher of Tech- nical Fends, a statistical stock market service. He pioneered in the study of seasonal patterns of stock prices, and is the author of the book Behavior of Prices on Wall Street, Seasonal Tend- encies in Stock Prices, Bear Market Characteristics, and Market indicators and Growth Company Earnings. Among the indicators originated by Art is the ratio of ASE to NYSE vol- ume, a device now used by many technicians as a gauge of speculative activity.
MTA Journal/November 1984 29

This page left intentionally blank for notes, doodling, or writing articles and comments for the MTA Journal.
MTA Journal/November 1984 30

SPEECH GIVEN BY JAMES DINES BEFORE THE MARKETTECHNICIANS ASSOCIATION/TECHNICAL SECURITIES ANALYSTS OF SAN FRANCISCO,
MAY lo,1984
James Dines
Welcome to beautiful, sunny California. Please allow me to offer everybody here a very warm welcome, and to express gratitude to those who have come from long distances, especially the delegation from Japan. To me, this represents a new internationalization of our craft. I did address the Tokyo Society of Security Analysts in 1980, so I am especially glad to welcome our new Japanese friends to our Technical fraternity here in the United States. I hope every- body today will go out of their way to welcome our new friends, and to encourage other nations to send representatives to us so that we can exchange ideas. We have a wonderful selection of speakers here in the next few days, and I am looking forward to meeting my many friends in this industry.
The Technical Securities Analysts Associaion of San Francisco has chosen me to represent them at this event, and the National Committee has selected me to be your keynote speaker. I deeply appreciate both of those honors from my peers, and I shall always treasure them. Of the many hundreds of speeches that I have given, this might be the most important one, to me, and I have spent months reflecting on and preparing for it.
I asked myself, what would most benefit you today, what knowledge could I share that would be most useful to you? Not that any speaker here today will give you the one magic technical indicator that works absolutely every time, which is our industry’s Holy Grail. And anyway, new indicators will always be with you but I will not.
My talk today will consist of four parts. The first is called ‘A Flashlight for Orphans in the Dark.” Second, I will share with you my pet Technical Indicators. Third, I will make specific predictions on stocks, bonds, commodities and precious metals. And, finally I will open the floor to ques- tions from the audience. Those of you with questions, please print them on a single sheet of paper, try to keep it to one sentence or at most two, and leave them up here on the desk.
Before I start, I would like to ask if anybody here has actually read any works of Dow, Rhea or Hamilton in the original?
How many people have read Elliott in the original? Hamilton Bolton? E. George Schaefer? Humphrey Neill? The Dines Letter?
Of the thousands of reporters to have interviewed me in the last 30 years, I have never given a personal interview. I have always been glad to share my mind and knowledge, but I have never discussed my early experiences because I am a private man, so this will be the first time. Hopefully, my perspective will add something.
How did Technical Analysis start, where is it now, and can we extrapolate from those two to make useful predictions about where we’re going? Such knowledge could be very useful to Technicians and newsletter editors in planning their companies’ futures. Why are financial newsletters regulated by the government, whereas Fortune, Forbes, and every other sector of the press is militantly proud of the fact that government cannot control it? What about the impact of the new newsletter rating services, and will there some day be international com- petition, much as now presently exists for mututal funds? What bothers me about our industry is that we are so oriented to the present, wondering which stocks will rise today, that we do not
0 1984 James Dines and Company
MTA Journal/November 1984 31

pause to reflect on the long-term development of Technical Analysis, so that we may better comprehend where it is headed. Here we are today, this group being the world’s bastion of Technical Analysis, and when I asked those questions before about who had read our intel- lectual forefathers, a surprisingly small percentage had actually read them in the original. That is why I regard Technical Analysts today as orphans in the dark, and why I wanted to discuss our roots. Hopefully, one of you will write a book on this subject, as it is long overdue.
I am supposed to be the leader in Point and Figure analysis and I blush to admit that I do not even know who discovered Point and Figure analysis! I have heard rumors that it was some- body called Dr. Klein, during the Civil War (although there was nothing civil about it), but he has been lost to antiquity, and I hope that more information can be saved on subsequent lead- ers in our field.
of course we all know about Dow, Rhea, and Hamilton at the beginning of this century, and I am glad that Richard Russell discussed them in detail last night, as I learned a lot.
The next Technical giant after Dow, Rhea, and Hamilton was R. N. Elliott, and I am outraged at the lack of support he received, the criticism he endured, and his penniless death. Elliott inspired E. George Schaefer, another man who was ignored, shunned, given no recognition or acknowledgement, and who was finally hounded to his suicide by regulators. I’ll come back to that in a moment. Schaefer was the greatest interpreter of Elliott’s work, and had he lived, we could have learned a great deal about what Elliott had actually perceived, which has now been irretrievably lost, forever.
Believe it or not, fellow Technicians, these are your roots, and the time will come when every word they wrote will be pored over. Since 1954 I have envisioned someday a great university devoted to Technical Analysis, and financial archeologists will come back to study us just as surely as in this century archeologists have explored the world to see where humans came from -for the first time seriously in the history of humanity I, therefore, advise you to beat the crowd, and to go back and study the greats. It is difficult to describe what Wall Street was like when I first arrived in 1953. The heads of most of the firms had male secretaries, on the grounds that women on Wall Street were somewhat suspect -- indeed, as was anybody who was not an elderly WASP The only financial newsletters were given away free by brokers, were always Fundamentalist and never Technical, and were always bullish. There was no such thing as a “Security Analyst,” only what were then called “statisticians” -- placed safely out of the way in the back office busily counting the number of railroad ties per railroad share. Wall Street’s dis- grace in the 1930’s and the war years insured that the 1950’s was not dominated by the young.
The first newsletter writer to break the mold was a man called Walter Gutman, who in 1959 dared to vary from the then-ultra-conservative, tombstone-style of writing, injecting non-stock market commentary and even humor on occasion. He was a big inspiration to me at the time, but vanished in the early 1960s I believe, because he was a Fundamentalist and not a Technician.
Another writer who inspired me early was Joe Granville, who exploded on the national scene in 1960 with his book, having successfully gotten away with boldly putting forth Technical Anal- ysis in his brokerage letter. Richard Russell had already been publishing for a few years in Cal- ifornia, but unfortunately I did not know of him in those days, although I was later grateful to him for calling attention to The Dow Theory, which I now interpret as very bullish, unless it makes a new 1984 low.
By this time I was one of the new young turks on Wall Street, and there were only a few of us at the time. We all knew each other because we really stood out in that elderly, Fundamentalist crowd. I had had a meteoric rise, with promotion after promotion, and finally in 1960 I was given my own newsletter to write for A. M. Kidder. At that time the hostility towards Technical Analysis was palpable, and most of us had to keep our chartbooks hidden in the bottom drawer; you
MTA Journal/November 1984 32
know, decide based on charts and then tell the funamentalists the “reasons” to back it up. All this was done when Wall Street was a very gentlemanly place, something like a cricket field in 19th century England, with most players always attempting to keep a professional and im- personal attitude, especially demonstrating respect to other professionals. I actually lament the loss of that gentlemanliness.
The Wall Street establishment hated charts and Technicians because chartists could come out with predictions after only a relatively brief period of study, whereas Fundamentalists had to study their craft for many years before they could offer opinions. Thus, we were regarded as a combination of astrology, witchcraft, phrenology, AIDS, and, worse, even suspected of lurk- ing Republicanism. There were simply no outlets for Technical Analysts, and because of my deep frustration with this situation, I left the brokerage industry in 1962 to publish a Technical newsletter. I believe it was the first time a Wall Street Analyst publicly changed from a Fun- damentalist to a Technical Analyst, and dared publish the results. The only Technical Analyst from the Wall Street establishment who had previously dared to publish Technical Analysis was Joe Granville, but he was still with a brokerage house at the time I broke away and went public. Thus, on the basis of the first crack in the Fundamentalist facade of the Wall Street establish- ment, I was probably the guilty party.
A. M. Kidder made it plain to me that they were not interested in charts and especially not in- terested in anybody who thought gold was going to go higher than $35, so I knew I had to pub- lish on my own or else suppress what I knew to be the truth. Because I refused to recant, I was fired, and thrown out in the street with two infants to feed at a time when my competition was giving its newsletters away free! I was ineluctably drawn to the conclusion that the only way to survive free competition was to develop much higher accuracy, and this was a source of the marriage between independent newsletters and Technical Analysis. They have been closely wedded ever since.
I have been doing this for many years, and nobody is here forever, so I wanted to share my perceptions of our roots with you while we are both here to hear it. The prejudice against news- letters in the 1960s is something I simply cannot describe to you, but it molded me tremen- dously, and gave me the strength to resist anybody who hates Technicians. For example, in the early days I was infuriated when certain publications refused to accept advertisements for stock market newsletters -- such as The Wall Street Journal, which still does not accept them. The Journal takes ads from every other cockamamie invention or crazy scheme in the world, but they refuse to accept a newsletter advertisement! Also, The Wall Street Transcript; I re- member when they invited me to speak out on silver when it was at its lows, and they quoted me at great length, but when I asked them to accept a Dines Letter ad, they told me they didn’t accept ads from newsletters. As a result I have never given them another interview. I figure if I’m good enough to appear in their text, then I’m good enough to appear on their advertising pages. I hope one of you will fight to correct such outrages.
Early in my career I was regulated by no fewer than 8 different sets of regulators, and was known to become fairly apoplectic about the subject. Why did I have to pay all those legal fees, when I owned my company entirely? Why did I have to file annual statements publishing my personal affairs to the world when I am not a public utility, nor am I publicly owned, nor do I manage individual money. The First Amendment was specifically designed to protect “pam- phleteers,” who are typically underfinanced, and most vulnerable to government “regulations.” I am, therefore, outraged by disclosure requirements, and any “regulator” other than the free market.
I remember being bullied constantly. The Securities and Exchange Commission (SEC) in 1963 wanted me to register my Point and Figure chartbook,-simply because I also published a newsletter that had to be registered, so I threw them out of my office. In 1970, the New York Attorney General Abrams filed suit against me, and I had to pay thousands of dollars of fees
MTA Journal/November 1984 33

to a criminal lawyer, because Abrams said that I was a spy for South Africa. So help me God, he claimed that since no rational person would recommend gold mining shares, such as ASA at 2 l/2 dollars a share, I was obviously in the pay of the South African government and was some kind of foreign agent! They were not interested in the fact that ASA was in an “Uptrend.” Again I was apoplectic that I had to fend off know-nothings like Abrams, and my lawyer was dumbfounded and disillusioned that Abrams had no proof and was simply going on some kind of Gestapo fishing expedition to see what he could find out about me. Those regulator jerks eventually dropped the charges, of course, but I had to pay the legal fees to warn the public about a gold crisis that I predicted would lead to a great inflation and then a great deflation, at a time when my money was scarce.
It took 350 years to rehabilitate Galileo from his condemnation for saying that the Earth was not the center of the universe, but it’s also true that a mere 35 years ago, Wall Street was ad- amantly hostile to anybody who admitted either to believing in gold or Technical Analysis chart- ing. Any employee caught would have been fired on the spot, as I know from personal experience, and that is why I have been so outspokenly and fearlessly hostile to the whole idea that the financial newsletter industry should be subject to “regulators” from the SEC and many states, in direct violation of our Constitution concerning freedom of the press.
I want to leave you with the perception that you are orphans because in the early years Tech- nical Analysis was suppressed by scorn, so much so that very few Technicians realize what their roots are. It never stops.
After the New York regulators had hounded Schaefer to his suicide, I was spoiling for a fight and I vowed that someday when I was finally strong enough, I would give them a real surprise the next time they thought they would mug me quietly in the dark -- again. When the New York regulators demanded in 1980 that I stop using a I? 0. Box, I refused to comply because they had no legal right to force me. I was then warned that there would be “trouble,” so I threw them out of my office. The next thing I knew The Wall Street Journal had published -- worldwide by the way -- a press release from the New York regulators that they had filed suit with 13 sep- arate charges. A press release! I won’t go into how ridiculous the accusations were, but one of them actually stated that I did not really write my own newsletters! They were such pre- posterous, outrageous distortions and Hitlerian lies that I felt that they had finally overextended themselves badly, and my chance had at last come. I smashed them in the first trial, and won a unanimous innocent verdict. They had the nerve to come back a second time, on appeal, and again their case was thrown out of court unanimously. Just to demonstrate the kind of harassment that I’ve had to put up with, they came back a third time and I beat them yet again! And I still want to know why taxpayers paid for a third suit when the first two were thrown out of court as worthless, and why I had to keep paying legal fees through all this period! It seems that the motto of newsletter “regulators” is, “If justice triumphs, we’ll appeal!” Oh well. I figure that living well is the best revenge.
I hope that one of you someday fights to make the so-called “regulators” pay all legal fees when they lose.
Nobody has ever asked me who my mentor was. In the stock market it was E. George Schae- fer, one of the greatest minds to grace our stock market pantheon since FL N. Elliott himself. Schaefer knew Elliott, and studied him when Elliott was ignored and despised as some kind of freak chartist. Well, we all are, aren’t we? Schaefer had phenomenal understanding, and I believe I learned a great deal from him, which is why I want to pass my knowledge on to the next generation. He was a sensitive man, and a great leader who was baffled by his inability to attract favorable attention, but the prejudice against newsletters ran too deep, and many writers and public commentators issued frequent snide remarks about Technicians, so it was difficult for us to lift our heads. It was at least partially based on Schaefer’s work that I flashed my famous Major sell signal for the market at 1001 .l 1 on February 6, 1966, ending the bull
MTA Journal/November 1984 34

market that had begun precisely 34 years earlier, a Fibonacci number. Adjusted for inflation, that was the exact month that the Dow Jones Industrials made its all-time highs.* Tragically, in 1974, I’ll never forget how this sensitive genius, E. George Schaefer (I subscribed to his news- letter for years and I still have and treasure them and will someday donate them to MTA), was caught in the trap of raising money for margin calls on his gold holdings. Of course every time he sold some to raise money, it pushed his remaining gold shares down even further, until fi- nally he was bankrupt, Killed by margin calls is an apt statement inasmuch as I remember how distraught he was when I talked to him while this was happening. A week later he went out an eleventh story window, and his wife died shortly after -- Schaefer’s son told me of a broken heart. The reason? Just about every regulatory group jumped on this great mind the same way they did to Billy Mitchell and Goddard, the inventor of rockets, and just about anyone who tries to do something really good for the world. I still take Schaefer’s death very personally, and I will never forgive the “regulators” for what they did to him. A central peace is one of the pre- requisites for longevity in this stressful business. If you have your health, you have everything, and that is primarily a function of truthful communication. No other profession has so many suicides. Truly, as Richard so aptly said last night, “The history of our business is not a happy history,” which I see as a measure of how challenging it is. That’s why we chose it!
That is why I carry a very bright red and yellow chip on my shoulder and my message to any- one who hates newsletters, who wants to put them down, who wants to make snide remarks, who hates Technical Analysts, had better know that I will do everything in my power to step on them on sight -- like cockroaches. I am especially weary of Granville-bashers. I have been interviewed by thousands of reporters in the last quarter-century, and I tell you they are a great group. About 99 percent of them are fantastic, and wrote what they could at the time, honestly and objectively But there are always a few bad apples in the crowd, who are trying to make their careers at the expense of putting down newsletters. If they don’t stop their attacks, then I urge some of you young analysts to become “activists,” to take off your gloves and put on the brass knuckles. It will be time to boycott those who hate Technical Analysis, to ask our sub- scribers worldwide to write to their supervisors demanding that they be fired, or that we will withhold our advertising. Don’t be fooled by chart-haters just because they keep a few news- letter “Uncle Toms” around as friends, because that changes often enough. Analyze their forecasting record, and do it in public, or push for legislation to have them regulated also. Re- veal that they have no educational qualifications or success patterns to back them up. Check their records, to see how good they were in the past, as they do to us.
And don’t tolerate unconstitutional demands from the SEC. This generation might well ask, why did we tolerate them in the past? In the 1960s when I was weak, and had little money, and when I was trying to get people to buy my letter to learn about buying gold at $35, when there was no interest in gold, I had to put up with the SEC, and allow them to mug me in the dark. But how can we be members of the free press and write about the SEC, when they, in turn, regulate us, and when their legal fees are paid by taxpayers? Above all, I hope one of you takes the First and Fifth Amendments all the way up to the Supreme Court to stop this outrageous regulation of one of the greatest sectors of the free press, one that stood up for a gold standard before any other segment of the press in this country was willing to risk it, and I hope I live long enough to see one of you WIN in the Supreme Court, deregulating news- letters entirely.
As one of the founders of the financial newsletter industry, I have seen it evolve from the be- ginning, and I have always delighted in participating, stimulating, and encouraging the growth of this industry, because it has made tremendous contributions in terms of speaking out on the “Honest Money Movement,” which I founded in 1960, based as it is on “Bullionism,” or a gold standard. Bullionists believe that federal budgets will never be in balance without a serious gold standard.
MTA Journal/November 1984 35

The advent of computers is having a tremendous impact on Technical Analysis, making it more acceptable to the masses. That Technical Analysis will someday rival and, indeed, eclipse Fun- damental analysis is my prediction. Beyond that will come the day of Psychological Analysis, but that is another story Computers will definitely make what we do much more of a science and less of an art.
Another tremendous impact on our field is the Hulbert advisory service. As one of the oldest Technical newsletters in the world, I have watched many of you come, and unfortunately, many did not make it. However, I have always encouraged and welcomed all newcomers to this field, as I think there is more than enough room for everybody. I strongly believe that our work should be done on a gentlemanly basis, with a tremendous emphasis on integrity, uncompromising United States patriotism, total devotion to missionary free enterprise capitalism, fearless out- spokenness about the truth no matter where it leads, and always keeping absolutely para- mount a wish to be of service to the investing public out there. I hope I have injected these ideas into newsletters’ long-term mainstream.
The advent of the Hulbert service meant that, for the first time, we were being rated objectively. After all, there are many of us, and the public cannot distinguish. We should all do our best, and let the public decide what they want. The closest thing I can remember to this was when Indicator Digest was started in 1960 by Sam Coslow -- it is not being run by the same person today -- when he attempted to give a “digest” of a large number of services, but there was no effort made to develop a quantitative judgment. By numericalizing the records of all the fi- nancial newsletters, Hulbert is forcing all of us to reexamine Technicians’ attention to accuracy, and I believe the discipline of the competition will be good for all of us -- temporarily painful though it might be at times. Already, other rating services are springing up. At any rate, the question is what do i predict as the result of all this? My personal opinion is that someday these ratings will be as closely followed internationally as the Nielsen ratings are today, and that they will be scrutinized even beyond the financial community, internationally, on a level that nobody here would believe today.
Other trends I see with my perspective is that more and more newsletter writers will become superstars. They’re not yet as important as in baseball, or popular music, but the days when Technical Analysts were not paid any salary (and had to get their income entirely from what- ever brokerage commissions that they generated for the firm) are gone forever. I foresee su- perstars making fantastically big money in the newsletter business, and I think it will be stimulated by the international rating services.
Further down, I see us being bought out by the large financial supermarkets, much the way stockbrokers themselves are being acquired by insurance companies now. These are all trends for which to prepare.
It is also easy to foresee that some of the people here will emerge to inherit the mantle that was laid down by the forefathers of Technical Analysis. It is impossible to say for sure who they might be, as time has its own criteria not immediately apparent to current participants and his- tory never reveals its alternatives. I doubt that the great Charles Henry Dow knew that he would be a historic figure. After we are gone, they will point back to us and speculate on what we meant. What a waste that they cannot think of asking those questions now. Because we here stand at the cutting edge of a new technology, undoubtedly legends will be made, especially considering how individualistic Technicians tend to be. What a span I have seen, all the way back to days when Technical Analysis was thought worse than unacceptable, to its emerging status as a science. Wherever I am when my predictions come true, I will smile down on (or up at) you, if I can.
These are your roots, and I hope you are proud of yourselves for having surmounted the ob- stacles. Now let’s turn our attention to methodology
MTA Journal/November 1984 36

The second part of my talk will involve The Dines Letter’s unique working concepts. Those who would like to know all of my input, should read my first book, Technical Analysis. My book was highly recommended by the famous Lex column in the London Financial Times, who said that this book had done for Technical Analysis what Graham and Dodd had done for fundamentals and I apologize for that. I have brought one copy with me, and those of you who wish to ex- amine it free of charge may certainly do so. I hereby donate this book to the MTA.
In the limited time that I have, I would like to share a few of the basic concepts that I have de- veloped over many years:
The Dines First Market Axiom is deceptively simple, and states that “A trend in motion will con- tinue until it actually ends.” This is as true of general market trends as it is of individual stock price trends. Despite what you might hear, nobody said this before, not even Charles Dow, except perhaps for Newton in physics.
The Dines Second Market Axiom states that “When the trend is flat, dull, or unclear, assume that the previous clear trend has remained intact until proven otherwise.” This one happens to apply to the current stock market, with the last known trend down, and since then the market has been flat. Nonetheless, I am bullish right now, having flashed a buy signal on the 21st of February, 1984, illustrating that there are exceptions to every rule. In fact, remember, the young man knows the rules, but the old man knows the exceptions.
The third is the Theory of Positive Negativism (DTPN). Neill’s Theory of Contrary Opinion states that if the public emotionally stampedes in any one direction their view should be questioned. DTPN goes one step further: on the assumption that the herd consistently and reliably will be mistaken. Don’t be a “census-taker”; go instead in the opposite direction. Learn to be a loner. Those who are first always “look wrong,” by definition.
The next one, the Dines Wolfpack Theory, states that when a few stocks in a group move in a certain direction the rest of the group will tend to follow that direction. When gold moves, all precious metals tend to follow suit.
The Dines Rule of Limbs or DROL states that if you don’t use your head you will use your feet. Translated, that means if you don’t have time to do it right the first time, you will definitely have time to do it again right the second time.
More seriously, finally, is the Dines Prescience Index which you will find on the front page of The Dines Letter (13 April 84) in your possession. Please turn to that now. In the lower right- hand corner of the front page is a net consensus of over 200 Technical Indicators taken from my first book, and you will note that it moved into the buy zone early this year, which was the basis of my buy signal. I always believe in following a consensus of Technical Indicators be- cause any one of them can be wrong at any time, but rarely the entire consensus.
These, of course, are all Technical Indicators and we also use Fundamental and Psychological indicators, as outlined in my first book, but there is just so much we can cover here today
I also like to use the Advance/Decline Lines in conjunction with the Dow Jones Averages. On the front page of The Dines Letter (13 April 84) on the left-hand side you will see how the Ad- vance/Decline Line frequently foretells the true direction of the market, and it is now bearish, which greatly concerns me, and makes me worry that my buy signal might be wrong.
Turning to the stock market, you can see in the chart on the front page, left side, that The Dines Letter has not missed an important DJI turn so far this decade, and to that extent I am fortunate enough to be pitching a no-hitter. Our last sell signal came right at the Top in December where we loaded up on put options and made a great deal of money The subsequent buy signal on
MTA Journal/November 1984 37

February 21, 1984, came within two days of the actual market Bottom on February 23, 1984, and this represents the kind of high-quality, high-precision, surgically delicate timing that tran- scends those little minds, in whose dim eyes lurk a passing grade of 70, who claim that random walk invalidates Technical Analysis. It shows that the secrets of the stock market can be cracked and decoded, and we Technicians aim to do it. (Can’t one of you figure out a more glamorous name for us?) We figure that those who knock the ball out of the park can take their time trotting around the bases.
As things stand now, unless the Dow makes a new 1984 low, I am bullish, and would not be surprised to see an advance that is near-vertical. What are my reasons for this?
Well, I have already pointed out the DPI, the Dines Prescience Index, has flashed a buy signal. Another is the longevity of this decline, because in fact the stock and bond markets both topped out way back in May, 1983, and a year is often long enough for a bear market.
Furthermore, in the April 1984 selloff, the Transports made a new low, but the Industrials did not, and this is a Dow Theory non-confirmation, which is very bullish for the market...unless the Dow makes a new 1984 low!
Finally, even though there are still many Technical Indicators that might superficially appear bearish, they are primarily in neutral Pennant Formations, featuring declining highs and ris- ing lows. Meanwhile, the 5-day moving average of daily new highs minus daily new lows shows that the highs rose above the lows this week for the first time in months, and to us this suggests an underlying buying interest, especially since the insider Technical indicators are very bullish now for the first time since the current bear market began.
Now please take the Hulbert newsletter rating out of your press kit. We have been ranked in first place in virtually every month for over a year, so that our methods are actually working. This is the Hulbert rating about which I spoke before. How can so-called “Random Walkers” explain that?
Now turn to The Dines Letter page 15. Instead of me recommending a lot of stocks, you can take this Letter home and see which ones are on our List right now. A lot of these show minuses because of the selloff back in early April, but have since gone substantially higher especially Teledyne call options! Furthermore, we have added another eleven stocks to our List, and if anybody here would like to see that listing, give me your business card and write on it “latest Dines Letter” and I will send you a free copy
If you look at pages 13 and 14, you will see ordinary bar charts of some of the stocks on our Supervised Investment Lists, and at the bottom of page 14 is the Dines Statistical Service. We compute a number of averages such as the Dines Asian Average, the Dines European Av- erage, and so forth, and we publish these so we can share the statistics we compute with the entire technical community. Please feel free to use any of this information in the future.
So, as it stands now, subscribers of The Dines Letter have been accumulating calls since the 21 st of February, and I still do not know whether we have made a mistake or not. If there is an Upside Breakout at 1190, I would then be looking for a rapid rise over 1300, which would be the long-missing “second leg” of this bull market.
A primary reason for my optimism is that there are too many pessimists around and, by the Dines Theory of Positive Negativism, one should go the other way. Note that odd-lot short sell- ing is very high, and that the Dines Tally of Technicians shows that there are too many bearish advisors. We think the pessimists are going to be wrong. The United States economy is very strong, and foreign stock markets have been soaring to new highs repeatedly, suggesting that the Dow Jones Industrial Index in the U.S. is lagging. It is also important to remember that this
MTA Journal/November 1984 38

is an election year, and the campaign will soon really heat up; it is inconceivable that interest rates will not be a prominent issue, particularly if they keep rising from here. Either Reagan will do something, or perhaps Congressman Jack Kemp will start a movement to nationalize the Fed. The big question is, from whom, since nobody knows who owns the Fed, but that is an- other story
What could cause the rally that I envision? A surprise drop in interest rates would do it, and remember that that is a function of politics, which could change at the stroke of a pen. I could be wrong, and if the Dow makes a new low at 1100, I would throw in the towel and say that I had been wrong. But, for the moment, as a hardcore Technical Analyst, I have no choice but to follow my instinct which says that this market has more to go on the upside.
The one group that I like most is robots. I think robotics will be the greatest growth industry in the world and someday the whole technology and computer industries will be minor sub- sections of robotics. The greatest robot company investment in the world is now Fanuc, a Jap- anese company, and I am horrified that so few Americans know it. The Dines Letter first recommended it at 13, and sold it at 40, and is now waiting for another drop before we go back in. Meanwhile, other robotic stocks are depressed and ready to be bought right now on weak- ness, including Fared, Mobot, and Prab. You will notice that in the Dines Statistical Service sec- tion we have a Dines Robotics Average, a chart which we publish, from time to time. Notice that I am buying on Fundamentals, before their charts have given buy signals, so I use Fun- damentals and Technical Analysis, like two beams of radar, and I am most interested when they intersect.
On page 8 is a write-up on the International Capital and Technology Corporation, which I sug- gest that you read. Their most interesting asset is DataBase, which dominates the telecom- munications industry in Hong Kong. DataBase is the biggest direct mail marketer, and the only telephone-based direct marketing company in a city where local telephone service is free! They are also the main trade fair company with the People’s Republic of China, and might well wind up being China’s main telecommunications outlet to the world. Furthermore, they have just de- veloped on-line communications with the American giant TRW Corporation, so that somebody who wishes to use a credit card in Hong Kong can have it checked immediately in real-time through TRW’s data banks in the United States. The stock (ICTC) is now selling for around $2 l/2, and this is a nice one to put away for a few years on a long-term basis. The stock is in an Uptrend, and has a rising 30-week moving average.
Please turn to page 5 of The Dines Letter.
Instead of my going through the long list of commodities, I thought I would just bring this list to you, and let you look it up inasmuch as there have been no changes in any of these positions. However, I do have a few comments: If you turn to page 6 you will see a chart of cotton futures and our track record of predictions. We have been bullish on cotton since October 1982. The Dines Letter does not trade commodities short-term, instead believing that it is the long and intermediate positions that really generate the big profits.
The only other commodity to which I wish to call your attention is sugar. Nearly everybody is bearish on sugar, and it is now plunging. However, shrewd people notice that historically, sugar is now down to the areas from which previous bull markets have evolved, and we, therefore, would begin to accumulate long-term positions in sugar. But we would not buy the com- modity. The smart way to buy sugar is to buy distant call options, which are now deeply de- pressed. This is a wonderful way to play the commodity markets without fear of unlimited losses and margin calls, inasmuch as your maximum risk is the amount you place in the call option itself.
MTA Journal/November 1984 39
Let us now discuss the precious metals, and we will start on page 3, at the bottom of which you will see a chart of London Gold. Our sell signal last June is still intact, and we see no rea- son to disturb short positions as long as Downtrendline (D) is intact. If there is a rise above $400, above the March, 1984, highs, we would certainly have to reevaluate the situation, but for the moment, Technical Analysis says not yet.
Please turn to page 7 of your Dines Letter where you will find a Point and Figure Chart of plat- inum futures, and again the vicious Downtrend can be seen. Remembering the Dines Wolfpack Theory, gold, silver, platinum, palladium, osmium, and all the other precious metals, will tend to move together. In view of such ferocious Downtrends, we think that you would be better off getting over 10 percent from Treasury Paper than in a declining precious metals market.
Assumptions are the primary cause of losses in the stock market, and it would be a mistake to assume that just because gold bullion put options are in an Uptrend, as you can see on page 7, therefore all gold stocks are going to have to drop.
If you turn to page 4 there are charts of the Dines Gold Stock Average or DIGSA and the Dines Silver Stock Average or DISSA, along with their relative strengths and moving averages. There are many fine Technicians in this group, and you can certainly interpret these figures your- selves, but until their 30-week averages move up, and until Downtrendline (D) is actually pen- etrated, we again would shun the precious metal shares. Gold mining shares have been rising since November, 1983, and they look tired to us. However, we do have two gold stocks on List No. 2 on page 15. They are Lacana and Minerals Engineering, both of which are held at sub- stantial profits. Rich or poor, it’s good to have a lot of profits -- and you can quote me on that. For some reason these two stocks are leading the way. However, if we do turn bullish on golds soon, the stocks I would look to buy would definitely include Lac Minerals and Agnico-Eagle in Canada because of their excellent Fundamentals.
Please look in your press kit for the biographical sketch of me. In it you will find details of my long struggle for a gold standard in this country, how I founded the Honest Money Movement in 1960, basing it on a theory of “Bullionism,” or, in other words, a gold standard. Someday, sooner or later, there will be a gold standard at much higher prices than today’s levels, and for very long-term holders, that is the way to bet. Again, I am running short of time, and you can read this on your own. If you would like to know more about my struggle with gold, then obtain a copy of my second book, The invisible Crash, which warned that the 1970s would feature a crash concealed by what I called the “bloating effects of the lie of inflation.” In other words, the Dow is not that much higher than it was in 1966, but, adjusted for inflation, it is much lower. In that book I predicted such shocking things as bank failures, which were unheard of in the 1960s and nobody believed that an American bank would ever fail; just this week I note that regulators closed banks in Wyoming, Minnesota, and Texas, for a total of 25 failures of fed- erally insured banks so far this year. Again, I have a copy of this book with me, and you are free to examine it. I am also donating this copy to the MTA.
So much for the nearer-term negative outlook for gold. As for the long-term, I am convinced that there will be a gold standard in the United States someday, and as “the original goldbug” I have fought for it long and hard, at my own personal expense. Today there are many people recommending gold. Having started the battle, at the “front lines,” I am delighted to be relieved and to turn the good fight over to younger and more energetic people. However, I do have a few comments in that regard. On a number of occasions in my long odyssey I felt like giving up, like abandoning the fight for a gold standard from which I am certain that my country would benefit. Several times The Dines Letter, which bore the brunt of delivering that message, ob- viously went through periods, especially during gold’s unpopularity, when it barely survived. You people sitting here comfortably can’t image what it was like being a Technical Analyst, and, worse, actually recommending gold, and I can tell many stories of those days. But there were times when I had to add more capital to The Dines Letter to keep it from going under. Instead
MTA Journal/November 1984 40

of taking care of myself I decided to keep alive what was then the most visible pro-gold voice. Unfortunately, when I put money into the company, I frequently had to sell something I valued: one time to meet a payroll and meet other expenses, I sold my numismatic gold coin collection, when gold was still down at $35 an ounce. I don’t need to tell you how many times that would have increased in value had I been able to hold it until today Please do not, whatever you do, give me sympathy for this. If I had it to do all over again, I would do it again. Although, admit- tedly my enthusiasm would have been dampened had I known how little impact my life’s work for a gold standard would have, in that regard. Perhaps the future will see things in a different light, but society is shrewd enough to postpone recognition until after a person is gone -- be- cause it’s cheaper that way. What I want to show rather is the will power that is sometimes required for Technical Analysts. Above all, follow your instincts, and what you know is true, de- spite peer pressure. That is an important lesson!
I believe that all investors should have a few gold coins handy just in case of a crisis, and for small quantity purchasers like this, I definitely recommend bullion coins such as the South Af- rican Kruggerand or the Canadian Maple Leaf, both of which would be very handy in the un- likely event of some kind of national financial or political crisis, because unlike ingots they do not need to undergo elaborate testing procedures when you want to sell them. After all, nobody has counterfeited gold. So far this week. There is no risk in these coins other than the actual fluctuations of gold itself, and since these are to be held as permanent “core holdings” they can be safely purchased and put away permanently.
For those who wish larger quantities of gold bullion, then bars or certificates are the way to go, although one must consider the loss of income, and costs of storage and insurance. Person- ally, I have always recommended that you avoid letting anyone else hold your gold for you, as doing so tends to attract “negative elements.” If at all possible, always take possession of the gold you purchase; if you cannot, then perhaps gold mining shares might be more convenient.
While gold bullion will fluctuate with the price of gold, mining stocks move depending on how much the market anticipates that gold bullion will move, so the two areas can move in different cycles. The main advantage of gold mining shares is that they give you a regular income, not to mention possible capital gains. The very high dividends in the South African gold mining shares are ideal for Independent Retirement Accounts (IRA) and Keogh plans because of their exceptionally high income. Those who do not wish to invest in South Africa may choose from gold mines in other countries, but these typically have far lower yields because the political risk is deemed lower.
Aside from volatility, evaluating each gold mining share is risky because the truth is that the only thing you can be certain of in a gold mine is that there is less gold than last year. Therefore, for most investors, buying a gold mutual fund makes more sense than attempting to dabble in individual shares.
Continuing along the spectrum from the most conservative purchase, you can, of course, take much more aggressive positions, such as buying gold shares on margin, call and put options, or gold or silver futures. I am adamantly against the use of margin on gold shares as I know from long experience that they tend to develop margin calls right at Bottoms, whereas futures are simply too wild for most investors. The Dines Letter gives advice on them, but we warn people of the grave dangers involved in commodity speculations, although some people are temperamentally suited for precisely such markets. Frankly, the smartest way to invest in these risky markets is with put and call options, because, and this is very important, you cannot lose more than the amount you risk, whereas with margin, and especially with commodity gold futures, you can lose infinitely more than you invest.
Keeping those parameters in mind, our opinion on the precious metals is that we are facing an additional period of lackluster markets, and we would, therefore, avoid them.
MTA Journal/November 1984 41

I would like to relate here how I knew that gold would have such a phenomenal advance from $35 and silver from 92 l/2 cents where I first recommended them back in 1960. I hope it can be of value to you. At that time I was a young Junior Security Analyst on Wall Street, and it had already been held against me that I was suspected of having looked at charts occasionally. During the 1960 bear market, I noticed that the very few shares that moved up during the crash in the spring of that year were gold mining shares, especially Dome, Homestake and ASA. This caught my eye, inasmuch as the hostility towards gold mining shares was so intense that it’s impossible for me to describe it to this present audience. These early experiences, first of all, prompted me to go back and check the history of gold mining shares, and I noticed that they had gone opposite to the general market direction on a number of previous occasions. I, there- fore, formulated one of my early rules and that is The Dines Rule of Gold Contracyclicality, or DIRGS. Furthermore, the hostility against gold shares was so intense that it was an eye-open- ing experience to me in terms of what Humphrey Neil1 then called his Theory of Contrary Opin- ion. I communicated with him at the time on this subject, and we ended in disagreement, because his theory merely questioned adamant public opinion, whereas what I call the Dines Rule of Positive Negativism (DPN) says affirmatively that you should “go the other way.”
At this point I shifted my study of gold from Technical Analysis to Fundamental Analysis, and when I went over the gold file at the brokerage research stacks I was shocked and horrified that there was no folder on gold shares! In other words, it was considered so improbable that these gold shares would ever rise, that our research department at A. M. Kidder simply did not have a gold file! If that isn’t a Technical Indicator flashing a great buy signal, it’s hard to know of one better. In any event, I waded through all kinds of books on gold, which were difficult enough to obtain, and once I began to understand the dimensions of the gold crisis, the chart action became perfectly logical and it dawned on me that I was on to something very big. I knew that a gold crisis would endanger my country in the long run, but I also knew that if I spoke out I would be called names and that it would be a hard road to hoe. For better or for worse, I chose the road of publicizing my findings, and it brought down on my head many epithets of “gloom and doomer” and a “goldbug” which I, in turn, defiantly changed from a curse word to “the original goldbug” and wore it as a badge of honor. But I could not allow peer pressure to deflect me from my clear knowledge of the Technical and Fundamental factors suggesting that gold prices would rise despite sworn protestations to the contrary by everyone in the United States government from the President on down. That is a heady realization for a young man just starting out on Wall Street, but I determined to start a gold movement in this country, to find some politicians who would listen to me, and to get involved with a struggle for a gold stan- dard. I was full of idealistic statements, such as “one man plus the truth is an army” In my sunset years I realize that “one man plus the truth is simply one man plus the truth,” because after a quarter-century I see that my struggle for a gold standard has come to naught. We will have a gold standard some day, but it will take a crash to get the attention of the people running this country, probably early in the next century. It has been the bedrock policy ofThe Dines Let- ter that only a gold standard would ever force politicians to balance the United States budget without excuses. I called the gold-hating Keynesians “quacks” throughout the 1970s when they were at the height of their power, an accusation that turned out to have been true. After the ship has been sunk, everyone knows how it might have been saved.
I struggled for years trying to figure out how to express my gold ideas simply and briefly in order to convey their essence in the few minutes during which I had access to the public via the press. I was the first to decipher and popularize the idea, that it was only the excess of paper money creation that was the source of inflation, and I was thrilled when this knowledge was picked up and radiated throughout the entire financial newsletter industry
In my effort to promulgate the news about gold I naturally chose the newsletter industry, since the establishment press would publish only occasional articles on the subject. My first job was to convince Sam Coslow of indicator Digest -- and to his credit he picked it up immediately and became the second strong newsletter pushing a gold standard in 1961. All the subsequent
MTA Journal/November 1984 42
newsletters who recommended gold that came along, and who asked The Dines Letter for as- sistance, we gave what we could. I am still very supportive of those newsletters because I know how much guff they have to take to stand up and demand an honest currency in public, As a result, the financial newsletter industry is loaded with pro-gold advocates, and I feel at least that my quarter-century has been spent doing something that contributed to society. And, it is yet another reason why I’m so very proud of the newsletter industry, and why I invariably lash out at anyone who makes a habit of attacking newsletters and why I stick up for Joe Granville. Only those who run a newsletter know how difficult it is to make ends meet, aside from the vagaries of the marketplace, and how they don’t need irresponsible commentators who like to swing at newsletters from their smug positions. In all the years of writing my newsletter, I have never missed a single issue, even though one time it was written from a hospital bed in the middle of a catastrophic automobile accident that left me within a quarter of an inch of my life. I never even mentioned in The Dines Letter that I had dictated it from a hospital bed because I needed the money at the time.
The one thing I most remember about those early gold years was that I was basically alone, that I had no one to talk to about gold, or about Technical Analysis for that matter. I didn’t rec- ognize it as loneliness at the time, thinking more in terms of society’s unsupportiveness, and it was not until many years later that I realized that there were other people who were working along my lines but who simply were not reported by the press. Thus, I only had the appearance of being alone. Technicians told me that they also had had intense feelings of loneliness at the time. When you make a basic market decision it is important to have this feeling of loneliness, and that is one of the lessons I would like to leave with you today. Remember that eagles never flock. Having been alone, frankly, it’s really nice having company after having lived on a desert island, so I love being amongst Technicians. That is why I have always warmly welcomed new newsletters, encouraging and helping newcomers whenever possible. That is why I can count as a friend just about every financial newsletter in the business, and why I am deep-down proud to say I don’t have a single enemy in the newsletter business. I have been consistently supportive of young blood, and I’m proud to say that I have never put down another newsletter, and that’s over a quarter-century.
If you are just starting out in Technical Analysis, I hope what I have written over the years can be of some encouragement to you, if you can find it and have the time to read it. If you are not yet at the stage where your trades are developing big profits, but instead you are just basically breaking even, remember that a bird in the bush is better than one overhead. Also remember that George Orwell said that at age 50 every man has the face he deserves. I say that at 50 we all have the portfolios we deserve, so begin planning now.
Nobody can say for certain who, fifty years from now, will be looked back on with awe, and perhaps even reverentially -- as with Charles Henry Dow fifty years ago. But it won’t matter to whichever one of us it might be because we didn’t get the recognition when we really needed it. Therefore, I urge you to band together firmly, and with mutual supportiveness to fight the market rather than each other. Never view other newsletters as competition, because each of these fabulous individualists caters to their own special audiences, and there is room for every- body. I predict that we represent the early phase of great growth in the long-term development of specialized publications and communications. This isn’t my farewell speech or anything, but I’ve been in this business for going on three decades, and how much time can I have left? No- body is here forever, are they, and one thing I do know is that I probably don’t have anywhere near as much time as those who are just starting out. So I want to leave you with as much as possible. Above all, I want to leave behind me a capacity for moral outrage. I want the financial newsletter industry to represent the last angry segment of the press, publicly outraged by eco- nomic malfeasors who escape unscathed by the regular press.
Remember one more thing. Our speakers in the next few days are guests on the Earth. Tem- porary ones. Nobody has to revere them, but if you ever will, please revere them as much while
MTA Journal/November 1984 43

they’re alive as you will after they’re gone. Honor the founders of your life’s profession now, not later, when they will not know it. I now wish I had spent more time with Schaefer, Ham Bolton, and many other great men in this business. I spoke before the so-called “New York Society of Technical Analysts” in 1962, and I have no idea what happened to them. I spoke before an- other group in 1966, my Alzheimer’s prevents my remembering their name. So I am thrilled to see this Technical group really last and I’d like to personally give credit to everyone who ever contributed to it, and to thank them. I wish I could have created a lasting Technical Society, and I’m glad you did.
My final tip to young chartists is to remember what Yogi Berra once said: “You can observe a lot by watching.”
As your keynote speaker, I feel very strongly that the man does not honor the award, but that the award honors the man. I hope I have done that today and I thank you and I love you.
FOOTNOTES
*When Schaefer flashed his Major sell signal in 1966, he advocated 100 percent investment in Treasury Bills, but I finally convinced him by the early 1970’s to get into gold, which he finally did shortly after.
MTA Journal/November 1984 44

BIOGRAPHY
James Dines is author of The Dines Letter, one of the oldest stock market newsletters of its type. In addition, he is author of two books, Technical Analysis and The invisible Crash. The speech reprinted here, however, provides a more complete biography of Mr. Dines.
MTA Journal/November 1984 45

This page left intentionally blank for notes, doodling, or writing articles and comments for the MTA Journal.
MTA Journal/November 1984 46
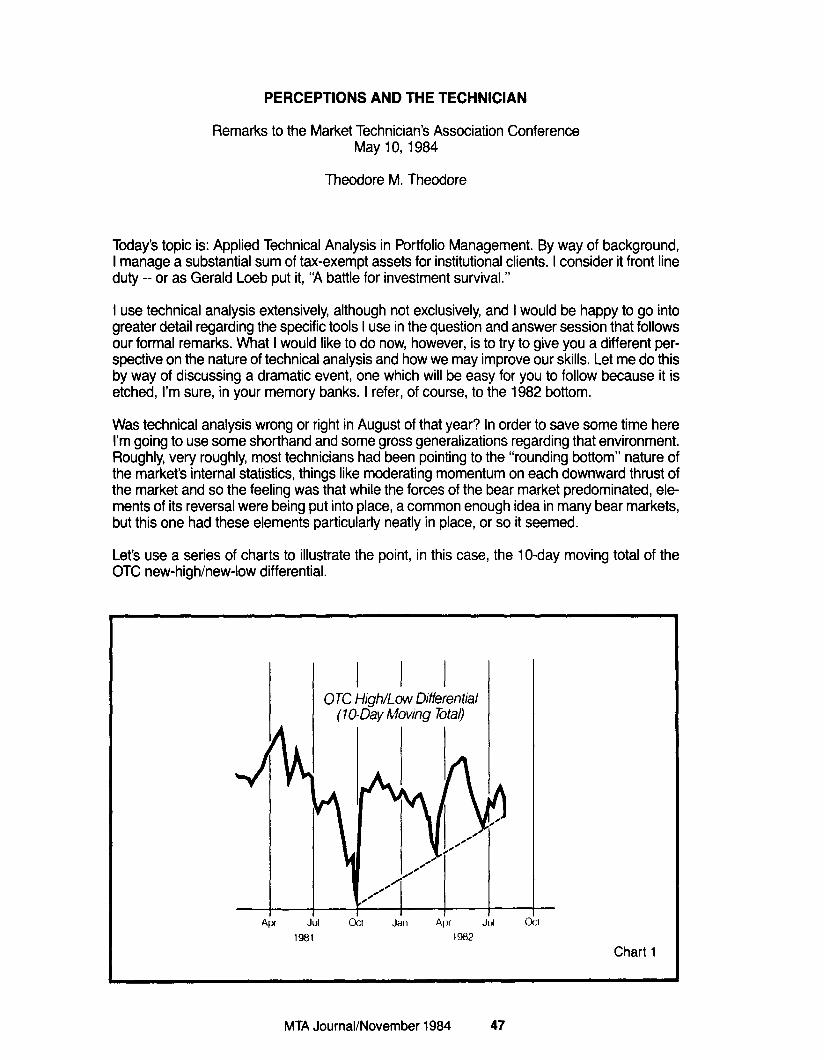
PERCEPTIONS AND THE TECHNICIAN
Remarks to the Market Technician’s Association Conference May 10, 1984
Theodore M. Theodore
Today’s topic is: Applied Technical Analysis in Portfolio Management. By way of background, I manage a substantial sum of tax-exempt assets for institutional clients. I consider it front line duty -- or as Gerald Loeb put it, “A battle for investment survival.”
I use technical analysis extensively, although not exclusively, and I would be happy to go into greater detail regarding the specific tools I use in the question and answer session that follows our formal remarks. What I would like to do now, however, is to try to give you a different per- spective on the nature of technical analysis and how we may improve our skills. Let me do this by way of discussing a dramatic event, one which will be easy for you to follow because it is etched, I’m sure, in your memory banks. I refer, of course, to the 1982 bottom.
Was technical analysis wrong or right in August of that year? In order to save some time here I’m going to use some shorthand and some gross generalizations regarding that environment. Roughly, very roughly, most technicians had been pointing to the “rounding bottom” nature of the market’s internal statistics, things like moderating momentum on each downward thrust of the market and so the feeling was that while the forces of the bear market predominated, ele- ments of its reversal were being put into place, a common enough idea in many bear markets, but this one had these elements particularly neatly in place, or so it seemed.
Let’s use a series of charts to illustrate the point, in this case, the lo-day moving total of the OTC new-high/new-low differential.
I I I OTC High/Low Differential
(1 O-Day Moving Total)
ocl Jan Al ,I Jill ocl
19a2
Chart 1
MTA Journal/November 1984 47
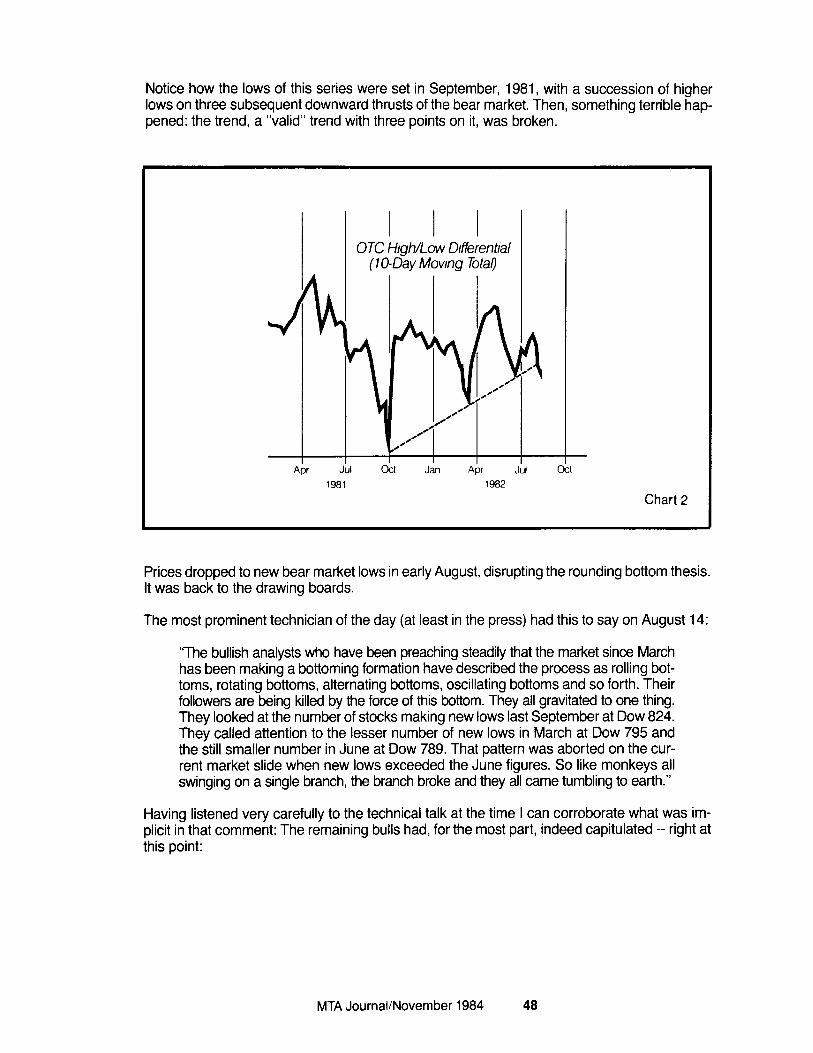
Notice how the lows of this series were set in September, 1981, with a succession of higher lows on three subsequent downward thrusts of the bear market. Then, something terrible hap- pened: the trend, a “valid” trend with three points on it, was broken.
0 TC High/Low Differential (lo-Day Moving Total)
Chart 2
Prices dropped to new bear market lows in early August, disrupting the rounding bottom thesis. It was back to the drawing boards.
The most prominent technician of the day (at least in the press) had this to say on August 14:
“The bullish analysts who have been preaching steadily that the market since March has been making a bottoming formation have described the process as rolling bot- toms, rotating bottoms, alternating bottoms, oscillating bottoms and so forth. Their followers are being killed by the force of this bottom. They all gravitated to one thing. They looked at the number of stocks making new lows last September at Dow 824. They called attention to the lesser number of new lows in March at Dow 795 and the still smaller number in June at Dow 789. That pattern was aborted on the cur- rent market slide when new lows exceeded the June figures. So like monkeys all swinging on a single branch, the branch broke and they all came tumbling to earth.”
Having listened very carefully to the technical talk at the time I can corroborate what was im- plicit in that comment: The remaining bulls had, for the most part, indeed capitulated -- right at this point:
MTA Journal/November 1984 48

Jul act Jan Apr Jd
Chart 3
As a money manager, I never miss a chance to tell my clients that this business is a matter of discipline: You hone your tools and stick by them. In this case, however, something more than discipline was obviously needed.
In my opinion, the missing element relates to “perception,” and here I refer to the faculty of “knowing” something by means of the mind. I believe that if we can widen our perceptions, we’ll have a dramatically better chance of understanding a problem. On one level, the logical, “thinking” level, we can force ourselves to think more as a generalist would, as opposed to how an “expert” would. An expert thinks “vertically.” He goes from Point “A’ in the outline to Point “B” then to Point “C” and so on. He depends heavily on rational logic. For example, an expert in the numbers on the economy (an econometrician) would usually predict automobile sales by observing that these sales are related to changes in consumer income, interest rates, con- fidence and the like. This is deductive reasoning.
A generalist thinker, on the other hand, would most likely use induction as his form of reason- ing. This kind of thinking has been labeled “lateral” thinking or “new think.” It depends heavily on observation, not postulation. In the automotive forecast, for example, perhaps the best guess as to next months’s sales relates to the fact that sales have been “trending” up, for example, for six of the last seven months.
Technicians, almost by nature, fall into this inductive or empirical school. Here’s where all those disciplines talked about earlier come into play. It’s no easy feat to characterize, for example, the “trend” of automobile sales let alone a forecast for next month. In fact, the state of the art of trend identification is being pushed forward almost at the speed of light.
By and large, most of us who use technical analysis are increasingly adept at creating new oscillators, new sentiment indicators, new methods for recognizing patterns, new ways of spot- ting trends, reversals, undercuts, traps, pull-backs, false breakouts and on and on and on. Most of us have our own computers clanking away day and night - sifting, sifting - in a very disci- plined way.
MTA Journal/November 1984 49

My guess, however, is that we’ve almost become too “expert.” After all, we’re supposed to be more like generalists, employing a lot of inductive reasoning. Maybe our computers convey a false sense of precision.
The most famous user of induction was, of course, Sherlock Holmes. The clue, I think, to get- ting us back on track is to recall Holmes’ cry: “Aha! Watson!” Well, what was it that made our sleuth so exclaim? It was, I submit, the moment of inspiration or creativity when all of the ob- served data or events fell into place or into a pattern which then locked our man onto his quarry
Think back to August, 1982. The “internal” rising trendline was broken: the former bulls were beaten back. What was the “Aha!” then? Simply, and in retrospect, it’s usually elegantly simple, the bulls had finally been hooked, tipping the scale to the maximum moment of bearishness. Throw onto this pile the “sky is falling” reportage in that weekend’s newspapers and you had spontaneous combustion -- actually explosion.
And looking back, again, the basic pattern of improving market internals really had not been broken. Trendlines, perhaps drawn too precisely and examined too closely, had broken but the basic pattern held. Still, many had been hooked into giving up their bullishness almost at the bottom. Things like that have happened to all of us as well. It happens all too easily. --Why?- - Well, it has mostly to do with physiology. For reasons best understood by anthropologists and neurologists, the brains two hemispheres tend to each reason radically differently from the other.
Where the left-brain is intellectual, the right-brain is intuitive. Where the left is rational, the right is emotional. The left is sequential, the right is simultaneous. Left is linguistic, particular and categorical, right is spatial, holistic and symbolic. Finally, the left hemisphere reasons deduc- tively while the right hemisphere reasons inductively. The brain researchers have convincing evidence that in each person, one of the hemispheres tends to dominate. It is no surprise then, that this notion of brain modality can be seen as a key influence, even helping to explain why people choose their occupations.
Left-brain oriented people (according to Ned Herrman’s G. E. Study) are lawyers, bookkeep- ers, administrators, doctors, researchers and tax-experts. Those who are right-brain oriented are often artists, entrepreneurs, architects, clowns, dancers and top executives.
By count, we live in a world where the vast majority are left-brain dominated. And even if we aren’t left-brain oriented, the world assumes we are or demands we operate along its lines. But notice that I have been using the words “oriented” and “dom- inated.” Everyone obviously has the capability of using both of his brain hemispheres. And as I’ve mentioned, as technicians, there are important benefits in being able to think with the right hemisphere, particularly with it’s spatial and inductive capabilities.
Often, there are blocks to right-brain types of perceptions. We don’t “see” well enough. As an example, let me read you this next slide:
FINISHED FILES ARE THE RE- SULT OF YEARS OF SCIENTIF- IC STUDY COMBINED WITH THE EXPERIENCE OF MANY YEARS.
MTA Journal/November 1984 50

Now, count to yourself the number of “F’s”
FINISHED FILES ARE THE RE- SULT OF YEARS OF SCIENTIF- IC STUDY COMBINED WITH THE EXPERIENCE OF MANY YEARS.
Only 15 percent of most groups count six, most only count three. Perhaps your left brain was moving too fast, thinking about the meaning of the sentence, or its truth. Or, perhaps, your left brain thought of the F’s in “OF” as v’s, the linguistic way by which F’s are sounded.
One trick to shift your perception to your right-brain would be to read the sentence backwards. Remember, I asked you to count, or, really, see the F’s, not to comprehend or logically analyze the sentence, which the left-brain does incessantly.
Let me try another slide:
Chart 4
What is this pattern? Well:
MTA Journal/November 1984 51
.

Chart 5
It’s the “negative space” of the word “fly.” Looking at negative spaces is another trick which allows you to shift to the right hemisphere.
There are other tricks as well. My wife teaches art to young children. To demonstrate to them the-power of the right brain, she has them draw from models which she has turned upside down. That shift requires the brain to shift and see better. For example, when hands are drawn from a model that is in its normal position, the left-brain thinks of the hand in terms of its mechanical appliance function and usually dominates the drawing to make the hand squarish and stubby. But upside down, the left-brain does not “think” hand and the right-brain is free to see the true shape of the hands and its surroundings.
Let me summarize. We can gain new measures of technical insight just by knowing about the differences between induction and deduction. In addition, by studying the spatial and simul- taneous nature of information, we can see patterns which will make us say “Ahh, that’s it.” Many, many times just by looking for patterns, we’ll gain solutions to our problems, or at minimum, a new insight which helps move the solution along.
Now some bad news. While going from the left-brain mode to the right is relatively easy and, in a sense, liberalizing, going from right to left is hard work. When the two click together that is an “aha!” not just an “ahh.” It is the instantaneous application of the insight to the solution. Psychiatrists have called this a “peak” experience. I had one such experience in 1982. I saw the rising bottoms pattern in the market as we showed earlier. I saw the break in the trendline. But for me an “aha!” happened. I had planned to go on vacation the week of August 17 and wanted to have my accounts in order beforehand. But I was disturbed by this break in the trendline. Now, maybe it was the subconscious force of the deadline at work, but when I picked up the Saturday New York Times and saw the lead article which rounded up all the credit analysts to proclaim the end of the world, everything fell into place for me. The general rounding bottom pattern was still there, only its narrowly (left-brain) interpreted trendline had been broken. The market letter I referred to earlier and the New York Times article sealed it for me. At 9 A.M. on Monday I called in my remaining buy orders and had a very pleasant week, mostly falling asleep
MTA Journal/November 1984 52

on the beach. That Saturday night, with my salesman from Salomon Brothers, we cracked open a bottle of Dom Perignon.
How often does that happen? To any of us? Well, I’m afraid not often. If I had several hours I could talk to you about how brain researchers have observed the regular synchronizing of left and right-brain waves (the “clicking” or “aha!” phenomenon) among Eastern mystics! Those trained in these skills have an immediate apprehension of the whole-brained truths. They see the interrelatedness of everything. They have almost continuous creativity: the practical ap- plication of insights.
But do we have to travel to the Himalayas to time the market? My experience tells me we can do pretty well even with limited whole-brain skills. Particularly those of us who work hard at trying to remove blocks to perceptions. Combined with a solid set of left-brain disciplines, these new modes, or shifts in perception, should increasingly prove rewarding.
Many of the examples I’ve presented here can be found in a book written by my late friend, Ben Goodspeed. The book is entitled the “Dow” Jones Averages. “Dow” being spelled FA-0, the name of an ancient Eastern philosophy. One of the stories in the book goes like this: “Several years ago an agent who monitored Russian newspapers at the CIA noticed an anomaly: A small town’s soccer team, which was the perennial last-place team, suddenly be- gan winning their games by lopsided scores. Intrigued, the reader persuaded the agency to fly a U-2 plane over the town to take a detailed photographic mapping. These pictures revealed that a well-camouflaged military installation had been built in the town. Though the Russians went out of their way to hide the plant, they didn’t realize that the specialists imported to man- age the facilities would improve the town’s soccer team. This unintended message proved to be a clue to the new reality.”
Now, here’s the good news. Only a well-informed, hard working chap, using all the disciplines at his command could have put himself in the path of such a finding and made the practical connection it led to.
I hope that you will increasingly experience the whole-brained high of “aha!”
MTA Journal/November 1984 53

BIOGRAPHY
Ted M. Theodore joined Morgan Stanley in 1980 from City Bank, where he was Vice-President and Senior Portfolio Manager in the Pension Department. At City Bank he was a member of the Investment Policy Committee and Director of Equity Strategy. Prior to joining City Bank, he was a Pension Fund Manager and then the Portfolio Strategist for Baker, Weeks. Ted is a Char- tered Financial Analyst (CFA) and received both a B.A. in Economics and an MBA in Finance from the University of Michigan. He became a Vice-President of Morgan Stanley Asset Man- agement in 1980, a Principal in 1982, and a Director in 1983.
MTA Journal/November 1984 54

This page left intentionally blank for notes, doodling, or writing articles and comments for the MTA Journal.
MTA Journal/November 1984 55

This page left intentionally blank for notes, doodling, or writing articles and comments for the MTA Journal.
MTA Journal/November 1984 56