journal of technical analysis (jota). issue 10 (1981, february)
TRANSCRIPT

LIBRARY MARKET TECHNICIANS ASSN.
70 Pine St, New Y&k. N. Y. 10005
Market Technicians Association
JOURNAL Issue 10 February 1981

MARKET TECHNICIANS ASSOCIATION JOURNAL
Issue 10
February 1981
i
Published by : Market Technicians Association 70 Pine Street
New York, New York 10005
Copyright 1981 by Market Technicians Association
-l-

-
i
intentionally blank
-2-

Market Technicians Association Journal
Editor : Anthony W. Tabell Delafield , Harvey, Tabell 909 State Road Princeton, New Jersey 08540
Associate Editor : Shary Anaya D elafield , Harvey , T abell
i
Thanks to the following MTA members and subscribers for their part in the creation of this issue:
Richard W. Arms Abraham W. Cohen Frederic H. Dickson Ann C. Fahnestock Steven C. Leuthold William P. Livesey Arthur A. Merrill Jack Y . Narayan Richard C. Orr Kenneth G. Tower
-3-

EDITORIAL
-
THE MTA JOURNAL
INDICATOR SYNERGY Richard C . Orr , Ph.D. Jack Y . Narayan , Ph. D .
13
The familiar “model, ” or combination of market indicators, is a predictive technique that has been utilized by many technicians. It has long been theorized that this combination produces a syn- ergistic effect, i.e. , the combination produces better results than the best of the individual indicators. The authors in this article demonstrate mathematically why this should be the case, drawing on the actual results obtained from two widely-used indicators. The appendix to the article provides a non-technical discussion of the Chi-squared technique of assessing significance. This technique is often of great value in testing stock market indicators.
Dick Orr , an MTA member, is an associate professor of mathematics at the State University of New York, Oswego, and a consultant to Pershing & Co. His co-author, Jack Narayan, is also a S .U.N .Y. professor.
SIGNIFICANCE : WHAT IS IT?? Arthur A. Merrill
Arthur Merrill is a charter member of the Market Technicians Association and was the 1977: winner of its Award for Distin- guished Contribution to Technical Analysis. One of his fortes for many years has been the advocacy of standards of statis- tical significance, and his ability to explain the derivation of those standards in easily understandable terms. This article is one more piece of evidence of that ability.
THE BEARISH SENTIMENT INDEX UPDATED Abraham W. Cohen
Abraham W. Cohen, a long-time MTA member, is the originator and foremost interpretor of the Investment Advisory Services Sentiment Indices. In this article he updates the bearish senti- ment indicator and discusses recent work that has been done by himself and others in the use of the indicator.
21
25
-
-4-

Issue No, 10 February, 1981
THE STOCK MARKET AS INFLATION HEDGE -- MYTH OR REALITY 29 Steven C. Leuthold
Analysts have for years debated the pros and cons of the stock market as an inflation hedge. Steven C . .Leuthold, author of the recently-published book The Myths of Inflation and Investing, from which this aritcle is excerpted and updated, comes down firmly in the opposing camp. Drawing on 109 years of stock- market history, Leuthold argues that both rapid inflation and rapid deflation tend to produce poor stock markets, and that the market does best during periods of price stability.
Leuthold, an MTA member, is vice president and director of Funds, Incorporated, and a special consultant to Piper, Jaffray, & Hopwood. He is also the author of Index Funds The Risks and Pitfalls, the definitive critique of the indexing concept.
OVERBOUGHT CAN BE BULLISH Kenneth G. Tower
The lo-day advance-decline line is one of the most widely- followed of all technical indicators. It is conventionally interpreted as a simple oscillator with extremely low levels being bullish and high levels bearish.
i
Kenneth Tower, on the technical staff of Delafield, Harvey, Tabell, has done some extensive research which suggests that “overbought” conditions on this indicator, whatever they may mean for the short term, tend, paradoxically, to be bullish for the intermediate or longer term.
45
NEW DAILY TECHNICAL MARKET INDICATORS Frederic H. Dickson William P. Livesey
51
There are many manipulations of stock price data which are basically simple in concept but which would be impossible to undertake with- out the availability of computer data bases. A prime example of such a manipulation are breadth indices based on advances and/or declines over periods of longer than one day. Such an indicator, with a half- dozen years of its history, is explored in this article by Fred Dickson, a long-time MTA member, and William P . Livesey of CompuServe, Inc.

Index (Continued)
DOW VOLUME AT ALL LEVELS Richard W. Arms
65
Dick Arms of Greeley Securities is widely known to MTA members as the originator of the Short-term Trading Index. His research is, however, eclectic, as this article shows. In it he explores the significance of volume occurring at various price levels in point- ing out support and resistance zones.
INSTITUTIONAL FLOW OF FUNDS IN THE STOCK MARKET Ann C. Fahnestock
69
Much is made of “institutional dominance” in the stock market, but precious little work has been done on actually quantifying institutional flow of funds. Ann Fahnestock explores the 15- year history of purchases and sales by major institutions and suggests some relationships between this activity and market direction.
Miss Fahnestock has been a member of the Market Technicians Association from its early years and has served as secretary, editor of the Newsletter, and as a member of the Board of Governors.
i
Book Review
CRISIS INVESTING
75 Anthony W . Tabell
Douglas R. Casey Stratford Press
-
-6-

MARKET TECHNICIANS ASSOCIATION
MEMBERSHIP and SUBSCRIPTION INFORMATION
REGULAR MEMBERSHIP - $50 per year plus $10 one-time application fee.
Receives the Journal, the monthly MTA Newsletter, invitations to all meetings, voting member status and a discount on the Annual Seminar Fee. Eligibility requires that the emphasis of the applicant’s professional work involve technical analysis.
SUBSCRIBER STATUS - $50 per year plus $10 one-time application fee.
Receives the Journal and the MTA Newsletter, which contains shorter articles on technical analysis, and the subscriber receives special announcements of the MTA meetings open to The New York Society of Security Analysts and/or the public, plus a discount on the Annual Seminar Fee.
ANNUAL SUBSCRIPTION TO THE MTA JOURNAL - $35 per year.
SINGLE ISSUES OF THE MTA JOURNAL (including back issues)
i
are available for $15 to regular members or subscribers $15 to non-members and non-subscribers
The Market Technicians Association Journal is scheduled to be published three times each fiscal year, in approximately November, February, and May.
An Annual Seminar is held each spring.
Inquiries for Regular Membership or Subscriber Status should be directed to:
Fred R. Gruber, V.P. United Jersey Bank 210 Main Street Hackensack, New Jersey 07602
-7- -.

i
intentionally blank
-8-

Editorial
THERE HADN’T OUGHTA BE A LAW
This is a journal for market technicians. The time is February, 1981. Editorials are supposed to comment on subjects of current interest. Under this particular confluence of circumstances, whatever our preferences, we would be burying our heads in the sand were we to fill this space with an editorial comment which did not mention the name “Joseph Granville. (’ Accordingly, a few thoughts on the subject.
There will be, in this commentary, at least, no thunderous pronouncements. It was, apparently, such portentiousness that set the whole thing off in the first place. It is our view that, at this stage, calmness and circumspection should best be the order of the day, and this advice is gratuitously offered to Joe Granville, as well as to members of the MTA.
Reaction, so far, has been on various levels and is, of course, interesting. Disbelievers in technical analysis were incredulous that a pronouncement by a market technician could have the kind of effect that it did. Daniel Seligman in Fortune, a critic, but a normally urbane one, totally blew his cool. Granville, Seligman positively stated, had nothing whatever to do with what happened on January ‘7. The $40 billion of NYSE loss on that day was clearly due to the fact that the Secretary of the Treasury had held a press conference and said the sort of thing that Treasury Secretaries say at press conferences. This is the sort of mindset that would blame the Johnstown flood on a leaky toilet in A ltoona.
From technicians we spoke to, the response was mixed, and --- let’s be honest and admit it, fellows --- not without a twinge of jealousy. “The Roar of the Grease Paint and the Smell of the Crowd” is a powerful anodyne. Who among us, his proscriptions ignored by the idiots whom he must advise, does not secretly yearn for the day when pearls dropping
-9-

from his lips can swing capital markets $40 billion in one direction or another? It is a heady feeling, but, like most temptations, best put behind one.
Perhaps the most common post-January-7 comment, however, was some form of that fine old American panacea, “There oughta be a law. ” This is the one reaction which, in our view? .is just about totally wrong. There should be no law, or, if there is to be one, its drafting should be approached with the extremest of caution, and the full extent of its possible consequences rigorously examined. Those investors who plunk down their hard-earned cash to subscribe to Joe Granville’s service and who choose to act on recommendations in that service are, let it be remembered, deploying their own money. The attitude which says that people are too stupid to manage their own affairs and require some sort of Big Brother to tell them how to do it properly, is one which has gotten us into enough trouble in enough areas already. We are right to be wary of it.
i
Here, we think, is the subtle danger that confronts us as a result of the events of early January. For whatever reason --- Granville’s prior record, his efforts at publicity, or the tone in which his pre- dictions were couched --- the size of the resultant market swing was huge. What is worrisome is that size serving as an excuse for calling down on the heads of the profession those who would like to see research in general, and perhaps technical research in particular, more ordered and regulated by authorities outside the profession than is already the case. Such regulation, it seems to us, is dangerously likely to be carried on by people unsuited for the task and whose preparation is apt to consist of such exercises as reading Eugene Fama’s Ph.D. dis- sertation. If Joe Granville proves to be the catalyst for this sort of effort, it will be this sin, and this sin alone, that earns him the deserved opprobrium of the profession.
Other issues are, of course, raised. The second paragraph of the MTA Code of Ethics says:
“The analyst shall not make statements which he knows or has reason to believe are inaccurate or misleading. He shall, in particular, be careful to avoid leading his audience to believe that his technically-derived views of future stock price behavior reflect foreknowledge rather than estimates and projections sub- ject to re-examination and, as circumstances may dictate, to change. l1
-
-lO-
There will be no comment in this space as to whether or not the collected works of Joseph Granville meet or fail to meet this standard. It is assuredly not the function of the Journal to decide this issue, and, in any case, the MTA, as a professional organization, can enforce a code of ethics only upon its own members. Official wrestling with the question would be a suitable task only for a membership committee
which would have to pass on Granville’s application for membership, should he choose to make one.
It seems appropriate for the MTA, at this stage, only to reiterate
that Code of Ethics, redouble its effort to enforce it among the member- ship, and make sure that all activities under its sponsorship are appropriate for an organization which adheres to such a code. Efforts at a certification program, conducted by the profession itself, are already underway, and ‘these efforts are worthy of support. The MTA has, in this case, the opportunity to lead, not by condemnation, but by example. This is an opportunity which should be seized.
-ll-

intentionally blank
-1%

INDICATOR SYNERGY
RICHARD C. ORR, PH.D.
and
JACK Y. NARAYAN, PH.D.
The familiar “model, ” or combination of market indicators, is a predictive technique that has been utilized by many technicians. It has long been theorized that this combination produces a syner- gistic effect, i.e., the combination produces better results than the best of the individual indicators. The authors in this article demonstrate mathematically why this should be the case, drawing on the actual results obtained from two widely-used indicators. The appendix to the article provides a non-technical discussion of the Chi-squared technique of assessing significance. This technique is often of great value in testing stock market indicators.
i
Dick Orr, an MTA member, is an associate professor of mathematics at the State University of New York, Oswego, and a consultant to Pershing & Co. His co-author, Jack Narayan, is also a S. U.N. Y. professor.
INTRODUCTION
Market indicators measure a variety of disparate rhythms of the market such as breadth, momentum, cycles, trends, and sentiment. Market technicians generally use a combination of indicators from a number of these categories, rather than relying only on a single “favorite” indi- cator. Two approaches which immediately come to mind are the informal combination of indicators based upon the considerable experience of the technician (e.g. Stan Weinstein of The Professional Tape Reader) and the formal combination of indicators to obtain the “weight of the evidence” (e. g. Art Merrill of Technical Trends). This effort to maintain a balance between various categories of indicators is curcial. For example, momen- tum indicators all tend, roughly, to measure a common characteristic of the market, albeit in different ways. While there is an advantage to the
-13-
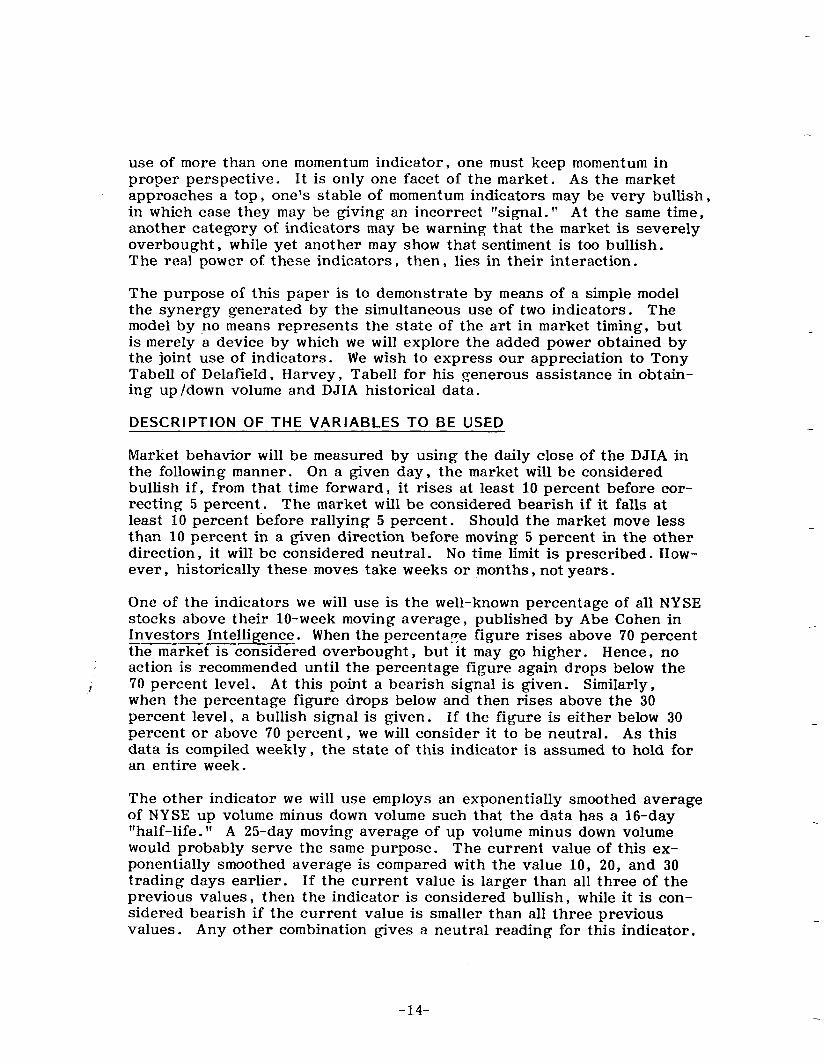
use of more than one momentum indicator, one must keep momentum in proper perspective. It is only one facet of the market. As the market approaches a top, one’s stable of momentum indicators may be very bullish, in which case they may be giving an incorrect “signal.” At the same time, another category of indicators may be warning that the market is severely overbought, while yet another may show that sentiment is too bullish. The real power of these indicators, then, lies in their interaction.
The purpose of this paper is to demonstrate by means of a simple model the synergy generated by the simultaneous use of two indicators. The model by no means represents the state of the art in market timing, but is merely a device by which we will explore the added power obtained by the joint use of indicators. We wish to express our appreciation to Tony Tabell of Delafield , Harvey, Tabell for his generous assistance in obtain- ing up /down volume and DJIA historical data.
DESCRIPTION OF THE VARIABLES TO BE USED
Market behavior will be measured by using the daily close of the DJIA in the following manner. On a given day, the market will be considered bullish if, from that time forward, it rises at least 10 percent before cor- recting 5 percent. The market will be considered bearish if it falls at least 10 percent before rallying 5 percent. Should the market move less than 10 percent in a given direction before moving 5 percent in the other direction, it will be considered neutral. No time limit is prescribed. How- ever, historically these moves take weeks or months, not years.
One of the indicators we will use is the well-known percentage of all NYSE stocks above their lo-week moving average, published by Abe Cohen in Investors Intelligence. When the percentaye figure rises above 70 percent the market is considered overbought, but it may go higher. Hence, no action is recommended until the percentage figure again drops below the
8 70 percent level. At this point a bearish signal is given. Similarly, when the percentage figure drops below and then rises above the 30 percent level, a bullish signal is given. If the figure is either below 30 percent or above 70 percent, we will consider it to be neutral. As this data is compiled weekly, the state of this indicator is assumed to hold for an entire week.
The other indicator we will use employs an exponentially smoothed average of NYSE up volume minus down volume such that the data has a 16-day “half-life. ” A 25-day moving average of up volume minus down volume would probably serve the same purpose. The current value of this ex- ponentially smoothed average is compared with the value 10, 20, and 30 trading days earlier. If the current value is larger than all three of the previous values, then the indicator is considered bullish, while it is con- sidered bearish if the current value is smaller than all three previous values. Any other combination gives a neutral reading for this indicator.
-14-

DESCRIPTION OF THE EXPERIMENT
As we have now characterized, on a daily basis,the state of each of the two indicators; as well as the state of the market, we are ready to formulate hypotheses and test them. Our testing procedure will involve the selec- tion of a random sample of 144 of the 3,000 trading days from April 22, 1968 through April 15, 1986. We are sampling without replacement which means that no day will be represented more than once in the sample. The sampling will be accomplished by the use of a table of random numbers.1 The date corresponding to each of these numbers will then be determined and the state of both indicators as well as the market will be recorded in tabular form. From this first table, we will create three contingency tables to measure the interaction of the indicators, both individually and jointly, against the market. We will then calculate the %” (Chi-squared) value for each contingency table. The significance of XL and its compu- tation are described in an appendix to this paper. Eeyond this, we hope to gain an insight into the reliability of these indicators individually and jointly by simply observing the distributions in the several tables. The states of the indicators and the market will be denoted as follows: U for a bullish state, N for a neutral state and D for a bearish state. In the case of the joint use of indicators, we will hypothesize that if both indica- tors are in state U , then the market should be in state U abnormally often. If both indicators are in state D, or if the net volume indicator is in state N while the NYSE percent indicator is in state U, then the market should be in state D a disproportionate percentage of the time. This dissimilarity takes into account the old adage that “stocks will fall of their own weight. *’ If the NYSE percentage has moved above 30 percent and net volume either remains neutral or falls to neutral, we would expect this to be bearish more often than not. We will further hypothesize that any combination of indicator states other than the three described above will tend to produce a market state of N.
RESULTS OF THE EXPERIMENT AND CONCLUSIONS i
.- The experiment produced the following results. listed next to the frequencies.
Net Vol. NYSE Market
D
D
D
N
N
N
U
U
U
D
N
U
D
N
U
D
N
U
D N
5 7
2 15
1 1
2 9
5 19
9 6
0 0
3 18
3 9
Our original hypotheses are
U
1
5
1
2
2
4
0
3
12
Hypothesis
D
N
N
N
N
D
N
N
U
-15-

The contingency tables produced by this table are:
i
Table 1
Market
D N U
Table 2
Market
DN U
Table 3
Market
m DN U __
L 3c = 7.3
= 27.7
For a detailed explanation of the calculation of x’ values the reader is reminded to see the appendix. The larger the value of x/i the more dependent the market state is on the state of the indicator(s) listed on the left of the table. In Table 1, a s value of 7.3 is not very signifi- cant, but the p- values for the other two tables are very significant. Beyond this analysis, however, the reader will immediately notice a dra- matic improvement in Table 3 of the ratio of good predictions (down the main diagonal) to the bad predictions (which are circled) when compared to Table 1 and Table 2. This technique shows real promise in its applica- tion to the formal combination of various market indicators. While we have restricted our attention to only two indicators, this technique may be generalized to handle combinations of a larger number of indicators. 2
-16-

FOOTNOTES
1 These tables are readily available. See, for example, the Handbook of Tables for Probability and Statistics, published by the Chemical Rubber Company.
2 The interested reader with a background in statistics should see Feinberg , The Analysis of Cross-Classified Categorical Date, M.I.T. Press.
i
-17-

APPENDIX
CALCULATION AND INTERPRETATION
OF
CONTINGENCY TABLES
We will use Table 3 from before as our model. This table together with all row sums and column sums should be displayed.
The entries in the table below the diagonal lines are the expected frequencies assuming that the joint indicators and the market are independent of one another. These are calculated by taking the appropriate row total times the appropriate column total and dividing by the grand total. For example, the third row, second column of the table has an observed frequency of 9 and an expected frequency of (24) (84) /144 = 14.0. The XL function for a contin- gency table is given by the formula
-18-

= (Observed - Expected) 2
each cell Expected
so the contribution of the cell we just considered to the total for 2
would be (9.0 - 14.0)2 = 1 *
x
14.0 . .
IL If we list in tabular form each of the nine cells’ contributions to we have
Market
N U
1.7 .4
2.2 1.5
1.8 9.8
= 27.7
Notice that the main diagonal contributes 20.0 of the total, and that in each case the observed frequency is higher than the expected frequency. In order to determine the significance of this, we must look up XL in a set of tables. To do this, we must calculate the number of degrees of freedom for this test, given by the formula
i Degrees of Freedom = (# of rows - 1) (# of columns - 1)
We therefore look up z- = 27.7 with ( 3- 1) ( 3-1) = 4 degrees of freedom and discover that this value is significant at the .Ol level. * The joint indi- cators are not independent of the market and, in fact, have abnormally high concentration along the main diagonal of the table.
*For a brief description of levels of significance, see Orr, The Timely Demise of the Random Walk, Journal, February, 1980.
-19-

intentionally blank
-2o-

SIGNIFICANCE: WHAT IS IT??
i
ARTHUR A. MERRILL Merrill Analysis Inc.
Arthur Merrill is a charter member of the Market Technicians Association and was the 1977 winner of its Award for Distin- guished Contribution to Techncial Analysis. One of his fortes for many years has been the advocacy of standards of statis- tical significance , and his ability to expZain the derivation of those standards in easily understandable terms. This article is one more piece of evidence of that ability.
The “witchcraft” appellation can be dispelled by the use of just two words: Significant Evidence.
The second word is easy. We all support our conclusions with evidence. But do we always check significance ? the suspicion of luck
Are the examples we cite sufficient to dispel ? As John Heywood put it in 1577, “One swallowe prouveth
not that summer is neare. ”
To check for significance, some knowledge of- statistics is needed. But don’t be alarmed; the problem may have an easy solution. Many of our conclusions are simple two-way: after this breakout. ”
“The price of this stock will probably be higher two weeks “The Dow will probably close higher next Friday. ” The
result is two way: Up-Down, or Right-Wrong. The statistician’s buzz word for this type is “binomial,” and tables giving the answers are quite easy to use.
The tables in this paper deal with the problem when the basic probabilities are about even money. The problem is more complicated if the odds are biased one way or the other; if, for example, we are forecasting a rise in an upward trend. There are methods, but we don’t discuss them here.
But suppose the odds are about even. lette red and black is another.
Matching coins is a good parallel. Rou- Serious workers who use evidence like to see
odds of 20-to-1 against simple luck before calling the results “probably signifi- cant . ” If the evidence shows loo-to-l, it’s called “significant;” 1000~to-1 is
-21-

called “highly significant. ” The first is called the “95% confidence level.” The second, the “99% confidence level, ” the third, the “99.9% confidence level. ‘I
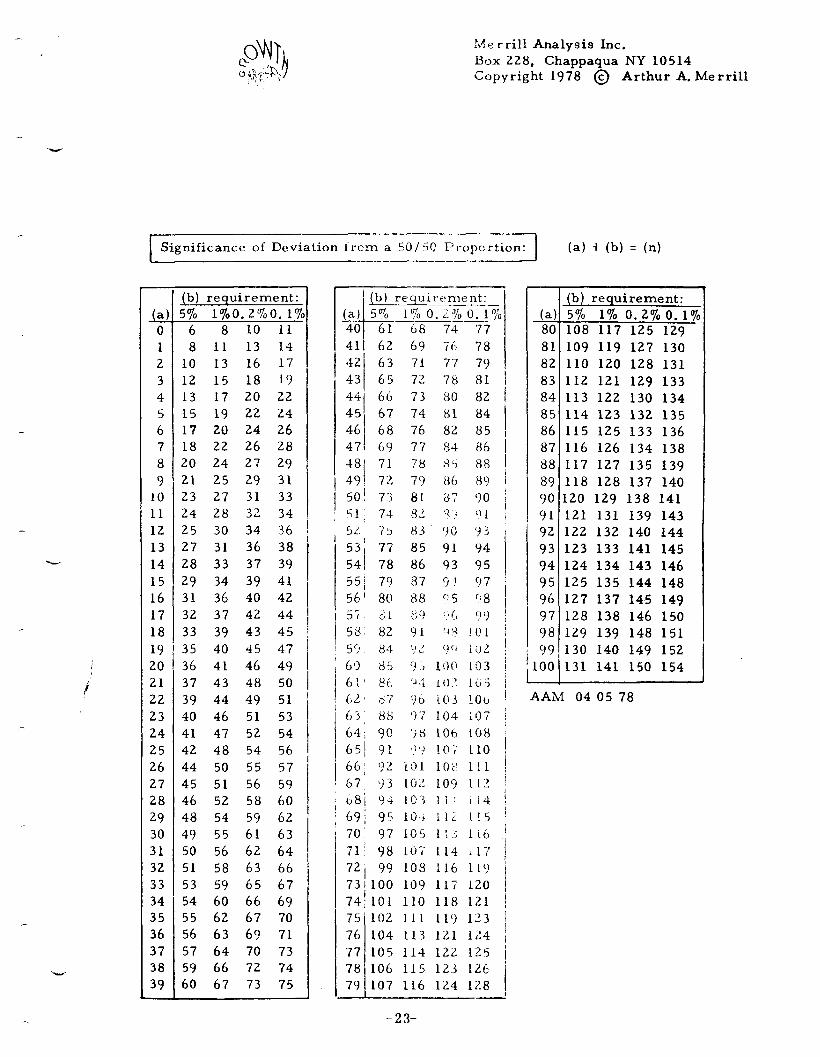
The 20-to-1 doesn’t mean a test with 20 successes and 1 failure. It is reached when a test has six successes and no failure, or eight successes and one fail- ure . You will see this when you use the following table. The loo-to-1 can be reached by a test with eight successes and no failures. The table gives the required ratios for various test sizes. It’s easy to use:
The Problem
In a situation with two solutions, with an expected 50/50 outcome (heads and tails, red and black in roulette, stock market rises and declines, etc. ) are the results of a test significantly different from 50/50?
Solution
Call the two outcomes (such as number of reds, number of blacks) (a) and (b) . Let (a) be the smaller of the two. Find this number in the left hand column of the tabulation. If (b) exceeds the corresponding number in the 5% column, the difference from 50/50 is probably significant; the odds of it happening by chance are one in twenty. If (b) exceeds the number in the 1% column, the difference can be considered significant ; the odds are one in a hundred. If (b) exceeds the numbers in the 0.2% (one in five hundred) or 0.1% (one in a thousand), the difference is highly significant. Note that the actual numbers must be used for (a) and (b) , not the percentages.
Example
In the last 83 years, on the trading day before the 4th of July holiday, the stock market went up 65 times and declined 18 times. Is this significant? On the day following the holiday, the market rose 50 times and declined 33 times. Significant ?
For the day before the holiday, (a) = 18 and (b) = 65. Find 18 in the left hand column; 65 far exceeds the 33, 39, 43, and 45 in the table, sothe record demon- strates a-highly significant bullish bias on that day.
For the day following the holiday, (a) = 33 and (b) = 50. Find 33 in the left hand column. The minimum requirement for (b) is 53; 50 falls short; no signifi- - cant bias is demonstrated.
Source
Some of the figures were developed from a 50% probability table by Russell Langley (in Practical Statistics Simply Explained, Dover 1971)) for which he used binomial tables. Some of the figures I calculated using a formula for Chi- squared with the Yates correction. This table was distributed at our 1978 seminar.
-22-
.‘\de rrill Analysis Inc.
Box 228, Chappaqua NY 10514 Copyright 1978 @ Arthur A. Merrill
-- Significance of Deviation frcm a SO/ 5(! Fropcrtion:
7 (a) + lb) = (n)
-
(a) 0 1 2
3
4
5
6
7
8
9 10 11
12
13
14
15
16
17
18
19 20 21
22
23
24
25
26
27
28
29
30
31
32
33
34
35
36
37
38
39 -
(b) requirement:
5% l%O. 2%0. 1% 6 8 10 11
8 11 13 14
10 13 16 17
12 15 18 19
13 17 20 22
15 19 22 24
17 20 24 26
18 22 26 28
20 24 27 29
21 25 29 31
23 27 31 33
24 28 32 34
25 30 34 36
27 31 36 38
28 33 37 39
29 34 39 41
31 36 40 42
32 37 42 44
33 39 43 45
35 40 45 47
36 41 46 49
37 43 48 50
39 44 49 51
40 46 51 53
41 47 52 54
42 48 54 56
44 50 55 57
45 51 56 59
46 52 58 60
48 54 59 62
49 55 61 63
50 56 62 64
51 58 63 66
53 59 65 67
54 60 66 69
55 62 67 70
56 63 69 71
57 64 70 73
59 66 72 74
60 67 73 75
’ (b) requircbment:
-+-
(a) 5% IX 0.2% 0.1%
40 6168 74 ‘7 7
411 62 69 -ii, 78
421 63 ‘71 77
431
79
65 72 78 81
44’ 66 73 80 a2
45 67 74 81 84
46
471
68 76 82 85
69 77 84 86
48’
49. I
71 ? 8 $5 a5 72 79 86 89
50! 73 a1 87 30
51 74 32 9, .J
f)O
“1
j
,
(b) requirement:
(a) 5% 1% 0.2% 0.1% 80 108 117 125 129
81 109 119 127 130
82 110 120 128 131
83 112 121 129 133
a4 113 122 130 134
85 114 123 132 135
86 115 125 133 136
87 116 126 134 138
88 117 127 135 139
89 118 128 137 140
90 120 129 138 141
91 121 131 139 143
92 122 132 140 144
93 123 133 141 145
94 124 134 143 146
95 125 135 144 148
96 127 137 14,5 149
97 128 138 146 150
98 129 139 148 151
99 130 140 149 152
100 131 141 150 154
97 105 1 it,
71 j 98 107 114 117
72i 99 108 116 ll?
731100 109 11; 120
741101 110 118 121
-23-

intentionally blank
-24-

THE BEARISH SENTIMENT INDEX UPDATED
ABRAHAM W. COHEN Investors Intelligence
Abraham W. Cohen, a long-time MTA member, is the originator and foremost interpretor of the Investment Advisory Services Sentiment Indices. In this article he updates the bearish senti- ment indicator and discusses recent work that has been done by himself and others in the use of the indicator.
An explanation of the construction and interpretation of the Bearish Senti- ment Index appeared in the first issue of the Market Technicians Journal. A very brief review of this material will be of value to those to whom this index may be entirely new.
The Bearish Sentiment Index is based on the opinions of about 100 invest-
i ment advisory services as to the present and future trend of the stock market. The great majority of these services are technically oriented. Their opinions, taken weekly, are classified in three categories, bullish, bearish, and those expecting a correction or consolidation. The third cate- gory consists of “waiting” bulls. These three classes are then expressed in percentages - % of bulls, % of bears, etc.
For the purpose of interpretation, the bearish % is most important and is the only percentage that is charted and compared to the action of the Dow- Jones Industrial Average. The reason for this is that a bearish advisory service is usually unequivocal in its opinion whereas a bullish advisory service often hedges its opinion. A bearish advisory service tells you to sell your stocks, to go short, to buy puts. There is no mistaking that such advice is bearish.
Since most services are trend followers, they tend to turn less bearish as the Dow-Jones Industrial Averages rises, and become more bearish as this average falls. Investment Advisory Services will be least bearish at market
-25-

I -, ,............ ;t a 6 : 2
Ffi
. . . . . (’ .r P L E a + i . . . . . 3 2 i -
.i.i./.l.l.i.I.!.l. . . . . .I. . . _ .I_ . . .

tops and most bearish at market bottoms. The Bearish Sentiment Index can, therefore, be used as an indicator of Contrary Opinion. The consensus of opinion is always wrong at extremes -- when too many agree to the same pro- position.
Originally the parameters of this index were about 10% and 60%. When only about 10% of the advisory services were bearish, it was time to look for a market top; when about 60% of the services were bearish it was time to look for a market bottom. However, in the last few years, these parameters may have changed to adjust to the narrower fluctuations in the Dow-Jones Indus- trial Average.
Arthur Merrill, the leading statistician among market technicians, suggests parameters of 18.4% and 42.9%, i.e., a Bear market should be looked for when the bearish % falls below 18.4% and a Bull market when it rises above 42.9%. Merrill also issues reports on the indicators “which had the best performance in a twelve-year test.” His report of January 13, 1981, puts the Bearish Sentiment Index at the top of the list. (Arthur Merrill is the editor and pub- lisher of Merrill Analysis, Box 228, Chappaqua, New York 10514)
Ned Davis, another leading market technician, while still editor of the “J. C . Bradford Market Timing Letter, v in its issue of June, 1980, made a detailed study of the extremes in the Bearish Sentiment Index since 1965 and correlated these figures with what happened in the Dow-Jones Industrial Index. He found that “in 40 out of 43 cases, the market proceeded to move exactly oppo- site to the predictions of the ‘experts’ when they were at extreme positions.” (Ned Davis is now co-editor with Martin Zweig of “Traders Hotline,” 747 Third Avenue, New York,, New York 10017)
A detailed study of the Sentiment Index by John C. Boland appeared in the September 1, 1980 issue of Barron’s. Mr. Boland uses a unique method of interpreting the index. He subtracts the % of Bears from the % of Bulls.
i “When the bulls have the upper hand, the resulting figure is positive. When the bears are more numerous the figure is negative. That provides a measure of bullish-bearish sentiment. l1 His study shows that the consensus opinion of investment advisors has been much more often wrong than right, and he con- cludes that, although advisor sentiment has a “sad history,” it isn’t a foolproof key to forecasting market moves. It should be pointed out that Mr. Boland places equal weight on both the bullish and bearish percentages, whereas Investors Intelligence relies solely on the Bearish %. However, he also concludes that “advisor sentiment retains one important value. A move that doesn’t draw the advisors along has traditionally had a way to go. ”
No article can be complete today without some comment on Joseph Granville’s latest sell signal. Mr. Granville, in his market letter, has often stated that the Bearish Sentiment Index is one of the indicators to which he pays attention. Correlating his sell signals with the Bearish Sentiment Index may prove inter- esting and revealing.
- 27-
Mr. Granville issued a sell signal in January, 1977 when the index was at about 6%. The Dow-Jones Industrial Average then dropped about 250 points. His next sell signal was in August, 1978 with the index at 17.1%. The Dow- Jones Industrial Average dropped 100 points. His sell signal of October, 1979 was given with the index at 40.4% and the Dow-Jones Industrial Average then dropped about 80 points. In February, 1980, his sell signal took place with the index at 25.5% and the Dow-Jones Industrial Average dropped 110 points. His latest sell signal, that of January 6, 1981, took place with Bear- ish Sentiment Index at somewhere between 49.5% and 43%. Instead of leading, Granville was here joining the crowd of already Bearish advisors. It is my own opinion that the index was at too high a point for his sell signal to have much significance.
The Bearish Sentiment Index appears in Investors Intelligence, which is published every other week, from Two East Avenue, Larchmont , New York 10538.
i
-28- . .

THESTOCK MARKET AS INFLATION HEDGE --
MYTH OR REALITY
STEVEN C. LEUTHOLD Vice President & Director
Funds, Inc.
Analysts have for years debated the pros and cons of the stock market as an inflation hed.qe. Steven C. Leuthold, author of the recently-published book The Myths of Inflation and Inv&ting. from which this article is excerpted and updated, comes down firmly in the opposing camp. Drawing on 109 years of stock- market his tory, Leuthold argues that both rapid inflation and rapid deflation tend to produce poor stock markets, and that the market does best during periods of price stability.
Leuthold, an MTA member, is vice president and director of Funds, incorporated, and a special consultant to Piper, Jaffray, & Hopwood. He is also the author of Index Funds The Risks and Pitfalls, the definitive critique of the indexing concept.
i
There exists the widespread belief that the stock market provides a hedge against price inflation. Close examination of the historical record tends to indicate, by and large, this is not the case. The stock market tends to perform poorly both in highly inflationary and highly deflationary periods. The best environment for the stock market tends to be stability. As long as inflation or deflation does not exceed 3 percent, there is no adverse effect on stock prices.
INVESTMENT PERFORMANCE IN A HIGH-INFLATION ENVIRONMENT
Taking a closer look, what has been the stock market’s comparative record in years when inflation was 4 percent or more?
Contrary to the almost universally accepted dogma of the 1950’s and 1960’s, which held that common stocks were the best inflation hedge, history clearly reveals the market provided no protection at all when inflation was at or
-29-

HOW THE INVESTMENT OF $100 FARED IN SPECIFIC
INVESTMENT ENVIRONMENTS
A. Extraordinary Inflation Environment
(8% thru 18%)
Beginning Inflation Stock Market
15 Years Value Erosion to % Change
1916 ( 8%) $100 $92 + 3.4%
1917 (17%) 100 83 - 30.7
1918 (18%) 100 82 + 16.1
1919 (15%) 100 85 t 13.1
1920 (16%) 100 84 - 23.7
1942 (11%) 100 89 + 7.6
1946 ( 9%) 100 91 - 8.1
lY47 (14%) 100 86 + 2.2
1948 ( 8%) 100 92 - 2.1
1951 ( 8%) 100 92 + 14.4 1974 (11%) 100 89 - 27.6
1975 ( 9%) 100 91 + 38.3
1978 ( 9%) 100 91 - 3.2
100 + 4.2 LOO T lri.9
Average + 1.3% Compound Annual Growth - o.r2
B. Relatively High Inflation Environment
(4% thru 7%)
20 Years
1880 (7%) 1881 (6%)
1899 (7%) 1902 (4?‘,)
I’)03 (4T,, Imj (i“;. 1 ;‘,I17 !it-o\
1910 (4”;)
1912 (4%) 1937 (-406)
1911 (5%) 19-43 (6fo)
1357 (4%)
1968 (-II‘: ) 196Y (5%)
1970 (647,) 1971 (47,)
1973 ifi’;,) 19;ti (7?&, 1977 (7’:. ) u
(Ti*;,)
Beginning Inflation Stock Market
Value Erosion to % Change
$100 $93 + 19.0% 100 94 + 2.8 100 93 t G.5
100 96 + 1.3 1w 96 - 18.5
1111) 96 1 3.”
1’)O Y6 33..1 IO0 96 - 12.3
101) ‘36 + 2Y illI) 96 - 32.kl
II!0 95 - 15. I 100 94 + 13.8 1110 96 - 12.8
II)0 96 + 4,s lU0 95 - 15.2
100 94 + -4.8 !:I(? 96 + 6.1 ia)0 9-4 - 16 6 !:l:: 94 + 17.Y It :’ YS - 17.3
;\tC.r2jC .I (i ‘,V&
(;nqwuncl Annual (irowth 5 H “I
Constant Dollar Constant Dollar
Year End Value % Change
$ 95.13
57.51 95.20 96.13
64.09
95.76 83.62 87.89
90.07
105.25 64.44
125.85
87.80 90.03
LOl.11
Constant Dollar
Year End Value
$110.67
96.63 YY.05
97.25 78.24
9Y.07
G-4.03
84.19 98.78 64.51
so.37
106.97 83.71
100.13
80.56 98.51
101.86 81.22
110.83 76.91
- 4.9%
- 42.5 - 4.8
- 3.9 - 35.9
- 4.2 - 16.4 - 12.1
- 9.9
+ 5.3 - 35.6 •t 25.9
- 12.2
Constant Dollar
% Change
+ 10.7% - 3.4 - 1.0
- 2.7
-21.8 - 0.9 -JG 1::
- 13.8 - 1.2 - 35.5
+ lY.‘j
+ 7.0 - 16.3
+ 0.1
- 19.i - 1.5
+ 1.9
- 18.9 + 10.8
- 23.1
-3o-

above 4 percent. It is interesting to note that when it was generally accepted that stocks were an inflation hedge, inflation only equaled or exceeded 4 per- cent in four widely-spaced years -- 1951, 1957, 1968, and 1969.
During the past 109 years there have been 35 years with annual inflation rates of 4 percent or higher. In only eight of these years did the stock market manage to keep pace with or rise more than the inflation rate (excluding divi- dends) . In those 109 years, including 1979, there have been nine years when inflation blazed at levels of 10 percent or higher. 1980 was the only one of those nine years in which the stock market outperformed the inflation rate (See tables). In the years of extraordinary inflation, shown in Table A, the market was up nine years and down six, but the compound annual growth rate for the period was minus 9.4 percent, while in constant dollars the compound annual rate eroded to minus 12.3 percent. In the periods of relatively high inflation -- 4 percent to 7 percent, shown in Table B , -- the market was up 11 years and down nine, but again finished with a negative compound annual growth rate -- minus 5.8 percent, while in constant dollars the loss mounted to an 8.6 percent compound annual rate.
PERIODS OF MODERATE INFLATION OR STABILITY
What has been the historic stock market behavior in periods of moderate infla- tion -- 2 percent to 3 percent ? Consider the data shown in Table C.
If you had invested only in the 21 years when inflation was in the 2 percent to 3 percent range, you would have had 7.1 percent compound annual rate of return (excluding dividends). Even after factoring out inflation (in constant dollars), the return would have been 4.6 percent. The market declined more than 15 percent only one year - 1966- in this environment; and there were only eight years out of 21 when the market returns were negative.
i In summary, inflation at these lower levels would seem to have no adverse effect on the stock market. However, the investment record, although good, falls significantly short of the market performance found in the environment of price stability if viewed in terms of constant dollars.
The stock market appears to react most favorably in periods of relative price stability, when inflation is 1 percent or less, or when deflation is 1 percent or less. Those periods are summarized in Table D. In only eight of the 30 years in which these conditions existed was there a losing market, and only in 1893 did the decline exceed 15 percent.
The compound annual growth rate for these years was 8 percent (about 13 percent when dividends are included) with a one year high of 44 percent in 1954. Even in constant dollars, the growth rate was an impressive 7.7 percent. Unfortunately, the last years in which these stable conditions existed were 1961, 1962, 1963, and 1964.
-31-

----.’ THE INVESTMENT OF $100 FARED IN SPECIFIC HUW
INVESTMENT ENVIRONMENTS
C. Moderate inflation Environment
(2% thru 3%)
21 Years Inflation Erosion to
Stock hlarket 96 Change
Constant Dollar Scar End Value
1 w! (2 7; ) f ! (3 ! ! S9R IA97 (2%) 10:) 98
1558 (2%) 100 98
1890 (2%) 100 98
1897 (2%) 1 cm 98 1900 (2%) 1 on 98 1901 (2%) 100 98
1923 (2%) 100 98 1925 (3%) 100 97
1934 (3%) 100 97
1935 (3%) 100 97
1944 (2%) 100 98
1945 (2%) 100 98
1952 (2%) 100 98
1956 (2%) 100 98 1958 (3%) 100 97
1960 (2%) 100 98
1965 (2%) 100 98
1966 (3%) 100 97
1967 (3%) 100 97
1972 (3%) 100 97
- 2.05;.
- 6.5 - 2.4
- 13.6 + 12.9
+ 14.1 + 15.8
- 2.4 + 22.8
- 1.1
+ 37.0 + 12.1 + 26.7
+ 8.4
+ 2.3 + 34.0
- 9.3 + 10.9
- 19.0 + 15.2
+ 14.6
5 95.16
91.63 95.65
84.67 110.64 111.82
113.48
95.65 119.12
95.93 132.89
109.86 124.17
106.23
100.25 129.98
88.89 108.68
78.57 111.74
111.16
Constant Dollar % Change
- 4.8%
- 8.4 - 4.3
- 15.3 + 10.6
+ 11.8 + 13.5
- 4.3 + 19.1
- 4.1
+ 32.9 + 9.9 + 24.2
-I- 6.2
+ 0.3 + 30.0
- 11.1 + 8.7
-21.4 + 11.7
+ 11.2
(2%) Average + 8.1% + 5.5%
Compound Annual Growth + 7.1% + 4.6%
E. Moderate Deflation Environment
(2% thru 4%)
13 Years
Bqinning Inflation
Value Erosion IO % Change
Conscant Dol!ar Consant Dollar Year End Value % Change
SIOO
100 100
100 100
100
100 100
100 ::10
1W
100 100
$102 102
104 102
102 102
102 102
102 If17
102 103 IO?
5 88.74 105.26
94.12 145.86
93.13
122.20 110.67
105.26 120.56 14 1.42
128.63 73.23
130.66
(2%) Average i 9.80/;, + 12.3%
Compound Annual Growth + 7.8% + 10.3%
-32-
- 11.3yo
t 5.3 - 3.9
+ 45.9 - 6.9 + -9 9 .-L._
+ 10.7 i 5 .3 - L,I, 6
f -11.4 t 2R.R
-26.8
+ 30.7

HOW THE INVESTMENT OF $100 FARED IN SPECIFIC
INVESTMENT ENVIRONMENTS
D. Stable Environment
(1% or Less Inflation/Deflation)
Inflation/
SO Years Deflation
1872 1% D 1892 1% D 1893 -O- 1895 -o-
1896 -O-
1898 1% 1 1904 -O-
1905 -O-
1909 -O-
1911 -O- 1913 1% D 1914 1% I 1915 1% 1 1924 -O- 1926 1% I 1928 1% 1 1929 -O- 1956 -O-
1939 1% D 1940 1% 1 1949 1% D 1950 1% 1 1953 1% I 1954 1% 1 1955 -O- 1959 1% 1 1961 1% 1 1962 1% I 1963 1% 1 1964 1% 1
i
10 Years
1875 ( 5%) $100 $105
lA76 ( 5%) 100 105
1878 ( 6%) 100 106
1884 ( 6%) 100 106
1894 ( 8%) 100 108
1921 (11%) 100 111
1922 ( 6%) 100 106
1931 ( 9%) 100 109
1932 (10%) 100 110
1933 ( 5%) 100 105
( 7%)
-0.
Adjustment Beginning Inflation/ Stock Market Constant Dollar Constant Dollar
Value Deflation 96 Change Year End Value 96 Change
$100 $101 + 6.9% $107.97 + 8.0% 100 101 + 1.4 102.41 + 2.4
100 100 - 19.8 80.20 - 19.8
100 100 + 1.0 101.00 + 1.0
100 100 - 2.3 97.70 - 2.3
100 99 t 18.6 117.41 + 17.4
100 100 t 25.6 125.60 + 25.6 100 100 + 16.0 116.00 + 16.0
100 100 + 14.3 114.30 + 14.9
100 100 + 1.0 101 .oo -I- 1.0
100 101 - 14.2 86.66 - 13.3 100 99 - 9.0 90.09 - 9.9
100 99 + 31.6 130.28 + 30.3 100 100 + 18.6 118.60 + 18.6
100 99 t 5.1 104.05 + 4.1
100 99 t 28.Y 127.51 + 27.5
100 100 - IO.3 89.70 - 10.3
100 100 + 28.9 128.90 t 28.9 100 101 - 3.0 97.99 - 2.0
100 99 - 12.7 86.43 - 13.6 100 101 t 12.9 114.03 + 14.0
100 99 t 17.6 116.42 + 16.4
100 99 - 3.8 95.24 - 4.8
100 99 t 44.0 142.56 t 42.6
100 100 t 20.8 120.80 + 20.8
100 99 + 16.4 115.24 + 15.2
100 99 t 18.7 117.51 + 17.5
100 99 - 10.8 88.31 - 11.7
100 99 t 17.0 115.83 + 15.8 100 99 + 14.6 113.45 + 13.5
Average t 9.1% + 8.8%
Compound Annual Growth t 8.0% + 7.7%
F. Extraordinary Deflation Environment
(5% thru 11%)
Beginning
Value
Deflation Adjustment
Stock Market % Change
Constant Dollar
Year End Value
- 4.2% 5100.59
- 18.0 86.10
+ 6.3 112.68
- 18.7 86.18
- 2.8 104.98
+ 7.3 119.10
+ 20.1 127.31
- 46.6 58.21 - 19.4 88.66
+ 49.5 156.98
Average - 2.7%
Compodnd Annual Growth - 5.9%
Constant Dollar % Change
+ 0.6% - 13.9
+ 12.7
- 3.8 + 5.0 + 19.1
-I- 27.3
-41.8 - 11.3 + 57.0
+ 5.1%
+ 1.9%
-33-

DEFLATIONARY ENVIRONMENTS
Years of moderate deflation appear to be favorable for the market. In the 13 years of moderate deflation (prices declining between 2 percent and 4 percent), as shown in Table E , the market advanced in nine years and declined in four. A person who confined investing to only those years would have experienced a 7.8 percent compound annual growth rate, not much lower than in the years of relative price stability. In constant dollar terms, he would have done even better because on an inflation-adjusted basis the growth rate was 10.3 per- cent compounded annually. However ,. the sample here is relatively small -- only 13 years -- and also ancient, with only three instances since the turn of the century. Therefore it is difficult to say with confidence that moderate deflation is the best env-iornment for the market.
In the 10 years of extraordinary deflation, as shown in Table F, when prices fell between 5 percent and 11 percent, investment experience was generally not good. Only 1922, when the market was up 20.1 percent, and 1933, when the market was up 49.4 percent, were good years. An investor who limited his investing to this kind of environment would have experienced a 5.9 percent compound annual loss, although, because of the high levels of deflation, his result on a constant dollar basis was actually a 1.9 percent gain.
Thus, the best environment for investing in the stock market seems to be years of relative price stability, with some eiidence that this is followed closely by years of moderate deflation. Investing in years of extraordinary inflation, relatively high inflation or extraordinary deflation brought poor results.
But can you make money in the stock market with all this knowledge?
CAN WE PREDICT INFLATION?
From a practical standpoint, the catch, of course, is knowing at the beginning i of a particular year what the inflation or deflation rate for that year will be.
One approach would be to assume that next year’s inflation or deflation rate will approximate this year’s. Unfortunately, this does not work well at all. There is very little year-to-year inflation or deflation stability. AnaIyzing the historic data, through 1979, we find that the odds of a particular year’s infla- tion/deflation environment being repeated in the following year are less than 50-50.
If This Year’s Environment Is : The Odds Next Year’s Environment Will be the Same Are:
Extraordinary Deflation 38% Moderate Deflation 16 Price Stability 35 Moderate Inflation 23 High Inflation 17 Extraordinary Inflation 45
-34-

So, even though the research indicates there is a correlation between annual stock market movements and the annual rate of inflation or deflation, this information, although helpful to the investor, does not qualify as an invest- ment panacea. It is not a magic key to successful investment strategy because it depends on one’s ability to predict inflation or deflation levels one year in advance. And predicting next year’s inflation or deflation, especially when inflation is currently high, could be as difficult as predicting next year’s stock market.
Most people will be surprised to learn the inflation rate during the span of this study. Most would probably guess it has been about 3 percent per year, but in fact it has been but half that. Equally surprising may be that during this 109year period there were 38 years when there was no inflation, includ- ing 31 years of deflation. Unfortunately, that still left us with 71 years of inflation of one degree or another, and thus, with a problem for the stock market investor.
In 12 of the 109 years, inflation exceeded 8 percent, and in only two of those years, 1975 and 1980, did the stock market beat inflation. In three of the 12 years, the market was horrible.
TWELVE YEARS WHEN INFLATION TOPPED 8 %
Inflation Year Stock Market Change
9” 0, 1978 - 3% 9 1946 -8 9 1975 +38
11 1942 +7 11 1974 -28 12 1980 +15 13 1979 +4 14 1947 +2 15 1919 +13 16 1920 -24 17 1917 -31 18 1918 +16
Contrary to what might be expected, the shift from an inflationary environment to a deflationary one need not be gradual. It can be quite abrupt. For example, in 1919 the country suffered through 15 percent inflation, and in 1920 it had 16 percent inflation, but in 1921 it had 11 percent deflation. Similarly, in 1947 the country had 14 percent inflation followed by 8 percent inflation in 1948, and then 1 percent deflation in 1949.
-35-

1%
1872 + 6.9%
1898 +18.6 1914 - 9.0
1915 +31.6 1926 + 5.1 1928 +28.8
1940 -12.7 1950 +17.6 1953 - 3.8
1954 +44.0
1959 +16.4 1961 +18.7
1962 -10.8 1963 + 17.0 1964 +14.6
7%
YEARS OF INFLATION 1872- 1980
Includes Annual Stock Market Performance Excluding Dividends
Annual Inflation Rate
2%
1882 - 2.9% 1887 - 6.5 1888 - 2.4
1890 -13.6 1897 +12.9
1900 +14.1 1901 +15.8
1923 - 2.4 1944 +12.1
1945 +26.7 1952 + 8.4
1956 + 2.3 1960 - 9.3
1965 +10.9
3% 4%
1925 + 22.8% 1934 - 1.1
1935 +37.0 1958 +34.0
1966 -19.0 1967 +15.2 1972 +14.6
1902 + 1.3% 1903 -18.5
1906 + 3.2 1907 -33.3
1910 -12.3 1912 + 2.9
1937 -32.8 1957 -128 1968 + 4.3
1971 + 61
5% 6%
1941 -15.4% 1881 + 2.8% 1969 -15.2 1943 +13.8
1970 + 4.8
1973 -16.6
1976 +17.9
8% 9% 10% 11% 12% 13% 14% 81 Over
1880 +19.0X 1916 + 3.4% 1946 - 8.1% - 1942 + 7.6% 'f@ 1979 + 4.2% 1947 + 2.2% (14)
1899 + 6.5 1948 - 2.1 1975 +38.3 1974 -27.6 df..t]. 1919 +13.1 (15)
1977 -17.3 1951 +14.4 1978 - 3.2 1920 - 23.7 (16) 1917 -30.7 (17)
1918 +16.1 (18)
11%
!321 - 7.3?+#
5%
1875 - 4.2% 1876 -180
1933 +495
YEARS OF DEFLATION 1872-1980
Includes Annual Stock Market Performance Excluding Dividends
Annual Inflation Rate
10%
1932 -194%
4%
1877 - 9.5%
9% 8% 1931 -466% 1894 - 2.9%
3% 2%
1908 + 37.3%
1930 -28.9 1873 -130% 1874 + 3.2
1879 +-I30 1883 - 87 1885 +198
1886 + 8.5 1889 + 32 1891 cl82
1927 +?63
1938 +291
7% 6% -- -
- 1578 + 6.39'0 iif:.: -137 ;3? 1 c Z!j 1 --
1% 0%
1892 + 14% 1893 -198?b 1913 -14.2 ie95 + 1.0
1939 - 3.0 1896 - 2.3 1949 +i2.9 190-l +256
1905 +160
1909 +14.3 1911 + 1.0 1,V.l +18c. 1919 -103
1936 +x9 1355 +20?3
-36-

SUMMARY TABLE
The Six Environments and the Stock Market
Average Annual Compound Stock Annual Price Growth* Change (Negative)
UP Market Years
+ 0.3% - 1.4% 8
Down
Market Years
Average
Gain Average loss
- 15.9%
Years
14
20
21
Environment
Extraordinary inflation (8%-18%)
Relatively High Inflation
(4%-7%)
Moderate Inflation (2%-3%)
Stability (1% Inflation-
1% Deflation)
Moderate Deflation
(2%-4%)
Extraordinary Deflation (5%-11%)
The Entire Period
The Stock Market
+12.4%* 6
+ 7.5
+17.5
- 4.6 - 5.8 11 9 -18.1
8 - 7.2 + 8.1 + 7.1 13
30
13
10
+ 91 + 8.0 21
9
+17.1 9
+ 20.8 4
+ 8.0 6
- 9.5
+ 9.8 + 7.8 -15.0
.- 8.3 - 2.7 - 5.9 4
108 + 4.4% + 2.6% 66 + 15.0% 42 -14.1%
l Annual percentage gains and declines for all years included in each en-
vironment geometrically linked and presented in terms of annual com-
pound positive or (negative) growth rates. Excludes dividends.
-37-

THE MARKET AS INFLATION HEDGE
What then of those who say the stock market is a long-term hedge against inflation. The evidence cited by the believers usually consists of present- ing long-term stock market investment results of say, 25 years, 50 years or more, and comparing this with the long-term inflation rate.
Because the stock market gained more than was lost to inflation during this period, the conclusion is that stocks are a hedge against inflation.
This is, at best, a questionable conclusion. In all of the time periods cited, stock market growth rates most closely correlate with book value growth, earnings growth and dividends growth. The stock market gains during these periods are recognition of these fundamental growth factors. These are the prime movers, not inflation. If the long-term growth of these fundamental factors ceases or slows down, the stock market will follow suit, no matter that inflation continues to surge ahead.
“A ha , It the diehard stock market /inflation advocate might say “won’t in- flation itself cause earnings, book value and dividends to grow at a simi- lar rate?”
It’s the old chicken and egg argument. Sometimes, it will, but certainly not all the time, escpecially when inflation is running 5 percent or more per year. A look at recent experience might be of interest. From Dec- ember 31, 1968, through December 31, 1977, only book value growth managed to stay within hailing distance of the increase in consumer prices as measured by the Consumer Price Index. Earnings growth and dividend growth lagged far behind inflation.
Consider the following :
f Dec. 31, 1968 Dec. 31, 1977 Increase
Dow-Jones Industrials Earnings $ 57.89 $ 89.10 53.9% Dividends 31.34 45.10 43.9 Book Value 521 838 60.8
Consumer Price Index 106.4 186.1 74.9%
In summary, inflation has been a recurring but not constant phenomenon in the U . S . economy and, conventional wisdom notwithstanding, it has not been a good environment for stock market investing. In the last 10 years, the Consumer Price Index rose 117 percent and during the same period, the Dow-Jones Industrial Average rose only 15%. As a matter of fact, the stock market return has managed to exceed the high annual inflation rates (8 Percent Plus) in only three years since 1872. Therefore, the stock market does not appear to be a good inflation hedge. The best time to profit in the stock market is during periods of price stability of even mild deflation.
-38-

THE EFFECT OF ACCELERATING AND DECELERATING INFLATION
When economic history and stock market performance are rubbed together, the evidence is overhwelming that the stock market performs below average during periods of more than 4 percent inflation, while in periods of rela- tive price stability or perhaps even mild inflation, market performance is significantly above average . .
But what happens to the stock market when inflation is accelerating or decelerating?
To provide some insights into this question, we’ve isolated all years from 1900 to 1980 in which inflation was 4 percent and above and in which infla- tion had accelerated at least 2 percent from the prior year. We also tracked the stock market performance for these same years. The table below pre- sents the results of the 17 years when inflation was accelerating. The Cowles Commission Index and the Dow-Jones Industrial Average were once again used as the stock market proxy.
Year
1902 1906 1910 1912 1916 1917
i 1937 1941 1942 1946 1947 1951 1957 1973 1974 1978 1979
Seventeen Inflation Acceleration Years: 1900-1980
Preceding Net Change Inflation Year Stock in Constant Dollar Level Inflation Change Market (Inflation Adjusted)
40 9 2 % +2% + 1.3% - 2.7% 4 +4 + 3.2 - 0.8 4 +4 -12.3 -16.3 4 - +4 + 2.9 - 1.1 8 1 +7 + 3.4 - 4.6
17 8 +9 -30.7 -47.7 4 +4 -32.8 -36.8 5 1 +4 -15.4 -20.4
11 5 +6 + 7.6 - 3.4 9 2 +7 - 8.1 -17.1
14 9 +5 + 2.2 -11.8 8 1 +7 +14.4 + 6.4 4 2 +2 -12.8 -16.8 6 3 +3 -16.6 -22.6
11 6 +5 -27.6 -38.6 9 7 +2 - 3.2 -12.2
13 9 +4 + 4.2 - 8.8
-39-

Summary: 17 years Nominal Dollars Constant Dollars
Up Years 8 1 Down Years 9 l6 All 17 Years
Median Annual Performance -3.2% -12.2% Average Annual Performance -7.1% -15.0% Hypothetical Annual
Compound Loss ( 17 Years Linked) -8.2% -16.4%
The table shows several interesting things. First, even though the actual up years and down years are almost balanced (eight up, nine down), the losing years were really big losers, declining an average 20 percent. Also, the years of market advance were marginal at best, averaging 5 percent. The biggest nominal winner was 1951, which had 14.4 percent gain.
When viewed in terms of constant dollars, taking into consideration the dollar erosion from each year’s inflation rate, 1951 was the single winning year in the 17 years examined, and that was only a 6.4 percent gain. Over- all, relative investment performance for these inflation acceleration years is miserable when measured in nominal or constant dollars.
The largest nominal loss in inflation acceleration years was 32.8 percent in 1937 when inflation increased from zero the previous year to 4 percent. The second biggest nominal loss was 30.7 percent in 1917 when the inflation rate more than doubled from 8 percent in 1916 to 17 percent in 1917. More recent- ly, when inflation almost doubled -- from 6 percent in 1973 to 11 percent in 1974 -- the market lost 27.6 percent.
Rapidly accelerating inflation, particularly if it is from a level of 4 percent or more, is a hostile environment for the stock market investor. If the in- vestor can strongly support a conclusion that a current inflation level of 4 percent or higher will increase by 2 percent or more in the next 12 months, he should realize he probably has two strikes against him.
Essentially the same procedure has been followed in examining years from 1900 to date when inflation was decelerating. Inflation deceleration years are identified as years in which inflation declined at least 2 percent from a preceding significant inflation year (4 percent and above). Sixteen years fit this definition. Note that some high inflation years, such as 1919 (15 percent) and 1975 (9 percent), also qualify as inflation deceleration years in that inflation, though still high, was coming down.
We find that 16 years fit our selected criteria, and 14 of these recorded gains in nominal dollars ranging from 38 percent in 1975 and 37 percent in 1908 to 6 percent in 1971. Only 1913 (minus 14 percent) was a signifi- cant losing year. More importantly perhaps, in constant dollars there were only three losing years out of the 16. All in all, these look like pretty good odds.
- 40-
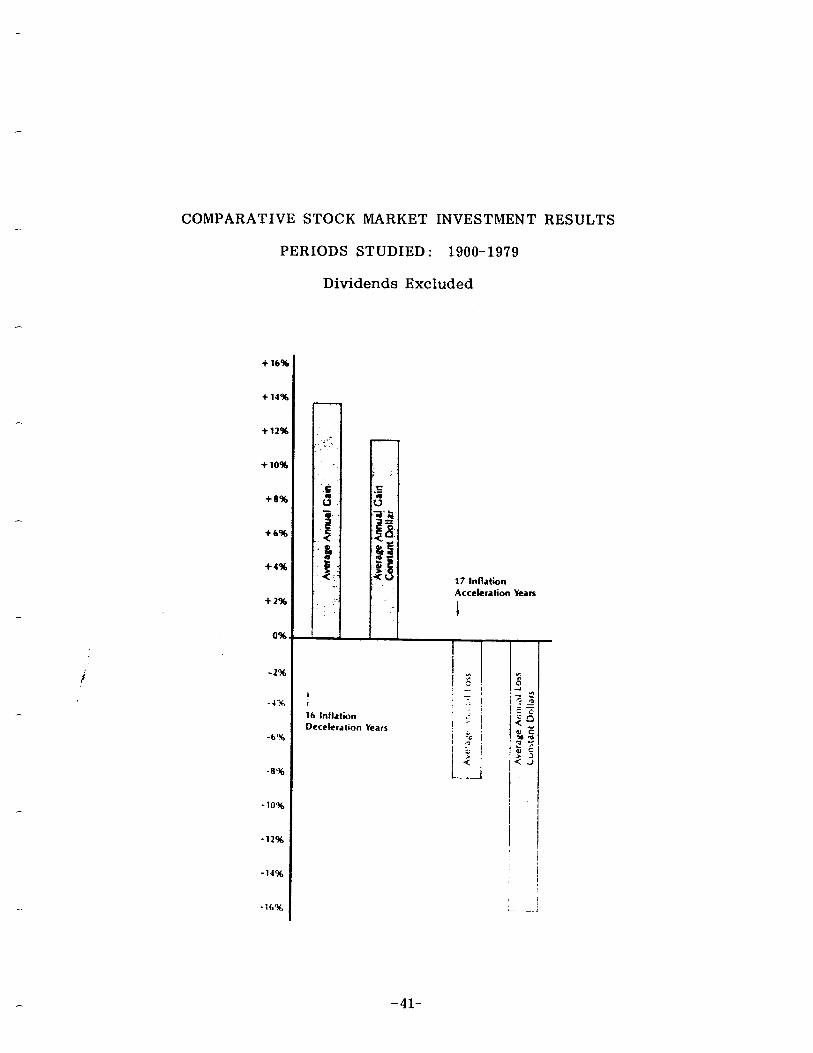
i
COMPARATIVE STOCK MARKET INVESTMENT RESULTS
PERIODS STUDIED : 1900-19’79
Dividends Excluded
+ 1691
+ 14%
+6%
-2%
-4%
-8%
-10%
-12%
-14%
-16%
t 16 Inflhon
Deceleration years
17 Inflation Acceleration Yearn
1
I
- -2
-41-

Inflation Deceleration Years 1900- 1980
Year Inflation
Level
1900 + 2% 1904 0 1908 - 3 1911 0 1913 - 1 1919 +15 1921 -11 1938 -2 1943 +6 1944 +2 1948 +8 1949 -1 1952 +2 1971 +4 1975 +9 1976 +6
Preceding Year Inflation
Summary : 16 Years
70 3- 4 4 4 4
18 16
4 11
6 14
8 8 6
11 9
Change
- 5% - 4 -7 - 4
I- IJ3 -27 -6 -5 -4 -6 -7 -6 -2 -2 -3
Stock Market
+14.1% +25.6 +37.3 + 1.0 -14.2 +13.1 + 7.3 +28.1 +13.8 +12.1 - 2.1 +12.9 + 8.4 + 6.1 +38.3 +17.6
Nominal Dollars
: Up Years
i Down Years All 16 Years
Median Annual Performance Average Annual Performance Hypothetical Annual
Compound Gain ( 16 Years Linked)
14 2
+13.0% +13.7%
+12.9%
Net Change in Constant Dollar (Inflation Adjusted)
+12.1% +25.6 +40.3 + 1.0 -13.2 - 1.9 +18.3 +30.1 + 7.8 +10.1 -10.1 +13.9 + 6.4 + 2.1 +29.3 +11.6
Constant Dollars
13 3
+10.9% +11.5%
+10.9%
Thus, periods of decelerating inflation appear to be very positive investment environments. And, even though the actual level of inflation may still be high by historic standards, the more important factor is the declining trend. Investor recognition of inflation deceleration from levels of 4 percent and above would appear to be a significant factor, improving the odds of investment success.
-42-

Year
-1872 1873 1874 1875 1876 1877 1878 1879
1880 1881 1882 1883 1884 1885 1886 1887 1888 1889
1890 1891 1892 1893 1894 1895 1896 1897
1898 1899
l
1900 1901 1902 1903
Inflation (+ ) % Change Deflation (- 1 stock Market
+ 1% -2 -2 -5 -5 - 4 -6 -2
+ 7 +6 +2 -2 -6 -2 -2 +2 +2 -2
+2 -2 -1
0 -8
0 0
+2
+1 +7
+ 6.9% -13.0 + 3.2 - 4.2 -18.0 - 9.5 + 6.3 + 43.0
+ 19.0 + 2.8 - 2.9 - 8.7 -18.7 +19.8 + 8.5 - 6.5 - 2.4 + 3.2
-13.6 + 18.2 + 1.4 -19.8 - 2.8 + 1.0 - 2.3 +12.9
+ 18.6 + 6.5
i 1904 1905 1906 1907 1908 1909
+2 +14.1 + 2 +15.8 +4 + 1.3 +4 -18.5
0 + 25.6 0 + 16.0
+4 + 3.2 +4 - 33.3 - 3 + 37.3
0 + 14.3
1910 +4 -12.3 1911 0 + 1.0 19l2 +4 + 2.9 WI3 -1 -14.2 19l4 +1 - 9.0 19l5 + .l +31.6 1916 +8 + 3.4 1917 +I7 - 30.7 19l8 + 18 +lLl WI9 +15 + 13.1
1920 +16 - 23.7 1921 -11 + 7.3 1922 -6 + 20.1 1923 +2 - 2.4 1924 0 +18.6 1925 +3 + 22.8
PRIMARY DATA TABLE
Year 1916 1927 1928 1929
1930 1931 1932 1933 1934 1935 1936 1937 1938 1939
1940 1941 1942 1943 1944 1945 1946 1947 1948 1949
1950 1951
Inflation (+ ) Deflation (-)
+1 -2 + 1
0
-3 -9 -10 -5 + 3 +j
0 +4 -2 -1
+ 1 + 5 +11 +6 + 2 + 2 +9 +14 +8 - 1
1952 1953 1954 1955 1956 1957 1958 1959
+ 1 +8 +2 +1 +1
0 + 2 +4 +3 + 1
+ 2 +l +1 +1 + 1 + 2 + 3 + 3 +4 + 5
96 Change Stock Market
+ 5.1 + 26.3 + 28.8 -10.3
- 28.9 - 46.6 -19.4
* +49.5 - 1.1 + 37.0 + 28.9 -32.8 . n + 28.1 - 3.0
-12.7 -15.4 + 7.6 +13.8 +12.1 + 26.7 - 8.1 + 2.2 - 2.1 +12.9
+17.6 +14.4 + 8.4 - 3.8 + 44.0 + 20.8 + 2.3 -12.8 + 34.0 +16.4
1960 1961
1962 1963 1%4 1%5 1966 1967 1968 1969
- 9.3 + 18.7 - 10.8 +17.0 +14.6 + 10.9 -19.0
+15.2,
+ 4.3 -15.2
1970 +6 + 4.8 1971 +4 + 6.1 1972 + 3 +14.6 1973 +6 -16.6 1974 +11 - 27.6 1975 +9 + 38.3 1976 +6 +17.9 1977 + 7 -17.3 1978 + 9 - 3.2 1979 b¶m
+13 + 4.2 + II. +I%?
-43-

intentionally blank
-44-
OVERBOUGHT CAN BE BULLISH
KENNETH G. TOWER Delafield , Harvey, Tabell
The IO-day advance-decline line is one of the most widely- followed of all technical indicators. It is conventionally interpreted as a simple oscillator with extremely low levels being bullish and high levels bearish.
Kenneth Tower, on the technical staff of DeZafieZd, Harvey, Tabell, has done some extensive research which suggests that “overbought” conditions on this indicator, whatever they may mean for the short term, tend, paradoxically, to be bullish for the intermediate or longer term.
Appearing in a great variety of stock market publications, the lo-day advance-decline oscillator, usually expressed as a simple lo-day total of advances minus declines, invariably receives a glance from all but the most casual investor. Most market technicians perceive its wild swings as a measure of contrary opinion. Indeed, this interpretation is encour- aged by the often-used term of “overbought-oversold indicator. ” Thus, when the oscillator reaches a particularly low level, the reader anticipates a halt in a market decline, while a high reading is supposed to suggest a downside reversal. Paradoxically, however, an extremely high reading, while it may be suggestive of short-term weakness, can have strongly bullish implications for the intermediate term.
Since 1949, a 7.5 percent filter isolates 37 market rallies. 29 of these have been accompanied by extremely high, (“overbought”) readings. These readings occurred an average of 29 days after and 8.0 percent above an important low in the S & P 500 (see Table I).
-45-

ALL MkRKET !S8F’ 500) MOVES OF GREATER THAN 7.5% SINCE JAN 1949 (KT2S55)
DATE OF LOW LOW
FOLLOWING HIGH
JUN 13 1449 13.55 19.40 JUL 17 1950 16.5s 22.81 JUN 29 1951 20.95 25.55 SEP 14 1957
195; 22.71 45.53
OCT 11 40.80 43.87. MAY 23 1955 44.10 49.74 FEL( 12 1957 42.39 49.13 OCT 22 1957 33.09 50.71 SEP 22 1959 ss.14 50.39 MAR s 1950 53.47 59.07 OCT 25 1950 52.30 72.54 JUN 26 1952 52.32 59.78 OCT 23 1952 53.49 90.27 JUN 2s 1955 31.60 94.05 OCT 7 1956 73.20 97.59 MAR 5 1963 37.72 103.37 FEB 25 1969 97.98 106.15 JUL 29 19.59 89.48 93.33 MAY 25 1970 59.29 78.52 JUL 7 1970 71.23 104.77 AUG 9 1071 93.53 101.34 NOV 23 1971 PO.?5 120.24 JUL 5 1973 101.28 109.35 AUG 22 1973 lOc).53 111.44 DEC 5 I?73 ?3.15 99.so FEB 12 1??4 90.9-l 99.74 HAY 29 1?74 85.59 93.10
’ SEP 13 1774 55.20 70.14 OCT 3 1974 52.23 75.21
c DEC 5 1974 55.01 95.51 SEF’ 15 1?7ti 32.09 107.33 NOV 10 1975 Y8.81 107.45 MAR 5 1978 E5.90 105.99 NOV 14 1978 92.49 111 ,27 NOV 7 1979 09.87 118.44 MAR 27 l?PO 98 *22 140.52 DEC 11 1930 1?.7.36 138.12
% CHG
43.17 35.75 27.19
100.93 la,73 12;79 15.90 55.75
9 .52 P.50
33.89 14.25 58.75 15.27 33.32 13.54 -3.35
9.39 13.32 47.09
3.35 33.35
8.45 10.35
3.29 9.68 P.39 7.53
20.75 47.07 31.35
3.75 23.12 20.39 13.59 43.07 a.45
SIGtdAL LAG iN X FR@H % CHG TO - DATE DAYS sap 500 BOTTOM HIGH
Jl! L 13 21 14.73 JLfL 27 8 17.50 AUG 2 23 22.32 @CT 21 25 24.19 FEE 24 03 45.32
NO CONFI%MATION SIGNAL NO CONFIRHATION SIGNAL
NOV 29 25 41.72 NO CO&FIRHATION SIGNAL
AUG 17 113 55.34 NOV 10 11 55.13 JUL 10 9 57.20 NOV . 7 10 53’,71 JUL 13 10 85.59 JAN 12 55 83.91 AF’K’ 3 24 94.95
NO CClNFIRtiATION SIGNAL OCT 21 59 97.20
NO CONFiRHATION SIGNAL
JUL 23 9 77.72 AUG 24 11 100.40 KJEC 7 9 95.87 JUL 19 9 105.55 SEF’ 5 10 105.15
NO CONFIRMATION SIGNAL FEB 27 10 96.40
NO CONFIRMATIO>! SIGNAL NO CONFIRMATION SIGNAL
OCT 14 7 72.74 JAN 5 19 71.07 JAN 5 75 92.58 NOV 24 10 102.41 H AR 2 0 10 90.82 JAN 5 35 99.13 DEC 5 20 108.00 AFR 11 10 103.79 DEC 25 10 135.57
9.08 31.25 4.92 30.34 8*37 15.83 5.52 38.53
11.08 7.83 -
7.03 4’ cr.52
5.30 7*32 9.33 9.75 4+89
14.53 8.24
2.15 29.41 -
4.51 53.75
9.00 15.30 14’.13
3.53 1.15
9.11 34.80 7.35 0.94 7.44 24.13 5.20 i 3.10 4.50 5.98
5.00
15.80 9 .32
12.78 3.54 4.5 1 7.18 8.14 5.57 7.23
THERE WERE 37 RALLIES OF :: 7.5% AND 29 OF THOSE WERE CONFIRMES THE AVERAGE % CHAN4E OF THE CI?NFIKMCD RALLIES WAS 23.9% ON AVERAGE. THE CONFI~HATION SIGNAL CAtlE 26.0 tlkYS kFTER THE LOW THE AVERAGE LiISl?iNr_‘E AECiVE THE LOU IS 7.99? . THE AVERAGE Z CHANGE OF THE RALLIES WHICH YERE NOT CONFIRHED WAS 10.5% THE AVEKAGE Nl!hP’C_R Clt- DAYS FEOH SIGNAL TO HIGP t!AS ?‘j9 DAYS THE AVEKAGE % CP:INGE FfiOtl SIGNAL TO HIGFI WAS 19.30% $10000 INVESTED ON EACH SIGNAL AND SOLD AT THE NEXT HIGH BECAME $1195470.0~
3.46
3.40 34.53 16.47
4.03 17.&O 12.25
9.57 35.39
1.13
-46-

i
Throughout this discourse, I will be referring to advances minus declines/ total issues traded. This allows for a direct comparison of 1949 to the present, a comparison which, if based solely on advances minus declines, would be distorted by the increase in issues traded over the past 30 years (For example, a recent trading day with 1,000 advancing stocks is considerably less noteworthy in a market trading 2,000 issues than a similar day in 1949 when there were only 1,500 issues traded. ) .
In order to properly utilize this indicator, it is necessary to recognize its limitations. It is primarily useful only as a buy signal. There have been 241 days since 1949 when the indicator was above -177. On 184 or 76% of those days, the market was higher 50 days later. For all dates the market was higher 50 days later only 62% of the time. Chi-squared for this relationship is 20.66, suggesting less than 1 chance in 1000 that it occurred randomly. There are no comparable figures corresponding to particularly low levels.
The analysis in Table I suggests one application of this indicator. It is assumed that a buy signal is given after both of the following conditions have been met. The market must have declined at least 7.5%, and the lo- day oscillator must surpass .177. Results are measured to the following high. Using these guidelines, an investor would have participated in 29 of the 37 rallies greater than 7.5%, since 1949. The average percentage change from buy signal to high was 19.30 percent. The average length of time from buy signal to high was 159 days, an annualized rate of 31.90 percent. Furthermore, note that the rallies which do not contain a confirm- ing signal average only 10.5 percent while those that do average 28.8 per- cent. Indeed, lack of confirmation can be suggestive in that rallies with no confirming signal tend to be concentrated in periods of declining lows (bear markets). In each case where there is a non-confirmed rally, the subsequent low is lower than the previous one (except for the 1970 double bottom at approximately 70).
Similarly, all 9 of the confirmed rallies which measured less than 10 percent, trough to peak, have led to, lower lows. The rally which began from the December 11, 1980 low of 127.36 and was followed 10 days later by a con- firmation signal has appreciated, through January 6, 1981, a scant 8.45 percent. Should this prove to be the total extent of the move, it would be among the smallest rallies on record and would suggest the possibility of an imminent decline.
Another simple test is shown in Table II. It involves purchasing the DJIA on each crossing of . 177, regardless of when it occurrs and closing out the position 25 days later. Sixty-seven percent of the sixty-three signals were profitable with an average gain per trade of 1.8 percent. This equals a compounded annual rate of 18 percent.
-47-

DATES WHEN THE 1G DAY OSCILLATOR ROSE ABOVE ,177 AND THE SUFSEGUENT 25 DAY % CHANGE PREPARED BY DELAFIELDt HfvRVEYf TAEELL (KART66)
DATE DJIA DJIAt 25 X CHG
tlAR 8 1949 JUL 13 1949 SEP 13 194Y 34N 9 1950 JUL 27 l’?;O SEP 15 1950 NOV 20 1950 DEC 28 1950 FEB 6 1951 APR 14 1951 AUG 2 1951 SEP 10 1951 DEC 6 1951 NOV -‘6 195.’ AUG ;O 195; OCT 21 1953 JAN 15 1954 SEP 15 1954 NOW 12 1954 MAR 28 1955 FEB 14 1955 JAN 7 1958 HAR 11 1958 APR 21 1958 FEB 24 1959 AUG 17 1960 NOV 10 1960 JAN 12 1961 JUL 10 1962 AUG 20 1952 NOV 7 1962 JAN 8 1963 JAN 13 1965 JUL 13 1965 JAN 12 1967 JUN 19 1967 APR 8 1968 OCT 21 1969 JUN 9 1970 JUL 20 1970 AUG 26 1970 OCT 6 1970 DEC 3G 1970 AUG 24 1971 DEC 7 1971 JUL 19 1973 SEP T’S 1973 JAN 4 1974 FE8 27 1974 OCT 14 1974 JAN 6 1975 UAR 11 1975 JAN 5 1976
JUN 21 1976 NOV 24 1976 NOV 15 1977 APR 17 1978 AUG 3 1978 JAN 5 10-79 iIfl E C 6 i979 JAN 17 1980 UAY 27 1980 DEC 26 1980
176.09 176.71 173.24 181.59 181.01 186.36 194.68 203.53 206.37 216.87 235185 230.83 231.53 231.20 235.34 247.36 254.62 252.75 156.18 255.08 261.89 273.89 275.35 275.13 256.23 270.34 182.44 293.79 275.32 257.67 273.74 281.37 286.72 291.07 350.63 357.42 377.10 397.32 412.Pl 422.78 485.66 515.10 449.87 442.35 455.92 444.35 450.72 461.06 602.91 602.9.4 616.54 592.1s 612.01 617.78 628.50 651.86 586.01 601.90 612.86 588.k2 615.75 645.20 569.88 676.62 886.85 882.93 876.97 894.26 829.95 851.56 884.54 901.29 884.42 907.82 846.88 807.29 700.16 711.66 733.91 759.58 760.47 760.68 782.45 777.38 802.54 874.79 904.13 883.83 857.40 910.81 906.68 864.46 901.04 968.54 880.23 820.40 863.42 858.03 673.50 624.92 637.20 708.39 770.89 815.71 877.83 957.19
1007.45 984.13 950.96 1004.65 841.78 813.93 773.82 855.34 886.87 907.74 830.73 822.33 835.07 863.57 863.57 868.77 791.55 872.27 966.311 932.15
* SIGNIFIES AN INTERVENING SIGNAL CkUSECl AN EXTENIlED HOLDING PERIOD
THE TOTAL c’ERCENTAGE CHANGE IS 106.859 THERE WERE J 3 s I G N A L ‘4 OF THESC 4:. i)F: 67% WFRE PROFITASI-E ON AVERACE ?? IlAYS WERE sFEf!r fN rlik tlAi?hET EACH SIGNIlL A’.JtF:fiCiEIl k 1.7% GAIN $10000 IM.C’ESTED UN C-ASIA 5IZtJf’; F’:C,‘HL: S ‘273-‘0.;<
0.35 4.82
* 2.38 * 4.55
5.09 2.21
-0.14 5.11
-0.73 -0.04
4.18 -0.04
1.54 4.02
-6.41 2.79 1.52 1.94 5.36 2.39 6.06
* -1.67 -2.54
2.29 0.00
-5.49 0.94 3.72 2.71
-4i02 4.78 1.01
-0.44 1.97 2.60 1.89 2.65
-4.67 1.64 3.50 3.03
-0.65 * 8.99
-2.2s 6.23
-4.66 * 7.49
-6.80 -0.62 -7.21 11.17
5.81 9.04
-2.31 5.65
-3.42 8 10.53
2.35 -1.01
3.41 0.60
* 10.20 -3.53

It can be seen that a high reading on the lo-day oscillator of advances minus declines has startling implications for the intermediate-term trend of the market. Dividing the difference of advances minus declines by total issues traded neutralizes the effects of the rising secular trend in total issues, resulting in a consistent range of values. An analysis of these figures provides a consistent measurement of market psychology even through such diverse periods as the “pleasantly-dull” 50’s, “go- go” ‘60’s, and “viscious” ‘70’s. There would appear to be no reason why it should not prove equally valuable in the “who knows” ‘80’s.
i
-49-

intentionally blank
-5o-

NEW DAILY TECHNICAL MARKET INDICATORS
FREDERIC H. DICKSON Goldman Sachs & Co.
and
WILLIAM P. LIVESEY CompuServe , Inc.
There are many manipulations of stock price data which are basically simple in concept but which would be impossible to undertake with- out the availability of computer data bases. A prime example of such a manipulation are breadth indices based on advances and/or declines over periods of longer than one day. Such an indicator, with a half- dozen years of its history, is explored in this article by Fred Dickson, a long-time MTA member, and William P. Livesey of Compuserve, Inc.
INTRODUCTION
The advent of computer-based stock market data services has provided the professional technical market analyst with an amazing array of quantitative
i tools which can be used to develop new indicators or test existing theories. The purpose of this paper is to present an example of an intermediate-term timing indicator which could be readily derived only with the use of such a data base.
NEW DATA SERIES
Since November, 1980, CompuServe Inc. has made available via time-sharing several series of technical market data derived from a daily screening of its stock price data base. Among these series are the following items for each of the major exchanges (NYSE, AMEX, and OTC) :
1. 20 most active stocks 2. 20 largest gainers 3. 20 largest percent gainers 4. 20 largest losers 5. 20 largest percentage losers 6. Stocks which have risen each of the last 3 days 7. Stocks which have risen each of the last 4 days
- 51-

8. Stocks which have risen each of the last 5 days 9. Stocks which have fallen each of the last 3 days
10. Stocks which have fallen each of the last 4 days 11. Stocks which have fallen each of the last 5 days 12. Stocks which have set a new 6-month high with the old
6-month high set at least 2 months ago (upside breakouts) 13. Stocks which have set a new g-month low with the old 6-
month low set at least 2 months ago (downside breakouts) 14. Stocks whose current low is at least half a point above
yesterday’s high 15. Stocks whose current high is at least half a point below
yesterday’ s low 16. Stocks which went up on current volume double their
average 17. Stocks which went down on current volume double their
average 18. 20 largest dollar-volume gainers 19. 20 largest dollar-volume losers
The information provided from data items 6-17 is of particular interest as these items are not readily available in the financial press. In addition to publishing the names of the companies which fall into each category, a daily summary of the number of observations for each category is presented for each of the exchanges. CompuServe has indicated that it is in the pro- cess of building a masterfile which will present the results of each daily screen by showing the number of observations for each item in a sequential array updated on a daily basis. This file is being designed so that it can be easily accessed and the data incorporated into models for testing pur- poses. At present, historical data is available only for data items 6 through 11.
NEW SUPPLY /DEMAND INDICATORS
i Over the years, much attention has been given to the advance-decline line as an indicator which shows how the typical stock is performing at a specific point in time. Often this series has provided clues to significant changes in the market structure, particularly near market peaks. Recent experience showed this to be the case in January-February, 1980, September, 1979 and September, 1978. The availability of data for stocks showing advancing or declining trends for three, four, or five consecutive days presented an analytical challenge to the authors. Could an index be formed using this new data which might enhance an already useful tool?
The authors began the experimentation process by first generating historical data to establish, on a daily basis, the number of NYSE stocks which had risen and fallen for three, four, and five consecutive days. This historical data was produced for the period between January, 1974 and December, 1980. The cumulative advance-decline lines based on three, four, and five consecu- tive days of advances and declines are shown in appendix one for this time period. From this data, it became apparent that these indices tracked closely with the one-day advance-decline line. However, they appear to be subject to fewer whipsaws in both up and down markets than the one-day A-D line.
-52-

The authors next focused on identifying relevant cycles using the five-day A-D line. After some experimentation, it was determined that a simple 25- day arithmetic moving average was a reasonable smoothing factor for this series. The smoothed data for issues advancing five days in a row and for issues declining five days in a row was then plotted against the Value Line Composite Index for the period extending between January, 1974 and Dec- ember, 1980. These charts are shown in exhibits one through four.
While the statistical significance of a procedure involving the application of fitting techniques to a fixed set of data might be suspect, we believe that the practicing technical market analyst might find the following obser- vations derived from analysis of the data to be of interest. All references to the number of stocks advancing or declining are to the 25-day smoothed series as noted above.
1. Significant market troughs were signalled in September, 1974, November, 1978, and March, 1980 when the number of stocks advancing for five consecutive days fell below five and the number of stocks declining for five consecutive days simulta- neously rose above 40.
c 1. 2.
- 3. 4. 5. 6. 7. 8. 9.
10.
2. Less significant but important indications of an oversold market were signalled when the number of stocks advancing for five consecutive days fell below 10 and the number of stocks declining for five consecutive days rose above 30. Periods when this occurred are listed below along with the subsequent performance for the market (as measured by the Value Line Composite Index) for the next six and twelve months :
Signal Dates
4125174 to 516174 5121174 to 5130174 7115174 to 7124174 8127174 to 9125174 12112174 to 12123174 8115175 to 8128175 II11178 to 219178 l-118178 to 11122178 10122179 to 11112179 316180 to 419180
% Price Appreciation Next 6 Months
-23.4% -21.7% - 9.2%
25.7% 61.8% 25.2% 23.7% 11.6% 3.2%
35.4%
% Price Appreciation Next 12 Months
-4.4% 9.0%
18.7% 30.6% 45.5% 20.8% 12.5% 15.0% 30.4%
3. A rise in the number of issues declining for five consecutive days to a level above 15 generally signals the conclusion of a market rally. Extended rallies are also signalled by a crossing of the advancing- issues line and the declining-issues line. Between 1974 and 1980, we did not observe any significant market rallies which occurred with the level of declining issues above 15 and in a rising trend.
-53-

EXHIBIT ONT:
1974
f
5 w.w- so.00 (
9 F
- 75.00- 75.00 5
e - ! I 70.00- 70.00 i
SS.W- 6s5.00 Y 60.00- 0 ; s5.w-
60.00 - 2 55.00 - > 50.00- so.00 s
4s.00 I 1 I ’ 45.00 ES-1 l-74 W-2S-74 LuY-O7-74
I JUM-18-74
I AuGOl-74
I Se-Is-74
I OCT-15-74 DEc-Os-74
r 55 $2
1 (25 day moving averages)
- ,' ' ,7 I a\ 4' rl'
w-00 1 = so.00 n 1 A
t
s5.00
s0.w < F s
75.00 r I ! !
75.002
t
70.00-
Y SS.OO-
3
tj sOO.OO
! i-,---vi:::i
> ss.oo-
1
so.00 ;: f!
55.00 r:
1975
--
so.00 ; I I I I I ' so.00 JAN-O2-75 FEB-12-75 UA-27-75 WY-O@-75 JW-23-7s
1 1 I AUGOS-75 SEP-17-7s OCT-29-75 DE01 1-75
Fg a (25 clay moving, averages) m=
z; !I0
H
4s 4s 40 Lt 1 1 35
,- n i ', 3
*‘Jo -
I I I I I I I I ‘0 2 J&&-02-?J FE&12-75 YAR-27-75 WY-OS-75 JUN-23-7s AUGOS-75 SW-II-75 OCT-20-75 OEC-1 l-75
JMWNtYlTODEmeERSl

FXHIRIT TWO 1976
- #urnAn IIIAIOI
-- ~OalrMTs I**(111 - MC LIY aDYOIlR llma
84.00- -94.00
62.00- - 92.00
-w.oo;
-68.00 fi
-86.00 r
-84.00 ifI
-02.00
-80.00 ! I
-76.00 i
-76.00 - -74.00 5
g
-72.00
70.00 f I 1 I I JAN-OZ-76 FEB-12-76 MAR-26-78 MAY-lo-76 JUM-22-76
I I I I ’ 70.00 MG-w-76 SEP-la-76 OCT-28-76 #c-Is-76
i
(25 day movin? averages)
__ 06.00 -I - 95.00 2 - 95.00 2 - 04.00 - 04.00
6 6
-91.00 i -91.00 i
-02.00 -02.00
-01.00 -01.00 I ! I !
-oO.OO= -oO.OO= ;;: ;;:
-19.00 _ -19.00 _
-88.00 $ -88.00 $
- 87.00 x - 87.00 x
66.00 1 I I I I I I I I ’ 86.00
JAM-OS-77 FE&11-77 YAR-28-77 MAY-IO-77 JW-22-77 AM-M-77 SOD-l@-77 00-31-77 MC-13-77
(25 day moving averages)
JAU-OS-77 FE&11-77 UAR-28-77 MAY-IO-77 JUN-22-77 AUMS-77 SEP-19-77 OCT-al-77 MC-13-77
JANWRYlTOMCEYKRSl
-FE;-

EXHIBIT THREE
1978
120.00
1
4 E
110.00 ;
105.00 A
!I 100.00 u)
z s5.00 ”
fi so.00 ! I
85.00 ! I I I I I I I I ' 8s.00
J4IM-O3-7O FE&13-78 W-20-7C4 U&Y-lo-78 JU4-22-7a m-06-n sm-10-n ocwo-78 0~~42-78
7 E:- (25 day moving averages
-7O-
8 80- SO-
-0 I I I
w4-03-78 m-m-n wt-19-n w-m-78
w I I I I I ‘0 3
Jlu-22-70 mwtn SE+la-78 ax-303 #C-12-70
- #vrrvn I*AII -- #mmdrornlnrrrr - VMUELIY Wllc Ilam
130.00~ 130.00
125.00 ( 8
1979
es.00 ; I I I I I I I I ’ 95.00 JAM42-70 FE&12-70 MM-27-7s MAY-OS-70 JUN-21-70 AuGo3-7S SEP-17-79 OCT-29-79 D&X-11-79
(25 day moving averages)
a 0 i I I I I I I I I JAN-02-70 FE&12-70 U&R-27-70 MAY*-IS JUN-21-70 UK-OS-70 SE+17-78 OCT-20-7s MC-11-70
-56-

EXHIBIT FOUR
1980
--
150.00
115.00
140.00
135.00 i
100.00 ; I I I I I I I ,’ 100.00 JAN4240 FE0-12-M W-2640 yAY40-80 JllW20-80 NS-04-W SD-1640 Ocl-a-a0 DEC-11-60
A\ (25 day moving averages)
8' I 1
JAN-0240 FEB-1240 MM-26-60 MAY*-BO JUN-20-M SW-16-M OCT-z8-00 om-11-M
f
-57-

It should be noted that market declines did commence during this period before the number of issues declining for five consecutive days reached 15. However, the degree of market declines occur- ring before the index reaches above 15 generally is limited to less than 10%. Such was the case in March, 1974, July, 1975, August, 1976, January, 1977, and February, 1980.
4. Transitional markets generally are characterized by low levels of issues advancing or declining for five consecutive days. Such was the case during the second quarter of 1976 and throughout most of 1977. During these periods, the number of stocks advanc- ing or declining five consecutive days generally remained below 20.
5. When looked at jointly, the number of issues advancing and declin- ing for five consecutive days often presented interesting diverging patterns which marked a major turning point in the market. Some of the more interesting examples include:
A. August, 1974 - September, 1974. During this period, the market, as measured by the Value Line Composite Index, was falling sharply. The number of issues declining for five con- secutive days achieved a major peak, then a lower peak as the market traced through a double bottom pattern. At the time the declining issues were completing a double top, the number of issues advancing five consecutive days began to rise sharp- ly- This diverging pattern provided valuable confirmation that a major market trough was being made.
B . August, 1978 - September, 1978. During this period all the market averages were advancing rapidly. However, the number of issues advancing for five consecutive days formed a peak on August 5, 1978 and began to fall in spite of the strong market. By mid-August, the number of issues declining five consecutive days began to rise. This diverging pattern contrasted sharply with the market averages and suggested a top might be forming.
C. March, 1980 - April, 1980. A distinct change in sentiment was revealed after the market set a new low on March 27, 1980 following the Hunt Silver Folly. At that point in time, the number of issues which had declined for five consecutive days was at a record level. The next day, this series moved down sharply. Simultaneously, the number of issues advancing for five consecutive days increased dramatically. Within a couple of days, the diverging pattern began, apparently pointing to a major trough.
CONCLUSION
The new data series identified above should provide some stimulation for further work on the development of new market indicators. While the work done by the authors and presented in this paper has hopefully provided
-58-

some interesting insights about the market behavior over the last six years, we believe that the reader should look at the results of this work as a source of new hypotheses about market behavior rather than a presentation of sta- tistically conclusive theories. We hope to continue our research applying more of the new indicators which have been introduced and present the results in future papers.
-59-

CUMULATIVE ADVANCE-DECLINE LINE BASED ON ISSUES ADVANCING OR DECLINING 3, 4, or 5 CONSECUTIVE DAYS
APPENDIX ONE
3day 4day Sday
4A?V 5nay 3day 4day 1,l 11. Juil-13-l. -3212 -1.11 1.a 121 ,""-‘.-I. -3339 -1S.5 312 1.1 Ju*-,I-1‘ -35.3 -1.35
1‘ .6 JW-‘tl‘ -3115 -1131 -.a* -3 JucIcl‘ -4.1, -‘I,9
5day 3day 4day I St*-03-7. -9314 -5‘19
SEP-O.-l. -..I. -5‘1‘ SEI-O5-7‘ -94.. -3‘92 stf-04-1‘ -9SOl -5203 If*-09-1‘ -*.t. -321A sff-lo-l‘ 4502 -521. SE*-11-t. -9.23 -52l3
SfP-12-14-10093 -I... sfI-13-t‘-10‘3s -,*..
st~-l.-t‘-lo.19 -5153
sf"-ll-1‘-lo.l, -5111 sf?-1,-7‘-1052. -511.
SE?-19-1. -102s‘ -5.3s SE"-20-7‘ -1001‘ -1.01
jf,-23-7‘ 4.5‘ -5.1) If@-w-7. -9.93 -1311 SfP-ZS-1‘ -,111 -s110 sE~-*Cl‘-lolz3 -3.52 SE*-21-1. -10213 -SST2 sEF3I-l‘-lo.I‘ -Il.‘ oc141-1‘ 4402s 403.
'ocl42-74-10922 -II01
1 ocl-03-1‘ -10.1~ -,I14 IMl-or-14-11021 -.I,2 I #147-1. -10.11 -5ll~
L ocl4a-l‘-lo.2‘ -MAO I Kl4F1‘ -104.0 40“
. OCl-lO-l‘-1,3“ -5SlS 1 act-Al-1‘ -9.11 -5355 ' ocl-1.-l. -925S -3131
ocl-‘5-l‘ -9“. 4.5‘
ICI-u-1. -,I‘0 492‘ act-17-14 -,*** -4901
act-‘I-l‘ -9221 491, act-21-14 -.,.. 4OO3 act-22-7‘ -1914 -4,“ Ml-23-1‘ -,.I1 -.,I.
act-24-1‘ -WI, -‘MS I Ml-25-1‘ -0.10 -4980 ' OCl-ZI-1‘ 45.2 -514,
ocr-29-1‘ 4“‘ -515.
OCI-30-1‘ 4322 -49,‘ act-31-l. -,A24 492,
l O"4l-lr 4131 -4133
no"-OCT. -w.s -.,23 aa"-OS-l. -90.2 -4.11 1014*-1‘ -9111 -.,a, *01-01-l. -,oo, -.,‘I "w-11-1. -,l,, -4.3.
IO"-‘l-l. 4L.l -4114 .O"-12-l. 4‘1, -4.0‘ 00"-13-1‘ -,,,I -4.5, WV-‘4-l. -,,I, -.?I‘ *u"-,s-l. -,~‘I -‘I*‘ *01-‘I--1‘ 43,. -.923 """-,c.. -..a. _..a.
5day 3day -27.3 *O"-20-l. -210.
-1.0.2
MI-21-1‘ -2,21
-1,212 yI"-22-l.
-2*23 e‘,,‘,
.0*-21-1. -2131
-1.12, .o"-2.-l‘
-21.1 -‘00,,
MO”-21-l. -2,‘j mo1-29-l.
-,ws -.*0.
-2,9. OEC42-14 -991. -3033 off.-03-1‘ -,,2(, -311~ ofC4C1‘ -,,,,* -3101 OEC-OS-14 -1,,5, -3109 DfC-act* -,0,*3 -3193 ofC4F7. -111,. -30“ oft-10-1‘ -1,151 -2951 YC-11-1. -‘I,,, -29.5 OEC-12-l‘ -*,,*,
-2921 WC-‘3-1‘ -‘O,,, -2,“ MC-‘Cl‘ -11‘2, -3003 OfC-11-1. -3111, -3101 UC-lI-7‘ -111.1 -3lAl at.-19-1‘ -11121 -321. YC-2cI‘ -11313
<?# ;c;zEi; ii;;;;
-3212 oft-27-1‘ -112.S -32s1 oft-30-1‘ -1123, -3152 WC-31-t. -2992
-1,,r, JA.F12-TS
-I,., -‘o(q)
JAHS-15 -2101
-1,392 JAI+Ott5 4.0
-271, JAwt-15 -959. -2139 JAN-OClS -9.39 -2121 JA"4ClS -9323 -2129 JAI@-l,-15 -,I,‘ -2711 JACl3-15 -21‘. JAll-“-15
-2llA WI-15-75
-2135 JAO-‘A-15 -211s JAe-11-75
-21.3 JA”-20-l) -217. JAN-21-75 -21‘0 JAU-22-15
-211‘ JAN-23-75 -2‘,9 JAM-29-75 -2‘,, JAC2l-75 -2‘11 JAC2.-l5
-2‘5, J4m-29-1s -2.4‘ JAM-30-15 -2991 JA"-3,-l, -2194 ff HS-lS -2‘15 Cf.-a.-IS -2.2, Cf.-OS-,5 -2.13 PfB-oCIS -21Sl .fbOl-l5 -... ‘ .=.-.a-*.
-1292
4day Sday -29b
-5.1. -29,2 -5‘3‘ -3m15
-I421 -3,l. -1312 -299‘
-o*o -29‘3 -5294 -293,
-s3,2 -29.1 -9351 -29.9 -I.21 -29.5 -551, -30‘3
-,I20 -3121 -5.1. -3115
-SO, -31,*
-*.*a -319‘
-I,23 -3‘9,
-I,09 -II*3
-51.3 -3199
-sea1 -32‘2
-5192 -3222 -5092 -322A
-5911 -32.2 -5912 -325,
-59,. -32.1
-59Il -3259
-S972 -3255 -5933 -3253
-,.,I -32‘.
-*to. -31.0 -5‘50 -312‘ -5319 -3.3.
-50“ -I,.5 -49.5 -27.. -41.1 -2709
-‘l‘5 -2‘.O
-,I31 -4‘51 -259. -1.51 -‘5‘l -2113
-1519 -44,. -25.‘ -13.1 44.7 -25,.
452‘ -4.45 -2.95 452‘ -4.41 -2.93 -05,‘ -,“3 -2.92 - -,,I, 4.4, -2.*j
-I.,. -..‘I -2.1‘ 4202 -431‘ -2.52 -1.05 -“1l -23.6
-1.1. -3909 -2271 -10‘0 -3.,‘ -2‘52
-‘WY -35‘9 -2OTA
-,I,, -3.15 -199,
-“P. -3311 -19“ -,I,0 -33“ -1911 4.30 -32.1 -‘I')‘
4355 -3110 -18S9 _
2::: 3::: :::::
may .A”-21-1‘ IA,-2.-l‘ “A”-21-1‘ 91,-2,-l‘
u,-2I-1. A,"-01-1‘
AP,-O2-1. A,.-13-1‘ A?+04-l‘ AfI45-1‘ A?,40-1. Afl-OV-l*
:::-:t:: - - API-‘5-l‘ A,,-IL-14
A?A-‘l-l‘
**n-‘I-1‘ A,.-lV-l‘ A”,-22-1‘ API-23-1‘ *.,-2.-t. A?,-25-1‘
Am-2.-l‘ ,.a-29-1‘
AII-3*?‘
AAV-Ol-14 "11-02-1.
"A"43-1‘ nA1-0*-l‘
Ill?-01-1‘
IA"-OI-7‘
:::::'l::
11"~13-t‘
"A"-14-l‘ .A.-lS-1‘ .A”-‘.-,‘
,A”-17-t. ,A”-20-1‘ ,A"-21-1‘
111-22-T. .A”-23-7‘ "Al-2.-l‘ ,A”-2,-l‘ .1.-29-l‘ 111-30-l‘
“A”-,‘-,‘ JW-Oft‘
JW-04-l‘
J""45-l. J”*-04-l‘
JU.-Ol-1‘
JUtI-‘O-l‘ JW-“-1‘ .a*&. a-..
IS3 Ial -I
-4.9 -.99
-29‘ -*95
-139 -A32 -*9.
-5.4 -2.9
-225 -2.3
-29.
-231 -130
-9‘ -I,3 -*.a -121
4‘
-19 -351
-*.0
-103 -191
40, -.,a
-115‘ -12.S
-122. -1123
-r:::
-732 -4.2
-320
-159 -1 9, 9‘ 5l
13. 303 ‘0‘ .39
‘15
5a2 ‘9%
1.. .I5
101 .*o
3.0 272
22.
-13.
-3‘5 -4“ -411 4‘.
-330 -191
-1“
-1.. -157
-1A2 -1.3
-.o -92
-111 43
-73 42
-129 -21‘
-310 -4j2
-453 -5‘3
-515 -.35
-*12 -.2. -505 -5‘1
-415
-305 -199
4.
5: 15 at
125 111
2‘. 2a1
32,
331
.09
.‘I ‘II
‘58 319
3‘0
-l53
-0.l 451
-951 -11.2
-113, -1153 -1112 -3193
-121. -1233
-1332 -1‘0. -14.3 -1,s. -1.31 -1t13 -11.1 -1t., -1159
-11.. -11‘1 -1.1. -1AA‘
-‘NO
-1.1‘ -15,O
-IS*3
-1519 -151.
-1‘41 -1151
-‘ISA
-1932 -19.1
-1.“
-1927 -1*03
-la@‘ -1115 -s.*t
-1.9‘
-2112 -21.. -2212 -2322 -21.. -2.11 -2.A. -23.A -2.13 -2.1‘ -2lSS -,“*a
-236 -5.0 -1“
-110, -1.40 -‘I.5 -“I3 -130. -1.4,
-1‘1‘ -14.1 -14.‘ -1.0) -127. -11.5
-1011 -3202 -‘SO, -1.w -2.07
-2.01 -2.19 -2.23 -25‘. -23,2 -23“ -23tt -2.31 -25‘I
-24I2
-2531 -2.5,
-2.1‘
-3030 -31‘5 -3312 -3s5.
-Il.,
-39.2
JA”-OW1‘ JAN-‘O-l‘ J.M-‘l-l‘ JAM-‘4-l‘ JAM-IS-,‘
JAN-lb-?‘ JlN-11-1.
JAI+‘ I-14 JAN-21-l. JAM-22-7‘
JAM-23-t. J.“-2.-t‘ JA”-25-l. J.N-2.-l. ,.*-IF,. JAY-30-l. JLY-31-1‘ FEfl-01-74 FEbOCl‘
sta-05-14 FE.-O.-l.
FEI-0,-l. FE94,-7. l E e-11-14 l E.-12-1. FEblf14 Ffa-14-v Fta-15-1~ CE ,-19-l' l E*-20-1.. fEa-21-v FE.-22-1,
ic.-25-v rE9-2.-l
FE”-21-t *El-2a-1 l ‘-01-1 .A.44-l 11.-05-l U.-o.-, .AR-01-l “AR-00-l “A*-“-,~ .A”-12-l. .*1-13-t. “.“-1‘-1~ Ill-‘S-14 *Al-‘,-74 IA,-19-14 IAl-20-l. IAl-21-l‘ “4.-22-l.
-1
-100 -1‘3
-19, -2“ -111
-10
-*t -“
-55 -4.
-4, -39 -21 -2. -22 -14 -21 -.I -10
-120 -1.1 -39, -231 -2s. -2t, -301 -301 -292 -2S9 -208 -13.
4.
-ii3
41)
-451 411
-514
-550 -,I. 4.5 -*5, -.39 -599 -55. -410 -4,. -4.. -113 -1.2
-1039 -1‘11 -1270 -12.1 -1211 -11.1 -1132 -1120 -113* -11t9 -1113 -1‘9‘ -1251
-1299 -1392 -14“ -15.3 -“.Z -17.2
-1905 -I.*% -2,‘s
-2022
-2,39 -204,
-2014 -2011
-199,
-1913 -1131
-159, -1.92
-1‘29 _....
-“ -139 -1.4 -205 -22. -2‘S -25la -212 -2.. -2,. -2‘9 -23, -211 -1.. -19, -2‘9
1::: -SW -510 -591 -501 -555 -53* -53‘ -522 -323 -532 -I“ -5.9 -59. -.I2 -.,I -111 -1..
-1.3
-0.1 -93, -94, -9S. -912 -.I, -911 -91. -9.1 -934 -M. -ll9 -113 4.1 _...
rurio-7‘ JW-21-1‘
Jw-2.-l. JUN-2S-1. JW+2.-1. J"Ic2,-1‘
::ZK::
OX::
wc4S-1‘ JUL-O.-l‘
w:-:~;:
Jan-11-t.
%-:f:: - - Jw-‘Cl. JW-11-1. JUL-‘I-t‘
JUL-‘9-1‘ JVL-22-7‘
JUL-2tl‘
'2~:~:: JUL-2.-l.
JU-29-l. Jut-30-1‘ JUL-31-l.
AMI-1.
AU‘-02-1‘
Al&-05-1‘ LUG-O.-l‘
:u~o~;: AUt49-1‘ LUG-12-l. AUS-13-1. Auc-l.-7*
LUG-15-1‘ A"+‘b-l‘ ALIS-I,-,‘
Ala-20-l.
AW-21-1‘ LUG-22-t.
Auc-23-l. A"c-2‘-l‘ ,uc-27-7‘
.uc-2,-l.
.".-2Cl4 .,tc-l--v.
-92“ -4.91
4“‘
-.A95 -4133 4.25
-Sll, -5301
-IS25 47‘1
-590, -‘153
:::::
-.13* -66Oa 4.1‘
-*323 -.2,3
-*2., -.‘3l
-A064 -595‘ -5113 -5133 -50.1 -.141 -4.3. 4100
-.a19
-1025 -7IS9
-.9.2
-A.32 -““
-.,I9 -ASO‘
-A.99 -71‘5 -1351 -19.‘ -,I,, -,I.‘ -79.7
-@I‘% -,.2,
4.22 -@IO3
-,9?9 -92.4 -....
-203. -2191
-23II
-2331 -23.4 -2‘02
-2.a
-2571
-2123 -I,30 -2921
-31,,
-32‘. -31‘1 -,.,I
-3‘3‘ -3393 -3333
-32.9
1::::
-3119 -3101
-3I.S -3Il2
-3021 -3‘39
-3293 -3.M
-3.25
-3711
-31.4 -3139 -1‘
31
.A 1‘
.A *a
‘23
13. 155 19‘ 209
22.
2.0
272 2‘3 2.2
-3.22
-35.5 -3.9, -3505 -3412 -3l#O -3*.5 -.‘I. -42‘S
-.302
-43.2 -44.1
-.S93 -41..
-4.25 -4930
40.3 -....
-4131
-4‘5‘
21, 2.0 192 212 1.0
43% 433‘ -.I.9
1 4day ‘-:::: -3102
-3029 -29Sj
-29“
-2,97
-2,,3
-I,95 -291.
-2991 -3022
-3033 -292. -2,32
-21.9
-211.
-2L.3 -2515
-2.91
-2.12 -2.93 -2.1,
-241, -23.9
-23“
-23.1 -2.2,
-2SIl
9A”42-1S 141-05-15 M.-,.-l9 IAl-01-15 .4.-,.-l* "Al-09-15
,A"-12-15
*Al-‘3-11 1Al-“-15
,A”-‘5-15 RAT-‘b-15 UT-19-1s IA9-20-75 U"-2‘-lS
mA"-22-l5
aA”-23-75 "A.-t,-75
UT-20-75
,A”-IS-15 MI-30-19 Jw-O2-75 JW-03-15 JUWC15 JUUHY-15 JlH+aA-15 JUll49-19 JU”-‘0-15 JU*-11-I) JUW-12-t)
Jw-‘3-15 Jim-lb-19 J”.-1 I- 15
JUC‘ tls
JUI-lFlS
JUb20-75
JUC23-IS JW-24-15
Jum-25-7S
JW-2&t, J""-2 l-15
JUI-31-15 JUL-01-15
:;x::
JuL41-75
Jul.-0c15 JuC49-7S
JUL-‘0-15 JW-1‘-7S JVL-“-1,
J”L-‘Y-l, NC-lb-15 J"I-lt-ll
J”L-1 I-l, ,w-Zl-lS
J"L-22-V
%d;ly -‘33‘A 4301 -.2*1 -42.3
-4, IS -39‘.
-3790
-311‘ -3.5‘
-3.10
-3119 -311.
-38%.
-3910 -391. -3794
-3171
-3.10 -31.0 -39.1
-3271 -3093
-3I‘. -DOS3
4day -2. ‘ -19.‘
'-1919 -1.0‘
-11.‘
-‘,I, -1133 -1.52 -1572
-15.3
-15.0
-152,
-1553 -1.1,
-1.35
-1.3. -1.2)
-159, -19M -15.1 -1.1‘ -1398 -‘I.*
-1195 -1‘19
-12.S -1331 -1.01 -“l, -1.9,
-1.5. -l“.
-1.31
-1315 -1323
-1225 -1031
-9,‘
4,‘ -,I.
-.9.
-.,I -*IS -‘I3
-127 -1.5 -1%.
-129 -..I -9s. -.I3
-..2 -.‘.
-5OI
-1‘. JW-23-15 %& 5day 4day
-.I -11‘2 J"L-24-15 -.?*$a -1‘35 JUL-25-75 -3223
-1‘12 JUL-2B-lS -36‘9 -AU0 JVL-2.-15 -3730
-10.9 J”L-,I-,% -3.3‘ -1015 JUL-$‘-I% -3,f.
-99S AUt41-IS -3,19 -9“ A"G-O‘-15 -39.0
-91) Luc45-lS -.29l
-9‘5 As-O.-l5 -45.0
-,O, AUMl-15 -4.1‘ -,Ij,A"G-OC15 -.727 -9jj,A"‘-II-1S -.I00
-95OIA"‘-12-75 -4752
-9...Auc-13-15 -.I‘. -*‘I:.uL-‘cl5 -.,I2
-9.0!A,,S-15-15 -.,92 -92.I~~30-15 -.,91 497I4uc-19-1S -493. -,.3,,lJc,-20-15 -51.5
-a$. A"C-21-1, -550.
-?,9'A,,A-22-15 -5503
-tj% AW-IS-11 -S.‘9 -704. AU,-2.-l, -54‘0 -132 A,,+2l-15 -9‘0% -l,1.AlJc-2,-75 -53.9 -122’.uc-29-lS -501‘ -a*1,str-02-1s -49,. -mz:st,-I,-,, -.*s. -.*9,SE,-o.-ls -90‘9 -,7zlsEr4S-l5 -SI2.
-,13iSE"-01-1, -50.5 -.53,sE~4*-15 -515.
-,l,(sf"-‘O-75 -Sj33
-*.‘,sf"-11-15 -55.1 -135l‘E~-‘2-15 -)..I
-..11Sf"-1,-1S 41.3
-1011 -123. -1390 -193, -1S9, -1.23 -1b.O -I‘.. -11.2
-1923
-20,) -21).
-2102
-2OI9 -2099
-2‘13
-2101
-2‘30 -21.3
-221. -232.
-217‘
-23,2
1::::
-23‘2
-22‘9 -2235
-2‘9. -2‘0
-22‘.
-221‘ -22.3
-2352
-2.3‘ -2919 -251.
-2.3,
-2.9‘
-270. -2‘72
-2.21
-2519 -2532
-2SZl -25‘0
-2SO. -2S.9 -2.1.
-21.. -21.6 -27‘7 -2.,, -2S2.
-2.51
-353 IKl-‘o-l, %I "$x9 5-dl"y19 5day
-.I3 Ocl-‘3-15 -52S2 -2333 -1279 -13. ocr-*r-,5 4‘39 -22“ -12,.
-,I2 Ocl-‘S-15 -S,,, -2230 -1219
-9.9 Of.,-‘Cl5 499, -2119 -120‘ -9,. act-‘l-l5 -5103 -211. -119. -991 ocI-2o-ls -4911 -21.. -11a5
-10‘9 CC"-21-75 4921 -2135 -11‘9 -103% Otl-22-l, -‘1,2 -2119 -1‘59
-185. OCt-23-7S -4.2. -2021 -11.5 -“a‘ 0C1-2.-75 -4‘1‘ -200‘ -1‘32
-11.0.oC,-27-7s 4599 -1997 -112.
-12Il oc,-2I-15 -4S.9 -191‘ -1135 -1235 or,,-29-15 4‘,, -2011 -1‘2‘
-122, 0r,l-30-15 -412‘ -2031 -113*
-1231 OCl-31-l, 4.10 -2071 -1150
-12.1 10”43-15 49.1 -211. -1113 -123A~NOI4ClS -,(,I -22I9 -1211 -1233 ;*ov-OS-15 -5029 -22‘. -12‘. -12S51*0"4cls -‘IA* -2215 :;:::
-12.2 n#O"-01-15 -4190 -2‘49 -129,,"0"-10-1, 4ll5 -2‘3‘ -1213
-131‘ .*o"-“-l5 4l35 -2112 -“,3
-132‘ wow-12-15 45.1 -2I.A -1‘51 -1330 “0”~,3-l, 4‘1‘ -19,. -1‘3‘ -132, "O"-“-15 -429, -193% -1122
-1291 *or-,l-1S -4252 -1.l. -1097 -1273 MI-‘,-,, -‘2,9 -1.12 -108‘
-12.5 *0"-‘9-15 43‘5 -1903 -1011 -12.1 .,O"-20-l) -“,t -1932 -110‘ -1229 *0"-21-,5 -45.1 -19.‘ -1‘11
-1220 .*0"-2,-lS -*,9, -201‘ -1‘3‘ -1233 .no"-2s-l5 -45,‘ -2112 4;;:
-12.4 *0"-2.-lS 4‘5‘ -19,‘ -121, "01-2,-l, -432, -192, -11‘6 -1323 ofc-ol-t5 43‘0 -1,*. -11,‘ -3352 MC-)2-,5 -4.2, -192S -1‘01
-3391 OEC43-15 -4.4‘ -203, -11.1 -14.) oEc4c15 -519, -21.. -1‘1. -14“ otc-OS-15 -5‘0‘ -2353 -1253
-1.4, oEc4,-ls -S.,S -24.2 -132‘ -“,I otc-09-15 -55,. -2.93 4;::
-1.4, oEc-‘O-l5 -55‘0 -2.,I
-1.3, OEC-II-IS -,I21 -24‘9 -135. -139‘ OEC-12-1s -1.1‘ -24‘2 -135‘
-131, OEC-‘5-15 -5‘92 -2.2. -133'1
-13.1 0fC-I.-l5 -5.3, -2‘01 -13‘S -‘31@ oEC-‘l-l, -5,‘. -23.2 -1297
-1390 OEC-‘Cl, -5‘10 -2293 -1218 -14.1 otc-‘9-15 -53.0 -22.‘ -12.1 -1“‘ OEc,-22-,s -5j9, -221, -12.0
-I"2 DEC-2j-IS -5253 -229, -126, -1.10 OEc-2.-,5 -,,P‘ -229, -11.5 -1‘4% OEC-2.--75 -493‘ -2249 -12.1
-1.0‘ OEC-29-l5 -4,‘) -21‘2 -12.. -13.0 ,ltC-,,-15 e“,, -21.3 -1217
rfa-11-1s c&12-75 wa-As-75
eta-14-75 Ffa-la-75
rfa-19-75
FEO-20-1s FE ,-21-l,
-‘I23 -1.09
-1100 -1l.l
-112.
-1100 -I‘.‘
-A‘*‘
-1111 -1129 -1132
-1739 -1131 -‘Al9
-1.59
-1,22 -1511 -1531 -‘)I, -1.93
-1.,l -1.4. -1“‘ -1.3, -1422
-1.1‘ -1.10 -14,‘
-59l2 -SW. 4905 -5191 -5.29
l f ,-2‘-15
FE ,-25-75
FE O-21-15 FErn-21-75
CEbltlS "AA-fj-tS lAl-04-15 aAl-05-15
aAh..- l 41147-15
94m-lo-lS .A.-‘1-15
.A"-‘2-15
.m-13-75
IAR-“-15 :::a-;;
.4.-19-l,
.A”-2tlS
.,.-2,-l, . ..-I‘-.5 .A.-25-15 “A”-2ClS .1.-21-l, a*,-ll-l5 .m41-l5 .I.-OI-15 *m-01-15 .I"-,.-15
.113l-IS A?*-Otl5 ‘P.49-15
AI.-‘0-75 AM-11-75
A""-‘Cl5 A*.-‘I-15
.,.-lb-l*
A".-11-15 A?.-11-15
APl-Lj-15 API-22-l,
.I"-23-,5 .,a-24-15 LPI-25-I, LPI-2.-I5 LPI-2+,5
A~.-,o-IS W&.-01-,5
-5IAl -A,00 4211
42Sl
4131 -1957 -5150 -,.I1
-9S..
-S..l -121, -1003
-5‘11 -5110 -Sl23 -.,91
-41‘1 4199
-9911
-5.92 -9,o.
i
-3154 -33“ -3.9, -3s95
-1Y.5 -3.30
-,.9‘ -3‘29
-3351
-,I.,
-2..o
-2.lS -2‘3,
-2279 -2199
-2.93 -20.7
-211, -2‘IS -229‘
-23.3 -2293
-2‘7‘ -‘*I‘ -1*w
-‘I,‘ -1.97 -II,,
-19.l
-2.21 -II91
-5490 -9S.l
-53.4 -529,
-5101
-2.12 -2.2‘
-2.31 -25ar -2979
-15“ -151. -15‘8 -1923 -1%‘~ -15‘1 -IS31 -1359 -159) -1.13 -1‘15 -1,9*
-I*,‘
-1..1
- -54,‘ -2.01 -5S2. -2..I -5.1‘ -2119
-51*1 -211.
-9m.9 -2.29
-so53 -2.2.
-I‘.* -2,,. -5391 -2.59 -5133 -24.9 -493‘ -232‘ -.,a. -2232 -4‘55 -21,‘ -..2, -211s
4531 -20.1 4523 -2929 -455. -29.) -4‘5‘ -2013 -.."9 -20.1 -‘..3 -1‘10 -‘,‘5 -21.0
-‘I%, -2‘32 -472. -2123
-irrcstr-‘.a -SW‘ -,52~,E~-‘,-l, -.I93 -S‘9litr-‘,-ls -41.4 491‘1fb19-15 -5.4.
-.9,,SEP-22-1, -5‘11
-49‘ SEP-23-15 -5.21 -.97 SE,-2.-l, -5‘0.
-53,:5fr-2S-lS -,S,‘ -9i9~St"-2~15 -5415
-5“ sf*-29-75 -5S.3 -503 str-30-l, -5‘15
-472 OCT-01-19 -*.02 -40‘ OC,-o2-75 -‘,,2 -,9* fJc.l-03-15 -.09.
-395 or,,-O.-l, -5,)‘ -39. oc,-0,-l% -5‘13
-41% OC7-00-t* -55.5 -472 of,,-09-l, -,.a*
-iur
-129A
-1235 -12*9 -1‘11 -111‘ -117. -1190
-1101 -1191 -1222
-1212 -11-9
-515 -.,5
-6O-

CUMULATIVE ADVANCE-DECLINE LINE BASED ON ISSUES ADVANCING OR DECLINING 3, 4, or 5 CONSECUTIVE DAYS
APPENDIX ONE (CONT’D)
3day 4day 5day 3day 4day Sday 3dav 4dav 5dav Jaay 4day * J&y 3day 4day
- OK-ii-is 4‘11
- J.+Oz-1, -44,. JACOS-lb -4Ul J.*-oc1, -3520 J..wl-7‘ -3‘27
JAN-08-7‘ -2.19 J,,49-TO -21.4
J,W-‘2-1O -2.43
JAC‘3-1‘ -232. JAM-J.-l. -21S.
J.a-ls-7O -201, JAI-lb-l‘ -‘,,I
JAW-‘9-1‘ -174‘ JA”-Z.-l‘ -1150 J.C2‘-TO -1434
JAN-22-TO -2434 J,(c2*7O -134‘ JAN-2.-l, -3395 J..-2?-TO -I,.,
J.“-20-TO -1.05 J..-29-11 -Mb
-204O -I..*
-1112
-1sms
-1330
-1141 -1.10
-0U -022
-121
-4‘1 -,23
-I10 -44‘ -30. -333
-2.1 -2s4
-2‘0 -‘lb
-121 -7‘
1;:
is9
2:
213
2Sl
:::
41* 4lO
411 4.. ST*
011 7.7
WO .‘3 1s: 473 ‘40
,3s
l 23 ‘1‘
S#( Ml
‘40 131
13O ‘a.
,01 ‘42
“9 O2‘
-‘,,3 1.5-22-10 -233, 4.0-23-10 -1.9, ,A,-24-1, -1.1, a..-2S-10
-0,s MI-24-1‘ -,,5 a..-29-70 -*,a Il..-3t10 -5.1 ..I-31-10 -ss* .M4‘-1‘ es,* .,“-.2-1‘ -4,) AM-OS-14 -4.. *[email protected]?‘ -420 .P.-IT-l0 -30s .~R4tlo -341 .f.-otlo -330 AM.-12-l‘ -271 ,?I-L3-TO -2S3 ,I,-14-1‘
-247 ,f,-l5-?O -24, If,-19-1‘
-203 .f.-2tlO -‘,I A?,-2‘-7O -1s2 AC,-22-w
-117 .f,-23-?O -22 WI-IO-IO
-2 ,?,-Ll-1O -4 .?I-Z.-l0 -4 .*a-29-10
4 A?.-3@-1‘ -, *.142-1‘
9 Mtob-1‘ 3‘ Mv-o5-lo 40 [email protected], ,3 ,.1-01-1, 14 1.1-‘0-7O
211 (1.1-11-1,
147 aA?-12-TO 219 “41-13-1‘ 21s ..9-34-1‘ 200 “.Fll-1‘ 2SO ..tJtl‘ 23s Ml-ltl. 219 “Al-2.-l‘ 20s 1.7-21-TO 1.9 9.9-24-10
‘IS 230 40s 4“ 44, 421 3s‘ 32‘ 2..
z% 4s2 4s3 2.7
-2.s -IS0 -0.‘ 4Sl
::::
“2 143 11,
3, 44
-1s3 -202
32 -425 -St* -492 -434 -24.
-13 0
-41
I’:: -112 -sse -4.0 40,
1.0 rrr-s-1. -914
‘1‘
O21
112 147
10s
1‘3 110
110 090
002 71*
1.1 744
114
125 32‘ 24. 2.1
::: 33‘ 43‘ sss SO@ SW 522 4‘S 430 41. 310 34s
291 2‘0
311
314
::: s43 414 311 314 273 203
2: I.2
49
-.. -44
-39
-23 m
-2s -9.
-1s.
-211
‘I* JU”-‘,-lb ‘*‘ JU”-II-TO
2‘0 JU”-‘4-TO
22s JUr2S-IO 240 JW-lb-l‘
240 JUn-1l-lO 230 JU”-‘t?O 233 JW+2‘-7, 235 JU”-22-10 325 JUI-23-IO
23) Jut‘-24-10 250 JU”-2S-1, 213 JW-2.-l. 24. JUc29-10 224 JU”-3t10 144 JUL41-1O
93 JUL42-TO
ST JUL-04-1‘ 42 J&k-07-IO
,3 JUL-O.-l, 1.‘ JUL-W-lb ‘34 JUUL-‘2-1‘ ‘7’ JUL-‘3-TO 199 JUL-14-l‘ 2.5 JUL-lS-14 192 M-lb-7b ‘6. JUL-1FlO ‘4s JUL-2C10
‘31 JUL-21-TO
1.0 JUL-22-TO 9s JUL-22-TO
0‘ JUL-2ClO ‘4 JUL-21-10 45 JUL-T.-TO
‘04 JUL-2*lO
‘32 JLN-3tlO
1‘9 .UG42-70 JO. .uc-o3-70 319 ,UO-04-1‘
130 AUWS-10 99 Au‘-00-1‘ 10 .u.-09-I, 74 AUO-JCTO
70 43
.utll-I. AU.-‘2-TO
‘9 Au.-13-10 -JO AUO-‘O-l‘ -5s AU‘-‘1-14 -75 .uo-lcl4 -19 ,UO-‘9-T‘
-73 IUC-20-70 -41 AU.-23-l‘ -74 WC-24-l‘
-309 .Uc-2S-l0 -131 AUO-2O-7‘
-15. WC-21-IO
-1.04 -1313
-100s -a10 -1‘4 -051 -443 -249 -213 -200 -20. -2.5 -132
-14
:: 99
1:: I43 29. S.2 OS. TM 71‘ 11s 502 3M 3‘0 2‘1 313 312 215 143
2. -1
1 19
102 124 223 139 22‘ 132 145 lS2
191 ,.T-2O-lo -11‘9 109 I,?-21-T‘ -1200
‘97 .A?-20-l‘ -1112 234 JU.-01-IO -11‘0
24‘ JU.-02-1O -1071 220 JW-O3-TO -JO‘?
23‘ Hb-lb -1154 200 JUYT-7‘ -1340
‘07 JU”-OCT. -1.0. ‘1. Jua4C7‘ -1sss
IS‘ ‘93 190
:::
2‘9
‘7‘ -14
-‘IS -0.S
-111
-111
-112
3day 4day 5day 3day 4day 5de fE@4CIl 2119 1920
f E 0-09-11 2OO4 1095
ff B-10-17 ‘9O2 ffo-11-11 1021 ::::
CEO-24-11 ‘100 113s FECJS-71 1112 ‘13O
ff0-IO-71 1004 ‘144 fEb‘1-11 1.13 1159
CEI-‘0-11 1025 1145
ffa-22-n 1130 ffl-23-17 1439 ::::
FE.-2C77 1S23
ff o-2s-11 13l2 ::::
fft2C11 12O2 .,.41-l? 1323 :::
,.,-02-n 1392 lS12 l .543-11 ‘491 2541 ..n44-11 15lO LO‘4
.,.41-T? 1“~ “‘1
,.040-n 1125 10.0 nrr-at11 1012 2Ol4
MI-lo-n 1.~1 10‘3 MI-lb?? IS09 2O5S
..I-14-n 1113 1004 a.,-IS-n 10O0 2148
a,,-‘O-l? 2003 ,A,-11-n 2074 ::::
,A,-10-11 21.5 1094
1.1-21-n 2.5‘ 1.*1 a,,-22--n 1977 10SO
l 4tlbTT 2033 ‘,F3; 9,.-24-T? Jl0O
0.e2S-11 1515 mm-20-T? 1 s9. %
I,,-29-1? ‘3l3 lS59
I..-35-11 23.5 02. ,A,-31-11 1250 2493
.rw1-n ‘241 ‘50‘
4ra4t11 324s 1401
,fbo5-71 ‘I.. “05 4n4clT lW4 1450 AIR-01-11 1.42 1430 AfO-11-11 1141 ,441 ,frn-12-17 13.1 IS30 .f,-13-17 5549 1‘11 Am-‘4-11 10,‘ ITS9
.f.-LS-IT ‘93‘ ‘IO3
ym-:; ‘994 ‘009 - ,9.9 19.0
ICI-20-77 ‘9ll 192s
Afe-21-11 190‘
.I.-22-11 1I“ ii::
APa-25-1, lS22 1103
.II-2O-T? 1240 WI-2,-l, ‘22‘ ::::
.f,-20-77 ‘324 1Sll
20;
Ml
315 4“
550
‘2‘ “0 4‘1
‘10
t::
040 OO3
119 001 9.I
:::: ‘090 2090 JlSl
x009 9s.
023 145 009
ii:
401 411 330 310 201 259 215 209 3.1
::: 22S
::: 279 3Sl 4.1 4‘0
434 421 3‘5 337 225 ‘TO ‘4‘
110
:::
421. 5S2
1oa
“I -1,‘ .“b-30-7‘ -104 -1S7 ,UO-3‘-TO -‘I0 -100 5Ef-01-7O -315
-41 5Ef-02-TO -20,
-23 5EbO3-10 -I# 41 5Ef-07’7‘ 0‘ ( If?-OCT. 1::
1.9 ( 5Ef49-TO 339 335 , SEf-20-TO 1a9 14s .5EP-13-l‘ 13 ‘I, .Skf-‘4-1. 41 111 .5f?-11-l‘ 3‘ 37, , Iff-JO-TO ‘00 I93 SfP-‘7-7‘ 204 22‘
I
IL?-20-l. 4.3 234 Sff-21-10 125 249 5E,-22-10 @la 2SS 5Ef-23-TO 93‘
2‘2 Sff-24-7‘ 099
2‘. 2.9
I
5IC27-TO 003 5Ef-2C10 0‘4
3‘9 SEf-29-l. ?@I 3s3 ,5Ef-3t7O Sl‘ 399 a741-7. 423 oLl4C1‘ ii: 420 a74s-1‘ 04 4‘S Ocl-0O-lO -01 307 al-w-1‘ -1‘0 303 0C7-0C1‘ -234 342 ai-la-24 -Mb 332 0CL1-ll-TO -041 321 ocl-13-TO 411 3‘. ocl-lCI~ -144
24. DC?-‘S-IO 292 1 0c1-2.-10
-122 -I‘9
III al-is-14 -05s 2‘0 .Cl-2t1‘ -ST2 203 OCI-23-10 -Ol9
293 WI-22-1‘ -132 3.0 0Cr-2S-TO -037 341 0C?-2CIO -042
30‘ 0Cl-21-TO -129 33, acl-).-TO -411 y, ocr-29-10 -499 291 .OV-.‘-1‘ 4.2 s.4 49-03-1, -390
32‘ “W-1*-? -301
323 .OWbS-1‘ -430 322 “W-O.-10 -491
303 00v4t14 -134 210 ew-1t1, -92.
229 “0,-,1-l‘ -954
143 MU,-12-T‘ -4‘0 I#4 not15-1‘ -912
0. *o*-IO-1‘ 10 WV-11-74 1:::
. _ -_ _ . _ _ _ 95 909-19-10 -1;:
2‘3 “09-22-70 ‘41109-23-TO ‘51 394*09-24-10 2s‘ 241 Lov-2O-lO 35s 2.bmw-2Clb 430
‘03 212
3‘1
it: 4@1
403
4u 414 420 447 4.9
540 01.
O75 1‘5 133
1‘9 la?
1O9 179 17s
100
TU a00
OS0 010 902 9so 91‘ 901
lo.9 1.07
999
992 901
it: 901 949
940
9O9 9O3
9O9 914
994
9O9 9‘3
911 MS
931 922
91) 932
946
lil 030 094 905
913 924
_ _ - -. _ . 213 ma.-W-1‘ bib .-_. __ . . 222 ~c.-ol-16 3il 20s #u&.2-,. .3. 92‘
953 ___ _- .~
234 OEC-W-1‘ Iii
244 OEC-0CTO 134 29s OLC-07-7‘ 942 WJOEC-w-10 1119 B33 WC-OF1‘ ‘2SS 391 #c-1.-10 ‘42‘ 442 MC-33-1‘ ‘5‘1 411 WC-‘4-1‘ IO50
401*c-u-1. IT49 491 ac-lO-~O 1119 4.0 02c-11-TO 1712 4s5 0EC-20-l. 1454 .33 WC-21-1O ‘410 395 MC-22-l‘ lO30
$4. YC-23-TO 371T 2000Oc-ZT-TO 1054
a.9 ICC-22-7‘ 2010 22, MC-2FlO 2‘01
29, OEC-30-T‘ 2301
155 0EC-31-I. 2431
1lI . ..42-7? 2003 1.4 J.HCn 2440
(3 ~.045-11 2495
1‘49
:::: 1310
I..‘
lSl1 1513 iO3l
JbSl
1OOO 1.34 lb‘2
1‘23 “40
1111 1791
IO39 1931
::::
21.4
::::
2os4 2051
20‘0 2005 ‘999
::::
2020
2025
::::
204O
205s 2001
2023 39.4
‘900 IO93
‘092
10,s 19‘9
1929
J,ll-30-1, FE,42-TO fE0-03-TO
fEl44-7‘
fE0-05-TO fE0-0O-TO
FEWFTO l EC‘0-7‘
tto-11-1. fE0-‘2-l‘
N-:;-;;
FE,-1F1‘ FE0-19-T‘
. ffb20-l‘
ft,-23-lO fE0-2ClO
f LO-25-TO fEO-2O-lO
CEO-Ll-TO 1.441-14 8.5-02-10 *.143-10 *.n44-10 n.n45-,O ..94.-1. *.*49-l‘ IAl-1t1‘ *,9-1l-TO
M:‘g-;:
- !A$%~~
a,,-1ClO
-.s2 -014 -442 -22. -203 -200 -300 -3‘5
-O# 42
57 -17
13i
AM ‘IS
‘31
‘7 J,*4O-71 2410
I‘ ,A.-01-11 2410
19 ~,rltll 25‘. 14 Jm-33-17 2474 ?I J&.-12-1? 2299 09 ~,~l~ll 2234
I‘ JAElC11 2249 51 J,C)?-I? 2342
I. ~,.~clCll 2309 54 J,“-‘9-11 23‘0 OS #m-20-11 23“
111 J,“-21-17 23S9 112 J,W-24-71 2310 I,, JAR-LS-71 2454
1;: 5“
:::
BJO 113
3OO 301
349
3‘0 104 ‘I1 242 310
490
2:
212 19‘
220
193
130
130
119 12s
155
15, 1*0 TO9
2:
I.2 321
210
243 241
___ . ‘2, J,“-i&l? 2427
1.. J,“-27-11 232‘ _-. 11 JAI,-it?? 2‘9O
13 JAC31’1l 20TO 4, Ft.-@‘-71 2.11
24 ff5-02-17 2182
23 ftO43'71 2121 30 fE,*-77 214O
‘I rrs-rt-n 2‘50
3day 4day 5day 3day 4day 5day 100 092 ‘11
031 so.
520
4..
4s5
430
413 393
339 332 320
US 320
330 320
ii:
340 324
37s 404 022 4‘2 131 712 707 194 OOS 02‘
034 *TO
O9k
903 900 0.9
817 0O3
040 010 002
793
104 792
(0. 0‘9 02.
UO
00s WI
119 190
SO4
.2?
950 ,f,-29-11 929 I,?-02-71
,2, 1.143-71 093 ,,?44-l?
014 ..,45-11 ,‘2 1.740-71 ,oo MI4Cll 002 I,?-1Cll 0Ol ..I-22-11 0Sl ,,l-12-11
,4‘ l r-13-n 014 l ,T-lO-lT ,I‘ Mtll-11 1‘2 ,A?‘-10-71
15‘ Mtlcn 154 MT-20-l? l,, a,?-23-11
1.9 m.v-24-17 023 1,9-2S-11 020 Ml-2O-7.7
025 ,.9-21-n 0a5 .,9-31-l?
uo H1-11
:;: ‘SF-:: OO9 Jua-ob-TT
093 JUtI-01-71
::: 2ix::
920 JW-10-71
09) JUC13-77 0‘0 JuLlb-ll
tt: zz::
,,l JU.-‘1-11 1‘5 Jam-2t11 ,.I JUC21’77 ,43 WI-2+-97 14s Y)23-77 720 uc2cn n5 Juc2l-Tl
12O Jw-20-71 71s wuc2tn
149 lul-It11 1.1 JUL4‘-17 043 ,UL45-17
09‘ JUL4C11 9‘9 JUL47-ll 934 J”L4ClT 94) JUL-I‘-,,
939 JUL-‘2-11
900 JUL-‘3-11 .O. JU-‘S-T?
025 JUL-“-11 ‘05 JUL-19-71
194 JUL-20-77
I..3 159s 1134
1900
2055 2100
2bT9
::::
2021
2e14 2092
22OO 233‘
2311
2310 2110
194s
lS9. ‘392
1231
1u2
: ::
::::
‘301 1.49
030 JO42
“94
‘030
1932 2.50
213‘
:‘::
2414
2‘00
2590 2Ol2
2OO9 &30
E::
24.2 IO34
1‘30 1110 11.0 ‘IO5 1950
1992 2990
,997
‘913
19*1 1913
1982
2024 210‘
213‘ 2140
2094
1912
2010 JO03
1511 140‘
lb@2 I.?.
::::
1114 1O31
1‘5O 1100
Its3
‘19‘
::::
19O0
::::
209s
2135
K:
::::
::::
22OO
2103 219S 2I.4
2198 2202 2211
2227 2247
2328 2397
-61
190 JVL-21-l?
024 JUL-22-71 001 JUL-25-n 91, JUL-24-77 953 JUL-2,-71
910 J&K-LO-T, 903 M-29-11
901 .u‘41-11 9T7 ,uO-02-7?
949 .uw3-11
049 .u‘4.-17
911 .uc-.5-I1 902 LW4.-77
1.10 AUO-OFT? 1039 4utto-27
104s NO-‘l-l? 1.3‘ AU.-12-n
1,)‘ LUG-15-77 9,‘ AUO-1.-l? OS‘ ,U.-11-11
1.1 .U0-20-n 12S NO-‘9-l?
113 AU.-22-W 1‘4 Aim-23-11
122 AUO-24-11 720 Au-25-71
1.0 .UL-IO-71 1‘9 Luc-29-11
194 ,UO-3cv 01s .UO-31-11
039 5Ef4‘-71
I14 sEf42-ll oat ueacn WI SE@-.?-17 920 SE f-00-11
9O3 SEf49-11 9.2 stf-12-ll 99. SCf-‘3-77
iow 50+24-n 2oBl UCltl? 1045 Uf-ICI?
1040 Iff-‘9-T7
10.0 ltf-20-71 1.52 5t9-21-T?
1.5s LIf-22-n 1.52 5Ef-23-77 J,,‘ 5tf-ZO-17
‘04O 5f f-21-17 I..3 If.-I.-l? 2034 JEP-.29-n
la24 SEf-30-T? ‘027 0CT-03-17
1030 a,-o4-l7 10.9 oc14s-71
1.13 Ocl4‘-l7 1090 oc147-71
3190 2441
3101 24OS
i::: 2432 2300
2493 22O9 2430 2121
:::: ::::
2‘52 as9 ::::
2eos 1050 2040 ‘030
2.41 l@lb 2013 ‘02‘
2.21 1042
2.10 2.78 :::: 19.9 1044 ‘9lb 1001 ‘0‘1 2110 ::: ‘103
‘130
1791 ‘139
1119 2133 ‘139 1100
1‘00 “‘2
‘4‘0 1440 2::
‘4O2 lSl1
iii: ‘SO‘ JO22
103. 2OSl
JISB JO94 1.04 11s1
1801 LT.?
1155 1154 1543 1‘11
1395 1594 :z 1510
15OO ‘50S 2S.O 1.50 ‘SW
13.9 ass0
1220 a.02 1121 1415 1041 1311
1021 1344
10‘0 3330
994 133s *a** 13s9 1119 14.2
‘354 ‘4O3
1427 1100 1390 lS.7.
,312 OCl-10-n ‘37‘ 1130 OCT-‘1-11 ,312
‘12O ocv-‘2-V 1.90 1091 Ocl-I+?? 129 1049 ocl-‘4-17 5.2
995 act-17-n 310
930 0C7-10-17 3s.
915 w-to-27 2~4
0.3 ui-2tn 20s 041 OCI-21-n 05s
2.3 MI-24-71
052 OCT-2S-17
034 -1::
oc9-2*n -243 UO ocl-21-11 -22, 043 aci-20-n -b3
M9 0Cl-31-n 5‘ MS ,0943-n -20 **a oov42-11 -211 044 mr43-n -34s 031 mm-w-7l -335 ;z yw-D~g -139
00s @0*-)9-11 2:: u3 notatn SJO 192 109-11-77 925 741 UOt14-n 32S9
141 llo9-15-71 ‘301 1.2 mm-JO-IT ,343
131 w9-11-11 13.1
922 mar-1cn J30‘ 139 ant21-n 902
J* mt22-n 1129
172 mu-rm 2.47 T9‘ 909-25-n ,080
0‘4 ImI-20-71 ‘9.0
011 190
mow29-l? 1049 009-30-11 “01
TOO #c-0‘-11 104, 155 uC42-n ,004
145 uc4s-22 2912
139 ofc4cn 15~3 l3O 02c47-n 334, 130 0.X4.-71 1233
1.0 otc49-71 1214
009 OEC-‘2-11 ,302 l 49 otc-13-17 14.9
l 29 WC-14-n 14~4 ‘I3 MC-IS--II 1.22
‘1, MC-14-11 ,419 l 1.MC-19-71 ‘3,) b39 MC-20-l? 315,
“0 oft-21-11 1.01
‘05 00c-2?-11 111s ‘9O OfC-23-n 1310
TO9 MC-21-n 1.1‘
705 MC-to-n 1400
‘SO4 ‘499 1423 1210 1104 1.17 2424
*Ol
530
090 03‘
:::
132
139 .a2 184 135 ‘04 013 10t 000 921
2#W 1214
139O
152‘ 2511
1s01
IO09 101s
:::: 2999
1.5‘
::: llO3
::z
“99
JO32
‘SO‘ lSS2
:::: 1424
::::
JO‘5
1540 1513
1505 ISS‘
1011
I‘S9
2032 1.53 ZOO3
2O92 2.92 27.0
205‘
30.?? 3141
13s; 1S22 1311 104

CUMULATIVE ADVANCE-DECLINE LINE BASED ON ISSUES ADVANCING OR DECLINING 3, 4, or 5 CONSECUTIVE DAYS
3day
APPENDIX ONE (CONT’) 4day 5day 3day 4day 5day
.¶I JU"-i2-TO. US JU"-1,-T. ‘1. J”#-I.-TI
41s JW-lS-TO
42A JW-IA-TO .33 JW-I+10
“2 JW-20-70 “0 Jw-21-71
437 AU”-22-TO 437 JUrC2F7I
4.5 JUff-2‘-7( . ..JUCZT-71 ..I JW-2O-70
S2‘ Jim-29-70
SaS JU"-3O-71 I.2 JuC-03-TO
‘1‘ JUL-OS-78
“1 JUL46-IO ,,‘ JUL-07-TO
7.2 JUL-ltl1 733 JW-II-11
7.3 JuL-12-II
IS. JUL-13-70 OO3 JUL-I.-TO
ON JUL-IT-TO ISS JUL-I.-TO
I13 JUL-I.-,.
90‘ JUL-ZO-7I 5OS JUL-21-10
9.3 JUL-2c,O OlI JUL-zs-18 53‘ JUL-LO-71
930 JUL-2T-lI ,30 JUL-28-78
93s JUL-31-IO ,., Auc-a1-l~
9‘9 ."‘-02-,O
,,,, AUC-05-70 10.6 LUG-OCTI
‘I.2 ‘UC-01-70 1201 Auw~-lI 12,. LUG-O.-T1 12,‘ LUC-lo-75 ,201 LUG-11-10 11‘1 AUO-l.-TO
112, AU+lS-TO 110, LUG-IA-71
1O.O LUG-17-71
1OlS AU+lO-78 lOO2 AUC-21-71
lo*0 LUG-22-IO
1153 LUG-29-71 1220 LUG-2.-75 ‘21‘ LUG-75-I. ‘3“ AUO-2O-70
-- 219s 20*1
21*3 2IH
213‘
26‘I 13.1
ibs2 WL-29-71
‘35, wt-30-,ll ‘3,,AU5-31-TO
131‘ SE+01-71
1322 lEf4S-IO
‘2A1ltf4eTO ‘21s SEf-01-IO
1133SEf-OO-TO
MO SEC‘l-70 *O* SEf-12-TO 0‘7 SE,-13-70
103lEf-l+-70 71OlEf-15-70 TT‘SEf-10-70 ISSlEf-‘t75 ,S‘lEf-20-,O TS‘lEf-21-70
7SI st9-22-71
,37lEf-2S-TO 729lEF2A-70
,2‘lE?-27-TO 722 SEW21-7I
7*9lEf-29-TO
,,2OC742-TO ,3,0Cl-O3-70
,O,OC7-0+-TO ws Ocl4S-70
917OC73C70
9370c139-7O ,370c7-‘0-7O
l 340C7-11-T.
l S30Cl-12-70 l “oc7-l3-7. *Azoc7-“-7O
1033OC7-‘l-la ‘1200C?-‘b-70 ‘1*30Cv-l~7O
12O‘oL,-20-TO 124‘eCT-23-75 142*0C,-2c71
l~lAoc,-2s-7O lS33OCl-26-70
5day 3day 4day 5day 3day 4day 5day 4day
I?02 113s
1129 11.9 1632 1.12 I169
929 .*I ‘21 ‘01 s*2 1.3 ‘3s “0 709 71‘ ‘OS “7 O23 W‘ ‘10
OO3
“3
700 743
77s 00‘
0.2 OS9
092 a*.
031 IS9 AS3 ST‘
SOS
M3 ‘ST .‘I
‘I‘
‘7‘ ‘17 ‘I‘ ‘I*
.‘I
.*0
113 S41 “‘ 737
120 .‘I
aI*
,93* 9.9
3day
oEC-zF7l ,121 WC-30-77 MOO JAro3-70 1SS‘ JAW-Q+71 1.3‘
J,"-OS-10 ,391 a=;:: 90,
.I.
JAN-10-T. O
JA"-11-75 -290 JAI@-12-70 -3%
JA”-I,-?0 -349
JA"-lb-lb -3S9 JAN-IT-7I -337
JA"-IO-70 -2‘1 ,A*-19-71 -1.4
JAN-2b7I 47
JA”-23-78 -,.I JA”-24-70 -192 JAI'-2S-10 -2..
JA”-2‘-70 -27, JA+2,-70 -319
JA”-30-18 -321 JAN-31-7a -3.0
FE‘-01-70 -17‘
FEO-02-70 -*I l EO43-10 39
fLC.A-71 ‘9
;:z;;: 111 207
;:~I~:: 294 313
;:-:rl'; 24* - - 12*
fL1-lS-TO -3,
FEO--I.-II -2S. CEO-1,-T. -3AI
CIA-2x-71 -s,9
ftO-22-7I -1.2 PEA-23-T* -SlS FfC2CTA -.73
l E,-27-71 -.., CEO-2C78 -.lO
IAWI-TO -ST‘ “.(1-0*-T. -UT #A+O3-,0 43.
IA(1-#‘-TO -ii‘ I)AA-oT-TI -53‘
.A”4O-7. -101 11149-TO -3.3 Ill-l@-71 -35‘
M:-g-;: - - 1::
.A.-1S-71 220
Ill-lb78 II0 #AC-‘T-TO 313 #AA-2O-71 SW
3dav 4day 5day
21s 201 11.
‘11 113
139 ‘0‘
18 1‘
-11 -3. -47
43 -ST
-4,
1209 S1.2 S“‘ s1.s Ill2 S34O
SSZI I101
0‘2
blS0 ‘lb1 SW,
3100 3.ss
3SIl JSIA
3AOZ
3ASI 37*2
3#O2 ‘(‘2
“09
‘1‘S “19
39s.
3AIS
::::
28S3 21‘0
2701
2720 273s
273) 271‘
2792 2037
2OA2
2092
2923 30‘3
3OI3 31.4
::::
3‘12 z*os 2SSl
201a 14.4
':::
736
‘OS 397
139
-230 -2s3
-210
-20‘ -AS@
-232 -2Ot
-339 -3.3
-)I# -434
-407
17‘1 *01-l&,, 17.1 101-11-71
3719 NW-20-TO 1703 "W-21-71
17OA "01-22-70
1132 "W-2+,, ITS, "'I"-21-1. _. - 112s aor-rtii lH2 MOV-29-11
‘0.9 l ov-30-T)
1913 OEC-OI-TO lu‘otC-OI-7O
1932 OEC-OS-10
11.0 OEC-OA-IO IA32 04~37-70
“12 Mc40-70 1262 OEC-‘I-TO
‘202 OEC-12-7I “‘0 OEC-13-71
‘IS1 DCC-14-70 1‘53 OEC-15-71 1130 OEC-la-II
llbL OEC-I+70
1109MC-20-71 1196 #C-21-71 12oq Dtc-22-TO
1225 OLC-2O-II 1*39 Dfc-27-7.
127OOEC-ZO-TO 13O,MC-29-70
1344JAM-O2-19 1542JAa-03-7O 137s JAM-W-IS ‘31) JAM-OS-79 1302 JAI-O.-,, 11~9JA*-o9-19
0.1 JAW-‘O-79 *I9 JA"-‘l-19
SOlAAI-12-79 -4oJA"-‘S-l.
-167 JA"-l‘-,,
-293~~11-17-79
-370 JAC‘CY9 -471 JA"-lt79
-O“J AH-22-79 -‘2.,A"-2+79 -‘31JA"-26-79
-‘32JA”-2S-79 -Al,J.C2L-1,
-I‘# JAC2.-T* 433JAW3t79 -“8 JAM-31-l')
-‘S,fEO4‘-79
-‘IlFEO42-19 -703fECOS-79
-7l3ftCOC79
5‘2‘
I“‘ 47lO ‘30‘
‘00‘
3172 3143
3937 3939
39s3 )*A3
‘00‘
41s. ‘1“
419s 4292 4.11
‘5., ‘70.
4133
6727 “IS 3994
32,. 1‘12 ‘97)
::::
‘023
712
3‘0
-3A2 -00‘ -791
-190
lS7OOC7-27-70 16010cT-3c70
-S‘3 -550
“24OCl-33-70 1*s0"0v-01-10 l‘A‘*ov42-,A
‘A71'(0943-71 ‘7.SW93A-TO
‘72‘M947-71 172,"0940-,A
‘721"0149-70
‘729M*-10-71 ‘73?*0v-13-71
‘l33Iov-‘clO ‘1“"0"-Is-TO
-72. -.3‘
-‘Oil
-WI -.9‘
-1‘83
-139O
-1.7‘ -11.3
-010 -I97
-4“ -2%
-is3
-13, -321
-41s -3.8
-1.9 13A
280 ‘00
3‘S 310
261 IS0 -20
-207 -I33 -7.1
-179
-77‘ -sso
-336
-303 -371
-I21 -SOT
-310
“1 ‘1‘ ,I0
905 *IS
970 1@7S 12.0
130s
1*.3 ‘1M
:::: ‘3AS
1310 1.~1
,599
“W “1‘
IS21 ‘393
‘290
‘1.4 99‘
3day 4day 5day 3day 4day 5day
‘SOP “O3 1.18
‘SO4 lSS, 19a3 1.77
ITS2
1104 11‘8 1*51
201‘ 20.a
2891 2‘S)
22.0 22.8
231r 2634
2SA2
2‘29 2ASS
JUL-‘9-19 ,950 JUL-20-79 ‘9SI JUL-23-79 1.I)
JUL-24-79 2.13 JuL-2S-79 20%
JUL-2C19 2216
JUL-z?-T* 2.0‘ JUL-3ClS 24.2 JUL-31-79 2Sl‘
‘UC-01-79 272‘ AU‘32-I. 23.6 ruc-O3-79 2.4,
AUC-OC79 291s ;AUG41-79 301)
‘AW-OO-79 323‘ ‘.Uc-0F?~ 33,3
LUG-‘O-79 3,73 'LUG-‘3-79 3S93
AUC-‘4-79 379,
‘UC-Is-79 3007 AU+‘I-T) ‘0“ AU‘-IT-IS ‘003 AU‘-2C19 ‘0.1 AL%-21-79 “‘4 AUO-22-19 ‘l‘O
Al&-23-79 ‘IS9 AUS-24-79 ‘12,
LUG-27-79 ‘139
AUC-20-79 ,132 AUC-29-79 ‘111
AUC-3&T, “1. LUG-31-79 ‘23‘ U?4Jc79 ‘,‘I
lf9-0s-79 3.0‘
stc-or79 3A9‘
SE+07-79 3,32 ICI-‘O-79 3?S, lff-“-7* 37s. ltf-‘I-79 3123
II,-13-7, 3‘9, lE*-I‘-,. 3.43
SEf-‘1-N 392, lt~-‘o-1* 3.0,
3cr-39-19 310, SE,-20-W 3177
sfP-zl-l* 3000 IED-24-79 3*0,
SEP-2S-79 302, SE*-2,-79 375,
*t~-Il-l’l 3IS5 If,-*n-79 3,s, oc741-I( 3‘OO DC.-02-l, 3S5I
WC,-03-1s 35‘6 Xl-OCT. 3,35
x,7-OS-19 3*30
21‘
208
195 191
223
2S3 Zlb
31s
3‘2 3.. ‘32
‘3. ‘OS
: : :
I“ ba4
b39 ‘,I
2103
2‘02 2OI2
2lO3
2‘IA
270‘ 2101
ZlO2
2121
2712 271*
2‘3‘ 2117
733
777
a01 02s
I34
023 021
IS21 2SOl
ZSI, ZSI? 2SZI ZS‘,
2AOO
2A.2 239‘
LIT9 2s72
O2A
13O 038
I3A
03s
OSS 03*
11‘ ,.I
17. TSS
73‘ 7“ 7.1
7.1 71.
791 I.0
2SIl 2SIL
IS.2 25.1
Ml-Od-To 3199 OCT-01-19 3.1, OCT-10-m 27,‘
OCI-11-79 22.3
OCl-12-T) 2.9, ocf-ls-7* ,,s3
ocf-1.-r* ‘,I2 DC,-‘7-N ‘,39
OCl-IO-79 ,A,, oc1-19-1* 15)‘
OC,-22-19 11,s OCT-23-19 A.3 OCl-I*-79 ‘Iti OCI-zs-79 393 Ml-I‘-79 IS3 0Cl-29-79 IO0 og-;~;: 71‘
- _ I“
*0V41-7~ *ow2-79 1:::
10145-79 1.1, now-OC75 OS3 *ov47-79 S‘S *ov4O-79 ‘0‘ *Ov-oF71 391 901-12-79 T‘S woI-13-lS O7S WV-“-I* 1123
11oV-‘s-T* ,240
NOI-11-79 ,311 *ov-‘9-79 13,.
"0V-20-79 ‘32, 1101-21-79 13‘2
NO"-2%75 13SO
NOV-2A-79 “1‘
*ov-27-79 1,39 l OV-2C79 227s
WOV-29-19 2‘20 #01-30-T* 2.1, OEC-o-79 23.1
o‘sc-@‘-,, 239, OEC45-19 2.9,
OtC-06-79 2723 OEC-)I-?* 2‘SS @~c-‘o-l9 2.43 OEC-“-79 29,s 0EC-‘2-l* 29‘3
DEC-‘3-79 29,5
100 19.
2,‘.
2SLS
2.II 24.6
2503
2638
7.2 19.
IO.
133 .03 ,.I
1.5
,I2 ,a3
I‘3
*.3* LSII
232S 2023
I#51 ‘123
“SO ‘I,,
IS.5 1.7, 13.1
‘19‘ ‘0‘2
.‘2 9s2
98‘
::::
::::
1217 1223 ‘OI2
10‘1
1OlA
‘OJA ‘1.9
1211
13*1 “2‘
1‘79 1.82
1969
‘SOS ‘SW
1.9s
‘1‘8 2020
2oss 20‘1
206‘ 2‘11 21,s
22sa 2324
2312 2311
2393 2390
2451 24.3 24SI
2.46 2392
2362 236,
MC-‘4-7~ 3.10
OEC-,7-T, 311, Dfc-xc19 51J, OfC-‘9-79 30.5 MC-20-l. 2.6, otc-21-,'l >.n. - r - v
WC-24-l. 2,,*
OEC-2C79 2.0,
028 10‘ 72‘ ‘I. 133
‘11 39,
313 29.
24s ‘(8
‘40
32 3*
::
I5 11
‘00 13,
IS‘ 1“
“9
::
‘a1
“0 196
279
3‘3 339
3S2 363
374
‘2‘
“0 SI3
I91 A3I LIT
65‘ ‘I‘
703 72,
1‘9 193
9‘2 813
02 #5? 068
860 161 15,
814 129
-S3.
-Sl1 -30s
-171 -ST
3, 00
1‘3
0‘
:: 77
2s2
37A ‘20
‘lb .“
‘ZI 37‘
321
'::
-S.
-1‘. -1s.
-3‘
1::
13A II‘ 10‘ 1“ 20‘ I“ A92
130
oz* 1.2
911 (‘3 91‘
1.00
‘OII ..‘
‘IO3 1032
-729 -134
IS3 .."-21-7.
177 .A"-22-,I ,,1 (111-23-71
172 ..A-27-7"
IS, "."-2O-71 ,,3 MA--Z+71 A03 1AR-30-TO
‘I, MAR-31-71
33,AfI-O3-7I 2,. APR-04-W 2.5 API-OS-70
23,AfA-OO-18
2.1 Afl-Ol-71 234 ‘I.-10-T" 2‘s AM-“-70
27‘AfO-12-7I
203 Afti-13-70 219AfI-l+,O
27‘Af"-11-7,
2Sl ALI*-‘8-70 240 AIR-‘t,, 23, A,"-2O-,I 237Af"-2“7I
26s A."-2C71
260 A,“-2S-7. 2Ia AIR-2‘-71
2SS API-27-71 322 A?R-2O-TO 3‘. "1.-01-T,
3~bu9-02-lI 5Sl(IA943-10
2bJfA9-•CTO 2S09AV41-70 310 "*941-l.
2‘0".9-o~lI 22A8AV-1tlO ‘Io"A.-11-7.
1.O"*r-12-71 1s3rrr-1s-7r
,I, "..-‘I-,#
1s‘"*1-17-71 lS3UAV-‘O-71
lss"Ar-lF7. LSAIAV-22-70
‘SSur-23-TO
IS2 “A,‘-26-7, lASmAV-25-70
lOS**.-2c78 19*tiA?-30-TO
220”AV-33-70 2SS JUN-01-T. WIJW-02-TO
329JW‘-.I-,#
3.9JW-O.-IS 37OJU"-@T-TO
‘02JW-OC71
‘SO A30 5s2 SIT
102.
lO3S 1039
WL
‘113 10“
3rii 39,.
3IO9 37.1
ISA‘ 3239
2.3‘
2bO2 2‘33 2343
2229
2I93 IWO 2OSO
2‘11 1129
I.,‘ 15SZ 380‘
1110 2OAa
223‘ 2341
249s
2O27 2‘7.
272s 27s2
2791 27S9
:::: 3012 3313
30, 37s‘
3wm 422s
“SI ‘I?‘
“I‘
4O42 6932
5oeo
2::
s102
s210
SISA 5310
S233
1237 S366
5410 I“‘
-112 -43.
-Ill -4,s -459
-4.6 -44. -453
-4.7
-441 -421
-3.0
-320 -300 -7.9
-Z*A -319 -344 -37, -‘A2
-S32 -33‘
-ST.
-s72
-102 hII
-..a -4S9 -4s.
-4.4
-41. -325 -2.4
-110 -14,
-124
-1re 41 -,I
-13 -s.
-I3 40 -so
I.0 l 23
7.3 lb0
IS3 S@l
II3
711 902
1019
ii“ ‘0.0 iOS2
lO2S 103s
2lAI
206) 2000
19‘6 ‘I** 1923 ‘108 3129 11S3
:::: 1730
‘122 1775
‘0.1 19so
2039
ioso 3112 I252
‘011 31‘7
121‘ ‘3‘4
12OA
1.36
‘001 lI11
100‘ ‘9‘0 2041 2202
23‘9
::::
2491
2520 2O3‘ 2OM
2SM
2AOO 2.1‘
2AO3 2‘0
2763 29.9 JIZA
34‘2
3A15
3A3O
is33 3520
3uo 3321
3OA7 2906
21,s 29.3
3O39 31a* 336s
3‘33
3OO4 3*13
‘3.I
“‘2 ‘ST0
3632
1A70 lb*1 1712
,799 1093 193s 1.71
::::
::::
207I 2OIO 2OA,
2.9.
2‘23 21‘9 22“
2530
2so2 2.3s
2.S2
2O69
2A.l IS..
2SlI 2“‘
236s 2313
233) 23SS 2429
23‘9
::1 2171
220‘ 2202
222‘
:::: i332 24.9
:::: 2111 5.19
3‘22 3*3.
:::: ii.0
3919
3133 3szr
3)“
3619 3‘S? 3.9 3bSO 3.41
3,s.
3103 3132
‘0.1 ‘088
-42
-II ‘162
“07
1 zoo “SS ,912
lb22
9‘7 IS‘
-9 10
7 -4
-23
48
-113 -AS,
2‘49 27s‘
2OSO
3day
714 “4 ‘0‘
.9‘ 110 193 .S‘
939 9A3
99. w.
I.2
691 ‘12 23‘
‘30 214
621
5‘7
b.‘ 0‘1
8003
107I 1‘49 “11 12“ 1310 14‘S I‘OS IS33
IS97 ‘737
IT‘S ‘O2A
1072
,911 2O.I
1941 1.1‘
2.36
211s 2316 2391
2**1
2329 230‘
4day 5day
142 1.4 AA3 IS1
T‘S
7.3 O20
O33 0“
1‘.
OS@ 121 71‘
A23
s21 ‘92
“A
s31
II‘ I‘S
770
I30 0*1 9.. .‘I 909
‘I38
1081
::::
‘11‘ 12‘1
1211 ‘303
13.2
::::
1392 “‘I
1.3. 1.71
15.3 ,600
‘A31
IA01 159‘
15S1 ‘4“ 14S3 1.23 I‘LS 1.41
1.1‘
,915
‘S3‘ AS24
-20,,,1-30-79 ,992 -22,rAr-01-79 19%
-240 ,A942-79 ~93s -2S3lA9-03-7, ‘9.1
-2“.,74‘-79 115I
-209 l v-07-79 ‘5,) -191 ill-00-I. 12‘# -1,.(11149-T, ‘093
-112 u7-‘O-79 91‘ -I,, “Ar-l‘-7* 92, ml,@ "rr-‘,-79 0‘0 -1.0 q A’-‘S-79 IS0 -1.4 .A.-14-l. ,93 -251119-17-79 122
-33,AA9-‘0-19 950
-325 l A7-21-79 1‘22 -33,.AI-22-79 1229
-3.3 "Al-23-79 1.71‘ -3,. "19-24-79 1329
-2,2 IA,-2S-79 ‘370
-22, 117-29-71 1.01 -11, IAV-30-79 1322
-15‘ l AV-31-T* “72
-1“ JUI4‘-79 ‘89‘
-w JUN-0+79 1“‘ 4‘ JUW5'79 122)
-A3 JUICOA-7, 1‘8s
-41 Jw-@l-79 1.01 -3A JUW4I-1* 1154 -10 JUW-“-79 Ias9
S JW-12-19 1970 30 JW-‘3-l* 2067 ‘0 JUCI.-79 2‘32
72 JUn-‘S-79 21‘1 ,A JUCltl* 20‘2
‘22 JW-19-19 2017
134 JW+lO-7. 2001 1“ JUM-21-T* 200‘
IS, JU"-22-79 2212 lb, JUC25-19 2214
11, JU.-2C19 21S0 ‘90 ,"I+27-7. 21.2 2,. JUC2C79 2117
2,. JU.-29-79 2297
2.) JUL-02-79 224O 2.3 JUC-03-T. 2197
22‘ JUL-05-T. 23S2 20) JUL-OCT. 233,
192 JUL-Oq-?9 2SS9
1.3 JUL-10-79 271) 1‘. JUL-‘l-7. A.90 11, JUL-‘I-7. 2S2b
191 JUL-13-l. 2332 213 JUL-‘6-l* 2252 224 JUL-II-79 21.2
221 JU-‘O-l. 20‘.
;g-:;-;: - - %-:I-:: - - FEB-13-H Ftn-‘+79
ftA-lS-1, fE"-,A-?9
ftl-20-79 fEA-II-79
Ffl-22-7* FLI-23-79
fE9.-2‘-79 FE‘-21-1,
FEE-L.-I1 111-01-17 mAa-oz-T9 IAt-OS-19 11A+O‘-19
mA9-07-79 lAA-oO-T*
l *(I-#9-79
~9-12-79 ml@-‘3-79 RAM-14-79
@AR-‘S-79 #A@-“-7~ MAa-19-79
nAA-20-75 mAA-21-79
111-22-79
111-23-79 "AI-20-7,
“.;:-;-:
:::::z: 19142-7,
API-03-T9 ,,14.-79
Am4s-l*
AI,-OC7, ,P”-09-1. APA-10-79
A,.-ll-79 ‘,*-‘2-1~
-21 23
iii 13‘ 167 212
:: 2s2
2SA 2.4
23A
23s 2‘S
IS‘ 211
233 2“
21‘ no
277 215
2I5
301 345 3se
3). 337 3O9
I,1 239
.II-“‘l* 2092
.I&-17-m ‘9L2 AP.-*n-l* 3914 ,I*-,*79 ,131
Arc-Z,-79 IM‘ .,.-23-l. I.‘* ,*"-2‘-,. 20.‘
,I.-2s-19 2162 )ifl-Z.-l. 2lab
.,11-27-T, 2100
a- -62-

DfC-21-M
;::-;“I-;: - -
JAM-W-10
JA”-03-80
,. N-o 4- 10 Jr*-01-10
JA”-08-10
JAM-O?-10
JAM-IO-10 JAN-11-10
JA"-14-10 Jr-l,-IO JAW-lb-10
JAW17-10 JA"-,I-10 JAW-21-10
J&M-Liz-10
JAM-23-80
JAM-2440
JAM-25-10
JIM-ZCIO
JAN-29-00
;:N"-;:-:; - -
Cf b-01-10 l t~-o.-w ft tPO¶-09
7 :f@j
et s-ll~le *El-lZ-ID FEl-13-80 FEB-14-10 FE&-15-80 3702
3319 rts-iG) ffB-20-10
FtA-.?I-AD fEO-22-10 CEA-25-10
FLO-Zb-ID PLO-II-10
FtR-LI-10
PEA-29-00
"*a-Oj-a0
IAP-OI-SO
lAn-OI-A0
..I(
3
b-10 *an 7-10
*I*-IO-80 ItA@-II-110 n 1*-12-00 119-13-00
"l"-l.-oD
"AR-17-10
30‘3 1926
315s 3001 2144 2435 2lb4 1907 1791
1757 1739 1‘59
1294 75. 167
-4“ -510 -5“ -594 -7‘0
-1016
2132 2727
2621
2490
2311 21‘5
204‘
2024 19.9
1959 11‘5 15‘0
1223
03 ‘1.
‘31 511 55‘ 373
3day
2792
2.07 2793
::::
241b
250‘ 2151 3010 3417 3‘40 311‘ 3190 3938 3907 3190 3*21 ,193
3337 3977
4091 4152 4092 4099 404@ 4092 4067 4039 4005 6000 4013
4079 4053 4007 3900
CUMULATIVE ADVANCE-DECLINE LINE BASED ON ISSUES ADVANCING OR DECLINING 3, 4, or 5 CONSECUTIVE DAYS
APPENDIX ONE (CONT’D)
4day 5day 3day 4day !iday 3day 4day
2335
2334 2347 2211 2201 2190 2104 2271 2.434 25OI 27b0 2117 29b3 3005 3110 3015 30 3‘
3019 3046 3087 3102 3175 31‘1 31‘7 3161 3165
3lII 31b7 3lbb
::::
32.4
3214
3201
3142
I23 mr~-leeo -1311 111 9A4-19-II -1.01 022 AAA-20-00 -1.0. 101 IAl-21-10 -149, 773 arm-24-10 -1.7. 7b5 #Al-25-IO -230‘ 1‘2 l 41-Zb-IO -2bj2 774 n&I-27-10 -2.1‘ 8w ma-284a -3112 ii2 mn-31-10 -299‘
9,. ICI-01-10 -2545
liil APl-02-30 -2232
112I IPA-Oj-00 -2obo ll“API-O7-Io -2llb 117A lII4F00 -2194 1114 A?A-09-00 -2113 1192 APa-IO-00 -II04 llA0 AIR-ll-IO -1443 ,191 A?A-14-00 -135‘ 1215 AIR-15-10 -1420 1233 AIn-lb-10 -35‘2
,246 API)-17-00 -1*37 1251 1P~-18-10 -lb15 12‘1 ASP-21-10 -1132 12b7 APR-22-10 -175b 1274 APR-2340 -1.41 1272 APf-2440 -1247 127b API-25-10 -110. 127lWA-20-10 4.6 1277 API-29-00 -911 1200 APA-3tIO -01‘ 1212 l .r41-00 -704 12*0 m*r-O2-IO -771 1303 l v45-IO -742 1212 l r*4b-,lo -411 124‘ ~1141-10 -3‘4
1190 n*r-OI-00 -201 I154 IA?-@,-IO -221 1OIb #AT-12-10 -357 1030 mll-13-Go -3b3
.41 WV-14-10 -195 113 m*r-15-10 50
7.b ItAr-lb-IO 220 711 l Ar-ltAO 21‘ ‘II WV-20-00 322 ‘52 IAl-2l-10 322 127 WV-22-10 401 519 IA~-23-10 401 511 WV-27-10 925 313 rrr-LO-00 1130
14 “11-25-10 1143 -4 I..-30-10 1124
-14 JUM-02-10 1057 -113 JUN-03-10 1059
-131 JUN-04-10 114) -112 JU”-05-10 12‘1
211 -23, JUY-06-10
221 -2‘3 JW-09-10
lb0 -2.3 JUWlO-IO 140 -327 JUU-11-O.
24 -35, JUN-12-10
-193 -419 JW-13-10 -374 -512 JUN-16-W
-b72 -*IO Jw-17-10 -4W -705 JUN-10-00 -bI* -700 JW-19-10
-4.9 -b*O JUW-20-10 -397 -b73 JW-23-10 -2A5 -5b3 JUW-24-10
-270 -152 JUF25-10
-275 -542 Jucz*-a0
-2b4 -,2A JIM-27-10 -234 -514 JU"-30-10
-31 -493 JUL-01-10 41 -441 J"L32-IO
72 -407 JUL-O3-IO 2b -397 JUL-OT-IO
-59 -424 JUL48-10
-11 -.A. JUL-09-10
-IA. -51‘ JUL-lo-10 -151 -4.7 JUL-11-O -IO* -4.1 JUL-14-10
-4, -65, JUL-15-10 101 -.,I JUL-lb-10 113 -36, JUL-IT-10
24‘ -321 JUL-18-#0 274 -201 JUL-21-10 291 -212 JUL-22-10 317 -2bI JUL-23-10
331 -254 JUL-24-10
3bI -240 JUL-25-10
455 -214 JUL-2I-10 542 -113 JUL-29-10 545 -17b JUL-30-10
522 -177 JUL-31-00 510 -1,O DUG-01-80 532 -1‘5 luG-o4-Io ‘07 -151 AUG-Ol-IO 72‘ -105 AUG-(b-80 800 -51 AUG-OT-10 117 -33 Aus-ol-~a 12I -20 LUG-11-10 173 -5 Auc-12-10 94‘ 27 LUG-13-00
10‘1 ‘3 AUC-14-10
1214 122 LUG-15-10
1254 155 AUG-11-10
12‘0 175 nuc-19-~0 12‘3 17b LUG-20-10
1237 1,. AUG-21-10
1211 1.1 IUG-22-80
132‘ 197 IUG-25-IO
,474 1394 1514 1495
III5 15bl
1123 lb43 1.98 1‘70
2035 1741 2113 I,,4 2239 1134
2212 1171 2203 II‘0
2041 1943 :::: leb5 173A 214b lTb*
2251 1124
2321 11‘1
21‘0 115a
2.12 1123
2#‘0 II11 2307 1039 2‘14 2nw
2115 2121 2912 2219
2113 2232 2914 2253
3.41 232b
32.4 33*1 ::::
35bl 2bO3
31‘9 2711
3959 21.4
4034 2171
4.10 2*02
3.5. 203
3132 2120 3757 27Ob 37‘1 2792 3932 2101 4024 2159 4041 2914 3959 2097 3933 21‘4 39‘4 2112
4141 2543
4357 3345
4575 315I 4‘1) 3211 4‘05 3231 4‘55 3271 4751 3292 4714 3279
4.92 3249
4321 3211 4403 3154 46.9 3247 481‘ 3315
3day 4day 5day 3day 4day 5day 4535 3315
4‘52 33bA
4413 327*
211 4uc-lb-80 255 AuG-27-10 304 IUD-fl-10 34, AUC-29-I0
3‘9 SE+02-00
j,, SW-03-10
42, SE*44-00 ,,, SE+05-00
457 Sf?40-Bb
4‘2 SE+W-10 4.3 SEP-10-W
425 SE?-11-10 413 SE*-12-W 415 SEI-15-IO
4201 31;; 41‘7 3100 4425 3124
4‘11 4125 :::: 4‘15 3357
.*a3 3331 4‘13 3332
4121 33bl 5e24 3441
I126 3551 5243 3b51
54bI 3lbl
5‘21 313I 5101 39b3
5lb* 414I
:::: .a.. 4014 5420 39OI
505‘ 3bb5 43*9 3343 4191 324I 4121 317b *4b3 31‘5
4‘64 33‘2 5045 3573
52‘9 3b9‘
5414 3115 5399 31‘9
537‘ 314I
5311 3IA5
5411 3172
55bO 3914
5552 393b
54‘7 3901 5321 31‘.
5211 3714 5115 314b 5017 3bI4 4193 3110 4.3. 3491
44‘3 3373 431‘ 3302 41‘7 3202 4117 3112 41.7 3174
45bb 3204
4331 32OI 4243 3197 4trr 317I 4134 )I.,
5123
5220
5312
5323 5421
5342
1223 *ov-14-00 1237 "OI-17-10 1215 WV-1040
1154 WV-19-00 1139 WDV-20-10 1142 lull-21-10 115‘ *ov-24-00
1195 lloY-25-Io 1223 HIV-23-10
1240 rev-20-10
1244 OEC41-IO
1254 OEC-02-10
1271 OEC43-IO
1315 OEC-04-I.
11.6 OfC45-IO 345, OEC41-10
1515 DGC4FIO
35bb DLC-10-80
lb30 oft-11-10 1‘52 DEC-12-IO 1c3* otc-35-10 y: prc-16-1.
1291
1241
123‘
1191
11*1 135‘ 1422
14*4
1530
a5ba
15bl
1574
1590
1591
15*7
1571
15‘4
1534
1491
14b7
1~00 1350
1301
1259
1235
1231
12.9 1242 1245
12.1 1241
1254
1333
3‘64 L431
3795 1537 3111 1‘3*
3914 lb71 3947 1109
39‘3 1111 3I.2 3840 ::::
42‘ iE#-lb-10
445 SE?-17-00
442 ii?-lI-06 4.9 SE?-1FAO 441 SEP-22-10 454 SEP-23-BO 473 SEW24-IO
532 SE+25-00
II5 SEW26-00 ‘0‘ SE?-Z-00
‘21 SEC-30-30
b5. act-Ol-IO
A74 OC742-00
700 DC7-03-00
775 DCl-Ob-b0
1‘2 oc747-IO
,,2 DC740-IO 932 OCT-W-10 ,,I 0CT-IO-00 ,‘7 DCT-lj-IO ,,, DCl-14-00
,,I Ml-15-10 034 0CT-lb-00 $39 DC,-17-10 *31 oc7-20-10
9.6 DC,-21-10 903 OCl-22-10 *IO OCT-23-10
017 OCl-24-10
1O.I DCl-21-10 ,031 ocr-20-00 109. DC,-29-10
113, DCl-30-10 1152 DCl-31-I0 1110 r(DV43-IO 11.1 *or45-00 117. *ov-06-10
,114 *ov-07-10
11‘1 IIDV-IO-IO 11“ nov-11-10 3S.l *ov-12-10
3175 n ov-13-IO
. . . 4401 3242
4ILl ,449
51‘9 5.35
4917
III‘
4172
4‘51
4433 4377
4243
3192
34.1
2940
2522
:::: 2421
3711 1lbb 3150 lb31
3701 1593 3‘12 1572
3521 1540
34 31 1511
3352 1435
3195 1340 3802 1254
2‘64 1113 2303 I50
2211 714
2159 751
2144 72‘
.
-63-

i
intentionally blank
-64-

e
DOW VOLUME AT ALL LEVELS
RICHARD W. ARMS Greeley Securities Inc.
Dick Arms of Greeley Securitks is widely known to MTA members as the originator of the Short-term Trading Index. His research is, however, eclectic, as this article shows. In it he explores the significance of volume occurring at various price levels in point- ing out support and resistance zones.
The volume of trading taking place at various price levels can be a useful tool in determining the importance of those levels as areas of support and resis- tance. Discussed below is an example of this as applied to the recent history of the Dow-Jones Industrial Average.
I There are two separate pieces of information represented on the exhibit on
i the following page. The first, labeled “A, It represents the volume of trading at all price levels. It is derived by going back to 1968 and adding the vol- umes at each Dow level, thereby arriving at a representation of the historic levels where volume was heavy or light. Since the market went through a number of swings between the 600 and 1000 levels, there is naturally a bunch- ing of the volume toward the middle of the range with a tapering toward zero at the extremes.
The raw numbers have been expressed as percentage numbers. This is the scale used to chart the data. The percentage number represents the percent- age of total volume that took place at any particular level. For example, on the 1000 level the posting is at 3.05%. This indicates that 3.05% of the total volume which traded since 1968 was traded in the 1000 area. Similarly, look- ing at the 840 level, 10.63% of the volume occurred in this area in the last 12 years.
This chart points out some very interesting information. We see that there are two major bulges in the data -- between 820 and 860 and between 920 and 960. These are areas where unusually heavy trading occurred, whereas the
-65-

-66-

- I - I t- I A..

the areas on both sides of these zones are levels where less than normal vol- ume occurred. One would conclude that these areas represent unusually heavy supplies of stock so that at a future time as the market moved into these areas, they would represent support areas. Notice we are discussing volume, not time. This chart is pointing out areas where a buyer will find heavy supplies of stock available.
The second chart (“B”) represents ease of movement. It is closely related to chart “A” but takes into consideration how easy or hard it was for the Dow to move up or down at specific price levels during the same 12-year period.
The scale is designed for comparison purposes, and the relative levels rather than the numerical values of the various posting are what is important. This chart does not have the tendency to bunch toward the center. On this chart we can see that the higher points represent levels at which it is difficult for the Dow to move. The lower postings represent areas where movement is easier. For example, the 1040 area is harder to move through than either the 1020 below it or the 1060 above it. Therefore, 1040 emerges as an area where the Dow would be expected to encounter resistance. Another peak is the 980 zone. This should be a support area on declines and a resistance area on ad- vances . The highest peak on the chart is at 860. Historically the market has had difficulty moving at this level. It emerges, therefore, as an area of po- tential support.
-68-

INSTITUTIONAL FLOW OF FUNDS IN THE STOCK MARKET
ANN C. FAHNESTOCK Greeley Securities Inc.
Much is made of “institutional dominance” in the stock market, but precious ZittZe work has been done on actually quantifying institutional flow of funds. Ann Fahnestock explores the 1% year history of purchases and sales by major institutions and suggests some relationships between this activity and market direction.
Miss Fahnestock has been a member of the Market Technicians Association from its early years and has served as secretary, editor of the Newsletter, and as a member of the Board of Governors.
Total volume and total dollar volume on the stock exchanges have been reaching record levels, and it is the net dollars going into and out of the market which determine market direction. The net flows of capital from two specific sectors, domestic institutions and foreign investors, are the focus of this report. These two sectors of the stock market represent a significant portion of the capital exchanging hands daily. The two charts on the facing and following page show these net changes by quarter since 1965.
The “Four Leading Institutional Sectors u include private pension funds, by far the largest contributor to purchases and sales of common stock, open-end investment companies, the second largest segment of the do- mestic market, life insurance companies and property and liability compan- ies , the smallest of the components.
The combination of the four domestic institutional sectors appears to correlate most closely to the swings in the market. Of particular interest are substantial declines in net purchase activity. By selecting an
-69

-7o- / - tt)
.~ _

arbitrary $1 billion level of net purchases per quarter, it can be seen that the market declined in every quarter that this level of accumulation was not attained with two exceptions. Specifically:
Period Dow-Jones Change
3rd quarter 1966 3rd ” 1970 1st ” 1974 2nd ” 1974 3rd ‘l 1974 1st ” 1977 3rd f1 1977 4th ” 1977 1st ” 1978 2nd ” 1978
-11.1% +11.2 - 0.05 - 5.2 -24.2 - 8.5 - 7.6 - 1.9 - 8.9 + 3.0
Indeed, in 1978, for the first time, the four leading institutional sectors were net liquidators of stock. The two exceptions to a declining market, when domestic institutions did not achieve a net purchase balance of $1 billion, were the 3rd quarter of 1970 and the 2nd quarter of 1978. In the first instance the market was preceded by a quarterly drop of 13%, and in the second case, a drop of 8.9%. However, more significantly, total net purchase activity by the foreign sector produced offsetting balances, that sector accounting for buying of over $400 million in 1970 and $1.1 billion in 1978.
The contribution to common stock net purchases and sales by foreign in- vestors has become increasingly important since the 1970’s, as 1) 0.P.E .C . nations have recirculated their petro-dollars into U . S . markets, and 2) laws in the United Kingdom have become less restrictive regarding invest- ments abroad. Net purchases by foreigners reached a new peak for a single quarter in 1980, when they recorded a net accumulation of stock of $2.2 billion. Throughout the entire 1972-1980 period, total net purchases of common stock exceeded $20 billion, and much of that occurring in a period of a declining dollar. With the dollar possibly strengthening, and the price of oil rising, there would be little reason at the moment to expect a reversal of the broad trend in foreign net purchase activity.
Pension Funds were the largest contributor to net liquidation of stock in the first quarter of 1978. After reaching a peak in equity exposure of 73% of their assets in 1972, many pension funds experienced negative re- turns in the severe market decline of 1973-1974. Investment strategies were changed to produce more exposure to fixed-income areas. At the time this strategy was generally expected to produce less volatility with a lower variability of returns. For the next several years, pension funds were allocating less than 35% of net new monies to equities. By year-end 1978, less than 53% of Pension Fund assets were in common stock, as increasingly high rates of return became available from bonds and guaranteed insurance
- 71-

L I I I I ” t
I/ ! 0
l-
I iii i
i
+
C
P
t
r i I
contracts. The ratio adjustment reached a low in the first quarter of 1978 when pension funds liquidated $344 million of common stock. Pension funds then experienced equally high volatility and instability from their fixed- income investments, particularly in 1980.
In the meantime, since 1975, the S & P 500 grew at a compound rate in excess of 14% and the Salomon Brothers High Grade Bonds Index grew at a compound 5% rate. Having experienced variability in both investment postures, it seems likely that pension funds will accept volatility as a norm and settle again for an even exposure to both markets. If pension funds do adopt a 50-50 mix, of bonds to equities, it would suggest an average of net new monies for the stock market of $2-3 billion per quarter, and reaching a potential high of about $5 billion by 1983.
Open-end Investment Companies until 1970 were net sellers of stock at market bottoms, 1966, the 1968 reaction, and 1970. Although they were also net sel- lers at other times, they were always net sellers at low points. Since 1971 mutual funds have been net sellers of stock in every calendar year. From 1972 through November 1980, the net amount of stock liquidated by those funds amounted to $17.4 billion. Since 1971 the few quarters of net accumulation seem to be either at or just after bottoms. Specifically:
4th Quarter 1973 reaction 3rd ‘l 1974 at bottom 4th ” 1974 at bottom 1st ” 1976 after reaction 3rd l’ 1978 after bottom 4th ” 1980 after bottom
The most recent quarter shows that mutual funds have been net buyers of more stock than in any quarter since 1971, purchasing approximately $250 million of equities after years of selling, a turnaround is in the making.
A summary of observations from these two charts on Cash Flows include:
1) the very large swings on the part of the “Four Leading Institutional Sectors” of net purchase activity;
2) the tendency of the foreign sector to invest more and more in the U.S.;
3) the growing demand for equities from the pension sector, as more and more companies offer pension plans, and as other investment forms proved equally variable ;
4) the apathy on the part of the public towards the stock market as reflected in Open-end Investment Companies ;
5) the apparent relationship of reduced demand from those stocks (below a net accumulation of $1 billion per quarter), and important market declines, for example, 1966, 1970, 1974, 1978.
-73-

intentionally blank
-74-

Book rt?7iews CRISIS INVESTING
DOUGLAS R. CASEY Published by Stratford Press Distributed by Harper & Row
New York
Reviewed by Anthony W. Tabell Delafield , Harvey, Tabell
This review was, originally, to be honest, not intended particularly as a report’ on Douglas Casey’s Crisis Investing, but as a general comment on the spate of recent best sellers espousing what has come to be known as “disaster chic. ” All of these tomes appear to be more or less interchange- able,since they all espouse the same philosophy and mostly seem to have the same title, with a couple of multiple-choice, fill-in-the-blank slots, i.e. , “How to (Profit /Prosper/Get Rich) in the Coming (Depression/Bad Years/ Crisis /Currency Collapse) ..Their main contribution to prosperity, so far, seems to be to the prosperity of the authors. The thought was, therefore, since our clients are obviously reading these things (Casey’s book has been a best seller for some six months), we, as professional technicians, ought to have some opinion as to the efficacy of the medicine they are so eagerly consuming .
There-is, however, one feature which seems to distinguish this particular manifestation of the genre, besides the fact that it manages to break out of the title rut. It is, quite simply, sloppy.
‘. We will leave to our economist, broker, and security-analyst colleagues the task of commenting on the indignities committed by Casey in the name of their respective professions. Let us restrict ourselves, for the purpose of this Journal, to seeing what Mr. Casey manages to do to technical analysis.
In the chapter on stocks, we are given three charts of indeterminate source. The following facts are noted, not necessarily in order of importance.
1 _. The first chart is entitled, “Dow Jones Industrial Averages, Monthly Highs and Lows, 1929-1978.” We had always naively supposed that, to show monthly highs and lows, a bar chart was necessary. This is a line chart.
2. The caption states, “This chart uses descending trendlines and tells a chartist that 300 to 400 on the Dow is a reasonable ex- pectation for the early 1980’s. ” Two pages later, we get the following language.
-75-

3. The descending trendlines referred to above are as follows:
A. A line drawn between the 1972 and 1976 highs;
B. A line drawn between the 1966 and 1970 lows;
C. A line touching the 1974 low and drawn, not through the 1970 low, which would have made it fairly flat, but through some mysteriously selected point in the middle of the 1970 decline; and,
D. An almost vertical line, long since penetrated, between the 1976 high and the 1978 recovery.
4. We then move to another chart purporting to show the monthly ranges of the New York Stock Exchange Composite Index. Again it is a line chart.
5. It is not, however, certain that the line on the chart is, in fact, the NY SE Composite, or indeed clear what it is at all, since the chart shows a post-1976 low that the NYSE Index never reached or even approached.
6.
r
We then move to a chart on the S & P 400 drawn on what is claimed to be a log scale. However, a ruler quite clearly shows that it either isn’t a log scale or the horizontal lines and the numeric scale don’t match up properly. The apparent reason for the use of whatever scale it is, is to show the break, in 1978, of a trend- line beginning at the 1932 low.
7.
8.
This crucial trendline-break took place at a level in the low 80’s on the S & P Industrials, and that index has since posted a new high above 160. This.leads to yet another point.
The copy we have is a second edition, bearing a copyright date of 1980, but neither Mr. Casey nor his publisher have seen fit to update any of the charts beyond some time in 1978.
“Just because a chart seems to indicate a market is heading down (or up) doesn’t mean the market will necessarily continue in that direction. All the protests of ‘technicians’ notwithstanding, charts only tell you where a market has been, not necessarily where it’s going. ”
-76-

Enough already. It is hard to avoid the impression that Mr. Casey is doing much more than filling up space --- tossing in carelessly-prepared charts and shovelling words around like so much fertilizer, regardless of the inter- nal contradictions. For example, on page 89, we get this sentence, “Consider- ing today’s speculation in the options market, 1929 and 1968 do not seem particularly wild by comparison.” On page 116 comes, “The best means for [speculation] is through options on an organized exchange such as the CBOE or AMEX. All of the big brokerage firms have excellent pamphlets describing these markets. ”
None of the above, will, of course, trouble either the author or the publishers greatly. It simply reaffirms the suggestion that the main rationale for “disaster chic” is not to protect its adherents but enrich its purveyors. The book in question is, at the moment, No. 1 on the non-fiction section of the New York Times best seller list, which means that ,more people probably bought it (at $12.50 a pop) between 3 and 4 o’clock yesterday afternoon than will ever read this Journal. The only moral to be drawn, we suppose, is to quote the MTA Constitution which states that one of our primary objectives is to”. . .educate the public. I1 If we are cynical enough to believe that Crisis Investing is an accurate barometer of the public taste, it would suggest the Sisyphus had, by comparison, an easy task.
