journal of science a symmetrical-asymmetrical fault
TRANSCRIPT

*Corresponding author, e-mail: [email protected]
Research Article GU J Sci 35 ( ): x-x (2022) DOI: 10.35378/gujs.770814
Gazi University
Journal of Science
http://dergipark.gov.tr/gujs
A Symmetrical-Asymmetrical Fault Characteristics Analysis within
Cogeneration Power Plant in Izmir, Turkey: An Experimental Assessment
Hacer SEKERCI OZTURA , Sezai POLAT *
Electrical and Electronics Engineering Department, Engineering Faculty, Yaşar University, 35100 ,Izmir, Turkey
Highlights • Modeling of cogeneration power plant by using PSS/Sincal
• Comparison of real data results and simulation results
• Short circuit analysis with simulation software in power systems
Article Info
Abstract
The analysis of the short circuit should be understood very well in order to make correct designs
in the power systems such as the safety of the personnel and the equipment, the selection of the
safety relays, the circuit breaker selection and the selection of the appropriate conductor section.
In this study, the parameters about the short circuit and the techniques of calculating the faults in
system and the necessary theoretical knowledge for the short circuit fault to be understood better
have been given. The effect on the distributed generation and the grid which is caused by the
possible short circuit faults have been simulated by being modeled in PSS/Sincal and by using
the real grid parameters with cogeneration power plant in Izmir, Turkey. The real short circuit
fault results measured from the power plant and the grid and the results obtained from the software
program have been compared and it has been determined that there is not a significant difference
between them. Thus, it has been emphasized that it is correct to simulate before investing in a
power system in for the purpose of restrain the faults during the designing and working before
the application. It allows the designer to design new power plant as good as plan expansion of
existing power plants with higher degree of precision. Considering the prices of protection
equipment, which has a large part in system design, this way would allow designer to reduce the
cost of the protective equipment and remaining stability.
Received:17/07/2020
Accepted: 19/04/2021
Keywords
Fault calculation
Power systems analysis
Short circuit Result analysis
PSS/Sincal
1. INTRODUCTION
It is known that electricity is one of the main necessities in human life. The requirements in human life
have increased continuously and have been related to the energy demands. The need to find different energy
supply methods and energy resources has emerged in order to meet the energy needs. A new concept has
emerged in order to use energy efficiency and different resources. Dissimilar, the conventional centralized
generation, distributed generation (DG) aims a strategy in which a part of the electric power is produced
and transmited to clients with small production units allocated near to the burdens[1–4]. The widespread
use of DG not only increases economic efficiency, but also benefits improvements in energy reliability [5].
DG could be operated isolated mode (off grid) or grid connected (on-grid) [6–9].
For a power system to be practical it must be safe, reliable and economical. Thus many analysis must be
performed to design and operate an electrical system [10,11]. The widespread use of the energy resources
mentioned above causes many power systems issues [12]. For this reason, the design of power systems
using DG becomes very important. An analysis of the effects of parameters such as losses, bus voltages
and short-circuit fault currents with their connection to the grid is seen in [13]. Fault analysis is a prime
apprehension in power system [14]. Power plants must be secured against failures or malfunction in

Hacer SEKERCI OZTURA, Sezai POLAT/ GU J Sci, 35 ( ): x-x (2022)
order to ensure the qualification and stability of the production, transmission and delivery of power system
[15].
In the literature, there are many studies that showed the changes in current and voltage during short circuit
which bases on the basis of power system design. Some authors used for demonstrating fault simulation
studies and analyses on the IEEE-9 bus [16–18], IEEE-14 bus [19] and 39-bus New England System [18],
while other authors examined modeled real data based on which are substation in Turkey [20], substation
in India [21], wind power plant [17], nuclear power plant [22]. There are many software in the literature
that are widely used to perform short circuit analysis, which are Matlab [16,19,20,23], PSCAD [24], Power
World Simulator [25,26], ETAP [17,18,21,27] and DigSilent [22,28]. As a result of calculating short circuit
currents, there are studies for the selection of the protection equipment and determination of the
coordination scheme of the protection equipment. Different algorithms, heuristic optimizations and
adaptive methods are proposed on the coordination scheme for protection method [17,18,23]. Protection
coordination and methods are out the scope of this study. The use of current limiter emerges as a different
protection method. [16] aimed to find optimal placement of current limiter in a power system against the
short circuit faults. In other study on short circuit analysis, [29] showed the changes in current and voltage
during short circuit issue for protection scheme in micro grid by using PSCAD. [30] proposed fault
detection scheme used transient current by using Discrete Fourier transform. [31] demonstrated
contribution of short circuit current scenarios inverter-based voltage source DG for on-grid system. Unlike
alternating current (AC) systems, in another study, [32] proposed method used CIGRE benchmark high
voltage direct current (HVDC) model by using PSCAD software for direct current (DC) system. In another
study on fault analysis, [33] suggested fault location that used partial differential equations by using
adomian decomposition method in Matlab. The authors investigated power protection systems in nuclear
power plant in [34].
This paper aims to variation and determines short circuit currents, because simulation results are validated
with measured data of actual fault condition. It allows to decision expansion of existing power plants as
minimum cost protection devices.
In this study, the system is modeled using the parameters of a real cogeneration power plant by using Power
System Simulator Siemens Network Calculator (PSS/Sincal) software. The simulation results obtained for
the fault generated in the system modeled were compared to the measured current and voltage waveforms
as a result of a single phase fault occurring in the past. After validating the accuracy of current and voltage
changes that occur in real fault situations, other fault conditions which are single phase, two phase, three
phase ground faults in grid connected and two phase ground fault in island mode faults that may occur in a
power system were simulated, and voltage and current changes occurring in the power system during the
generated faults were observed.
1.1. Contribution
There are many studies in the literature involving short circuit analysis. These studies have contributed to
the literature with methods such as different algorithms, procedures and software. Recently, when the
effects of short circuit fault on the distribution power system are analyzed, it is seen that it is generally done
by considering the distribution generation systems integrated into the test systems. Fault analyzes
performed in the distribution power network are generally conducted with the IEEE 13-node and IEEE 34-
node test systems. On the other hand, there are very few studies that model the systems belonging to the
existing power plant. With the increase in the use of renewable energy, power plants with stochastic
character such as solar and wind have been examined as distributed generation in test systems. However,
there are a few studies the distributed generation system, which includes cogeneration power plants, which
is the subject of this study, which is widely used in the industry. Similarly, although programs such as
PCAD, DgSilent, ETAP, which are widely used in the literature for short circuit analysis, are quite common,
PSS/Sincal has been used very little. Although PSS/Sincal is used in many applications in industry, it is
seen that it is used in limited numbers in the literature. The major contribution of this research paper is
mentioned below. First, with this study, it is tried to contribute to the literature by analyzing the short circuit
of the cogeneration power plant, which is widely used in the industry, using the PSS/Sincal program,

Hacer SEKERCI OZTURA, Sezai POLAT/ GU J Sci, 35 ( ): x-x (2022)
making a unique study in the literature. Second, the uniqueness of this study is that an existing system is
modeled and then different possible scenarios and faults are occurred in the power plant. Third, the real
fault records in the existing power plant are examined, and the same system is compared with the fault
currents modeled in the software, and it is revealed that there is no significant difference in terms of design
and equipment selection. This paper concerns the by modeling with the cogeneration power plant
PSS/Sincal software, researchers are introduced to the literature by introducing a new perspective and
method.
1.2. Organization of The Paper
This paper contains total 6 Chapters. Chapter 1, after a brief introduction, literature view and contribution
are presented in this chapter. Chapter 2 and Chapter 3 show information about distributed generation
technologies and cogeneration power plant respectively. In Chapter 4, it is been illustrated short circuit
analysis basic knowledge. Calculation method of fault currents is given in Chapter 5. In Chapter 6, it is
introduction and modeling in simulation software. The case studies are given in Chapter 7. Finally,
conclusions are drawn in Chapter 8.
2. DISTRIBUTED GENERATION TECHNOLOGIES
The distributed generation technologies are divided as traditional and nontraditional. The definitions of
some of the distributed generations used most commonly are given below Figure 1 [35,36].
Figure 1. Distributed generation technologies
2.1. Applications and Advantages
The distributed generation is used to increase the reliability, stability and power quality of the power system
while boosting to grid by decreasing congestions in medium and high voltage level lines. Thus, it has
benefits for the producer and the consumer. By using today's energy resources in DG, low cost energy
production and high quality electricity can be provided. In addition, when the energy used for production
and commercial purposes is interrupted, the major financial damages that occur are prevented. Several pros
and cons that occur when using distributed generation are given Table 1 [37–39].
Table 1. Some of the DG pros and cons
Pros for the customer Pros for the producer Cons for customer and producer
Improved reliability,
Improved power quality,
Reduction in the interruption
number,
Efficient use of energy,
Lower cost of energy,
Usage of green energy sources,
Decreased line losses,
Raised up the system capacity
Enhanced stability,
Prolong tool life,
Decreased congestion,
Enhanced voltage profile
Extremely fault current,
Raised up the protection charge
Probability of off-grid mode,
Increased flicker,
Probability of over voltage,
Retrofitting charge

Hacer SEKERCI OZTURA, Sezai POLAT/ GU J Sci, 35 ( ): x-x (2022)
Decreased pollution
Enhanced weak signal stability, because of
slight of inertia,
Improved critical clearance period.
Short circuit currents, which are one of the disadvantages of distributed generation, are the subject of this
paper. As seen in the Table 1 above, increasing of short circuit currents are seen despite many benefits. It is
seen that short circuit levels in the system increase due to the contribution of short circuit currents to be
provided by the generators in the production facility [12,40–42].
3. COGENERATION POWER PLANT
The demand increase, the price increase and the reliability decrease and so on, most of the industrial plants
have shifted away towards generating their own power instead of purchasing electricity from centralized
generations. However, besides the electricity need of the factory, there may be a need for hot water.
Cogeneration can serve an appealing alternative for offices with high electric rates and buildings that utilize
huge amounts of hot water and power. As a rule, the higher the electric rates, the more noteworthy the
savings with cogeneration and the lower the back pay time [43].
At first, the heat energy is change over to the rotational energy and after that it is converted to the electricity
energy via the shaft and the generator integrated. The converted electrical energy is given to the electricity
distribution system at the 34.5 kV. In this study, electricity production and electrical distribution is carried
out with the 34.5 kV voltage level.
In this paper, different faults type short circuit currents which are possible to occur in cogeneration power
plant in Izmir, Turkey are modeled under PSS/Sincal platform. In the power plant, there are two gas turbines
each of which is at 6.5 MVA power that gas turbine coupled to the synchronous type generator. While the
produced electricity is at 6.3 kV voltage level, it is converted to the 34.5 kV voltage level by the
transformers at 6 MVA of power. If it is needed less energy in the plants, the extra electricity, which is
produced, is supplied to the grid. In case of an outage or blackout in the distribution network (grid), the
power plant works in island mode (off grid).
4. SHORT CIRCUIT ANALYSIS
When a short circuit occurs, the all considered internal impedance replaces components and an equivalent
voltage source is implemented at the fault node the equivalent short-circuits impedance of the system
electrical system.
Faults are generally divided into two broad categories in today's power systems [19];
Symmetrical or balanced faults (three phase)
Asymmetrical or unbalanced faults.
Asymmetric faults such as single phase ground, phase to phase and two phase to ground faults are divided
into three major types[44]. Figure 2(I) shows that schematic asymmetrical and unsymmetrical faults are
occurred in a power system. The distribution of faults in the electrical system by their types is shown in the
Figure 2(II). As can be seen in the Figure 2, the most common single phase fault is seen, whereas the rarest
three phase fault is seen. Different fault types scenarios were occurred and short circuit analyzes were
conducted out in Chapter 7.

(I)
(II)
Figure 2. (I):(A) The three phase, (B) single phase to ground, (C) phase to phase, (D) phase to phase
ground faults, (II): The rates of fault types
Short circuit currents, which are one of the disadvantages of distributed generation, are the subject of this
paper. As seen in the Table 1, increasing of short circuit currents are seen despite many benefits. It is seen
that short circuit levels in the system increase due to the contribution of short circuit currents to be provided
by DG units [12,40–42,45]. DG's contributions to short circuit fault currents can be divided into two main
categories which are synchronous/asynchronous generators and Inverter Based DGs (IBDG) [46]. Since
IBDG cannot be overloaded, there are negligible level of fault current contributions compared to
synchronous/asynchronous generators [31]. Since a synchronous type generator is used in the cogeneration
power plant modeled in this study, a synchronous generator is modeled in calculations and simulation.
5. CALCULATION METHOD OF FAULT CURRENTS
Traditional power systems have been replaced by system systems to which many DGs are connected today.
It is assumed that there is a fault at point ‘k’ in a network where the network and DG are located. The fault
situation occurring at point ‘k’ in the network to which many DGs connected to the network are connected
is shown in the Figure 3 [47,48].
Figure 3. Scheme of fault at distribution or transmission line supplying Grid and DG
Where; 𝐼𝑘 𝑆" is the injected current of grid, 𝐼𝑘 𝐷𝐺𝑖
" is the injected currents of DG (i=1,2,3…..j). With
asymmetrical faults, for example single phase ground fault, currents and voltages are not of the same
magnitude. The three phase current must be divided into its three symmetrical components: positive,
negative and zero phase sequence. This shows that negative, zero and positive phase sequence data are all
needed to calculate asymmetrical faults for the equipment. PSS/Sincal calculation methods are based on
symmetrical components.
The fault current occurred at the ‘k’ point is calculated with the help of the formulations shown in Table 2
by using the positive, negative and zero sequence value obtained by the symmetrical component
transformation method [49].
5%
65%
20%
10% A-Three Phase/Three Phase Ground
B-Single Phase
C-Phase-Phase
D-Phase-PhaseGround

Table 2. The formulates of short circuit currents for “k” point
Single Phase Fault Phase-phase ground fault Phase-phase fault Three phase ground fault
𝐼𝑘+
𝑈𝑘𝑎
𝑍𝑘+ + 𝑍𝑘
− + 𝑍𝑘0
(𝑍𝑘− + 𝑍𝑘
0)𝑈𝑘𝑎
𝑍𝑘+𝑍𝑘
− + 𝑍𝑘+𝑍𝑘
0 + 𝑍𝑘−𝑍𝑘
0 𝑈𝑘𝑎
𝑍𝑘+ + 𝑍𝑘
− 𝑈𝑘𝑎
𝑍𝑘+
𝐼𝑘−
𝑈𝑘𝑎
𝑍𝑘+ + 𝑍𝑘
− + 𝑍𝑘0
−𝑍𝑘0𝑈𝑘𝑎
𝑍𝑘+𝑍𝑘
− + 𝑍𝑘+𝑍𝑘
0 + 𝑍𝑘−𝑍𝑘
0 −𝑈𝑘𝑎
𝑍𝑘+ + 𝑍𝑘
− 0
𝐼𝑘0
𝑈𝑘𝑎
𝑍𝑘+ + 𝑍𝑘
− + 𝑍𝑘0
(𝑍𝑘− + 𝑍𝑘
0)𝑈𝑘𝑎
𝑍𝑘+𝑍𝑘
− + 𝑍𝑘+𝑍𝑘
0 + 𝑍𝑘−𝑍𝑘
0 0 0
𝑍𝑘+, Zk
− and Zk0 are Thevenin equivalent circuit impedances seen from the fault point impedances positive,
negative and zero sequences, respectively. Uka is the voltage of fault point in the steady state of the system
before fault. 𝐼𝑘+, 𝐼𝑘
− and 𝐼𝑘0are fault current sequences (positive, negative and zero sequences). The
contribution of DG in this obtained fault current to this short circuit currents of each DG are calculated by
the Current Divider Method. The contribution of each generator to fault current which is calculated with
respect to Table 2 can be obtained by using the current divider method.
Thevenin equivalent circuit of sequence network is obtained easily because of network given in Figure 3 is
simple and radial. If the network is loop connection type and has many connection points, Thevenin
equivalent impedances cannot be obtained directly, so bus admittance matrix have to be calculated. All
fault currents and the bus voltages after than fault occurring can be calculate by using this bus impedance
matrix. Figure 4 shows the flow chart of the calculation procedure used by the software for calculating [50].
Figure 4. Short circuit calculation procedure

6. SIMULATION
6.1. Simulation Software
Power System Simulator Siemens Network Calculator (PSS/Sincal) software has been used for the analysis
and simulation in this study. PSS/Sincal is software with designing tools for power system analysis. Power
systems analysis includes the short circuit analysis, the power flow, dynamic analysis, harmonic analysis,
protection, reliability and contingency analysis. The electromagnetic transients (EMT) let the designer use
the differential equations to model networks, machines and controllers. It offers a complete solution for all
electromechanical and electromagnetic phenomena, including unsymmetrical sequences [51].
6.2. Modeling of the Power Plant
It is utilized that power plant single line diagram is shown in Figure 5 for modeling in simulation tool.
Rotating loads, non-rotating loads and other loads were determined in the power plant. The power plant
equipments which are system loads, generators, power transformers, lines current transformers, voltage
transformers, circuit breakers, other protection and measurement devices are modeled according to the
obtained from technical service engineers at the factory and also single line diagram.
Figure 5. Exist cogeneration power plant single line diagram
In this paper, it is utilized PSS/Sincal for simulation and evaluation of existing cogeneration power plan
system. For this purpose, these are represented below the Figure 6 where loads, generators, lines and grid
connection point. The modeling has been based on the real loads of the plants, the real power of the
transformers, the motors, the generators and the impedance of the lines.

Figure 6. Simulated cogeneration power plant single line diagram
This plant has been modeled as an industrial system including electrical distribution system directly
connected to cogeneration power plant and five plants of an industrial zone. The power system is connected
to the grid by one line at 34.5 kV voltage at Batı Anadolu Power Transmission Line I–II lines. The
distribution to the plants is at 34.5 kV voltage level and it is connected with 1 km 3(1x95) mm2 XLPE type
cable, 200 mt 3x3/0 AWG and 2 km 3x477 MCM cables. The power plant has 2 Gas Turbines (GT)
connected to the same 34.5 kV bus. Each turbine has 6.5 MVA capacity and total power plant production
capacity is 13 MVA. The gas turbines are coupled to the synchronous type generator. There is a 6 MVA
power rate and 6.3/34.5 kV step up transformer connected to the each gas turbine. Base on the operating
conditions of power plant and facilities, either supplying to grid or getting from the grid is possible. There
are 5 plants in industrial zone and each factory is supplied one by one by the cable feeders. All plants have
its own step-down transformer (34.5 kV/0.4 kV) feeding each 0.4 kV factory bus.
7. CASE STUDIES
In this section, the cogeneration power plant is possible three phase ground, phase-to-phase fault
considering low voltage side (0.4 kV) and medium voltage (34.5 kV) side has been designed by using
PSS/Sincal. The simulation obtained in the voltage and the current graphs for each fault compared with the
real fault conditions have been reviewed and made simulations. The information about the occurred cases,
the type of fault, the location of fault, the mode of operation, the starting time and the cleaning fault times
are given in Table 3.
Table 3. Case studies Fault Type Fault Location Connection Mode Fault Time Cleared Time
Real Fault
Condition L1 ground fault Grid On grid 550ms 700ms
Case1 L1 ground fault Grid On grid
550ms
700ms
Case2 L1, L2 ground fault Grid On grid 200ms 280ms
Case3 L1, L2, L3
ground fault
Low voltage
side (Plant-3) On grid 200ms 280ms
Case4 L1, L2 ground fault High voltage
side (Plant-1)
Off grid
(island mode) 200ms 280ms

In order to compare the obtained waveform in the simulation results with each other, all bus voltage levels
are scaled to be at the 0.4 kV voltage level. The reason for this is that all the data from the power plant was
recorded according to the 0.4 kV scale and root mean square (RMS) value. In order to make an accurate
graphic comparison, all buses at the voltage level are scaled to 0.4 kV as if it were P.U. (per unit) system.
In simulated cases, the locations of faults are given on the single line diagram shown in Figure 7.
Case 1 (simulating the real system): The single phase ground fault circuit occurred at grid at the 550th msec
and then the fault was cleared at the 700th msec. The results obtained as a result of the simulation showed
that there were different current and voltage oscillations in all buses. After the single phase short circuit had
occurred, the voltages of L1 phases sharply dropped to about 200 volt magnitude. The reason why the voltage
does not decrease to zero is that the exact location of the fault in the network is unknown. The exact location
of the fault could not be obtained from the distribution company. While modeling the system, the location of
the fault, a point far from the power plant, was determined approximately. Because the exact fault location
was not known, the magnitudes of the measured voltages and currents were different from the obtained
simulation. The reason for this was that the loads and impedances changed momentary.
Figure 7. The representation of cases location in simulation single line diagram
The results have been shown according to the currents and voltage signal wave forms measured from the
energy analyzers at each bus. The fault was cleared at the 700th msec, the system became steady-state. The
results waveform for the single phase ground fault is shown in Figure 8.

(a)
(b) (c)
(d)
(e) (f)
(g)
(h)
Figure 8. Case 1 waveforms; a) PCC current (real), b) PCC current (simulation), c) 34.5 kV bus voltage
(real), d) GT-2 current (real), e) GT-2 current (simulation), f) 34.5 kV bus voltage (simulation), g) GT-2
voltage (real) h) GT-2 voltage (simulation)
It was seen that the current measured at the point of common coupling (PCC) point increased approximately
4 times the normal operating value which increased from approximately 50 A to 200 A in Figure 8(a). This
situation may change according to the fault impedance at the point where the short circuit occurred. At fault
during, only the results of GT-2 and PCC, were compared, since only GT-2 and PCC had measurement
results. This time, it was seen that the current of generator 2 doubled. This means that GT2 also supplied
the fault current at the fault point. Looking at the voltage results, it was seen that the voltages increase in the
phases except the phase where the fault occurred. In other words, while the voltage on the L1 line, which is
the fault phase, decreased to 200 V, the voltage increased to around 600 V in the non-fault phases L2 and
L3. This situation has been confirmed by the results in the literature and has been validated with the
simulation results.
After validating the accuracy of current and voltage changes that occur in real fault situations, other fault
situations that may occur in the power plant are simulated as case-2, case-3 and case-4.
Case 2: The 2 phase ground fault circuit occurred at the transmission line between grid and coupling bus
at the 200th msec and then the fault was cleared at the 280th msec. The results waveforms for the three
phase ground fault are shown in Figure 9.
It was designated as PCC where the fault occurs was almost there. For this reason, in case of a 2 phase fault,
the voltage in the faulty phases (L1 and L2) were measured nearly 0 V in the simulation. On the other hand,
the current measured at the PCC increased approximately 9-10 times the nominal 125 A value and supplied

the fault current close to the generators. The fault current near the generator was gradually decreased in
accordance with its typical generator fault current characteristic. In the phase non-fault (L3), it was observed
that the current was continuing normally value. Similarly PCC, it was seen that the fault currents increased
to 5-6 times in GT-1 and, it was observed that the current was remained.
The voltage in the factory 34.5 kV bus and GT-1 bus dropped from 380 V to around 200 V. The reason of
this, the measured buses are close to GT-1 and supplied from GT-1. The system was supplied to the GT-1
side to ensure voltage stability.
(a) (b)
(c)
(d)
(e)
Figure 9. Case 2 waveforms; a) PCC voltage, b) PCC current, c) GT-1 voltage, d) GT-1 current, e) PCC
Bus voltage
Case 3: The 3 phase ground fault circuit occurred at the plant-3 low voltage line low voltage load between
the low voltage bus at the 200th msec, and then fault had been cleared at the 280th msec. During the fault,
the voltage and current levels are shown as in the Figure 10. The grid and the generator units (GT-1 and
GT-2) supplied the short circuit fault by supporting each other. Therefore, when the short circuit occurred,
the currents of 3 phase sharply increased from nominal magnitude to 20 times in 0.4 kV low voltage bus.
The currents of 3 phase gradually decreased until the fault was cleared. After the 280th msec, the currents
decreased fast to the magnitude about nominal level. The system became steady-state at the 330th msec.
This means; 50 msec later after the fault was cleared, the system became steady-state. Because GT-1, GT-2
and the grid supplied the fault, there was a great increase in the fault currents in low voltage load. The angle
difference between the faults can be negligible.
(a)
(b)
(c)

(d)
(e)
(f)
Figure 10. Case 3 waveforms; a) PCC voltage, b) Plant-1 voltage, c) GT-1 34.5 kV bus current, d) PCC
current, e) Plant-3 34.5 kV bus current, f) GT-2 34.5 kV bus level current
The system became steady-state at the 300th msec. This means; 20 msec later after the fault was cleared,
the system became steady-state. This period was shorter than the 34.5 kV bus voltage level fault for
becoming steady-state. There was some increase in the currents of GT-1 and GT-2 during the fault. When
the short circuit occurred, the currents of 3 phase sharply increased from nominal magnitude to 2 times.
The currents of 3 phase gradually decreased until the fault was cleared. After the 280th msec, the currents
decreased fast to the magnitude about nominal level. The system became steady-state at the 330 msec. This
means; 50 msec later after the fault was cleared, the system was became steady-state. In addition to GT-1
and GT-2, the grid also supplies the fault.
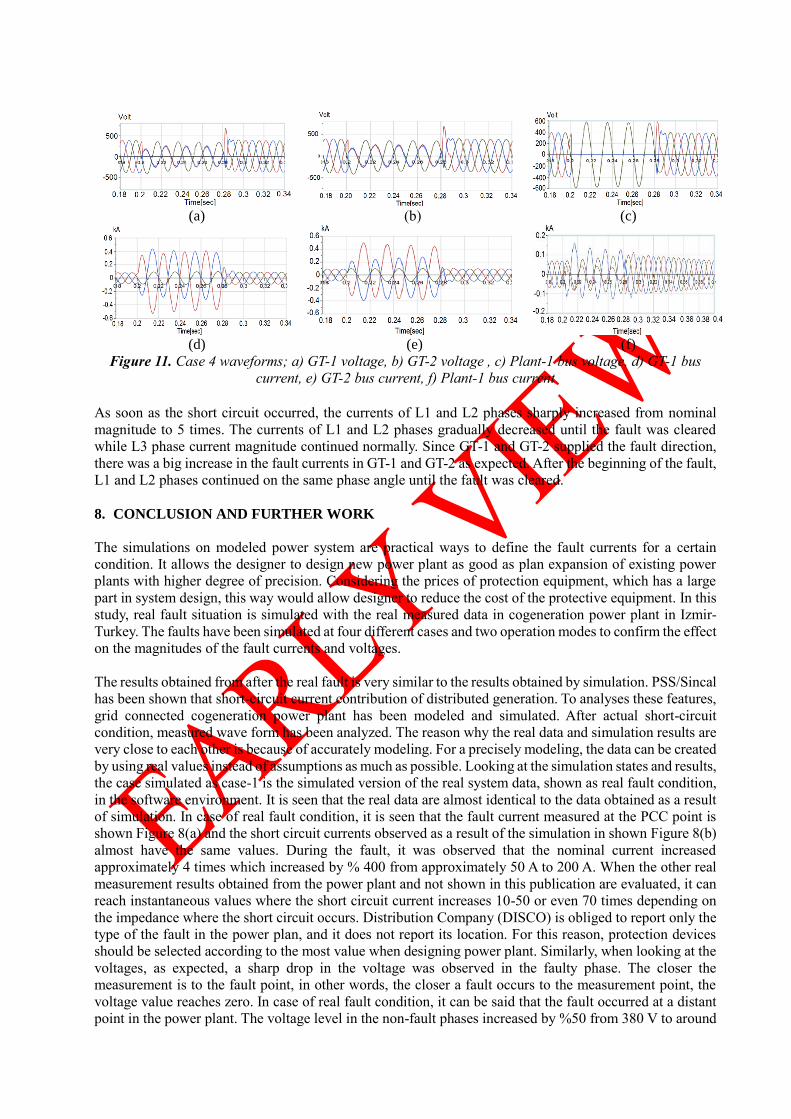
Case 4: The phase to phase ground fault occurred at plant-1 34.5 kV bus in island mode operation of power
plant at the 200th msec and then fault was cleared at the 280th msec. The voltages of L1 and L2 phases
dropped to about 200 V magnitude. The voltage levels were not zero. The DG sources (GT-1 and GT-2
generator) were very near 34.5 kV bus. There was no deviation voltage of L3 phase. The voltage and current
variations measured from the buses and the lines according to the time, when a short circuit at grid occurred,
have been shown at below Figure 11.
After the phase L1 to phase L2 short circuit had occurred, L1 and L2 phases voltage sharply dropped to
zero volt magnitude. At the same time, L3 phase voltage raised about 600 V as expected and during the
fault, L3 phase remained at constantly magnitude of 600 V. The fault was cleared at the 280th msec but 10
msec after the clearing, the system became steady-state. When the short circuit occurred, the currents of L1
and L2 phases sharply increased from nominal magnitude to 2 times. The currents of L1 and L2 phases
gradually decreased until the fault was cleared while L3 phase current magnitude continued nearly
normally. GT-1 and GT-2 supplied the fault so there was a big increase in the fault currents in L1 and L2
phases as expected. After the phase L1 to phase L2 short circuit had occurred, the currents of L1 and L2
phases dropped to half of the normal current magnitude. After the fault, L1 and L2 phases continued on the
same phase angle until the fault was cleared. All plants were connected to the same bus. Therefore, there
was no voltage level difference in the buses of each plant. All of the obtained current waveforms were the
same shape as expected. Because all plants had different loads, they had different current level magnitude.
(a)
(b)
(c)
(d)
(e)
(f)
Figure 11. Case 4 waveforms; a) GT-1 voltage, b) GT-2 voltage , c) Plant-1 bus voltage, d) GT-1 bus
current, e) GT-2 bus current, f) Plant-1 bus current
As soon as the short circuit occurred, the currents of L1 and L2 phases sharply increased from nominal
magnitude to 5 times. The currents of L1 and L2 phases gradually decreased until the fault was cleared
while L3 phase current magnitude continued normally. Since GT-1 and GT-2 supplied the fault direction,
there was a big increase in the fault currents in GT-1 and GT-2 as expected. After the beginning of the fault,
L1 and L2 phases continued on the same phase angle until the fault was cleared.
8. CONCLUSION AND FURTHER WORK
The simulations on modeled power system are practical ways to define the fault currents for a certain
condition. It allows the designer to design new power plant as good as plan expansion of existing power
plants with higher degree of precision. Considering the prices of protection equipment, which has a large
part in system design, this way would allow designer to reduce the cost of the protective equipment. In this
study, real fault situation is simulated with the real measured data in cogeneration power plant in Izmir-
Turkey. The faults have been simulated at four different cases and two operation modes to confirm the effect
on the magnitudes of the fault currents and voltages.
The results obtained from after the real fault is very similar to the results obtained by simulation. PSS/Sincal
has been shown that short-circuit current contribution of distributed generation. To analyses these features,
grid connected cogeneration power plant has been modeled and simulated. After actual short-circuit
condition, measured wave form has been analyzed. The reason why the real data and simulation results are
very close to each other is because of accurately modeling. For a precisely modeling, the data can be created
by using real values instead of assumptions as much as possible. Looking at the simulation states and results,
the case simulated as case-1 is the simulated version of the real system data, shown as real fault condition,
in the software environment. It is seen that the real data are almost identical to the data obtained as a result
of simulation. In case of real fault condition, it is seen that the fault current measured at the PCC point is
shown Figure 8(a) and the short circuit currents observed as a result of the simulation in shown Figure 8(b)
almost have the same values. During the fault, it was observed that the nominal current increased
approximately 4 times which increased by % 400 from approximately 50 A to 200 A. When the other real
measurement results obtained from the power plant and not shown in this publication are evaluated, it can
reach instantaneous values where the short circuit current increases 10-50 or even 70 times depending on
the impedance where the short circuit occurs. Distribution Company (DISCO) is obliged to report only the
type of the fault in the power plan, and it does not report its location. For this reason, protection devices
should be selected according to the most value when designing power plant. Similarly, when looking at the
voltages, as expected, a sharp drop in the voltage was observed in the faulty phase. The closer the
measurement is to the fault point, in other words, the closer a fault occurs to the measurement point, the
voltage value reaches zero. In case of real fault condition, it can be said that the fault occurred at a distant
point in the power plant. The voltage level in the non-fault phases increased by %50 from 380 V to around

580-600 V. On the other hand, the voltage on the L1 line which is the fault phase, decreased by % 47 from
380 V to 200 V. As seen from the cases, as the location of the fault gets closer to the generator, the short
circuit currents gradually increase. On the other hand, the voltages are gradually decreasing to 0 V. As the
location of the fault and its distance from the generator increase, the voltage measured in the DG buses
decreases to half the nominal voltage during the fault.
In the light of confirmed data, the results of how the system will respond in other possible fault conditions
are obtained in case-2, 3 and 4. It has been emphasized that it is accuracy to simulate before investing and
design in a power system in order to prevent the faults during the designing and expansion and working
before the installation.
As a future work, during the fault, the stability and frequency change of factories in the grid (on-grid mode)
or (off-grid mode) will be modeled in large-power motors operating. Thus, improvement suggestions can
be proposed on the fault clearing time.
CONFLICTS OF INTEREST
No conflict of interest was declared by the authors.
REFERENCES
[1] Das, T., Roy, R. and Mandal, K.K., “Impact of the penetration of distributed generation on optimal
reactive power dispatch” , Protection and Control of Modern Power Systems, 5 (1): (2020).
[2] Guo, J., Ding, X. and Wu, W., “A Blockchain-Enabled Ecosystem for Distributed Electricity Trading
in Smart City” , IEEE Internet of Things Journal, 8 (3): 2040–2050, (2021).
[3] Baloch, S. and Muhammad, M.S., “An Intelligent Data Mining-Based Fault Detection and
Classification Strategy for Microgrid” , IEEE Access, 9 22470–22479, (2021).
[4] Pesaran H.A.M., Huy, P.D. and Ramachandaramurthy, V.K., “A review of the optimal allocation of
distributed generation: Objectives, constraints, methods, and algorithms” , Renewable and Sustainable
Energy Reviews, 75 (May 2016): 293–312, (2017).
[5] Haider, W., S.J. Ul Hassan, A. Mehdi, A. Hussain, G.O.M. Adjayeng, and C.H. Kim, “Voltage profile
enhancement and loss minimization using optimal placement and sizing of distributed generation in
reconfigured network” , Machines, 9 (1): 1–16, (2021).
[6] Karimi, M., Farshad, M., Hong, Q., Laaksonen, H. and Kauhaniemi, K., “An Islanding Detection
Technique for Inverter-Based Distributed Generation in Microgrids” , Energies, 14 (1): 130, (2020).
[7] Zheng, T., Yang, H., Zhao, R., Kang, Y.C. and Terzija, V., “Design, evaluation and implementation
of an islanding detection method for a micro-grid” , Energies, 11 (2): 323, (2018).
[8] Pinto, J.O.C.P. and Moreto, M. “Protection strategy for fault detection in inverter-dominated low
voltage AC microgrid” , Electric Power Systems Research, 190 (August 2020): 106572, (2021).
[9] Kim, I., “A calculation method for the short-circuit current contribution of current-control inverter-
based distributed generation sources at balanced conditions” , Electric Power Systems Research, 190
(August 2020): 106839, (2021).
[10] Xiao, H., Ren, S. and Li, Y., “Novel disturbance blocking criterion for reliable current differential
protection of LCC-HVDC lines” , IEEE Transactions on Power Delivery, 36 (1): 477–480, (2021).
[11] Gao, S.P., Liu, Q. and Song, G.B., “Current differential protection principle of HVDC transmission

system” , IET Generation, Transmission and Distribution, 11 (5): 1286–1292, (2017).
[12] Zarei, S.F. and Khankalantary, S., “Protection of active distribution networks with conventional and
inverter-based distributed generators” , International Journal of Electrical Power and Energy Systems,
129 (June 2020): 106746, (2021).
[13] Sahito, A.A., I.A. Halepoto, M.A. Uqaili, Z.A. Memon, A.S. Larik, and M.A. Mahar, “Analyzing the
Impacts of Distributed Generation Integration on Distribution Network: A Corridor Towards Smart
Grid Implementation in Pakistan” , Wireless Personal Communications, 85 (2): 545–563, (2015).
[14] Avagaddi, P., and B. Edward J, “Fault classification in transmission systems using wavelet transform”
, Gazi University Journal of Science, 32 (3): 884–893, (2019).
[15] Shobole, A., Baysal, M., Wadi, M. and Tur, M.R., “Protection Coordination in Electrical Substation
Part-2 Unit Protections (Differential and Distance Protection) -Case Study of Siddik Kardesler
Substation (SKS), Istanbul, Turkey” , Gazi University Journal of Science, 30 (4): 163–178, (2017).
[16] Ayvaz, A. and Boylu, A.B., “Determination of optimal placement of fault current limiting device
against short circuit faults occur in power systems” , Sakarya University Journal of Science, 22 (2):
615–623, (2018).
[17] Alasali, F., El-Naily, N., Zarour, E. and Saad, S.M., “Highly sensitive and fast microgrid protection
using optimal coordination scheme and nonstandard tripping characteristics” , International Journal of
Electrical Power and Energy Systems, 128 (October 2020): 106756, (2021).
[18] Chandraratne, C., Ramasamy, T.N., Logenthiran, T. and Panda, G., “Adaptive protection for microgrid
with distributed energy resources” , Electronics (Switzerland), 9 (11): 1–14, (2020).
[19] Yalcin, F. and Yildirim, Y., “A Study of Symmetrical and Unsymmetrical Short Circuit Fault Analyses
in Power Systems” , Sakarya University Journal of Science, 23 (5): 879–895, (2019).
[20] Rustemli, S. and Demir, I., “Analysis and simulation of single phase-to-ground short circuit fault in
Van 154 kV substation: An experimental assessment” , Bitlis Eren University Journal of Science and
Technology, 9 (2): 76–82, (2019).
[21] Patil Electrical, B. and Namekar, S., “Load Flow & Short Circuit Analysis of 132/33/11KV Substation
using ETAP” , International Journal of Applied Engineering Research, 13 (11): 9943–9952, (2018).
[22] Hosseini, S.A., Sadeghi, S.H.H.and Nasiri, A., “Decentralized Adaptive Protection Coordination
Based on Agents Social Activities for Microgrids with Topological and Operational Uncertainties” ,
IEEE Transactions on Industry Applications, 57 (1): 702–713, (2021).
[23] Ballal, M.S. and Kulkarni, A.R., “Improvements in Existing System Integrity Protection Schemes
under Stressed Conditions by Synchrophasor Technology -Case Studies” , IEEE Access, 9 (2021).
[24] Muljadi, E. and Gevorgian, V., “Short-circuit modeling of a wind power plant” , IEEE Power and
Energy Society General Meeting, 1–9, (2011).
[25] Devi, M.M., Geethanjali, M. and Devi, A.R., “Fault localization for transmission lines with optimal
Phasor Measurement Units” , Computers and Electrical Engineering, 70 163–178, (2018).
[26] Asija, D., Choudekar, P., Singla, R. and Chouhan, M., “Performance Evaluation and Improvement in
Transient Instability of IEEE 9 Bus System Using Exciter and Governor Control” , Procedia Computer
Science, 70 733–739, (2015).

[27] Khatua, S.,and Mukherjee, V., “Adaptive overcurrent protection scheme suitable for station blackout
power supply of nuclear power plant operated through an integrated microgrid” , Electric Power
Systems Research, 192 (March 2020): 106934, (2021).
[28] Balamurugan, K., Srinivasan, D. and Reindl, T., “Impact of distributed generation on power
distribution systems” , Energy Procedia, 25 93–100, (2012).
[29] Shin, H., S.H. Chae, and E.-H. Kim, “Design of Microgrid Protection Schemes Using
PSCAD/EMTDC and ETAP Programs” , Energies, 13 (21): 5784, (2020).
[30] Nadeem, M.H., Zheng, X., Tai, N., Gul, M., Yu, M. and He, Y., “Non-communication based protection
scheme using transient harmonics for multi-terminal HVDC networks” , International Journal of
Electrical Power & Energy Systems, 127 106636, (2021).
[31] Darwish, A., Abdel-Khalik, A.S., Elserougi, A., Ahmed, S. and Massoud, A. “Fault current
contribution scenarios for grid-connected voltage source inverter-based distributed generation with an
LCL filter” , Electric Power Systems Research, 104 93–103, (2013).
[32] Song, J., Li, Y. and Zhang, Y., “Fault steady-state analysis method for the AC system with LCC-
HVDC infeed” , Electric Power Systems Research, 192 106994, (2021).
[33] Bendjabeur, A., Kouadri, A.and Mekhilef, S. “Transmission line fault location by solving line
differential equations” , Electric Power Systems Research, 192 106912, (2021).
[34] Moustafa, M.A.M.M., and Chang, C. “Preventing cascading failure of electric power protection
systems in nuclear power plant” , Nuclear Engineering and Technology, 53 (1): 121–130, (2021).
[35] El-Khattam, W. and Salama, M.M.A. “Distributed generation technologies, definitions and benefits”
, Electric Power Systems Research, 71 (2): 119–128, (2004).
[36] Bawazir, R.O., and N.S. Cetin, “Comprehensive overview of optimizing PV-DG allocation in power
system and solar energy resource potential assessments” , Energy Reports, 6 173–208, (2020).
[37] Dondi, P., D. Bayoumi, C. Haederli, D. Julian, and M. Suter, “Network integration of distributed power
generation” , Journal of Power Sources, 106 (1–2): 1–9, (2002).
[38] Pepermans, G., Driesen, J., Haeseldonckx, D., Belmans, R. and D’haeseleer, W., “Distributed
generation: Definition, benefits and issues” , Energy Policy, 33 (6): 787–798, (2005).
[39] Ochoa, L.F., Padilha-Feltrin, A. and Harrison, G.P. “Evaluating distributed generation impacts with a
multiobjective index” , IEEE Transactions on Power Delivery, 21 (3): 1452–1458, (2006).
[40] Farzinfar, M. and Jazaeri, M. “A novel methodology in optimal setting of directional fault current
limiter and protection of the MG” , International Journal of Electrical Power and Energy Systems, 116
(September 2019): 105564, (2020).
[41] Alcala-Gonzalez, D., Del Toro, E.M.G., Más-López, M.I. and Pindado, S., “Effect of distributed
photovoltaic generation on short-circuit currents and fault detection in distribution networks: A
practical case study” , Applied Sciences (Switzerland), 11 (1): 1–16, (2021).
[42] Boutsika, T.N., and Papathanassiou, S.A., “Short-circuit calculations in networks with distributed
generation” , Electric Power Systems Research, 78 (7): 1181–1191, (2008).
[43] Dincer, I. and Rosen, M.A., Cogeneration, Multigeneration, and Integrated Energy Systems, in:
Exergy Analysis of Heating, Refrigerating and Air Conditioning, 2015: pp. 169–219.

[44] Ghaedi, A. and Golshan, M.E.H., “Modified WLS three-phase state estimation formulation for fault
analysis considering measurement and parameter errors” , Electric Power Systems Research, 190
(March 2020): 106854, (2021).
[45] Yang, S. and Tong, X., “Integrated power flow and short circuit calculation method for distribution
network with inverter based distributed generation” , Mathematical Problems in Engineering, 2016
(2016).
[46] Baran, M.E. and El-Markaby, I., “Fault Analysis on Distribution Feeders With Distributed Generators”
, IEEE Transactions on Power Systems, 20 (4): 1757–1764, (2005).
[47] Abdel-Akher, M. and Nor, K.M., “Fault analysis of multiphase distribution systems using symmetrical
components” , IEEE Transactions on Power Delivery, 25 (4): 2931–2939, (2010).
[48] Strezoski, L. V. and Prica, M.D., “Short-circuit analysis in large-scale distribution systems with high
penetration of distributed generators” , IEEE/CAA Journal of Automatica Sinica, 4 (2): 243–251,
(2017).
[49] Abdel-Akher, M. and K.M. Nor, “Fault Analysis of Multiphase Distribution Systems Using
Symmetrical Components” , IEEE Transactions on Power Delivery, 25 (4): 2931–2939, (2010).
[50] PSS/SINCAL (SIEMENS Network Calculation) software, “Introduction to the System Manual”,
(2014).
[51] https://new.siemens.com/global/en/products/energy/services/transmission-distribution-smart-
grid/consulting-and-planning/pss-software/pss-sincal/pss-sincal.html#Electricitymodules. Access
date: 17.07.2020.