johannes kiefer technische thermodynamik universität...
TRANSCRIPT
Universität Bremen
Introduction to Raman Spectroscopy
Johannes Kiefer
Technische Thermodynamik
Universität Bremen, Germany
• Rotational and vibrational spectra in a nutshell
• Raman spectroscopy
• Raman effect and Raman activity
• Instrumentation
• Signal analysis
• Potential problems (and how they can be overcome)
• Applications (after the break)
Outline
• Spectroscopy utilises energetic interactions between
light and matter
• Molecular structure
• Rotational structure
• Vibrational structure
• Overtone and combination bands
Fundamentals of Vibrational Spectroscopy
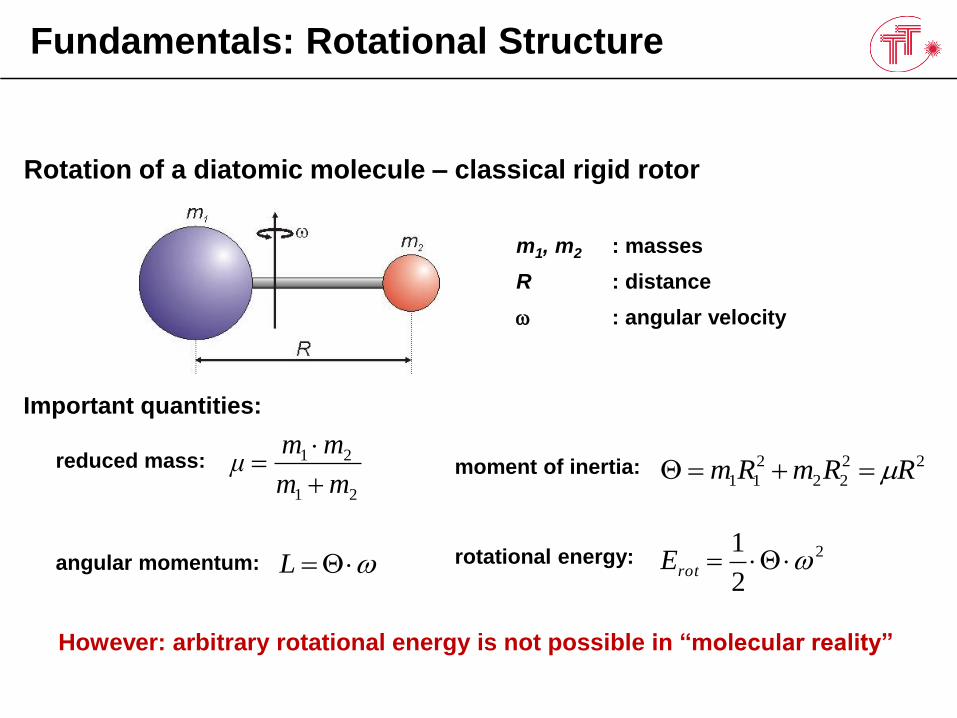
Fundamentals: Rotational Structure
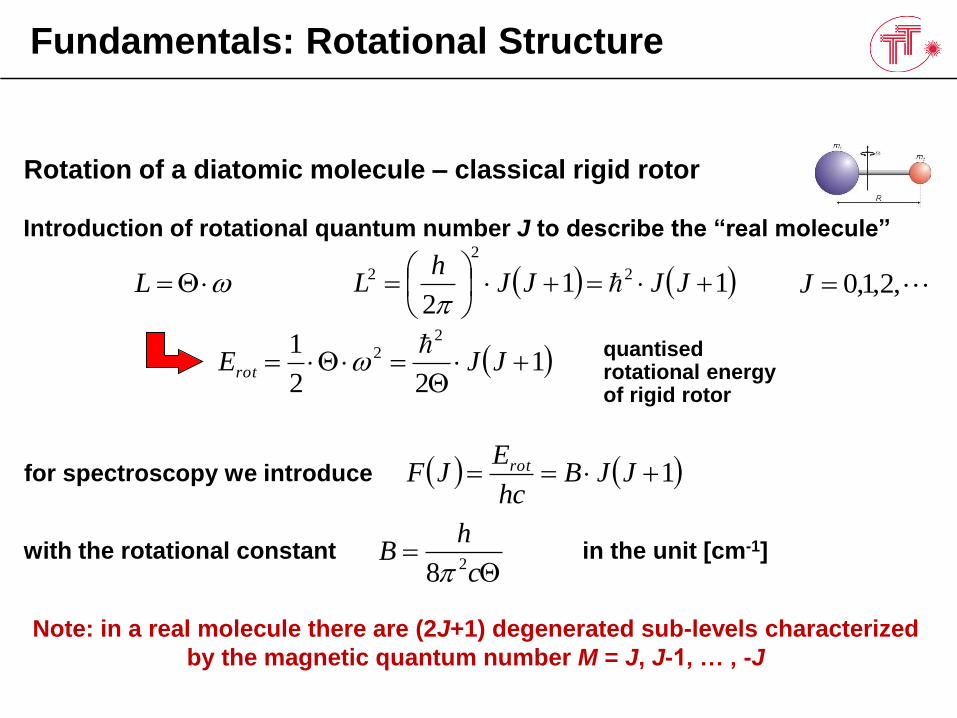
Rotation of a diatomic molecule – classical rigid rotor
m1, m2 : masses
R : distance
w : angular velocity
reduced mass:
21
21
mm
mmμ
moment of inertia: 22
22
2
11 RRmRm
rotational energy: 2
2
1wrotEangular momentum: wL
Important quantities:
However: arbitrary rotational energy is not possible in “molecular reality”
Fundamentals: Rotational Structure
,2,1,0J 112
2
2
2
JJJJ
hL
quantisedrotational energy of rigid rotor
122
1 22
JJErot
w
wL
Introduction of rotational quantum number J to describe the “real molecule”
Note: in a real molecule there are (2J+1) degenerated sub-levels characterized
by the magnetic quantum number M = J, J-1, … , -J
for spectroscopy we introduce 1 JJBhc
EJF rot
with the rotational constant in the unit [cm-1]
c
hB
28
Rotation of a diatomic molecule – classical rigid rotor
Fundamentals: Rotational Structure
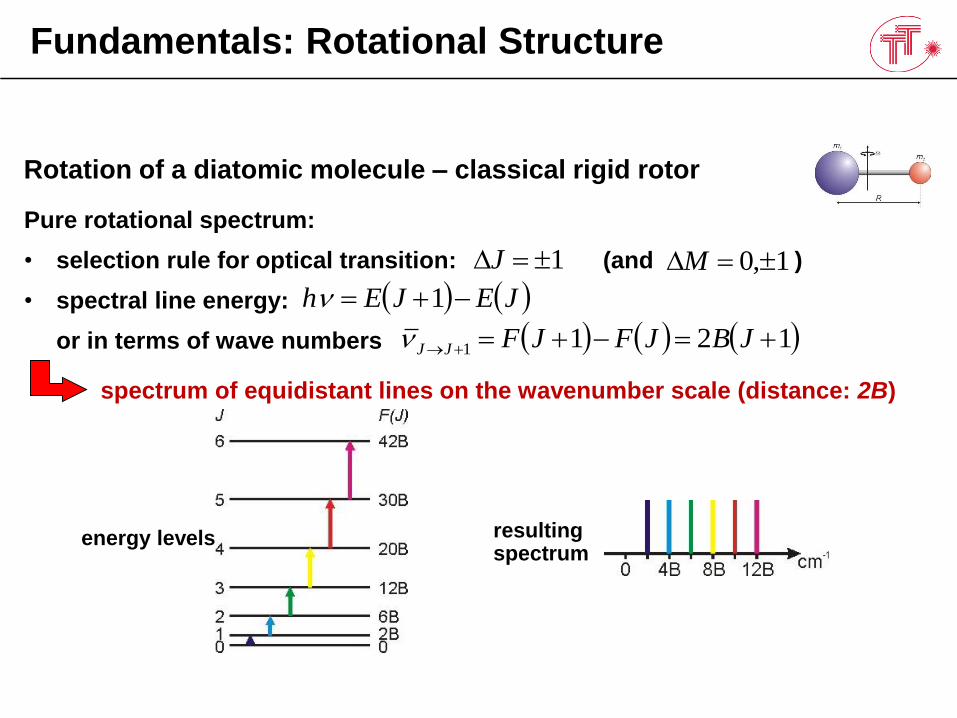
Rotation of a diatomic molecule – classical rigid rotor
Pure rotational spectrum:
• selection rule for optical transition: (and )
• spectral line energy:
or in terms of wave numbers
1J 1,0 M
JEJEh 1
1211 JBJFJFJJ
energy levels resulting spectrum
spectrum of equidistant lines on the wavenumber scale (distance: 2B)
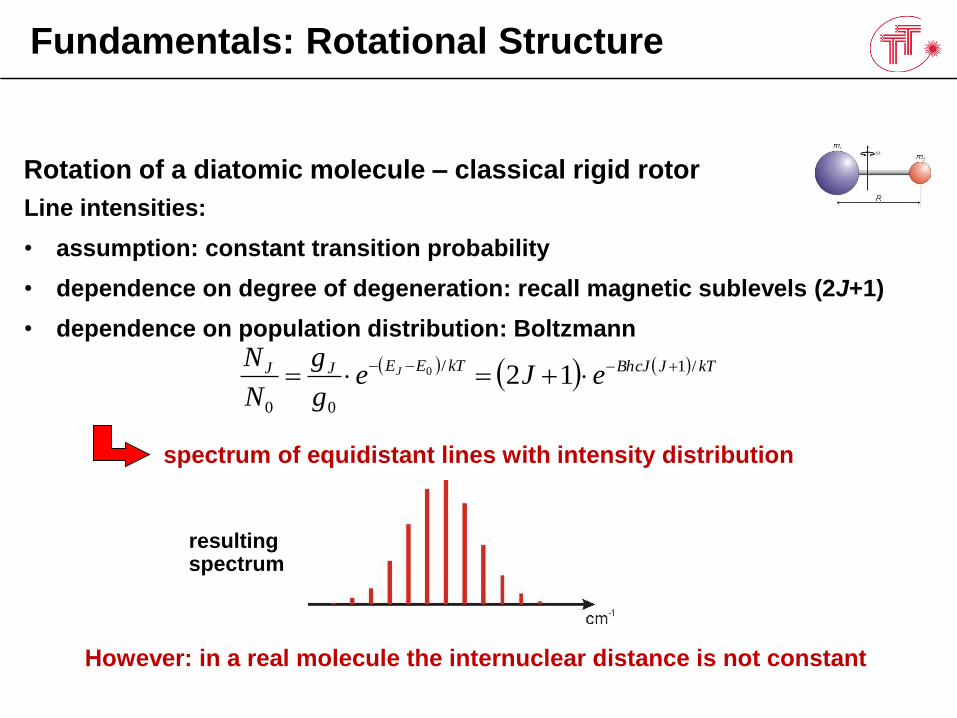
Fundamentals: Rotational Structure
Rotation of a diatomic molecule – classical rigid rotor
Line intensities:
• assumption: constant transition probability
• dependence on degree of degeneration: recall magnetic sublevels (2J+1)
• dependence on population distribution: Boltzmann
kTJBhcJkTEEJJ eJeg
g
N
NJ /1/
00
120
spectrum of equidistant lines with intensity distribution
resulting spectrum
However: in a real molecule the internuclear distance is not constant
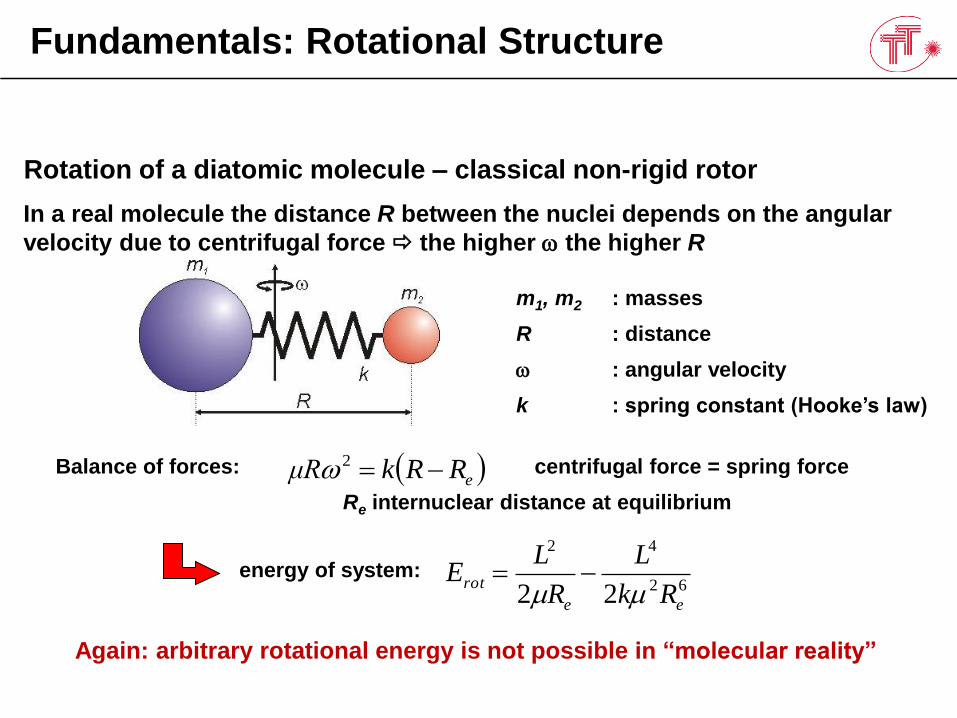
Rotation of a diatomic molecule – classical non-rigid rotor
Fundamentals: Rotational Structure
m1, m2 : masses
R : distance
w : angular velocity
k : spring constant (Hooke’s law)
Balance of forces: centrifugal force = spring force
Re internuclear distance at equilibrium
eRRkμR 2w
energy of system:
In a real molecule the distance R between the nuclei depends on the angular
velocity due to centrifugal force the higher w the higher R
Again: arbitrary rotational energy is not possible in “molecular reality”
62
42
22 ee
rotRk
L
R
LE
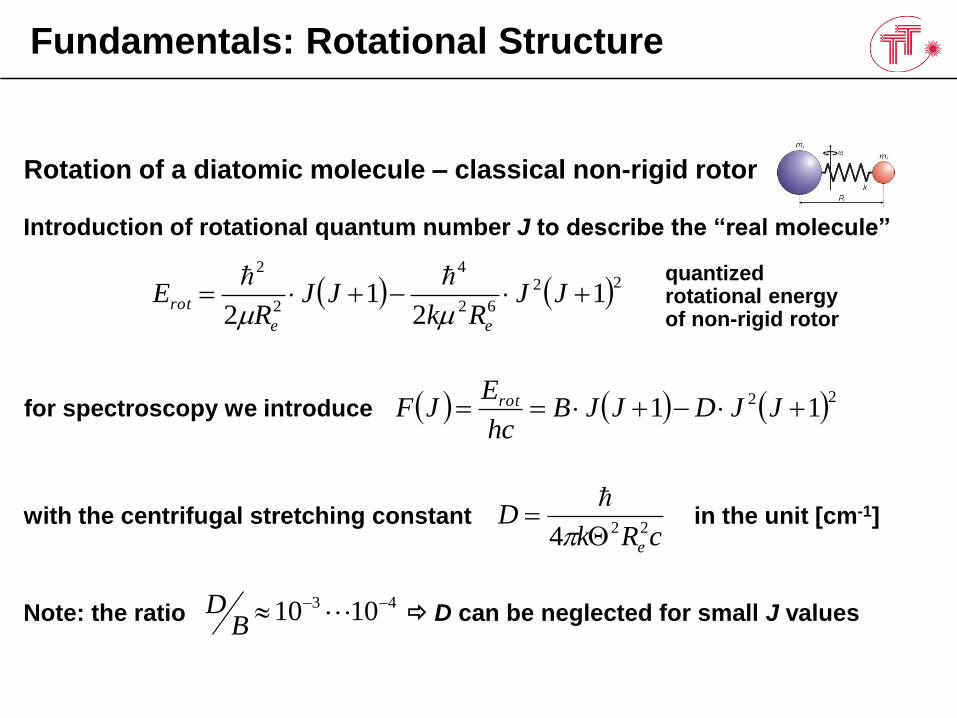
Rotation of a diatomic molecule – classical non-rigid rotor
Fundamentals: Rotational Structure
quantized rotational energy of non-rigid rotor
22
62
4
2
2
12
12
JJRk
JJR
Eee
rot
Introduction of rotational quantum number J to describe the “real molecule”
for spectroscopy we introduce 22 11 JJDJJBhc
EJF rot
with the centrifugal stretching constant in the unit [cm-1]cRk
De
224
Note: the ratio D can be neglected for small J values43 1010
BD
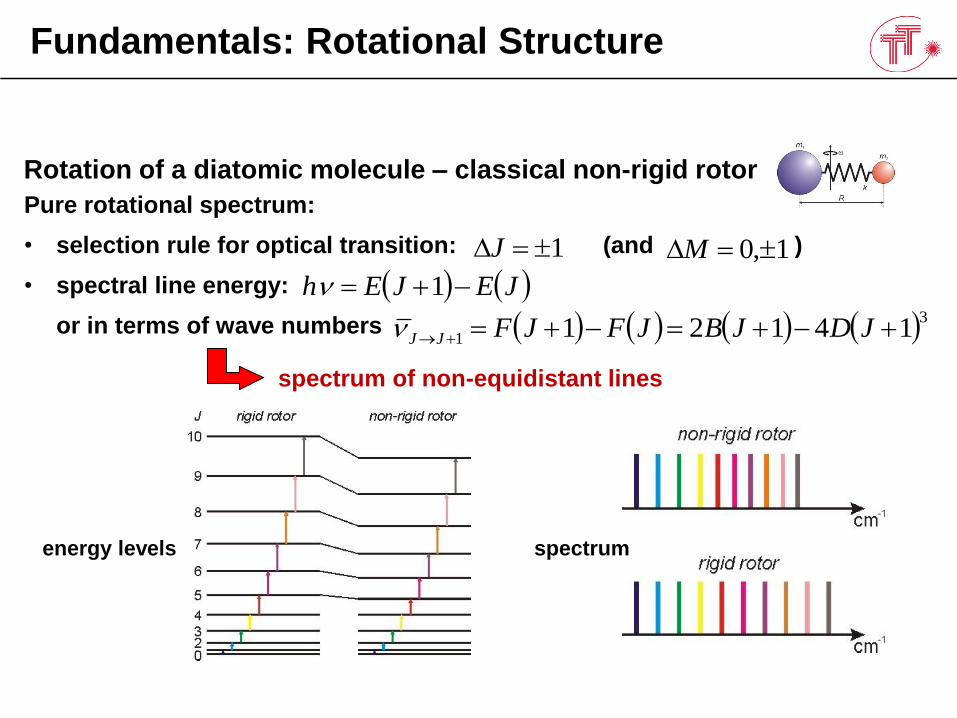
Rotation of a diatomic molecule – classical non-rigid rotor
Fundamentals: Rotational Structure
Pure rotational spectrum:
• selection rule for optical transition: (and )
• spectral line energy:
or in terms of wave numbers
1J 1,0 M
JEJEh 1
3
1 14121 JDJBJFJFJJ
energy levels
spectrum of non-equidistant lines
spectrum
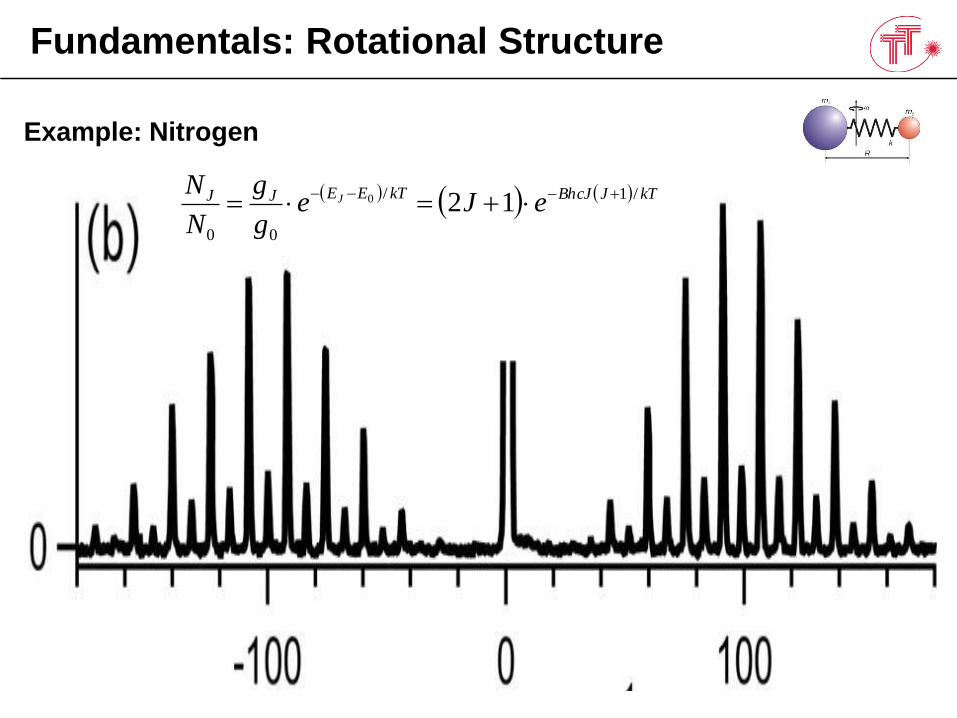
Example: Nitrogen
Fundamentals: Rotational Structure
kTJBhcJkTEEJJ eJeg
g
N
NJ /1/
00
120
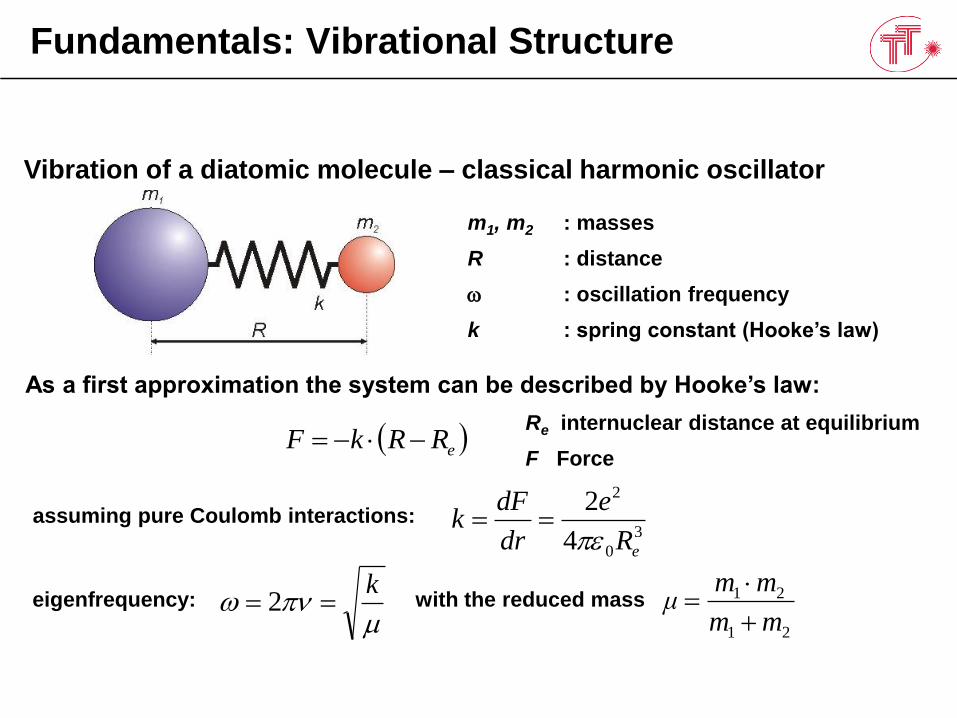
Vibration of a diatomic molecule – classical harmonic oscillator
Fundamentals: Vibrational Structure
assuming pure Coulomb interactions:
eRRkF
As a first approximation the system can be described by Hooke’s law:
m1, m2 : masses
R : distance
w : oscillation frequency
k : spring constant (Hooke’s law)
Re internuclear distance at equilibrium
F Force
3
0
2
4
2
eR
e
dr
dFk
eigenfrequency: with the reduced mass
w
k 2
21
21
mm
mmμ
Vibration of a diatomic molecule – classical harmonic oscillator
Fundamentals: Vibrational Structure
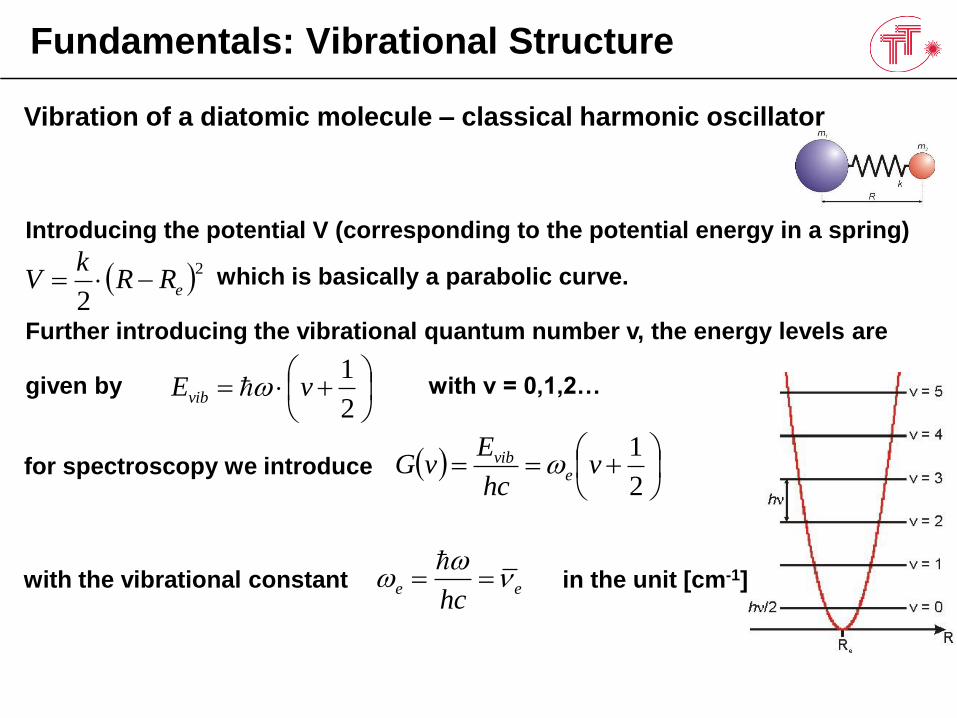
Introducing the potential V (corresponding to the potential energy in a spring)
which is basically a parabolic curve.
Further introducing the vibrational quantum number v, the energy levels are
given by with v = 0,1,2…
2
2eRR
kV
2
1vEvib w
for spectroscopy we introduce
2
1v
hc
EvG e
vib w
with the vibrational constant in the unit [cm-1]eehc
w
w
Vibration of a diatomic molecule – classical harmonic oscillator
Fundamentals: Vibrational Structure
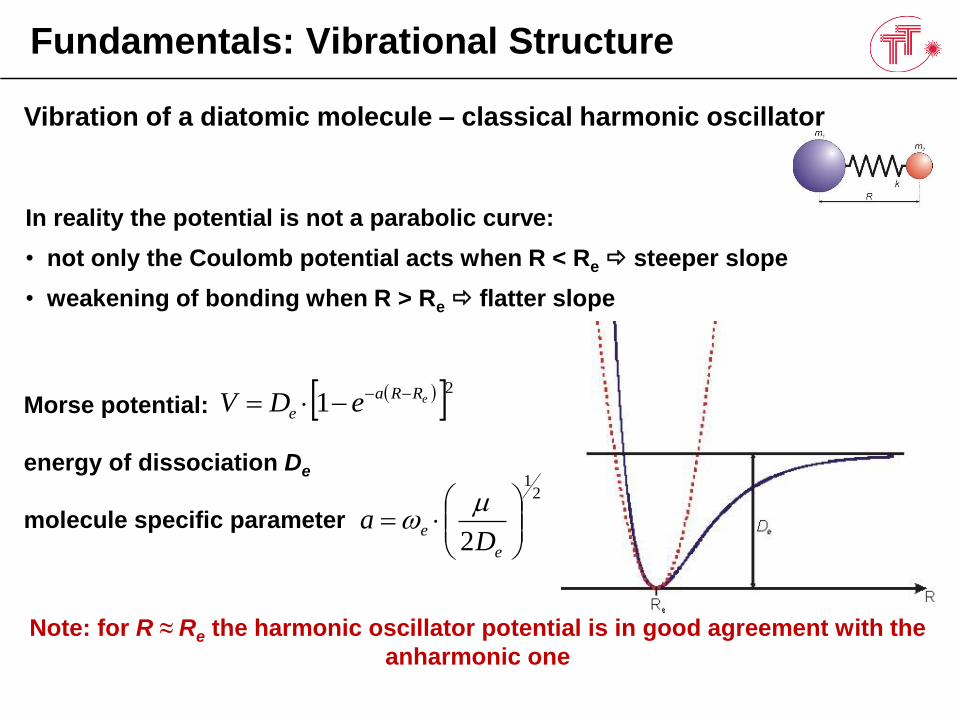
In reality the potential is not a parabolic curve:
• not only the Coulomb potential acts when R < Re steeper slope
• weakening of bonding when R > Re flatter slope
21 eRRa
e eDV
Note: for R ≈ Re the harmonic oscillator potential is in good agreement with the
anharmonic one
21
2
e
eD
a
w
Morse potential:
energy of dissociation De
molecule specific parameter
Vibration of a diatomic molecule – classical harmonic oscillator
Fundamentals: Vibrational Structure
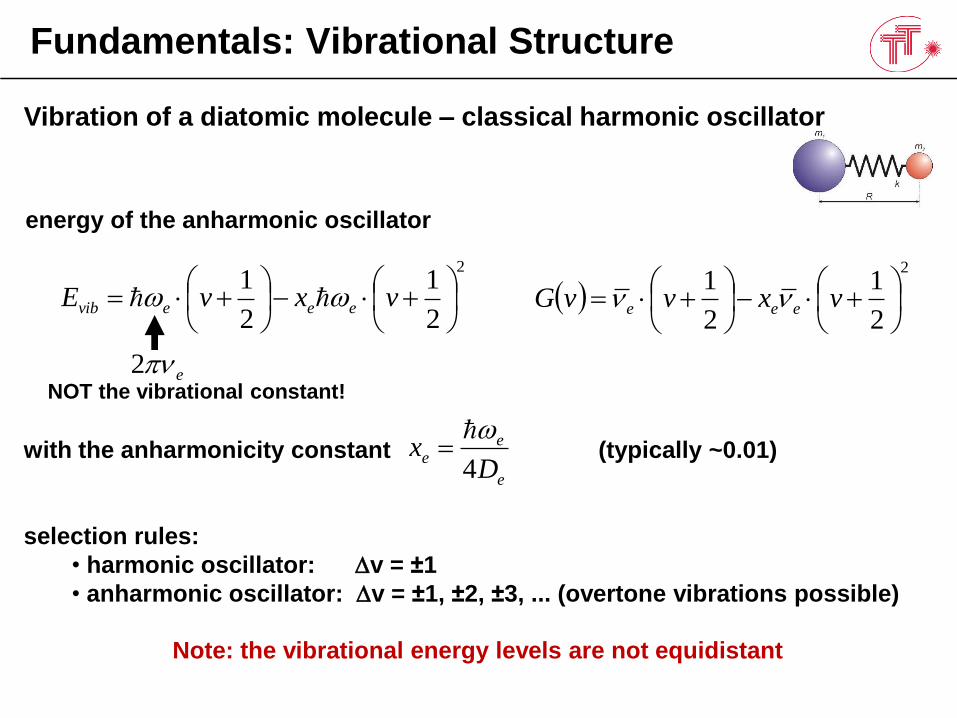
energy of the anharmonic oscillator
e2
Note: the vibrational energy levels are not equidistant
e
ee
Dx
4
wwith the anharmonicity constant (typically ~0.01)
selection rules:
• harmonic oscillator: v = ±1
• anharmonic oscillator: v = ±1, ±2, ±3, ... (overtone vibrations possible)
2
2
1
2
1
vxvE eeevib ww
2
2
1
2
1
vxvvG eee
NOT the vibrational constant!
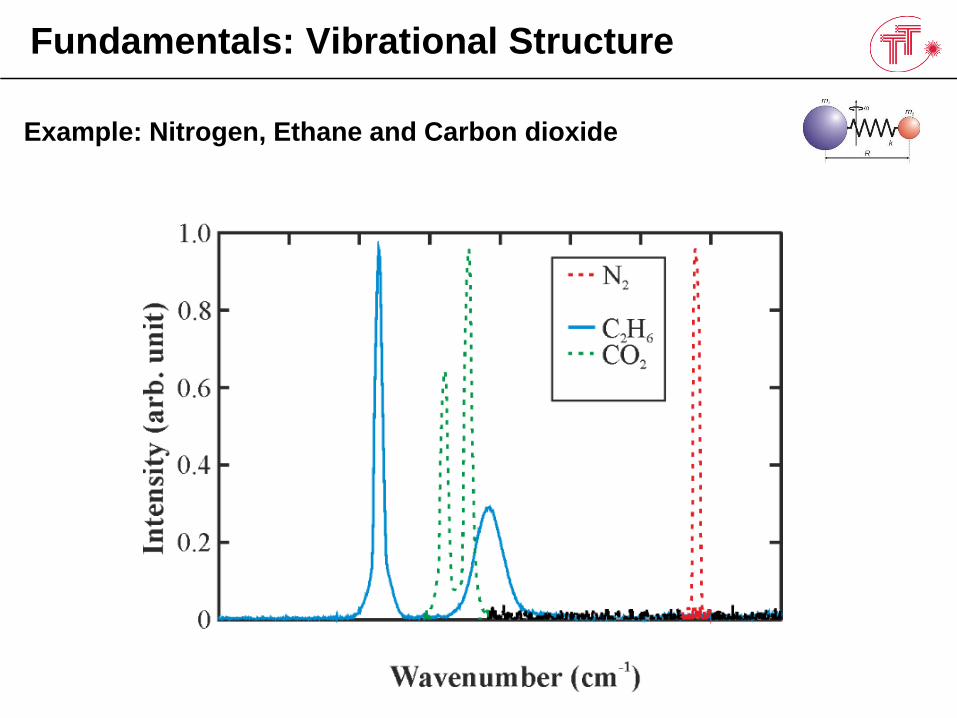
Example: Nitrogen, Ethane and Carbon dioxide
Fundamentals: Vibrational Structure
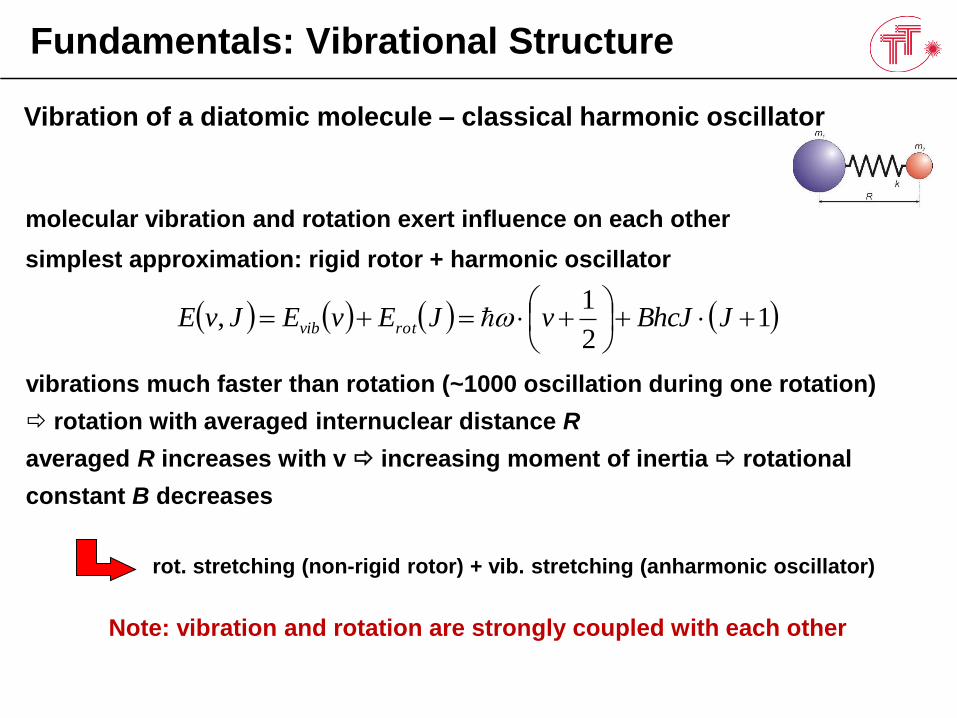
Vibration of a diatomic molecule – classical harmonic oscillator
Fundamentals: Vibrational Structure
vibrations much faster than rotation (~1000 oscillation during one rotation)
rotation with averaged internuclear distance R
averaged R increases with v increasing moment of inertia rotational
constant B decreases
molecular vibration and rotation exert influence on each other
simplest approximation: rigid rotor + harmonic oscillator
Note: vibration and rotation are strongly coupled with each other
12
1,
JBhcJvJEvEJvE rotvib w
rot. stretching (non-rigid rotor) + vib. stretching (anharmonic oscillator)
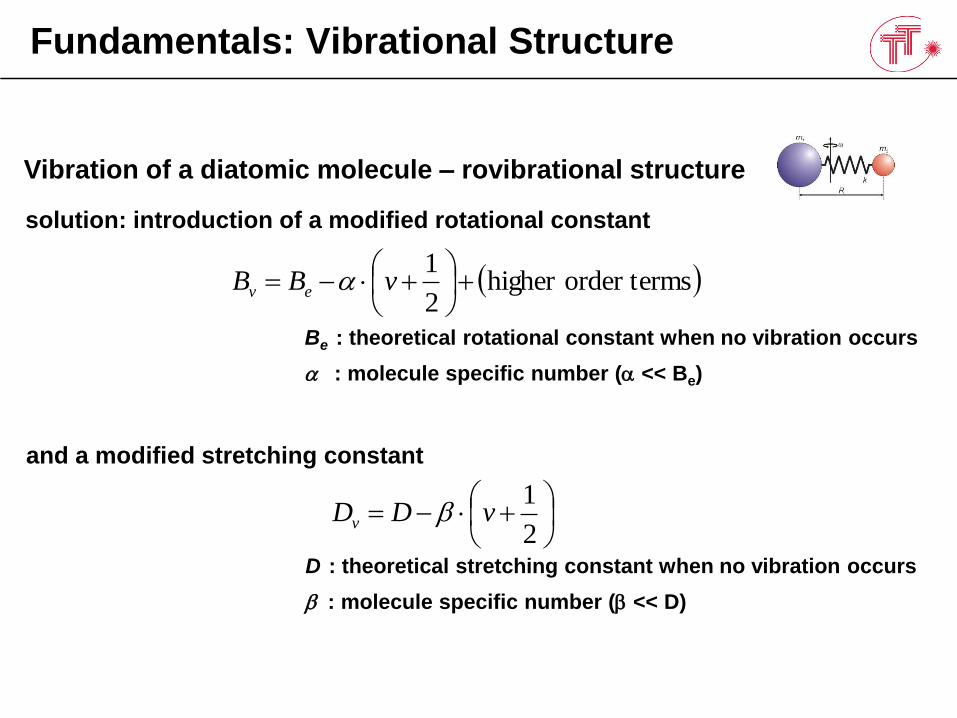
Vibration of a diatomic molecule – rovibrational structure
Fundamentals: Vibrational Structure
solution: introduction of a modified rotational constant
sorder termhigher 2
1
vBB ev
Be : theoretical rotational constant when no vibration occurs
: molecule specific number ( << Be)
2
1vDDv
and a modified stretching constant
D : theoretical stretching constant when no vibration occurs
: molecule specific number ( << D)
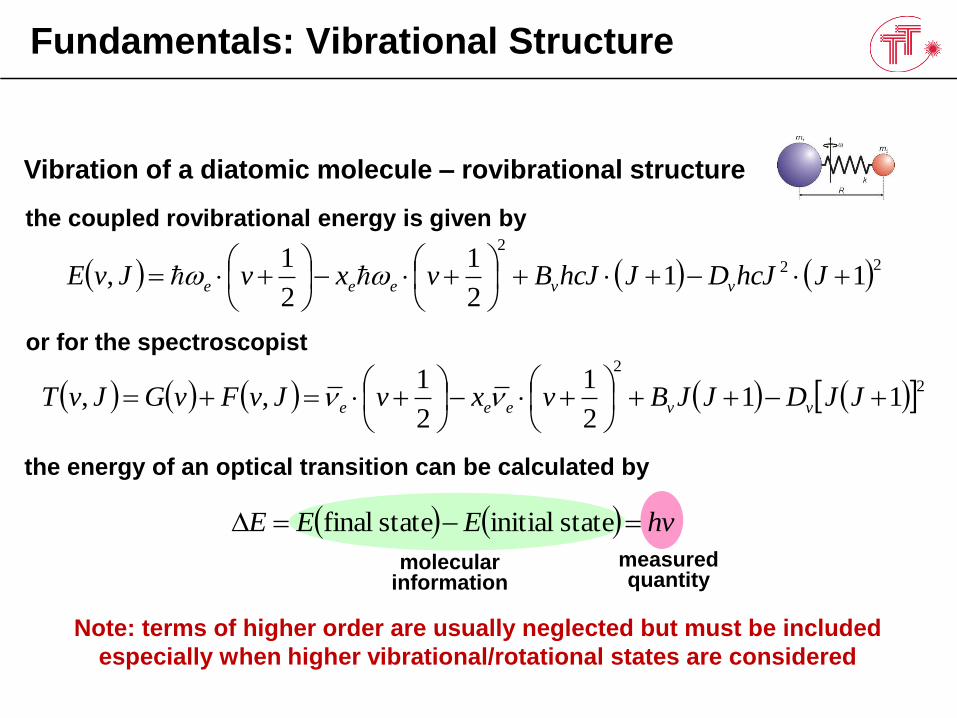
Vibration of a diatomic molecule – rovibrational structure
Fundamentals: Vibrational Structure
or for the spectroscopist
the coupled rovibrational energy is given by
Note: terms of higher order are usually neglected but must be included
especially when higher vibrational/rotational states are considered
22
2
112
1
2
1,
JhcJDJhcJBvxvJvE vveee ww
2
2
112
1
2
1,,
JJDJJBvxvJvFvGJvT vveee
the energy of an optical transition can be calculated by
hvEEE state initialstate final
measured quantity
molecularinformation
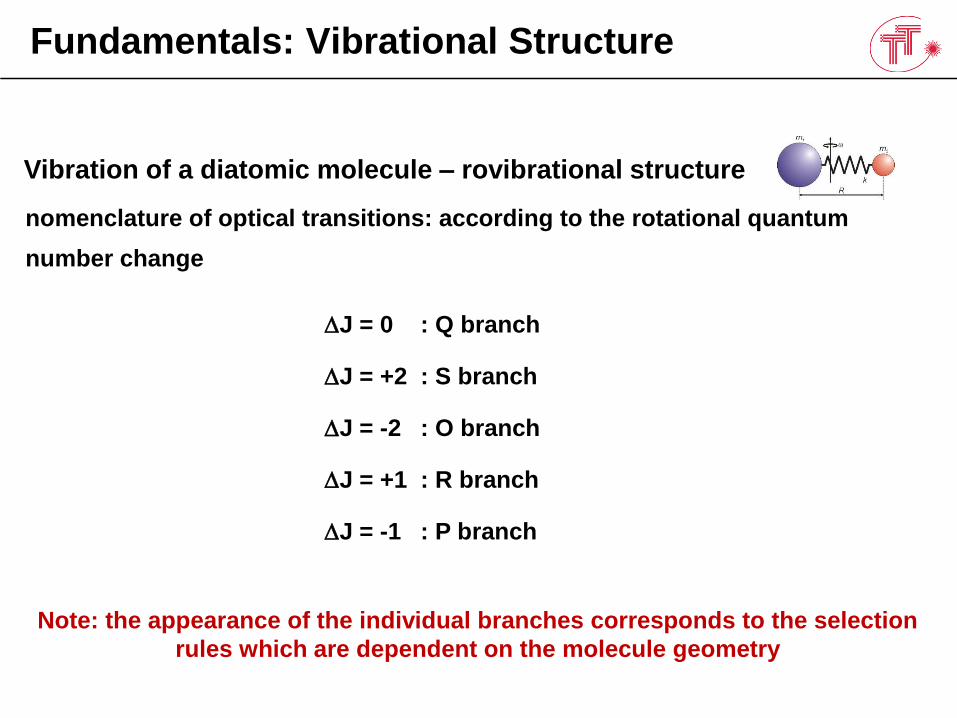
Vibration of a diatomic molecule – rovibrational structure
Fundamentals: Vibrational Structure
nomenclature of optical transitions: according to the rotational quantum
number change
Note: the appearance of the individual branches corresponds to the selection
rules which are dependent on the molecule geometry
J = 0 : Q branch
J = +2 : S branch
J = -2 : O branch
J = +1 : R branch
J = -1 : P branch
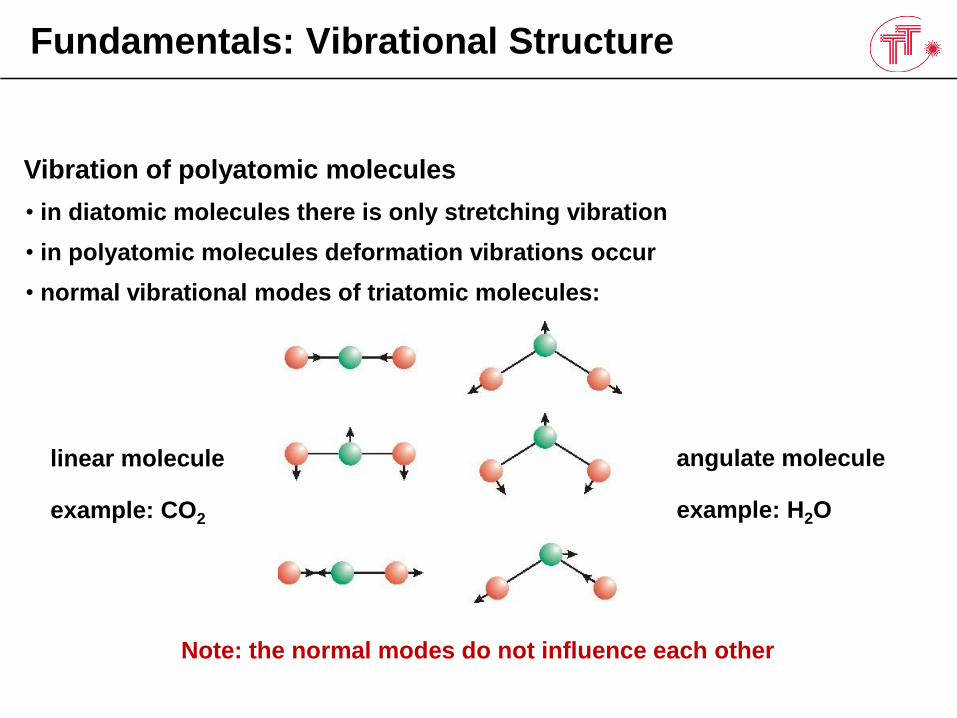
Vibration of polyatomic molecules
Fundamentals: Vibrational Structure
• in diatomic molecules there is only stretching vibration
• in polyatomic molecules deformation vibrations occur
• normal vibrational modes of triatomic molecules:
Note: the normal modes do not influence each other
linear molecule
example: CO2
angulate molecule
example: H2O
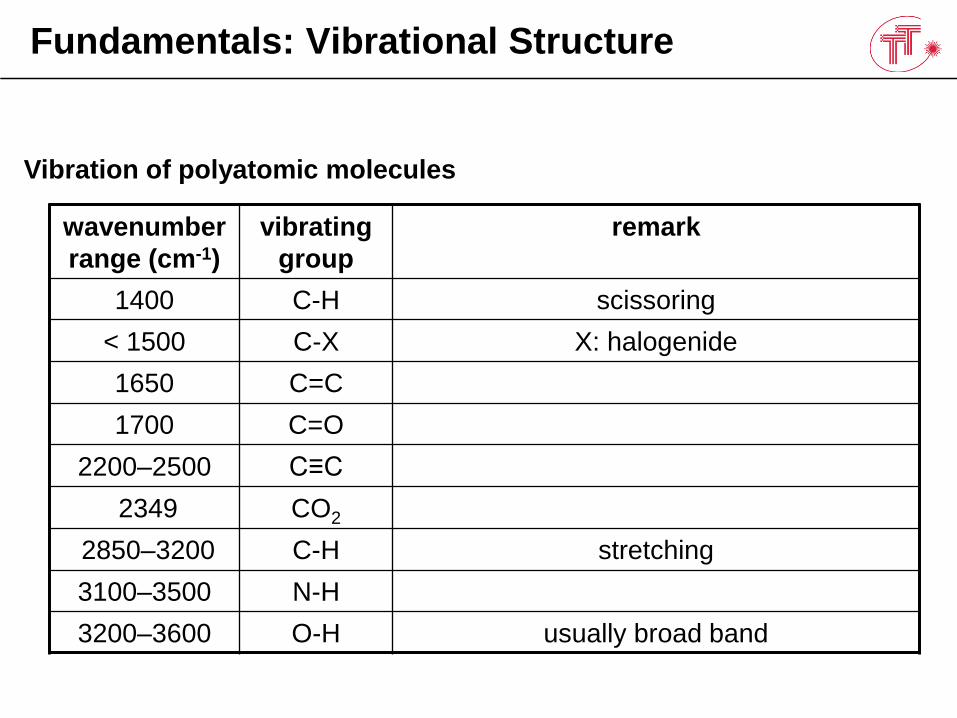
Vibration of polyatomic molecules
Fundamentals: Vibrational Structure
wavenumber
range (cm-1)
vibrating
group
remark
1400 C-H scissoring
< 1500 C-X X: halogenide
1650 C=C
1700 C=O
2200–2500 C≡C
2349 CO2
2850–3200 C-H stretching
3100–3500 N-H
3200–3600 O-H usually broad band
Fundamentals: Vibrational Structure
Overtone vibrations
• assuming the harmonic oscillator the selection rule for vibrational modes
is v = ±1
• in the anharmonic oscillator (this means for real molecules) additional
transitions are allowed: v = ±2, ±3, ...
,which are called overtone bands
• the transition probability of overtone vibrations is much lower than that
of normal modes
Note: the frequency of an overtone vibration is less that the doubled normal
mode
Fundamentals: Vibrational Structure
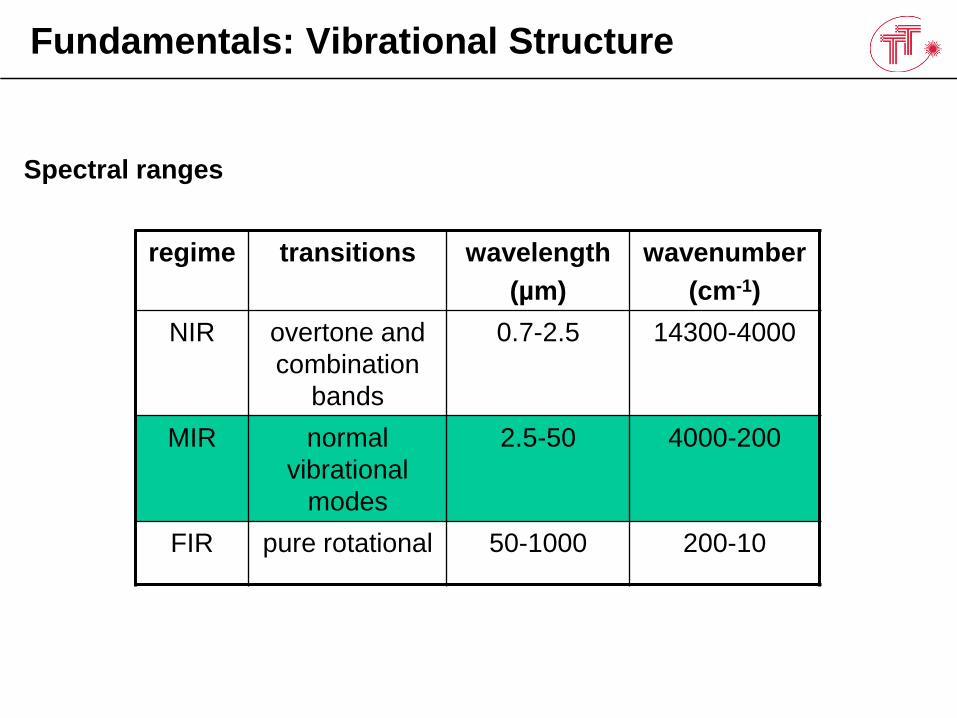
Spectral ranges
regime transitions wavelength
(µm)
wavenumber
(cm-1)
NIR overtone and
combination
bands
0.7-2.5 14300-4000
MIR normal
vibrational
modes
2.5-50 4000-200
FIR pure rotational 50-1000 200-10
• Rotational and vibrational spectra in a nutshell
• Raman spectroscopy
• Raman effect and Raman activity
• Instrumentation
• Signal analysis
• Potential problems (and how they can be overcome)
• Applications (after the break)
Outline
Raman Spectroscopy: Fundamentals
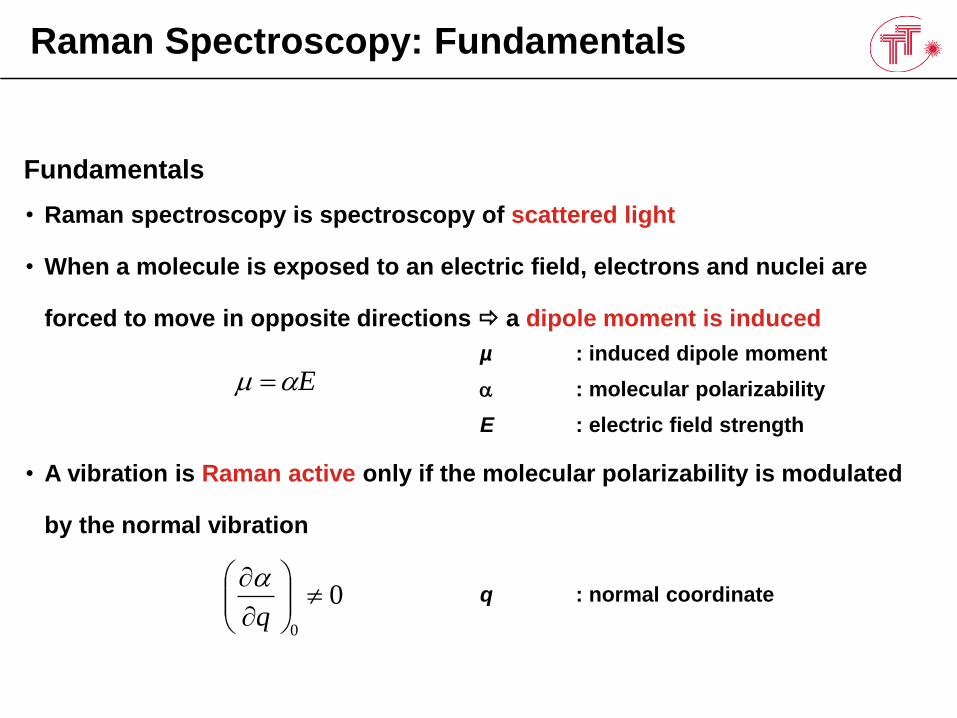
Fundamentals
• Raman spectroscopy is spectroscopy of scattered light
• When a molecule is exposed to an electric field, electrons and nuclei are
forced to move in opposite directions a dipole moment is induced
• A vibration is Raman active only if the molecular polarizability is modulated
by the normal vibration
µ : induced dipole moment
: molecular polarizability
E : electric field strength
E
00
q
q : normal coordinate
Raman Spectroscopy: Fundamentals
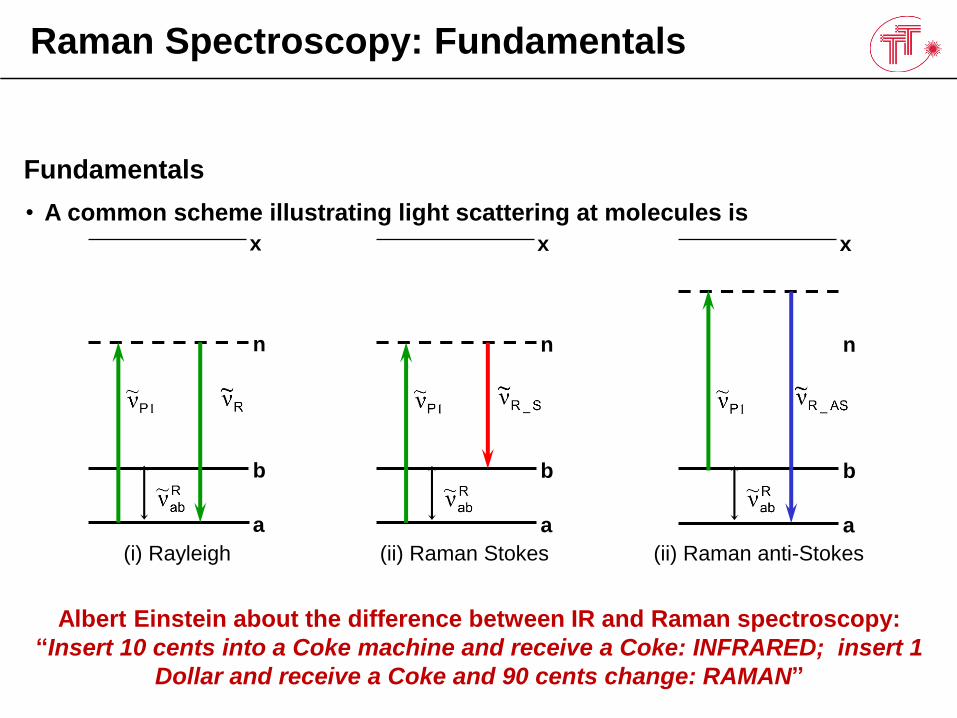
Fundamentals
• A common scheme illustrating light scattering at molecules is
Albert Einstein about the difference between IR and Raman spectroscopy:
“Insert 10 cents into a Coke machine and receive a Coke: INFRARED; insert 1
Dollar and receive a Coke and 90 cents change: RAMAN”
a
b
n
x
a
b
n
x
a
b
n
x
(i) Rayleigh (ii) Raman Stokes (ii) Raman anti-Stokes
Raman Spectroscopy: Instrumentation
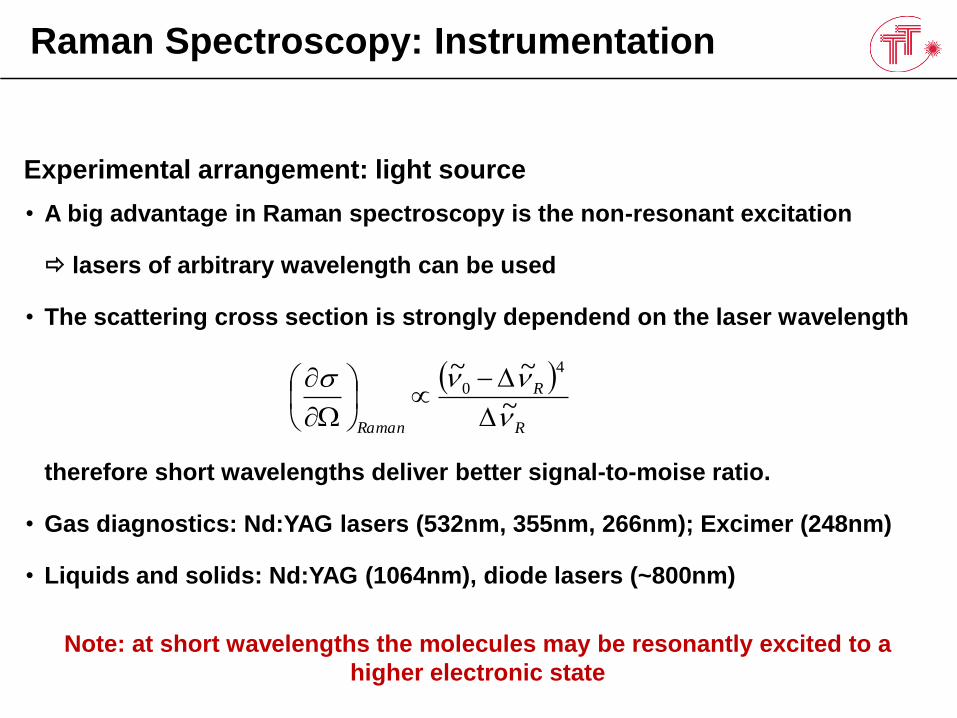
Experimental arrangement: light source
Note: at short wavelengths the molecules may be resonantly excited to a
higher electronic state
• A big advantage in Raman spectroscopy is the non-resonant excitation
lasers of arbitrary wavelength can be used
• The scattering cross section is strongly dependend on the laser wavelength
therefore short wavelengths deliver better signal-to-moise ratio.
• Gas diagnostics: Nd:YAG lasers (532nm, 355nm, 266nm); Excimer (248nm)
• Liquids and solids: Nd:YAG (1064nm), diode lasers (~800nm)
R
R
Raman
~
~~ 4
0
Raman Spectroscopy: Instrumentation
Experimental arrangement: detectors
• Detectors employed for Raman spectroscopy are typically semiconductor
based
• the signal is comparatively weak intensified CCD cameras or back-
illuminated CCD chips are common
Raman Spectroscopy: Instrumentation
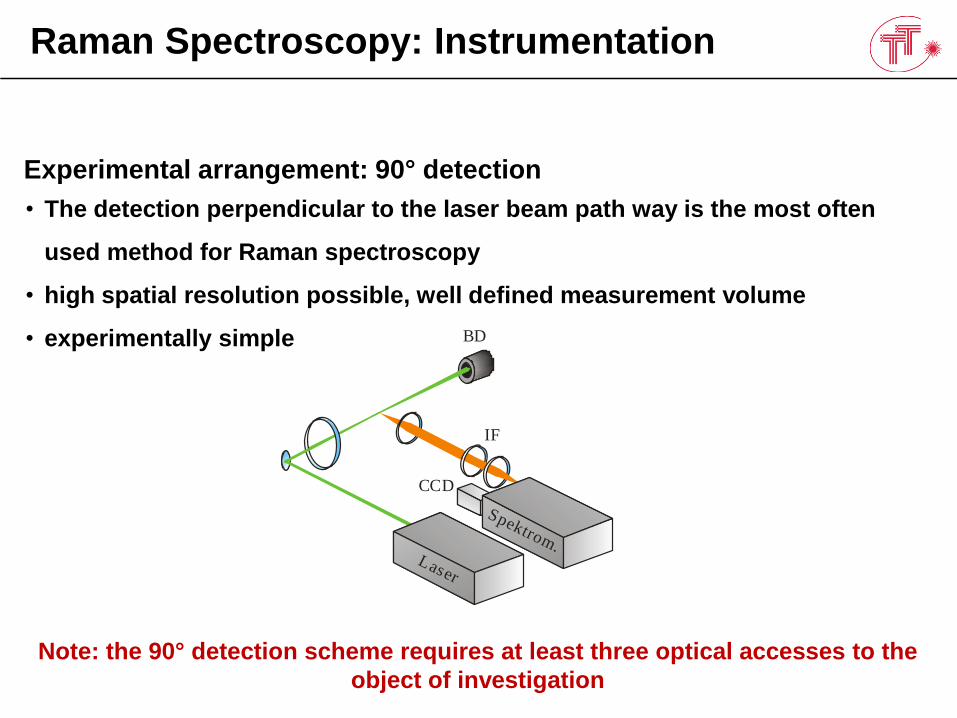
Experimental arrangement: 90° detection
Note: the 90° detection scheme requires at least three optical accesses to the
object of investigation
• The detection perpendicular to the laser beam path way is the most often
used method for Raman spectroscopy
• high spatial resolution possible, well defined measurement volume
• experimentally simple BD
Spektrom.
CCD
IF
Laser
Raman Spectroscopy: Instrumentation
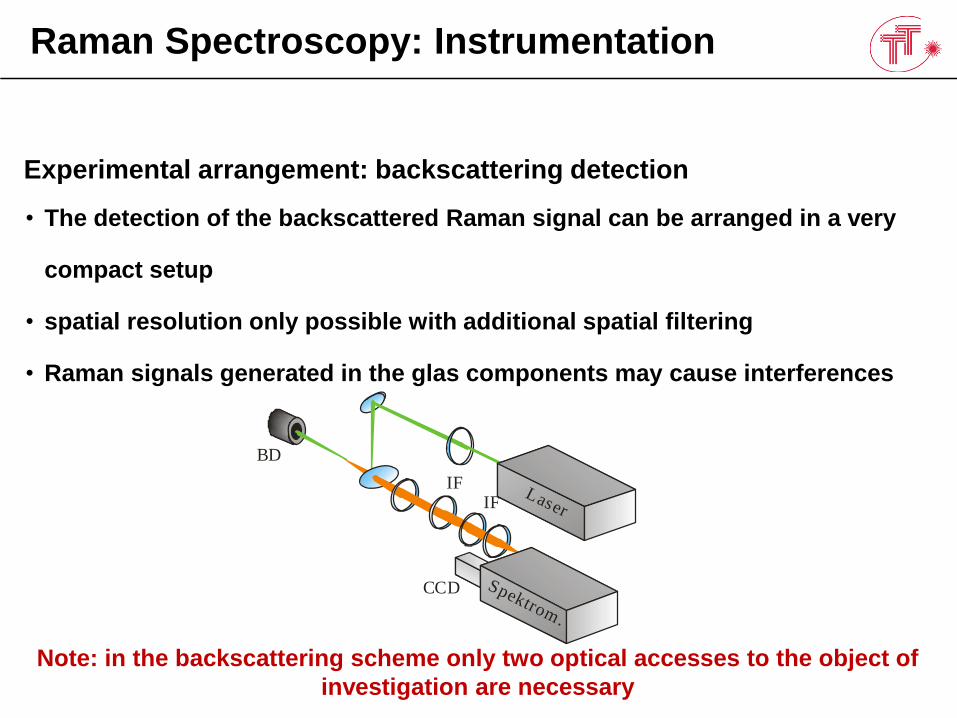
Experimental arrangement: backscattering detection
Note: in the backscattering scheme only two optical accesses to the object of
investigation are necessary
• The detection of the backscattered Raman signal can be arranged in a very
compact setup
• spatial resolution only possible with additional spatial filtering
• Raman signals generated in the glas components may cause interferences
BD
Spektrom.
CCD
IFIF
Laser
Raman Spectroscopy: Composition Analysis
Simple calibration of intensity vs. concentration
Sophisticated methods include
• Chemometrics, e.g.,• Principal Component Analysis (PCA)
• Partial least-squares regression (PLSR)
• Principal Component Regression (PCR)
• Support vector machines (SVM)
• Artificial Neural Networks (ANN)
Advantage: can deal with huge and highly complex data sets
Disadvantage: complicated and require large training data sets
Raman Spectroscopy: Composition Analysis
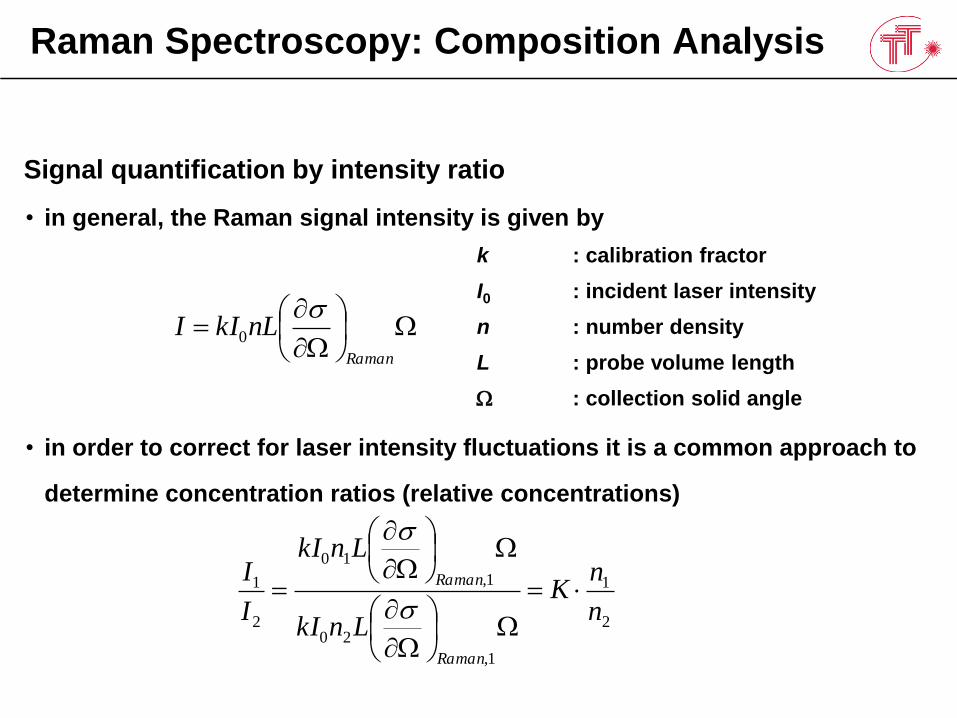
Signal quantification by intensity ratio
• in general, the Raman signal intensity is given by
• in order to correct for laser intensity fluctuations it is a common approach to
determine concentration ratios (relative concentrations)
Raman
nLkII
0
k : calibration fractor
I0 : incident laser intensity
n : number density
L : probe volume length
: collection solid angle
2
1
1,
20
1,
10
2
1
n
nK
LnkI
LnkI
I
I
Raman
Raman
Raman Spectroscopy: Composition Analysis
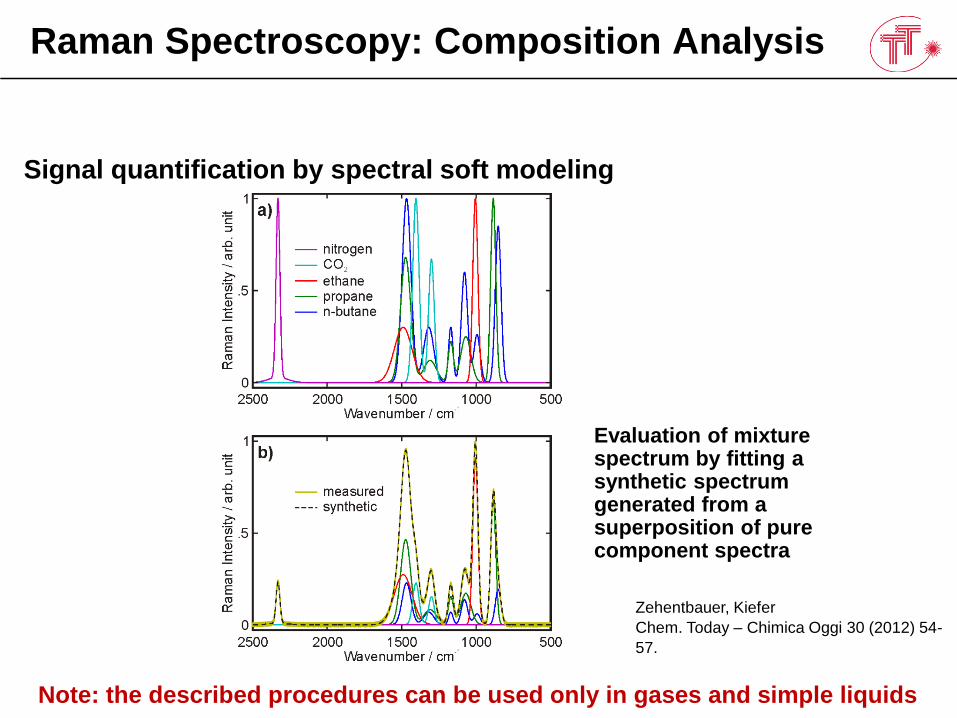
Signal quantification by spectral soft modeling
Evaluation of mixture spectrum by fitting a synthetic spectrum generated from a superposition of pure component spectra
Note: the described procedures can be used only in gases and simple liquids
Zehentbauer, Kiefer
Chem. Today – Chimica Oggi 30 (2012) 54-
57.
Applications: Natural Gas Analysis
Background of project
• Combustion behaviour in gas turbines depends on fuel composition
• For process control the composition information must be
provided with high accuracy and temporal resolution
• Nowadays: Technology in place
Calorimetry
only integral information about calorific value
not sufficient for control purposes
Gas chromatography
compositional information with high accuracy
time resolution in the order of minutes
not sufficient for control purposes
Applications: Natural Gas Analysis
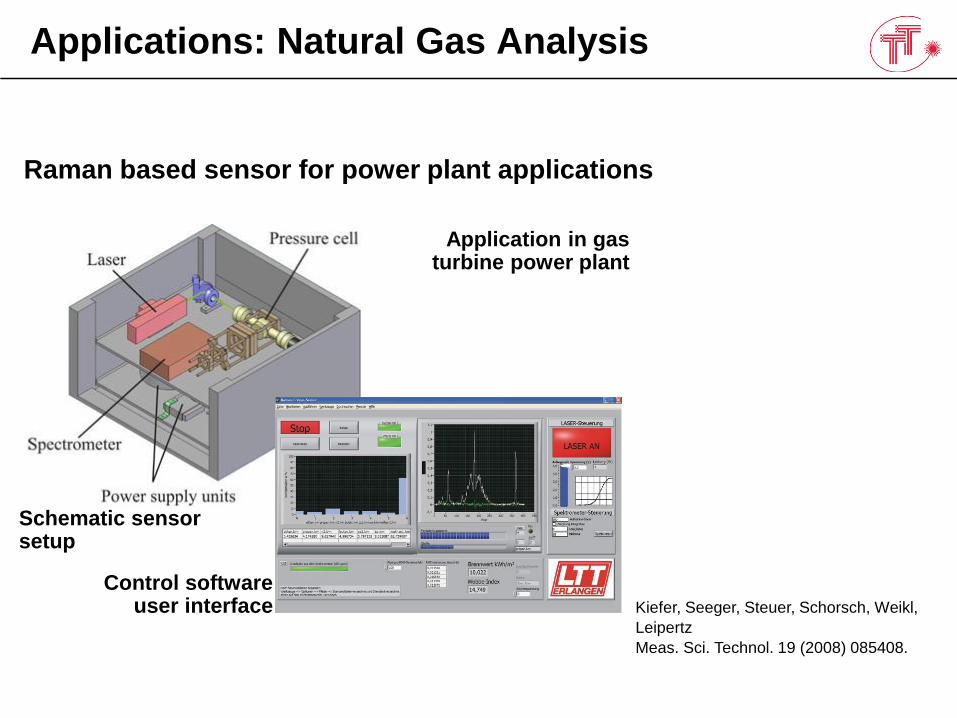
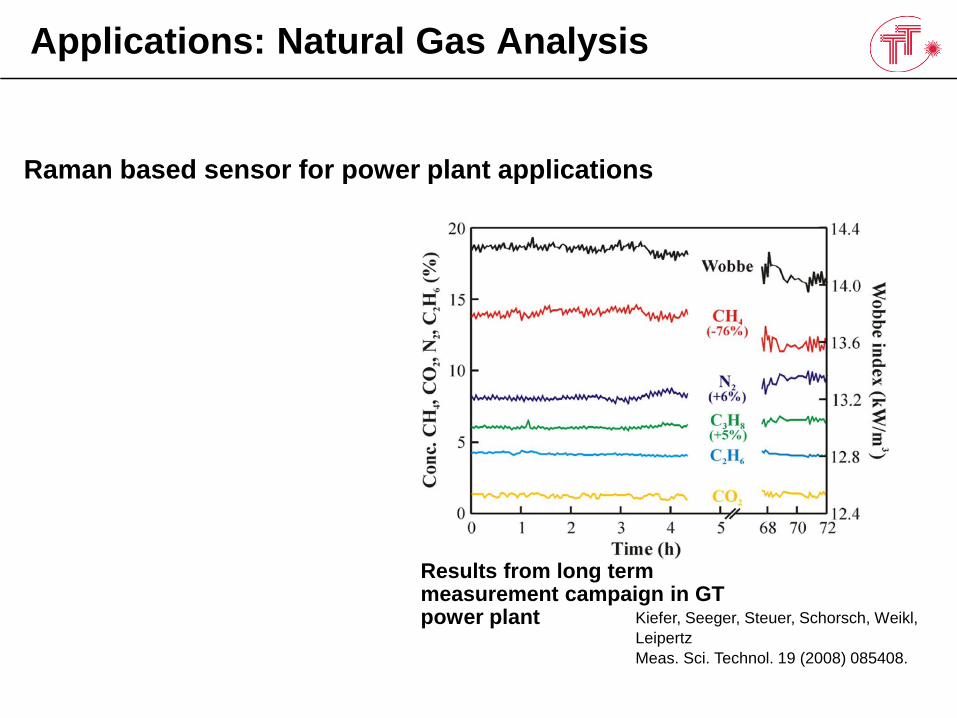
Raman based sensor for power plant applications
Kiefer, Seeger, Steuer, Schorsch, Weikl,
Leipertz
Meas. Sci. Technol. 19 (2008) 085408.
Schematic sensor setup
Control software user interface
Application in gas turbine power plant
Applications: Natural Gas Analysis
Raman based sensor for power plant applications
Results from long term measurement campaign in GT power plant Kiefer, Seeger, Steuer, Schorsch, Weikl,
Leipertz
Meas. Sci. Technol. 19 (2008) 085408.
Applications: Natural Gas Analysis
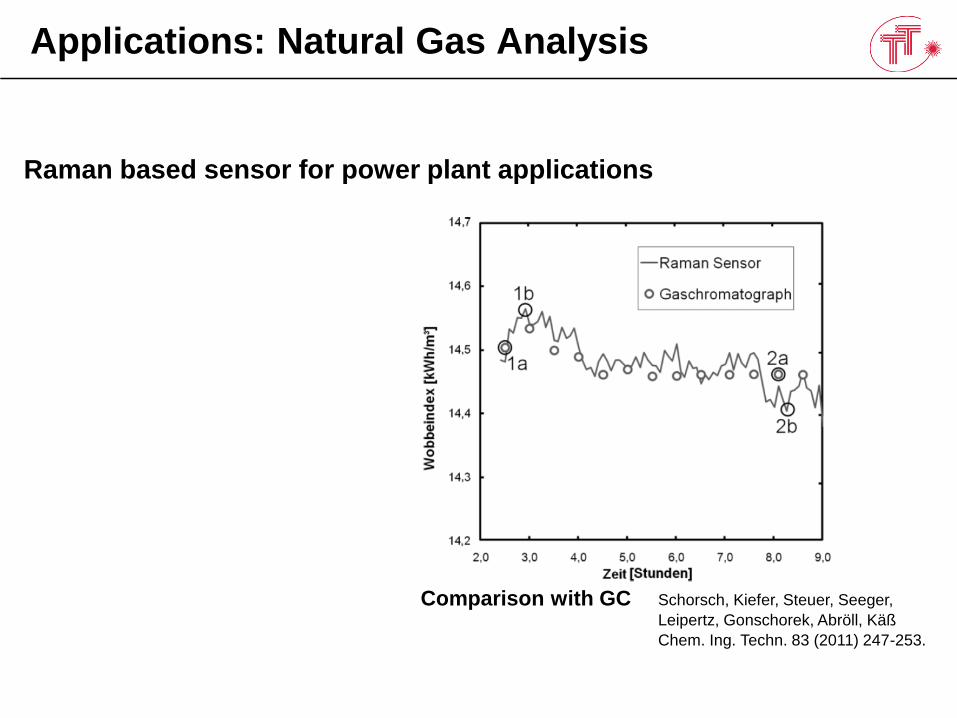
Raman based sensor for power plant applications
Comparison with GC Schorsch, Kiefer, Steuer, Seeger,
Leipertz, Gonschorek, Abröll, Käß
Chem. Ing. Techn. 83 (2011) 247-253.
Applications: Distillation Process
Background of project
• Distillation processes are of great importance, e.g., in the petrochemicalindustry
• Compositional analysis is complicated and time consuming
(GC, HPLC)
→ process control is difficult
• Multiple parameters influence product composition:
Feed composition
Heating strategy
Reflux strategy
Additives and impurities
• Aim of project:
Establish Raman spectroscopy as a tool for distillation
column monitoring
Show potential for analysing mixtures of liquid
hydrocarbons
Applications: Distillation Process
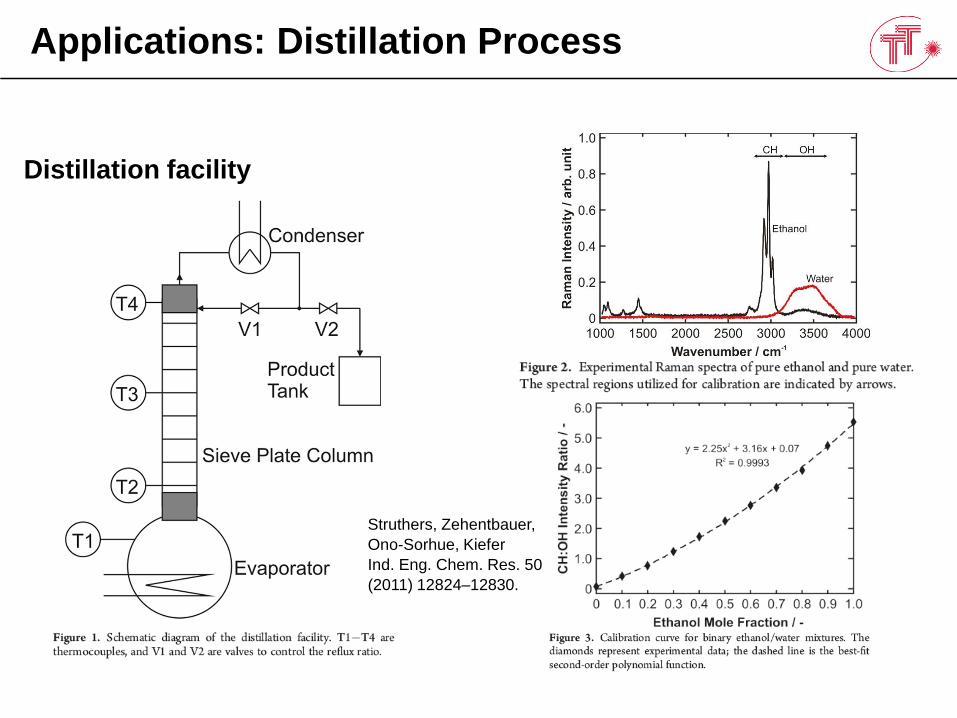
Distillation facility
Struthers, Zehentbauer,
Ono-Sorhue, Kiefer
Ind. Eng. Chem. Res. 50
(2011) 12824–12830.
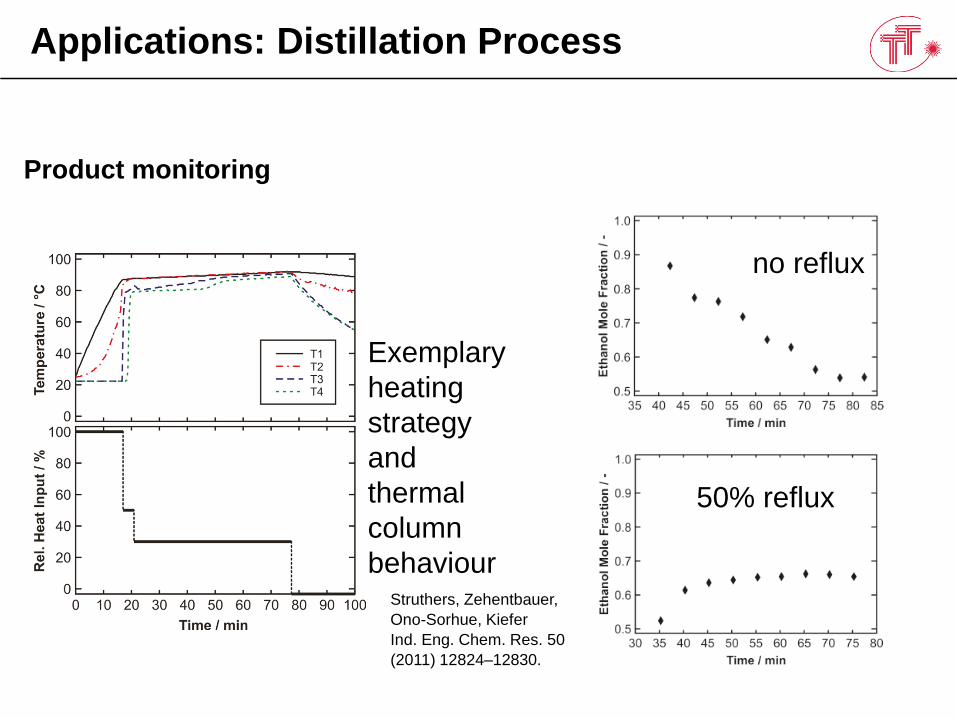
Applications: Distillation Process
Product monitoring
Struthers, Zehentbauer,
Ono-Sorhue, Kiefer
Ind. Eng. Chem. Res. 50
(2011) 12824–12830.
no reflux
50% reflux
Exemplary
heating
strategy
and
thermal
column
behaviour
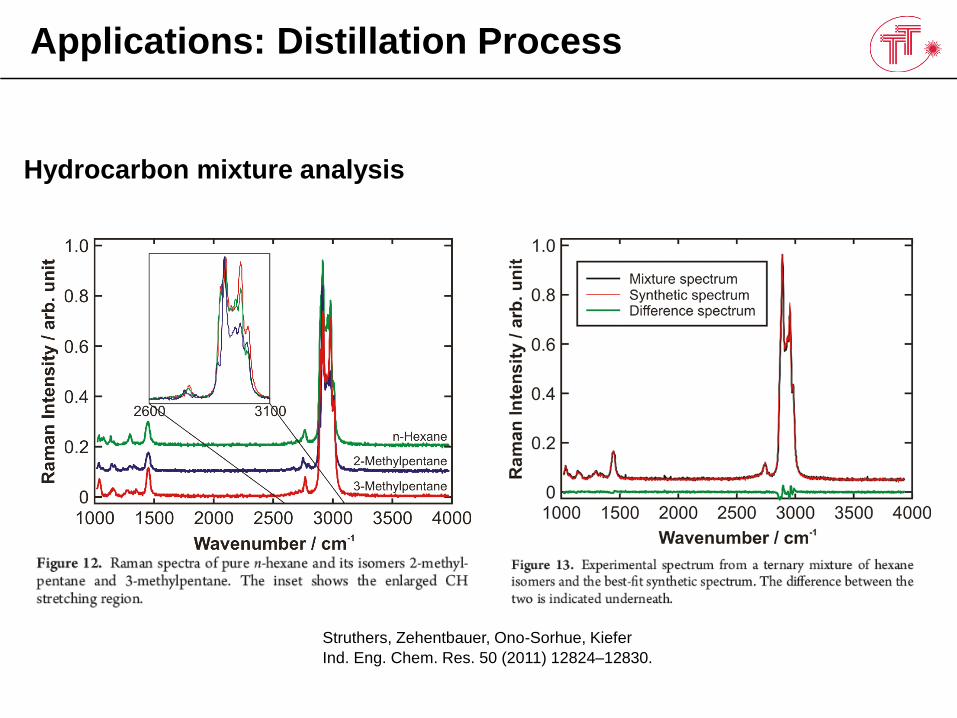
Applications: Distillation Process
Hydrocarbon mixture analysis
Struthers, Zehentbauer, Ono-Sorhue, Kiefer
Ind. Eng. Chem. Res. 50 (2011) 12824–12830.

Raman Spectroscopy: Composition Analysis
Signal quantification by chemometrics
• PCA and PLSR of Scotch whisky
• The PCs can then be utilized in a regression analysis
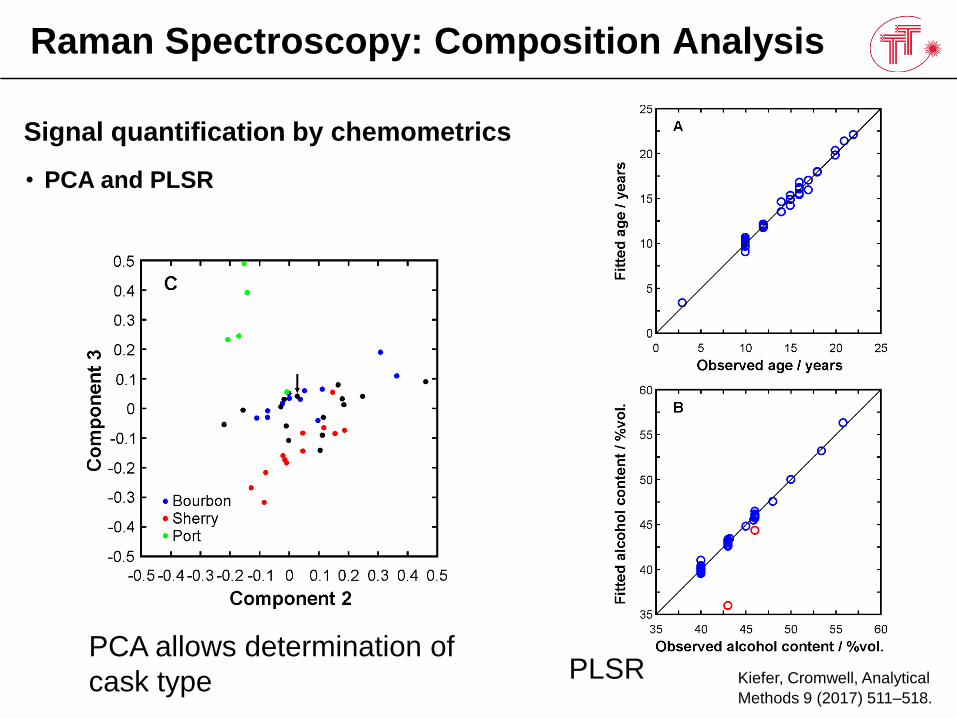
Raman Spectroscopy: Composition Analysis
Signal quantification by chemometrics
• PCA and PLSR
Kiefer, Cromwell, Analytical
Methods 9 (2017) 511–518.
PCA allows determination of
cask type PLSR
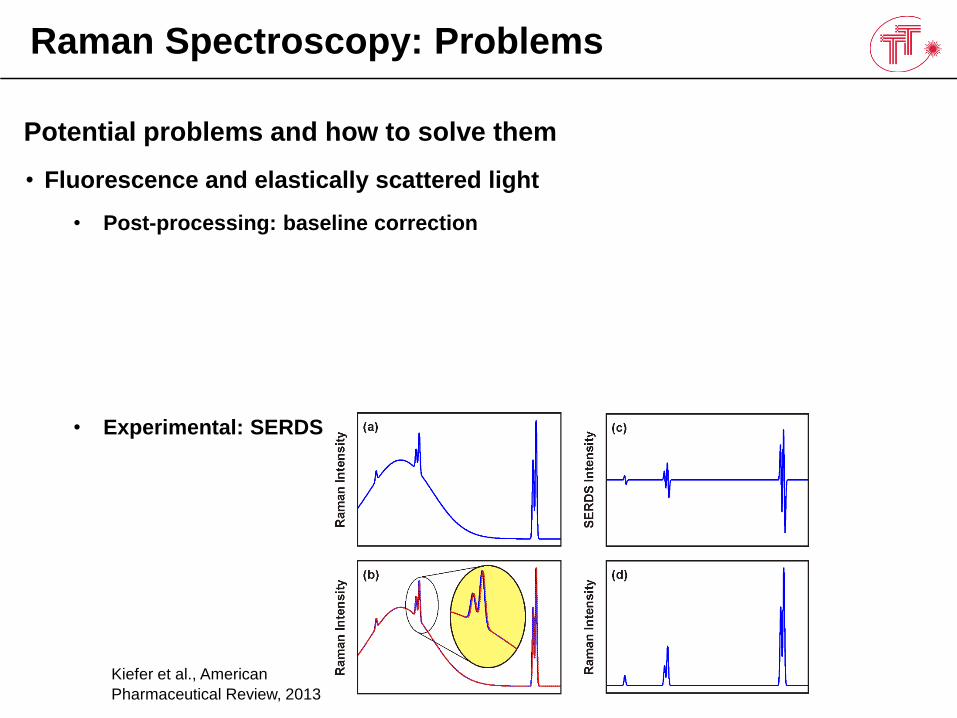
Raman Spectroscopy: Problems
Potential problems and how to solve them
• Fluorescence and elastically scattered light
• Post-processing: baseline correction
• Experimental: SERDS
Kiefer et al., American
Pharmaceutical Review, 2013
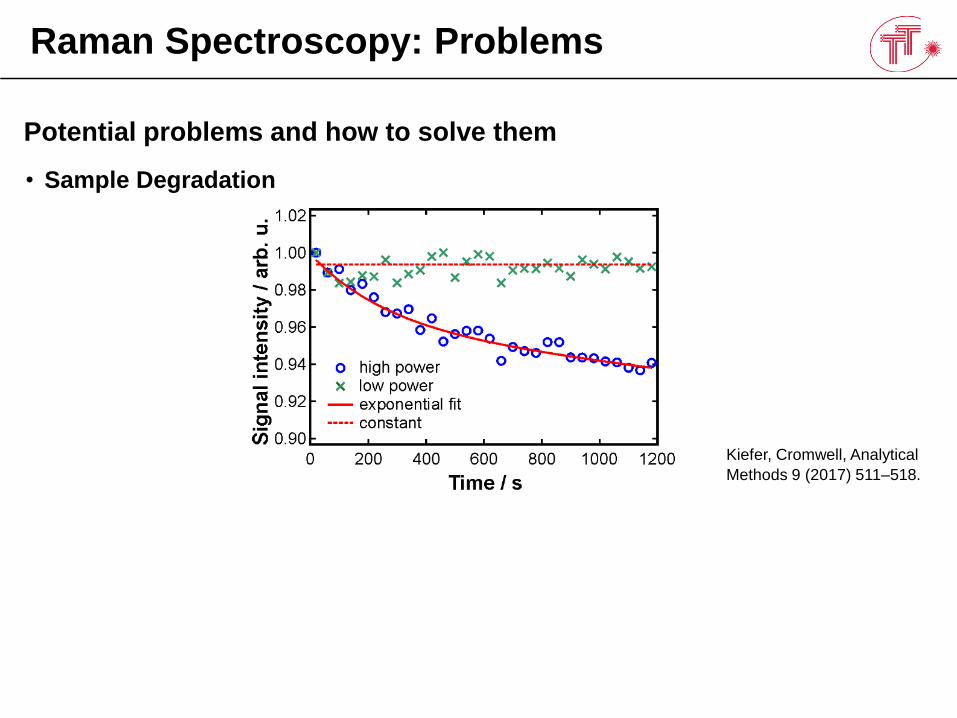
Raman Spectroscopy: Problems
Potential problems and how to solve them
• Sample Degradation
Kiefer, Cromwell, Analytical
Methods 9 (2017) 511–518.
Literature
• Banwell and McCash, “Fundamentals of Molecular
Spectroscopy”, McGraw Hill
• D. A. Long, „Raman Spectroscopy“, McGraw Hill Higher
Education Gebundene, 1977
• J. Kiefer, “Recent Advances in the Characterization of
Gaseous and Liquid Fuels by Vibrational Spectroscopy”,
Energies 8 (2015) 3165-3197; doi:10.3390/en8043165
Universität Bremen
Raman Spectroscopy
for Underwater Sensing
Johannes Kiefer
Technische Thermodynamik
Universität Bremen, Germany

• Raman Spectroscopy in aqueous systems
• Raman spectroscopy in sea water
• Applications
Outline
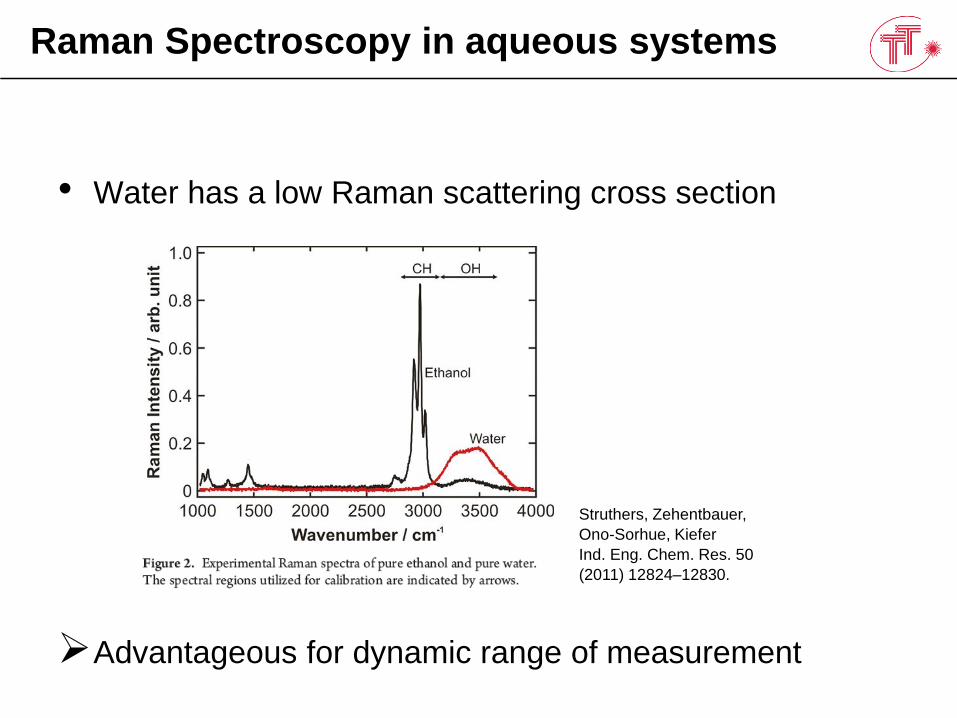
Raman Spectroscopy in aqueous systems
Struthers, Zehentbauer,
Ono-Sorhue, Kiefer
Ind. Eng. Chem. Res. 50
(2011) 12824–12830.
• Water has a low Raman scattering cross section
Advantageous for dynamic range of measurement
Raman Spectroscopy in aqueous systems
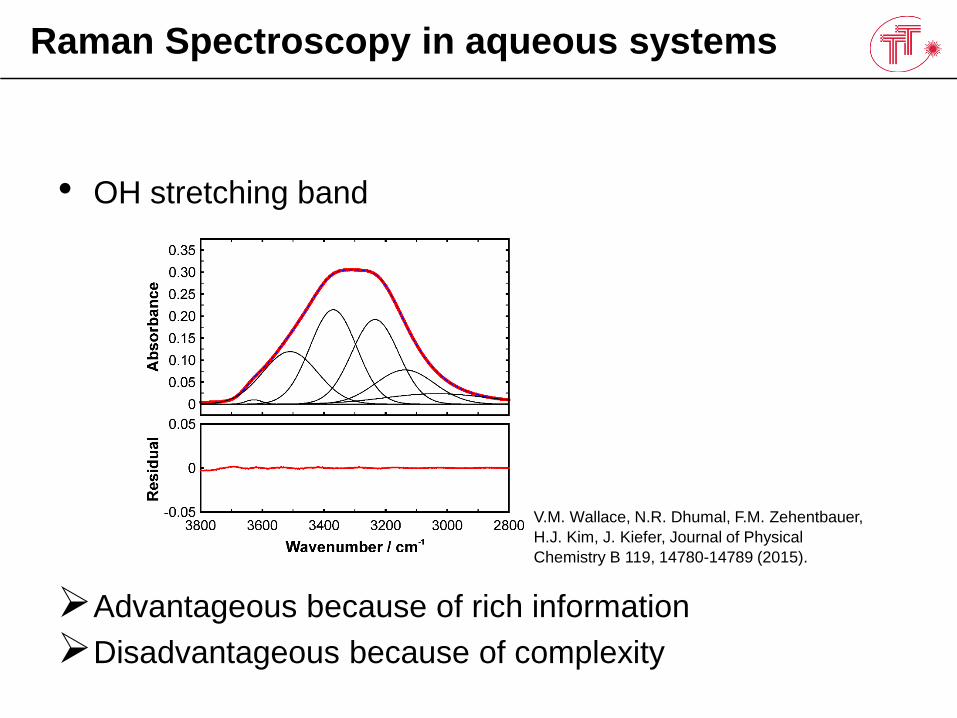
• OH stretching band
Advantageous because of rich information
Disadvantageous because of complexity
V.M. Wallace, N.R. Dhumal, F.M. Zehentbauer,
H.J. Kim, J. Kiefer, Journal of Physical
Chemistry B 119, 14780-14789 (2015).
Raman Spectroscopy in sea water
• Sea water contains a large variety of chemical
substances (and other stuff…)
• Dissolved salts
• Cations: sodium, potassium, magnesium, …
• Anions: carbonate, chloride, bromide, sulfate, …
• Dissolved gases
• Nitrogen, oxygen, carbon dioxide, methane, …
• Liquids
• Carbon dioxide, hydrocarbons, …
• Microorganisms, small animals, …
Raman Spectroscopy in sea water
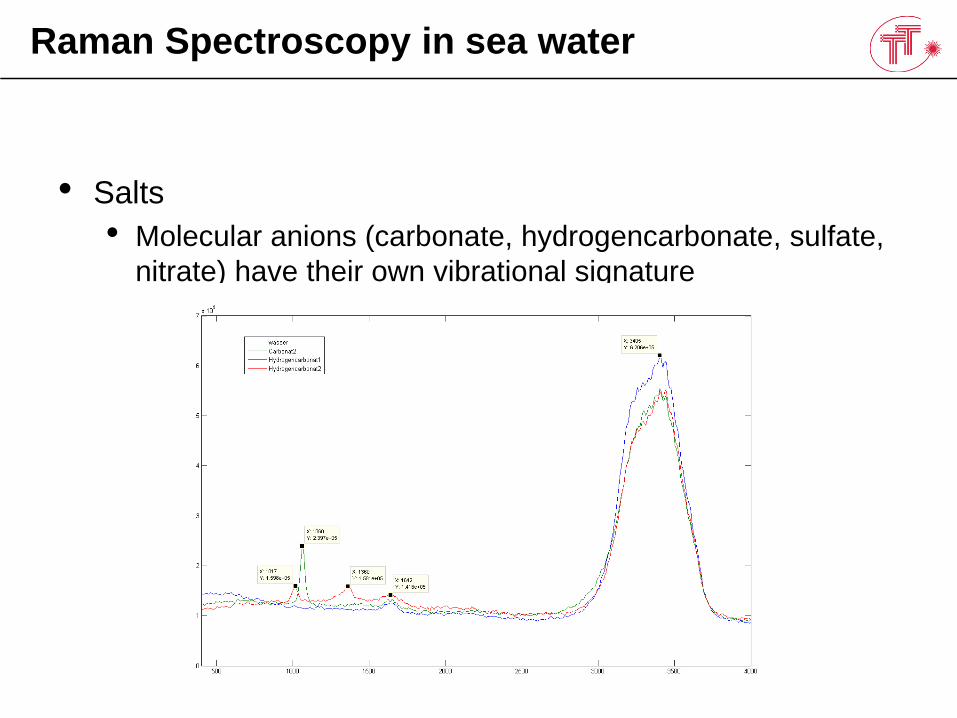
• Salts
• Molecular anions (carbonate, hydrogencarbonate, sulfate,
nitrate) have their own vibrational signature
Raman Spectroscopy in sea water
• Dissolved gases and liquids
J.D. Pasteris et al., Applied Spectroscopy 58
(2004) 195A-208A
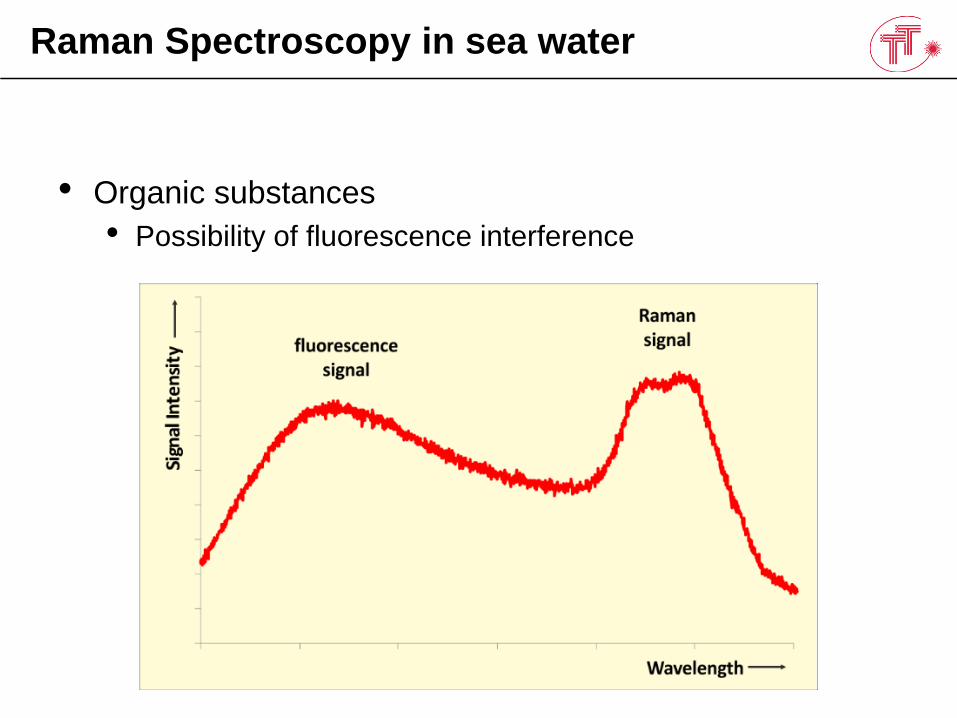
Raman Spectroscopy in sea water
• Organic substances
• Possibility of fluorescence interference
• Raman Spectroscopy in aqueous systems
• Raman spectroscopy in sea water
• Applications
Outline
Details on Subsea Raman can be found in:
• J.D. Pasteris, B. Wopenda, J.J. Freeman, P.G. Brewer, S.N. White,
E.T. Peltzer, G.E. Malby,
“Raman Spectroscopy in the Deep Ocean: Successes and
Challenges”
Applied Spectroscopy 58 (2004) 195A-208A.
http://journals.sagepub.com/doi/pdf/10.1366/0003702041389319
• X. Zhang, W.J. Kirkwood, P.M. Walz, E.T. Peltzer, P.G. Brewer,
„A Review of Advances in Deep-Ocean Raman Spectroscopy”
Applied Spectroscopy 66 (2012) 237-249
http://journals.sagepub.com/doi/full/10.1366/11-06539
Note: These Focal Point Articles are free for download from the website of
Applied Spectroscopy.