job performance and age: i - university of california ... · job performance and age: a study in...
TRANSCRIPT
Bulletin No. 1203September 1956
Job Performanceand Age:
I
UNITED STATES DEPARTMENT OF LABORJames P. Mitchell, SecretrBUREAU OF LABOR STATISTICS VANHJ`1t'3 SO] A1i9b3AINfEwan Clagn, Coummsimomr aM 1S 011Y1H3
lviii sna -'o ilnliuSNI
A Study inMeasurement
aIo ' 1956of

Reports on the Department of Labor's Older Worker Program:
Job Performance and Age: A Study in Measurement
Older Workers under Collective Bargaining:Part I. Hiring, Retention, Job Termination
Older Workers under Collective Bargaining:Part II. Health, Insurance, and Pension Plans
Pension Costs in Relation to the Hiring of Older Workers
Older lorker Adjustment to Labor Market Practices:An Analysis of Experience in Seven Major Labor Markets
Counseling and Placement Services for Older Workers
How to Conduct an Earning-Opportunities Forum in YourCommunity

(Bulletin No. 1203)September 1956
1Job Performanceand Age:
IA Study inMeasurement,,
UNITED STATES DEPARTMENT OF LABORJames P. Mitchell, Secretary
LflESSrEAU OF LABOR STATISTICSCift , Commlsioner
For sale by the Superintendent of Documents, U.S. isk;_m* Printine Offieet Washington 25, D.C. - Price 45 cents
of

Preface
One of the most pressing problems confronting this Nation concerns thedifficulties of the older worker In securing and retaining employment. TheU. S. Departnt of Labor, aware of these difficulties, has undertaken a broadprogram to e e these problems, and, if possible, to find means for over-coming them. As part of this program, the present study examines the problemsof measuring the relationships, if any, between age and work performance.
Nuerous studies have recorded the attitudes of employers on this subjectsand have revealed a rather widespread set of unfavorable beliefs concerning thework performance of older workers.
It is a fair preasvption that there is some relationship between theseattitudes and the problems mentioned above. It is important,, therefore, toexamine, through objective measunements, the question of how age actuallyaffects job performance.
A basic factor in establishing the need for this study was the almsttotal lack of past surveys, of any extensive scope, in this field. Since itis extre common, in productive enterprises, to find large groups ofworkers performing the same task, previous studies of age and work performancehave made little use of on-the-job performance records between age and jobperformance.
Although not minimizing the difficulties of conducting such a study,, theBureau of Labor Statistics thought that it would be possible, throug the de-velopment of suitable techniques to overcome man of the obstacles to usingactual performance data derived from plant records.
The Bureau also recognized that these difficulties were not purely in thearea of statistical manipulation, but involved an interplay of statisticalproblems with problems of data collection. It was concluded, therefore$, thatalthoug the necessary statistical tools were undoubtedly at hand in the a-vailable literature, the actual application of these tools could best be workedout In a pilot study, in which all of the important obstacles would have to befaced in a practical wo.
In the actual conduct of the study, it was found that certain techniqueswhich seemed initially to meet the needs of this program were, in practice,msuitable. In these cases, alternative methods were developed and tested.For eaple, it was believed that classification of worlers into 5-year agegroup wuld be an appropriate means of identifying the age factor. In at-tempting to apply this procedure, however, it was discovered that the numberof observations in each group was too smll to permit meaningful comparisons,and 10-year classifications were substituted. In another instances it wasassumed that sidll levels for each occupation could be determined through theuse of the Dictionary of Occupational Titlas. This was also found to be un-workable and a different method of skill-level classification bad to be used.
- iii -

Such difficulties are inherent in the subject matter of this survey.Compay records ahow little or no miformity, and are not designed to yieldthe type of information needed in a program of this sort. Yet some standard-isation of data-collecting procedures was obviously needed in order to providestatistics that would be comparable among the various plants. This standard-ization required a detailed e iation of the records actually maintained inindustrial plants, followed W an analysis of hew these records might be usedto derive coherent measures of job performance. The analysis had to make pro-vision not only for variatins in recordkeeping, but also for differnces inthe basic definitions employed by various comaies. For exmple, it wasfomd that the distinction between terminations and leaves of absence was nutclear cut, and varied from plant to plant. Similar problems of interpretationarose in each of the other areas.
It was anticipated that there would be a certain auoimt of trial anderror, and that this would tend to reduce the quantity of data that would comeout of a stud which had to be completed in a given period of time. It wasbelieved, nevertheless, that such a study could met an Imrtant need bydeveloping and testing various nev approaches to the investigation of re-lationships between age and wrk performance.
By its nature, this program was not apected to produce ary extensivefindings with respect to these relationships. Nevertheless, man of the pro-cedures used were similar to those which might be required in a full-scalesurvey, and the results of these procedures are, therefore, presented as sta-tistical findings in the bobr of the report. These statistics apply only tothe particular plants that were covered in this survey, however, and are notin any way intended to represent conditions that might be fomd to exist ifan entire industry had been surveyed.
This stud was conducted in the Division of Productivity and TechnologicalDevelopmnts uder the direction of Jerome A. Mark, who prepared the reportwith Wolfram Liepe and Bernard Rein, assisted by Robert B. Malakoff andStanley Miller.
The statistical formulas were derived with the assistance of Morton Raffof the Bureau's Office of Statistical Standards.
The Bureau wishes to eipress its appreciation to those firm whose whole-hearted cooperation made this work possibleo They generowly made their rec-ords available to the Bureau's representatives and offered man helpful sug-gestions.
- iv -
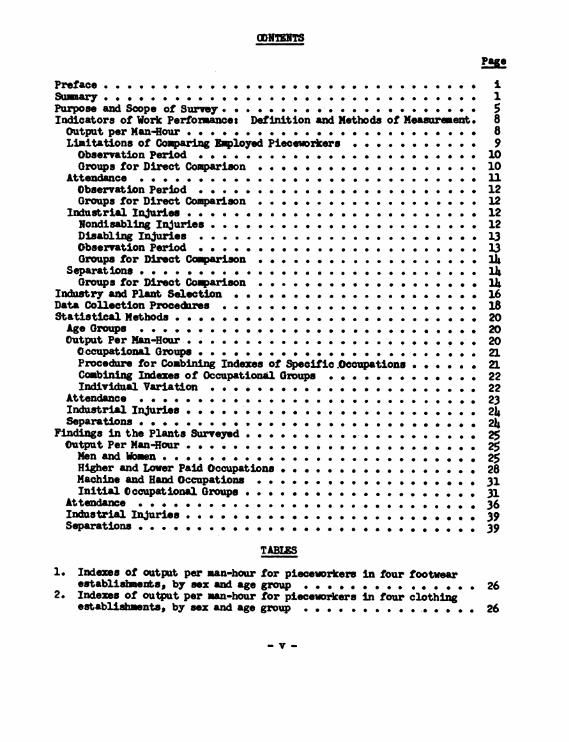
Preface ................ . .....*.................£
Sumary . . . .. ..... ... . . . . . ....# 1
Pur eno peofSey a eo............*......- 5Indicators of Work Performances Definition an Methods of Measurement. 8OutputperMan-Hour . . . . .. . . .. . 8LiitationsofComparing Employ"Piecerkers . . . ....... 9ObservationPeriod .*. . . . . . . . . . . . . . . . . 10GroupsforDirectComparison .......... .10
Attendace........................ ....... ... . .....................nObservationPeriod . ....... .......* 12GroupsforDirectComparison ..... . . . . . 12
Indust~rialInjuries ....... . . 12Nondisablingnjuries............ 12DisablingInjuries........... .13ObservationPeriod . . . . ... ... ** .. . .... 13GroupsforDirect Coparison . . . . .. &... . . 11
Separations ....................................................... 14Groups for Diret Coparison . . . . . . .... . . .1. . . . . li
IndistryandPlant Selection .... ....... . 16DataCoflectionProcechares .... ........ 18StatisticalMethods. * ...... .... ... ........2.20Age Groups . . . . . . . . . . . . . . . . . . . . . . . . . . . . . 20OutputPerMan-Hour .. . . . . . . . . . . . . . . . . . . . . . . . 20Occupational Groups . ... ..... 21Procedure for Combining Indexes of Specific.Occupations . . . . . . 21Combining I xesof Occupational Groups .... . . . . . . . . . 22Individual Variation . . . . . . . . . 22
Attecance . *.. *.... .......................... 23IndustrialInjuries............ ....... 24Separaions............... .....................................24
FindingsinthePlantsSurveyed ................... . 25OutputPerMan-Hour . . ............... . . . . 25
MEnandiWoen **m .. . .. ......... . . . . . . . 25Higher andLowerPaidOccupations .... . . ....... 28Machineand HandOccupations . . .... ...... 31InitialOccupatG Grp 3.................... 31
Attenane . * * * ............. 36IndstrilInjries . . . ........... 39Separations ......................... 39
TABLES
1. Indexes Of output per man-hour for piecewrkers In four footwearestablishuentsbysexandagegroup ... . .... .. .. .. ...* . 26
2. Indexes of output per man-hour for pieceuorkers In four clothingestablishments, bysexandagegou...group* a .. . ............. 26

COTES-Continued
Page
TABLB--Contnuied
3. Indexes of output per man-hour for son pieceworkers in higherand lower paid occupations in four footwear establishments, byage group .......... * ..... * *....... 29
4. Indexes of output per man-hour for women pieceworkers in higherand lower paid occupations in four footwear establishments, byage group . . ... .. . . . . . . . . .. . . . . ..* . . . . 29
5. Indexes of output per man-hour for men pieceworkers in higherand lower paid occupations in four clothing establishments, byage group o o * * ** * * * * 30
6. Indexes of output per man-hour for women pieceworkers in higherand lower paid occupations in four clothing establishments, byage group *..............*o * ........*.....* 0@ 0000... 30
7. Indexes of output per man-hour of men pieceworicers performingmachine and hand operations in four footwear establihmets, byage group . . . ..... ... .. *. ............... . . . . . ... 32
8. Indexes of output per man-hour of women pieceworkers performingmachine and hand operations in four footwear establishments, byage group a.* * * -a. .................... . . . . . . . . . . . . 32
9. Indexes of output per man-hour of men pieceworkers performingmachine and hand operations in four clothing establishments, byage group .o.. . *e . .00000.0 0 0000 33
10. Indexes of outputper man-hour of wosen pieceworkers performingmachine and hand operations in four clothing establishments byage group 0 0 0 0 * * * * * 0 0 * 0 0 * 0...* * *........... 9 . 33
U. Indexes of output per ma-hour of pieceworkers in four footwearestablishments, by sex, age group, and type of occupation 00.0 00 34
12. Indexes of output per man-hour of pieceworkers in four clothingestablishments, by sex, age group, and type of occupation o**.. 35
13. Indexes of attendance of pieceworkers in four footwearestablishents, by sex and age group .0...0.000.. 000000 37
14. Indexes of attendance of pieceworkers in four clothingestablishents, bysexand age group . . . . . 0.0 *. . *. . 37
15. Indexes of attendance for pieceworkere In higher and lower paidoccupations in four footwear establishments, by sex and age group . 38
16. Indexes of attendance for pieceworkers in higher and lower paidoccupations in four clothing establishments, by sex: and age group . 38
17. Industrial injuries of pieceworkers, in selected shoe plant A bysex, occupation and age group, during 1-year period endingDecember 31, 1955 ...............*...............0 0 *..........* 40
18. Industrial injuries of pieceworkers, in selected clothing plant Bby sex, occupation and age group, during 2-year period endingDecember 3l, 1955 0.....0 00... 0000* * *00. 000 0 * *0 0 0..00 41
- vi -

CGRENTS--Continued
PAge
T LES-Continged
19. Industrial injuries of pieceworkers, in selected clothing plant Cby sex, occupation and age group, during 2-year period endingDecmber 31, 1955 .................................. . *.. . . . . 42
20. Indexes of separation rates of pieceworkers in two footwearplants by sex, length of service,and age group .o... . . . . . . I&44
21. Indexes of separation rates of pieceworkers in two men's clothingplants bb sexs, length of serviceand age group @00000 *** . 45
APPENDIX
1. Further Notes on Statistical sthods .4.6.. *.. . . . . . . . 4Definition of Universe...... *....0.0. 46Occupational Classification. .. . . . . ...... . 47Transforming Absolute Scores;Into Indexes .. 49Combining Occupation Indexes . . ... * * * * * * **.... . . . i49Measures of Dispersion . . . . o *.......* ........ 50Statistical Signficance Testig ................5
2. Derivation of Fomulas ...................... 52Weights for Combining Indexes for Specific Occupations . . . . . 52Variance of an Age Group Index for an Occupation Group .. . . . 54Weights for Combining Indexes to Base A with Indexes to Base B . 54Variance of the Combined Index . . . . . . *. ... 0a * *0.. . 56Coefficient of Variation for an Occupational Group . . . 0. . .. 58Combining Occupational Group Indexes . . . . . . . . . . . . . . 59
3. Questionnaire and Worksheets . . ... .. . ....... .. . .. .. 614. Instructions for Questionnaire and Worksheets o *...... . . ... . . 64
- vii -
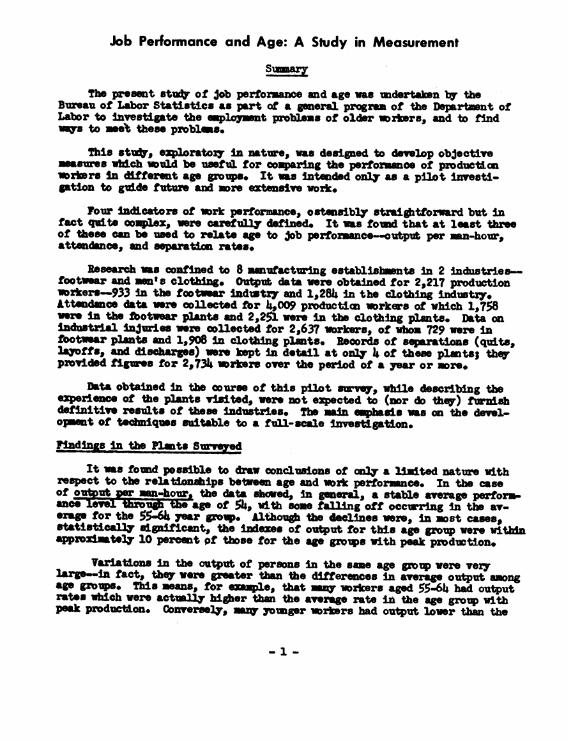
Job Performance and Age: A Study in Measurement
The present stu of job performance and age was umdertalen by theBureau of Labor Statistics as part of a geeral program of the Departant ofLabor to Investigate the mployment problems of older uorkers, and to findWis to met these probles.
This stvdy, exploratoiy in nature, was designed to develop objectivesasaich wuld be useful for comparing the perfo ance of production
worbers In different age groups. It was intended onlyas a pilot investi-gation to guide future and more extensive work.
Four Indicators of work performance, ostensibly straightforward but infact quite complex, werecsrefully defined. It was foud that at least threeof these can be ued to relate age to Job performance-output per mn-hour,attendance, and pratm rates.
Research was o ed to 8 manufacturing establishm-ts In 2 industries-.footwear and mn' clotig. Output data were obtained for 2,217 productionworkers-933 in the footwear indvotZ7 and 1,284 in the clothing industry.Attendance data were collected for 4,009 production workers of which 1,758were in the lbotwear plants and 2,251 were in the clothing plants. Data onindustrial injuries were collected for 2,637 workers, of wheo 729 were Infootwear plants and 1,908 in clothing plants. Records of separations (quites,laoffs, and discharges) were kept in detail at only 4 of thes plants; theprovided figue for 2,734 mrkers over the period of a year or more.
Bts obtained In the course of this pilot swrvey, while describing theexperienc of the plants visited, were not expected to (nor do they) furishdefinitiv results of these indutries. Thbnain emphasis was on the devl-ojuent of teniqus suitable to a full-scale investigation.
Fdings In t Sod
It as fowd possible to draw conclusions of anly a liUited nature withrespect to the relationahips beteen age and work perforuance. In the caseof o ut man-hour the data shmed, in g , a stable rage perform-
age of 54s, with some falling off occurring in tbh av-erage for the 55-64 year growp. Although the declines were, in most cases,statistically sdinficant, the index of output for this age group were witkdnapproximately 10 perct pf these for the age groups with peak production.
Variations in the output of persons in the same age gpup were vez7large-In fact, they were greter than the differces in avr output amongage growus. This seans, for eme, that man workers aged 556 had outputrates which were actally higher than the avr rate in the age group withpeak production. Convverely, inu younger workers had output lower than the
- 1 -

average output of older workers. Insofar as practical implications areconcerned, these data emphasiz. the fact that-an employer in considering anapplicant for employment uhould evaluate the potetiaties of the Individualrather than i diately drawing conclusicus from his chronological age.
The age-output cnvesat industzy, saes type of operation (hand or ma-chine) and e ins levels followed the s general patterns In each industryboth in regard to averages for age groups and vaiations of the output of'individuals within the sam age gzoup.
With respect to attendance, only mall differences were found among agegropas. In the shoe plantisidexes of attendance for the six age groupsvaried by only 3 percent and in the clothing plants by only 7 percent.
With regard to indutrial injrs, the study did not provide data whichcould be used to make o ins tween age grous. This ws due partly tothe lack of uiformity in omy iJu records, and also to the fact thata survey with wider coverage would be needed to produce meaningful resLte.Many ago groups showed no injuries during the years studied.
Information on sa tions ws collected, but thadeq of this in-formation varied asheveral plants surveyed, and it was found possibleto present findings for only four of thse plts. The data showeds in gen-oral, a high rate of quits and discharges for cause for workers mder 2 yearsold In two plants there were extremely low rates for-the age group 45 to 64;in the others no pattern was fovnd. After 65 retirement influenced the resultsmarkedly. In view of the relatively semfl coverage of the stuldy, it is notpossible to idsntil m significant differences in the age-separationspatterns shown by the various groups. In a larger scale survey, howevers itwould probably be iportant to retain the categories used here, in whichdistinctions are made according to sexs industry and length of service.
Measures of Job Performance
Four indicators of work performance-output per ma-hour, attendancesIndustrial injuries, and separatins--were selected for comparing age groupsbecaue they afforded objective masuress and data for them were thougtto be directly available from plant records.
O ut jor man-hour was masured by comparing the average hourly plece-rats eaings of Individuals working at the same operation. Many plants whichuse a piecework system maintain records on individual average hourly earnings.No means were fowd to masure the output of timeworkerss nor were dataavailable on qualit of work produced by Individual empyees.
Attendance ws defined as the ratio of dqys worked to days scheduled.Although this is a relatively straightforard wasure, the lack of uniformand complete plant records created difficulties In deriving attendance rates.
- 2 -
Indutrial inuiso Serious problems were encountered in measuringindusri il e~l.J D ifee s In recordkeeping practices of plants, par-ticarlay with respect to nondisabling injuries and the frequent lack of dataon total hours worked by individuals for as long as a year were the mostserious. Moreover, the extreuwly low incidence of injuries would have neces-sitated the collection of data for a long period of tim. This was found tobe prohibitive within the tim and funds available for this study, and thereforethe data provide no injur rates by age for the plants covered.
Srarattions. Some plants did not maintain detailed records of quits,layo a, and discharges. Problems were also encountered in distinguishingseparations from ded ab ces. The s available were so varied indetail that it was found possible to present illustrative findings for onlyfour of the plants.
Statistical Methods
Since the data collected in the plants pertained onLy to individualworkers, it was necessary to apply some process which would lead to findingsof a more general nature. This mas dcne in the following ways
Each worker was classified tb age, into oe of six groups. The workerswere then further classified into groups by characteristics which might berelated to work performancep such as sex, plant where employed, occupation,and length of experience. The particular characteristics employed as criteriavaried with the measure sougt; the purpose, in each instance, was to grouptogether the workers who could be considered omgeneous with respect to thenon-age factors affecting the measure under consideration. Direct comparisonswere made among individuals within these groups. For output per man-hour eachoccupation was treated separately, since it was believed that the nature ofthe specific occupation has a bearing on output. For attendance, on the otherhand, it was felt that the specific occupation of a worker would have littleinfluence on his attendance rate but that the general earnings level of hisjob might affect it.
In analyzing data for workrs within one of these homogeneous groupings,any difference in performance among age groups can be more clearly related toage. These differences were measured by calculating indexes for each agegroup average, with the 35-44 year group as the base. This was done separatelyfor output per man-hour, attendance, and separations.
Throug the use of indexes and the classification system, the influenceof non-age factors was substantially eliminated, since each worker was beingcompared only with other workers who had these factors in common with him.The indexes could then be combined to obtain larger groupings by averagingthe indexes, with each coWonent of the average being assigned a weight whichdepended on the nvaber of individuals represented.
- 3 -

The present study has clarified and solved some of the most importantproblems that must be faced In objecttvely measuing the relatinship of ageto work perforince.
Information about the availability and adequacy of plant records wasobtained and procedures were developed for obtaining data.
A mans was found for comparing the perfornance of workers in differentoccupations.
Methods were devised for appropriately combining data into larger aggre-gations in order that sore general and more reliable conclusions could beobtained.
The results shoun In this report althou& not furnishing conclusiveanswr to the question with wich it deals, represents an important prelimd-nai7 step toward further work in this area.
How age affects work performance is a subject on which little factualinformation is available. Nevertheless, the belief that work performancedeclines as age increases is widespread, and constitutes one of the mostimportant barriers to the employment of older workers. Studies of employers'attitudes toward older workers have consistently shown that this belief isone of the reasons most frequently cited for failing to hire older workers.
The Teple University Bureau of Jloonmics and Busies Research conducteda study in conjunction with the Pennsylvania Burew of Naployment Securitysthe results of which were reported in 1953 at the Seoond Co r e on theProblems of Naking a Living While Growing Old. in response to the question'What factors in your view tend to limit the feasibility of hiring olderworkers?" the survey found that is offerd a variety of reasons forresticting the hiring of older worker, but the most important of the reasonsgiven were 'rate and quality of production.* I/
Similarly, in the Diployment Sec8aity Review of Decmber 1950, it wasreported that 'several surveys conducted by the Bureau of Employment Securityin cooperation with affiliated State agsncies reveal that the reasons mostfrequently given for not hiring older wor rs s (1) Fear the hiring ofolder workers would increase workme's compensation and inrae costs,(2) less productive and unble to mst physical requirements, (3) greaterinjury rates, (4) difficlty in retraining, and (5) promotion from withinpolicies. 2/
Consequently, it is believed that data on Job performance by age can beused to test, within selected occupational areas, whether these notions arein fact valid. The resuts obtained an provide itonal io tion foremployers and may Indicate in what occupational areas there are real problems.
/ Willard B. Gladflter, provost and vice president of Temple Univer-sity, Age and Employability In P s aa (in Proceedings of the SecondConference on the Problem of Making a Living Wle Growing Old)e Oomnwealthof Pennylvania and Teiple University, 1953 (p. 27 and table mI, p. 398).
2/ Willim Mirengff, Older Worker Employment - Benefit or Burden,Znploymt Security Review, December 1950 (p. 9).
3/ Similar findings regarding the importance of employers' attitudes onork performance as a barrier to the employment of older workers can be found
in other studies. See, *.g., The Emloyer and the Older Worker by thePersoannl Club of New York (in Making th Years (bunt), New York State JointLegislative Committee on Pro} ims of Aging, Legislative Do 32, 1955(p. 88); also Personnel Policy and Older Workers--an O iw by Lasare Toper,Director of Research, International Ladies' Garmet Wborkers Union (in AgeBarriers to Employment, Proceedings of the Third Joint Conference n TheProblem of Making a Living Whilo Growing Olds, 954 (p. 4!;) ; ad New York StateLegislatur, No Ti to Grow Old. New York State Legislature Document 12 of1951 (p. 115).
-5-

Before this study of on-the-job performance data for production workersin manufacturing establishments was undertaken, it was recognised that manyethodological problms existed and the tehnique used in other studies of
the perforance of worlers did not apply directly to the special needs of thecurrent investigation.
The methodological problem which wer recognised affected each of thethree important areas in thi research-selction of appropriate performanceindicators, tecniq es of data collection, and statistical methods. It wasdete ned, therefore, the present study would aim at prov gthe toolsnecesary for future work In this field, rather than acomulating extensivedat thoh lss refined t Con ently, the current work waeiged as a pilot investigation of relation s which mdigt exdst between
work prfoane and age, but data obtained were not exected to furishdefinitive resulte for testing general notions about older and erworkers.
lhre specifically, the objectives of the c t sdy were to: (1)Determine which of the available indicators could be utilized to compare thejob peormoace of workers of different ages, (2) establish and refine pro-cedures for collectingdata on these indicators, (3) devise statistical
cnique for developing valid measures of job performance, and (4) ifpossible, present findings of the current study on any observed relationspsbetween age and work performance for the limited nwmber of plante studied.
How to Obtain Performance Data
Information on the comparative performance of idividuals of differentages can be obtained in various ways. Past studies on work performace andage are of three general types--laboratory aperiea sdes, opinonsveys based on supervisors' ratings, and investigation of on-the-jobperformae derived frm company reoords.
The aoratory studies generally deal with qcific physical or pscho-logical characteristics, suh as manual dexterity stregth of grip, andlearnig ability. j These are valuable for providinsisight intothe m of the aging process. ver they are of linited applicabilityto actual job pero e, since they do nt take into account the co linteractions of imrable physical and hol characteristics, nor
W See, e.g., A. J. Welford, Sk1ill and Age, an Experimental Approach,publihaed for the Trustees of the Nuffield Foundation by Oxford UniversityPress, 19S1. W. R. Miles, Psycological Aspects of Aging, Chapter 28 InE. V. ary's Probles of Aging. Baltisore, Williams and Wilkuns, 1939.

of environmental factors. Xbreover, job performance is not a static concept,but represents rather the continuing operation oZ all pcific factors of whichit is composed. Most laboratory studies, on the other hand, can only reflectobservations made over a ahort period of time.
The opinion surveys in which employers and fbren are asked for theirevaluation of workers' performance suffer from the shortcomings of subjec-tivity and a lack of stand sation in the criteria employed.
The job perfozmance studies using plant records have the advantage ofbeing objective and reflecting the results of all factors in the job situation.But adequate analysis requires output records by age for a substantial numberof employees engaged in similar jobs. It also requires the selection forstudy of jobs in which speed is governed by the workers themselves.
The difficulty of obtaini such data limits the mber and scope ofthese surveys considerably. It ist however, this type of study, which ismost useful as an evaluation of the comparative on-the-job performance ofemployees of different ages. /
cOnesuh stu was conducted for the Beau in 1939 covering somtex plants and nonferrous foundries in Nw -glnd. See Influence ofAging on mo t Opportwnitiess Nbnthly Labor Reviews April 1939(pp. 765.780).
Another study of the relationship betwee age and productivity of produc-tion workere in cigar factories was developed in the Bureauo See IndividualProductiviV Differences, BLS Serial No. R. 134DO Febrvary 1940 (pp. 1-22).
For another Bureau study of performance and age, see Abseteeiaa andInjury rience of Older Workers, Monthly Labor Review, July 1948(pp. 16-19).
- 7 -

Indicators of Work Performance: Definitons and Methods of Measurement
Wor-k performance is an inclusive term oovering many aspects of anindividual's work activity. In selecting appropriate indicators of workperformance for co ng workers of different ages, the following criteriawere applied:
1. The indicators must be objectively measurable;2. They muat be clearly definable;3. They must be workable in terms of both collection techniques and
subsequent processing; and4. They must be amenable to the drawing of practical conclusions.
Discussions with plant and union officials and examination of plantrecords narrowed the choice to four indicators of job performance. These wereoutput per man-hour, attendance, industrial injuries, and separations. Otherindicators, such as quality of output, de ability, and versatility, werefound lackig in at least one of the above criteria.
Output Per Man-Hour
Basic to any evaluation of a worker's performance is his productivity.The definition of productivity used in this investigation is his physicalvolume of production per hour worked, i.e. his output per man-hour. Itis isprobably the most familiar of the various aspects of an individual's produc-tivity and is also the aspect in which greatest interest is centered.
A necessary step in measuring an individual's output per man-hour is toreduce to common units the various products he may produce. Where an indi-vidual is engaged in one process in the facture of one products, his pro-ductivity is simply the number of physical units of product he produces during1 hour. Where an individual works on a numbr of products, however, there isa choice available for measuring his physical output. His output can bemeasured as the total value of all units he produced. In this cam his pro-ductivity is the dollar value of his physical production. This value can bemeasured in terms of various prices, but the price of most immediate practicalapplication would be the one relating to the factory cost per unit of product.
The worker's output can also be measured as the total "normal' productiontime represented by his physical production. In this case his productivity isthe total production time equivalents he produced per hour. These timeequivalents could be determined from standards based on time studies. However,it is usually not possible to obtain time rates for all operations on allproducts in a plant since some plants conduct studies of selected operationsonly and most plants are reluctant to furnish the time standards they use forvarious operations. In addition, records of the actual nmber of units ofeach product produced by individual workers are not readily available in mostplants. Consequently, although this measure of output would be desirable, asa practical matter an alternative measure must be selected.
- 8 -
An approximation to measuring output In tem of production t is touse piecework rnings per hour. Here, the assumption is made that the taskperformed on a partiaclar product Is related, by its piece rate, to the timerequired to perform the job. For ple, where a worker performs the sineoperation on a variety of products, any difference in the time normallyrequired to complete the operation on the various products would tend to bereflected in the various piece rates prid for the products.
This assumption was supported by information obtained from companyofficials in the plants visited. It was pointed out that time required toperform a job enters into moat piece-rate formulas. In these cases wherepiece rates might be inaccurate in terms of time required for work on a givenmodl, each worker tended to be alert to these differences end wold insiston receiving an equitable share of the more desirable models. In any case,it can be expected that any inaccuracy In the data originated in this waywil be of a random nature and will not affect one age group more seriouslythan another.
Output per ma-hour was measured, then, by average straight-time hourlypiecework earnings during the period . All earnings on overtimework or holiday work were adjusted to straight-ti levels by removing premiumearnings. Similarly, all timework earnings were removed from the earnings ofindividuals who worked both on piecework and timework during The survey period.
The men-hours included refer only to those hours actually worked in theproduction of the output. Thus, all vacation hours, paid holidays and othertime paid for but not worked, as well as all hours spent on timework, wereexcluded from the hours counted.
In order to use average hourly earnings as a measur t of output perman-hour, it is necessary to insure that there are no special restrictionsaffecti piecework earnings. Therefore, in the exploratory work, certainjobs were excluded for which management imposed a limit on earnings in orderto maintain high quality stanrds.
Limitations of Comparing Emp Pieceworkere. It is recognized thatthe peromance of pleceworkers may not be entirely representative of allproduction workers. Some of the factors influencing the productivity ofpieceworkers in a specific age group may be different from those influencingthe productivity of all production workers in that age group.
Pbr example, the particular jobs classified as piece-rate jobs may placegreater emphasis on speed, dexterit, and other characteristics which areaffected by aging. Performance measures limited to these occupations may
/ In the plants visited these limits were expressed in terms of anumber of units produced daily.
-9 -
result in a comparison unfavorable to older workers. Despite this possibility,however, it is important for those plants where the majority of the productionworkers are paid on piece rates (or some other fom of individual incentivesystem) to have information on the oomparative job performance by age group.
It may also be argued that since only employed persons were included inthe study, the older workers who are still present in the occupations studiedactually represent a selected group, sice many of the younger persons willhave gone into other occupations which were not included in the study. How-ever, there are actually two types of selection operating here, which may beexpected to cancel each other out to soe extent. In the first instances, theexceptionally superior workers may be assumed to have gone Into better payingoccupations. At the same tine, the marginal workers, who could not maintainthe minimum tdards equired for their jobs, would also have left to enterother occupations. Thus, the older workers' average output rates would beinfluenced by the removal of these two extrmes, and, therefore, would belogically comparable with those of the younger groups.
There are no lifetime job histories of workers in the industries studiedwhich show the extent to which workers enter either as time or piece-rateworkers and move from one type of work with its associated pay procedure toanother over their life span, or the extent of movement from production tosupervisory or entrepreneurial work on the one hand, and to custodial jobs onthe other. Therefore, it was not possible, within the scope of the presentstudy, to determine the extent these situations prevail in the plants Mureyed.Since their effects are offsetting, the net result is not believd to be verygreat.
Observation Period. The observation period selected for output per ma-hour measurementranged from 4 to 8 weeks.* his is a compromise between aperiod of maimam length, which would tend to even out atypical infbiences ofa temporary nature, and a very short period, which would permit the inclusionof a large nuber of individuals (since the sample included only thoseemployees who were working during all or nearly all of the observation period).
A period of full production was chosen for observation in order tominimise any influence from individuals sharing works, which often occurs dur-ing slack periods. There is, of course, the possibility that during periodsof full production the incentive for individuals to maximize production isreduced after a certain earnings level is attained. Should this influenceaffect age groups differently, the measure would reflect not only any rela-tionship which existed between productivity and age, but other factors as well.
Groups for Direct Comparison. In order to compare job performance by age,the influence of factors other than age must, of course, be eliminated. Thismeans that coaparisons must be limited to individuals who are similar in manyrespects and who are exposed to the same working conditions. In the case ofproductivity, as measured by average piecework hourly earnings, direct cm-parisons can be made only among workers with a similar degree of experience
10 -
on the ene specific job within a plant. If the basic cells are widened andworkers on different jobs or on the same job in different plants are compareddirectly, extraneous factors such as differences in pay scales, machineryused, and job requirements will be introduced. In that case differences inproductivity between age groups could be the result of the influence of thesefactors rather than age.
During the pilot work, direct comparisons were made only among individualsof the sam sex who were perfloming the same job or series of operations withina plant. Job titles from personnel records alone were not used to determine aworker's occupation because these records generally do not describe the opera-tions an individual performs. The titles listed in the personnel records forindividuals were compared with those entered on the payroll records for con-sistency. Appropriate plant officials were also consulted as to whetherindividuals were in fact perfcrming the same operations
To avoid comparisons between fualy experienced workers and beginners,employees with less than 6 months' service in a job were excluded from theoutput per man-hour sample. It was not always possible because of the limita-tion of plant records, to detect the employees who, while meeting the minimimservice requirements, had been transferred from some other job. In addition,the learning curve for sme occupations will continue to rise for a longerperiod than 6 months. On the other hand, a considerable portion of newemployees may have had previous experience elsewhere.
Attendance
Attendance, for purposes of this study, has been defined as the ratio ofthe number of days an individual is present to the number of days he isscheduled to work. An individual was considered absent when he was away fromthe job for a full day or more at his own initiative. Layoffs, holidays,shutdkwns, and regular vacations were not counted either as days absent ordays scheduled.
Most difficulties in obtaining adequate attendance data related to limita-tion of plant records. Of the plants surveyed, only one maintained individualabsenteeism records. For the remaining plantts, it was necessary to reconstructindividual records of attendance from daily timecards.
Timecard data, however, do not usually distinguish between absence whichis due to production layoff and absence at the employee's initiative. lb makethis distinction, the daily attendance records for individuals were compared,and where a significant proportion of workers in an occupation were absent foran identical period, they were assumed absent as a result of a production lay-off. By using a period of full production as the observation period forattendance the influence of production layoffs was believed to be minimdsed.
It is also difficult in some cases to distinguish extended absences fromseparations. Cony practices vary as to the length of time an absent workeris carried on the rolls. Some companies consider an individual separated after
-l3l1-
1 week of absence and drop him from their records; other companies maintainan employee on the current rolls until he has been gone for a considerablelength of time or until he informs them definitely that he is not coming back.In order to obtain a consistent measue for all plants in the pilot works,company payroll records were compared over a period of tim to determine whenan individual on extended absence could be considered separated.
Observation Period. Pbr attendance, as in the case of output per man-hour, the observation period m:st be long enough to avoid atypical situations.Seasonal factors, such as particular sport seasons, may affect the attendanceof individuals in various age groups differently. Any measure limited to suchperiods does not necessarily yield representative results. A period rangingfrom 8 to 12 weeks during which it was believed seasonal factors would beminimal was selected for study. Parts of that period coincided with theobservation period for output per man-hour.
Gous for Direct CoMarison. In contrast to output per man-hour, theattendace rates of individuals in specific occupations were believed to bedirectly comparable, yet there are same occupational characteristics which nodoubt influence attendaice. It is probable that persons in lower paid occupa-tions may have different attendance motivations from those in higher paidoccupations and attendance comparisons by age, ignoring these differences,might then reflect the influence of the occupational concentration rather thanage.
Tb obtain attendance comparisons which reflect the influence of age alone,only individuals of the same sex in the plant on the same system of paymentand in the same occupational earnings level were directly compared
Industrial Injuries
Nondisabling and disabling injuries were selected for study in thisexploratory work. Although sufficient data could not be obtained in theactual collection because of the limited coverage, many of the problems inderiving these indicators from existing plant data were examined.
Nondisablin In-im~es. A nondisabling injury was defined as an injuryexperlIeid1in the course of an individual's work which did not involve thelo-s of a ful1 day or more. Although the definition appears relativelystraightforward, three major problems present themselves when attempting toderive a measure of the frequency rate of nondisabling injuries. First,plant definitions of work-connected and nonwork-connected injuries vary.Plants with broad overall medical programs for their workers do not make thesame distinctions as plants with limited medical programs. Seoond, plant
T/The basis for classifying higher and lower paid occupations in thisstudy is explained in a later section. (See pp. 47-48.)
- 12 -
requirements with respect to the immediate treatment for nondisabng injuriesare by no means uniform. These requirements are also usually related to thetype of general medical care program provided as well as sety practices andpolicies emloyed in the plant. Third, plant practices for recording non-disabling injuries vary considerably. Some plants record all minor injurieswhereas others record only the major ones. Should these differences betweenplant practices affect age groups differently, the validity of any nondisablinginjury comparisons between age groups is reduced. It is doubtful, because ofthese limitations, that nondisabling injuries can be used as an indicator ofcomparative work performance.
Di i A disabling injury was defined as an injury experi-ence anthe cours oran individual's work for which a day or more of work-time was lost. In this case, company practices concerning the definition andrecording of disabling injuries are such more uniform. Workmen's coWpensationreports generally furnish standard infomation, and these reports are similarfor the various States. The definition of a disabling injury is usually thesame for most plants.
On the other hand, the incidence of disabling injuries for a given ex-posure period is much lower than that of nondisabling injuries so that a verylarge ample of observations is necessary to avoid unreliable comparisons.This need for a large sample of observations limits the use of this indicatorto very large plants or to very long observation periods.
Where industrial injury data are availables three measures can be usedfor making age group comparisons-the frequency rate, the severity rate(number of hours lost daring an exposure period), and the average severity(number of hours lost per injury).
Observation Period. The observation period for the injury measure must,of nocefiFtbeonger than for either the output per man-hour or attendancemeasure. Because of the relatively small incidence for all age groups, it isnecessary to insure that any lack of incidence is not merely the result ofselecting a short survey period.
As mentioned above, the injury measures require data on the number ofhours worked (the exposure hours) during the observation period. Data onhours worked by individuals over long periods are often difficult to obtain.Most plants surveyed in the exploratory work did not maintain smaies ofhours worked by individuals over periods longer than 2 weeks. In these cases,it was necessary to derive the total number of hours worked from weekly time-cards. This is quite time consuming and costly, especially for an extendedinjury period, and it was found to be prohibitive in this investigation forperiods longer than 1 year. Yet, excpt for very large plants, a 1-yearperiod does not flurnish sufficient data to permit meaningful comparisons byage group.
- 13 -

Individual exposure hours data can be estimated from other plant records,but these procedures nay involve assumptions which are not necessarily valid.One procedure attempted in the pilot work involved dividin the annual earn-ings of individuals by the average straight-time earnings for a representativeperiod. However, use of this method is limited to periods during 'whichindividuals in different age groups share equally in overtime work.
Groups for Direct mparison. The tal consideration in makingan analysis of injury by age group is to insure that direct comparisons aremade among workers subjected to equal injury hazards. It is, however,virtually impossible to classify each worker according to i=J hazard. Inthis investigation an attempt was made to derive direct comparisons betweenage groups for workers classified according to the following characteristics,sex, hand or machine operations, dep nt and plant, as an approximation toequalizing hazard.
Separations
Separations as defined in thi ey include quits, discharges forcause, retirement, death, and military service among production workers.Excluded are separations for the convenience of the employer such as layoffs.
The measure obtained is the ratio of the number of separations to thetotal number of production workers in different age groups. This measureattempts to ascertain how many of a group of workers employed in the plant ona given date were separated in the foling year. It was selected as a per-formance indicator because it is, to a certain extent, a measurable reflectionof the stability of groups of workers.
As mentioned above, plant records sometimes do not distinguish extendedabsences from separations, but by coparig current and past payrolls, it ispossible to obtain an indication of whether a separation did in fact takeplace Information on reasons for leaving, however, is not as readily availa-ble. Several approaches were attempted including interviews with foremen,but because of the possibility of lapse of memory on the part of foremen, onlythose plants which recorded specific reasons for separations were included.Four of the plants surveyed during the pilot wrk maintained such records.
Group for Direct Comparison. Separations are usually greater among agroup of relatively new employees than a group of workers with long years ofservice. Company pension programs, community ties, and other factors mayinfluence the decision of an employee with long years of service to remainwith a company, whereas a new employee may not be as strongly affected bysuch factors. Similarly, differences in plant policies will also affect pro-duction workers of age groups differently.
- 1 -

The influence of these factors was taken into account in designing thebasic divisions within which comparisons between age groups could be made.Within eacL plant, production workers of the soo sex were divided into groupswith more than 2 years' and less than 2 years' service. It was believed thatthese classifications would reduce the influence of factors other than age andat the sane time afford sufficient observations to warrant meaningfulcomparisons.
- 15 -
Industry and Plant Selection
Becase statistics on the performance indicators are more readily availa-ble from firms engaged in nnutacturing than from nonnufact=!ing establish-ments this initial exaination was lImited to manufacturing industries. With-in manufacturing, homver, it was possible to examne plants within only twoindustries becaue of the limited resources of the pilot study.
Several criteria were used to select the industries within which plantswere surveyed. A large proportion of employees over 45 years of age to totalemployees, the existen csofm form of individual incentive payments in mostplants in the industry, and the iportance of the industiy in terms of numberof workers employed were among the factors takn Into consideration.
It was believed that industries with a large proportion of employees over45 would include plants employing a sufficient number of employees in theolder age groups as well as younger age groups to afford useful comparisons.As mentioned above, the use of individual incentive system of payments isnecessary in determining individual output data.
The footwear and men's clothing industries were selected for study fromthe industries meeting these requirements. According to the 1950 Census BureauReport on Industrial Characteristics, 32.5 percent of all employees in thefootwear ind=ust7 and 33.1 percent in the apparel and fabricated textile prod-ucts Industry were 45 years of age and over. In all manufacturing industriesthe percentage was 311 Since the men's clothing Industry is one of the mostimortant segients of the apparel group and has a more balanced distributionbetween sale and female employees than other apparel industries, it was se-lected as the specific industry to be e ed.
Each of these industries is characterized also by incentive ystem ofpaymnt for production workers. According to the Bureau of Labor Statistics'survey in 196 on the extent of incentive pay in selected manufacturing in-dustries, 89 percet of 347 footwear plants studied and 85 percent of plantsmanufacturing apparel had incentive systems of paymnt. /8SimIlarly, 65percent of all production workers studied in the apparel Id try and 69 per-cent of all workers studied in the footwear industry were on incentive pay. 9/Most of the incentive plans were individmal plans (usually straight pieeework7affording measures of individual output.
§/ Incentive Pay in American Industry,1945-46, Monthly Labor Review,November 1947 (pp. 535-538).
2/ Idem.

Tbe geogaphical concentration of these industries made it possible tolmit plant visits during th. pilot work to the Newr ngland and Middle Atlanticregions. In 1951, 69 percent of all establishments ii the United States mnu-facturing men' a suits and coats emplcyimg 60 percent of the total productionworkers were lt in these regins. ln fact, over two-fifths (41 percent)of the establishmets and on-fourth of the rduction workers in the industrywere in am State, New York. Of the 1,200 footwear esablishmets in theUnited States 195i , a roxitly 60 percent were located in these regions,with 5j pereen of the total production workers in the industry. In thislindstry more than 36 percent of the establishments and 29 percent of totalproduction workers vere located in lhssachsetts and New York. 3/ Althoughthere my have b en m chaps ia the eo apic omposition of theseIndustries since l9541, it is doubtful that any marked si hm occurred.
Plants were selected for study from a list of establishments in theseindustries, in the regions metiamd. Omly large-sise plants with persons inall ag groups doing the sam work could furnish adequate comparisons. Comae-qmeaty, plants which had me than 40 preductiom workers were included. Allthese retuiramts resulted in a limited nuaber of plants from which the samplecould be dra. Selection of the plants surveyed ws ot made by a randomprocess. Visits were made to plats about whiek the Bureau had s kncomeerming the mtur Of the rcords amd the total nber and distribution ofemplOONe, by sex. The ain as of the work was testimg tentativequestio a and developin measure t techniques. Dring the pilot work1. plants were visited, 2 of which wore elimin from the saple--l becauseit empoyed only a smell xuder of pieeweorkers, and the other because itMaintaimed Inadequate plat records for this study.
/ U. S. Bureau of the Census, Advance Report, 19514 Census ofNenufactures.
- 17 -
Data Collection Procedures
The amount and complexity of the information to be obtained from theplants for this study precluded conducting a mail survey. The loss of con-trol over the type of data collected In a mail surqey would seriously limitthe accuracy of amry derived results. In addition, the length of time requiredfor the participating establishment to assemble and furnish the data wouldreduwe the chances for cooperation. In mwq cases, the nature of plant rec-ords would not permit assembling the data directly but would require derivingthe information from a variety of sources usually maintained for other purpoe.Consequently, personal visits by trained agents were required. All data ob-tained in this investigation were collected by project staff visiting theplants. On the average, the time needed to obtain the data for a plant em-ploying 500 piece-rate workers was about one man-month.
A schedule for collecting the data was developed and tested in the plantsvisited. Il/ It consisted of two parts-a questionnaire and a set of standard-ized worksheets. The questionnaire requested information of a general natureconcerning the records and placment procedures of the plant. Answers to theitem on the questionnaire permitted the agent to select (within certainlimits) the appropriate period for stuxy and furnished a guide to the partic-ular record sources in the plant which should be examined In order to derivethe required datao
The questions on placement procedures were developed to ascertain, ifpossible, some of the factors which might be associated with different resutsfrom different plants. A plant which had pbrsical, aptitude, and Job emi-nations as well as specific programs for retraining and reassiglmnt mightwell have a distinctly different pattern of job performance and age relation-ships from another lacking such procedures. None of the plants Included inthe pilot investigation had specific programs along these lines.
The worksheets were designed for recording personnel information anddata on each of the performance measures separately for each individual.They were constructed for use in either machine or hand processing of thedata, and were adaptable to different tpes of plant records. In the r-atory work various form were attempted and it was found that the use of aseparate card for each worker was the most efficient procedure for transcribingthe data from company records.
Worksheet 1 (see p. 66) was the basic worksheet on which data for allmeasures were recorded. It consists of four major sections covering personnelinformation, earnings datas, attendance, and industrial inJury data generallyderived from different sets of records. Personnel and separations data wereusually available from personnel records although occupational titles werenot necessarily accurate. Earnings and hours data were uouy available
11/ A copy of thisaschedule with accop eg instructions for agentsis reproduced in the appendix of this report.
- 18 _

directly from payroll and production records, but in order to obtain infor-mation on only piecework hours and earnings, it was sometimes necessary tocompute the straight-time piecework earnings of each Individual from thedaily piece ticlcts tumed in during the survey period. Attendance data(days worked and days scheduled) usially had to be computed from individual.timecards. Nondisabling injury data were available from dispensary or nurse'srecords where they existed. Disabling injuy data could be derived fromworkmen's compensation reoords*
Worksheet 2 (see p. 67) was developed to supplement the productivityinformation obtained on worksheet 1. It was designed to test, if possible,the relationship between piece rates on various products with standard times.During the pilot work, it was hoped that the additional detail would be usefulespecially when individuals performed a variety of operations on inny products.It was not possible, wever, during the pilot work to obtain information onworksheet 2 and the statistical results reported here were derived entirelyfrom data recorded on worksheet 1.
- 19 -
Statistical Methods
The statistical procedures applied to the raw data were, in essence,those necessary for combining a large number of individual observations intobroader findings. The results of the study were intended to show:
1. The performance of several age groups as compared with each other;2. Any differences in the influence of age on the performance of men
and won in various types of jobs and industries; and3. Individual variation in the performance of workers.
The information recorded during the plant visits would not yield theseresults unless the raw data were processed further. The procedures used forthe four types of performance indicators, although similar, were not identicaland are presented separately for each indicator. Prior to discussing theparticular methods applied, it might be well to indicate the age groups ihichwere selected for comparison.
Age Groups
In order to secure results of maxim precision, it would have beendesirable to classify workers in narrowly defined age groups. Classificationof workers in 5-year age groups was attempted for this study but the samplewas too sma1 to yield meaningful results. Consequently, for all of theperformance measures, workers were classified into 10-year age groups. Thesewere under 25, 25-34, 35-44, 45-54, 55-64, and 65 and over. In a larger scalesurvey, the use of 5-year groups might prove feasible.
Output Per Man-Hour
As mentioned earlier, in order to obtain meaningful measures of outputper man-hour, the basic groups for direct comparison consisted of experiencedemployees of the same sex working at the same specific occupation in a plant.Each of the plants surveyed, however, was characterized by a large number ofdifferent occupations with relatively few individuals in each occupation. Inmany occupations, only 2 or 3 of the age groups were represented. Therefore,if all comparisons had been made only between individuals in the same occu-pations, the results would have been extremely limited.
It was necessary to apply some procedure which would convert the outputper man-hour scores (average hourly piecework earnings) of workers in specificoccupations into some measure which would, thereafter, be entirely independentof the particular occupation in which the workers were found.
The procedure adopted consisted of converting each output score forworkers in the same occupation into an index. The 35-L44l age groupfortheoccupation was assigned an index of 100, and the index of each of the otherage groups was simply the ratio of the average score of that age group to the
- 20 -
average score of the 35-44 year group. 12/ Thus, a comparable measure wasderived for each age group, each measure-reflecting the relative performanceof a given age group as compared with the corresponding 35444 year group. Bytransforming the scores of age groups into indexes, the possible distortinginfluence of variations in absolute pay levels-in different operations or indifferent plants was eliminated. The measures could now be treated as a homo-geneous group of indicators, and it was no longer necessary to be concernedwith actual scores of individuals, nor the plant in which they worked.
Occupation Groups. The indexes, up to this point, represented onlyoutput neures o fr in specific occupations within plants. In orderto derive results which would reflect larger numbers of individuals than wereavailable in these fine occupations, some means had to be found for combiningthe indexes. This was done by establishing occupational ups in which theeffect of factors other than age could be expected to be fairly uniform forall age groups.
In summarizing the data, indexes for workers in specific occupationswere grouped according to the following characteristics:
1. Sex;2. Hand or machine occupations 13/;3. Higher or lower paid occupatIons 13/; and4. industry.
If these distinctions had not been made, then differences between theindex of one age group and another might be due, in part, to the differentdistribution of these characteristics in the two age groups. Consequently,through the use of these classifications, valid comparisons among age groupscould be obtained.
Procedure for Combning Indexes of specific Occupations. As mentionedabove, each of the age group indexes ror the specific occupations was derivedfrom the scores of individual in a particular age group and the correspond-ing base group within a single plant. Some were based on a very small numberof individuals in both the age and base groups whereas otheixrepresented largergroups. In combining the age group indexes for a specific occupation to obtaina measure for an occupational group, it was necessary to assign a weight toeach index reflecting its relative importance in the measure for the occupa-tional group. This weighting procedure took into account the number of work-era in the age group as well as the number of workers in the base group foreach occupation. 14/
12/ A procedure was also applied which permitted the use of the 25-34year Voup transformed to the 3 !ft year group as the base. This method en-abled the use of more observations* It is described more fully in theappendix. (See p. 49.)
13/ The basis for classifying occupations into higher or lower paid andhand X machine operations is discussed in the appendix. (See pp. 4748.)
Id/ The formula for these weights is included in the appendix. (See p.14g
- 21 -
Combinig Indes of Occ ational Groas. In addition to indexes forspec fa cobind occutio ¢oips, it was considered desirable to obtainmore generalised indications of the relative perfomc of the various agegroups. For ale, age-group indexes were obtained for all male employeesin the clothing plants, whether they were working at hand or machine operations,or in higher or lower paid jobs.
In order to derive these indexes a procedure was required to insure thatthe influence of factors other than age would be constant for all age groups.The simplest method for accomplishng this was to assigns to each occupationalgroup index, a constant weight for all age groups. When combined throug theue of these weightss the four occupational groups indexes yielded an indexwhich was not influenced by the shifting proportion of, sa3$higher and lowerpaid occupations, from one age group to another. The weighting scheme actuallywed was based on the total number of workers of all ages within an occupationalgroup.
Individual Variation. As mentioned earliers one of the purposes of thisatU Tai=surIng the relationships between age and work per-formance was to determine the extent of individual vriation within each agegroup. It is important to know whether the index derived for a particular agegroup reflected the performance of individuals whose output scores showedconsiderable uniformitys or whether, on the other hand, their scores variedwidely about the average for that group. An employer, fbr example, wouMllogically give greater consideration to the characteristics of an individualapplicant rather than to his age, if he knew that performance differencesbetween age groups is less than the individual variation in any one age group.
The measure of dispersion which was employed reflects the differencebetween the age group average and the individual scores for each occupation.The actual measure was the coefficient of variation, which is expressed as apercentage of the group score.
As in the case of the age group indexes, the dispersion measures for thespecific occupations were combined to obtain a measure for the occupationalgroup. Again, it was desirable to combine these dispersion measures withweights which would reflect their relative importance in the combined measure.In this case, the weight aplied took into accomt only the nusmr of workersin the age group for the occupation.
Similarly, it was considered useful to obtain a dispersion measure forcombinations of the occupational groups. The same weighting procedure as usedin combining the indexes of output per mn-hour for the specific occupationswas employed.
- 22 -
Attendance
As noted above, the basic group in the attendance comparisons was not thespecific occupations as in the case of output per man-hour, but rather thetype of occupation (higher or lover paid). It was believed that in the tweindustries covered the specific occupation had little bearing on the attendancerate of an eployee. Thus, to obtain comparable attendance rates for thevarious age groups, individnals were grouped according to sex, plant, andoccupational earnings levekL
For each of these classifications, age group indexes were derived bydividing the average attendance rate for an age group by the average rate ofthe 35-44 year group. A/ In this case, as in output per man-hour, a commonmeasure was derived from all rates reflecting the relative performance of agiven age group as compared with the corresponding 35-44 year growu.
This approach yielded indexes which included a considerably larger numberof workers than those obtained from single occupations in the output per man-hour indexes. However, each of these series referred to individual plants.What was desired were results which weuld cover broader groups. Therefore,plant attendance indexes for each age group were combined in a manner similarto that used for combining output per man-hour indexes for specific occupations.The weight assigned to each plant in this case took into accoumt the numberof workers in the age group, the nuober of vorkers in the base group, and thenumber of scheduled workdays of the survey period. 6/
It was also considered useful to derive attendance measures for a cao-bination of these groups. These, like the combinations of output per man-houroccupational groups, required a weighting procedure which would not permit theinfluence of factors other than age to enter into the measure. A similar fixedweighting system was employed which assigned the same weight to each age groupindex pertaining to the same earnings level.
Dispersion measures were not calculated for attendance, since it becameevident at an early stage that such measures would have limited usefulness.The average attendance rate was vezr close to the maximm attainable rate(100 percent) indicating there could be only mall differences in magnitudeabove the average.
A/A procedure similar to that employed for the output per man-hourindexes making use of the 25a34 group In addition to the 35-44 year group wascarried out here.. For details of the proceduresee appendix P. 49.
A/ The fbrmula for this weight is shown in the appendix. (See p. 49.)
- 23 -

I tria s
In order to minimise the influence of factors other than age, as notedearlier, basic comparisons of injury experience should be made among indivi-duals of the same sex within the same plant performing the same type ofoperations (hand or machine). An attempt was made to draw such comparisons.However, industrial injuries occur infrequently and to draw such comparisonseither a large number of workers or a long observation period for a smallernumber of workers would be required. In the plants suryeyed there had beenno injuries in many age groups. These groups, therefore, had injury rates ofzero. The use of age group indexes, consequently, was found to be impractica-ble because base groups for several series had zero injury rates. Even ifthere had been injury incidence in all base groups, comparisons with zerorates for other age groups would be misleading since, given a longer period ofobservation or a large number of workers, it is probable that a zero ratewould not occur.
In view of the extremely limited nature of the data obtained, only theincidence of injuries for several of the plants visited rather than the indexes,are shown in this report. These are included for illustrative purposes.
Separations
The basic groups for comparison were established in terms of plant, sex,and length of service, and age group indexes were derived. As in the case ofoutput per man-hour and attendance, the age group separation rates were relatedto the separation rate for the corresponding 3544 year age group.
Combinations were made of indexes of each of the basic comparison groupsin a manner similar to that used for the other measures. The weight appliedto each index took into account the number of workers in tfie age group, thenumber of workers in the baw group, and the length of the separation obser-vation period in the plant.
Separations, like injuries, occur infrequently, and consequently,, requirea greater number of observations for adequate measures than productivity orattendance. Since the separations data obtained in this survey were verylimited, the indexes shown are primarily illustrative.
- 24 -

Flin s in the Plants B ed
The measures of work performance included bere were derived from dataobtained in plants visited during the exploratory work. The results show per-forince by ap grsop omly for the plants surveyed, and generalizations shouldnot be drawn with respect to the two industries included in the samples. Inaddition to the s lnss of the sample, the method of plant selection did notattempt to achieve industry representativeness. It was not the purpose ofthis investigation to cpile statistics which would provide definitive resultsfor the two industries, alt cortain limited findings were anticipated.As indicated elsewhere in this report, the main emphasis was on developingPerfo e iadcators and testing measmt techniques.
The findings preseatd here reflect the experience of piece-rate pro-duction workers employed ia 4 plants in the men's loti industry and 4plants in the footwear indstry. All plants were located in the New Englandand Middl Atlantic regions and ranged in size from 500 production workers tome tha 2,500. Data for selected periods in 1955 were collected. Theperiods chosen were those of substantially full production in the plantsstudied.
Output per e- r data were obtained for 2,217 production workers-z933in the footwear pants and lS in te cloti plants. Separate results aresown for men ad WOOD employed in the two groups of plants (tables 1 and 2).They are further broken dowa into earnins level grouPs (tables 3, h., 5, and 6)and according to hand and machkin oceupatioms (tables 7, 8, 9, and 10).
The age spn surveyed ranges from under 25 Years of age to 65 years andover for the detailed Job classifications. For the cmbine'd roups, thisrange was arroed to the W groups 25 to 65 only, because of the Inadequate_ner of observatioms which could be obtained in the yougst and oldest agegropsin som of the detailed Job categories.
Hex and Wonen. The productivity of both male and female pieceworkers inthe footwiear and clothing Plants studied did not vary With ag until after age5b (tables 1 and 2). Te small differences between the indexes for age groupsunder 55 were not statistically sigificant. After that a the figures formost groups show a deaclin whick, although statistically Sigficat, wasotof serious ProPOrtion. In no cas did the performance of any 55-6k yeargroup fall below 90 percent of the base up i . And group of olderworkers (women aged 55-6 in the foowear plants) in fact performed as wme asaw youngr grup of .
The tput indexes for men in both the footwear and cloth plants showslight inreases between the yougst groups (25,3i) and t base groups.These apaet increases, owever, are not statistically significant. Similarly,the sma1l differences observed between the base rps an the correspondingk5-5k Year grus are not signficant. After age 5, the decline noted aboveoccurs.
- 25 _

Table l.--Indees of output per man-hour for pieceworkers in four footwearestablisments, by sex and age group
(Age group 35-4i1huOO)men women
Age Number Coefficient Nuber Coefficientgroup
oof Index of variation of Index of variation__________ workers (percent) workers (percen25-34i...*- 94i 97.3 18.8 97 100.8 18.235-44..... 163 100.0 14.0 164 100.0 114.645-54 ..... 123 97.8 114.0 129 99.0 13.1455-64...1. 98 9/92.1 13.3 60 99.6 11.4
r/ Two age groups, uwder 25 and 65 and over, are excluded because thenumber of observations was considered insufficient. Cf. table 11.
31 This index is significantly different from 100 in the sense that, ifthere were really no difference between the age group and the base group, adifference as great as this would be obtained less than cme time in twenty onrepeated sampling.
Table 2.-Indexes of output per man-hour for pieceworkers in four clothingestablishments, by sex and age group
Men WomenAge Number Coefficient Number Coefficientgroup / of Index of variation of Index of variation
__________ rkers (percent) workers (percent)
25-34*1090 52 98.6 7.1 100 99.3 22.235-44..... 82 100.0 15.0 220 100.0 19.845-5L4... 51 100.5 14.1 387 98.i4 18.255-64..... 1 10 1/ 91.8 20.8 279 31 90.2 19.2
;/ Two age groups, under 25 and 65 and over, are excluded because thenumber of observations was considered insufficient. Cf. table 12.
Vf This index is significantly different from 100 in the sense that,if there were really no difference between the age group and the base group,a difference as great as this would be obtained less than one time in twentron repeated smpling.
- 26 -
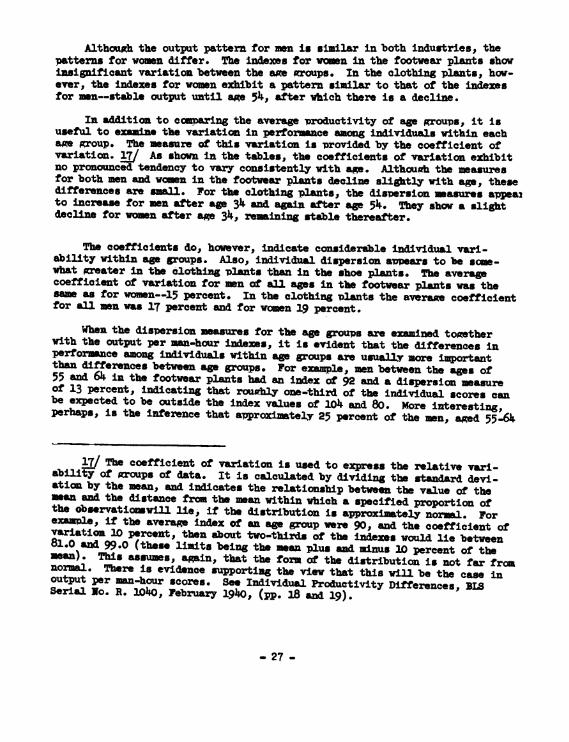
Although the output pattern for men is similar in both industries, thepatterns for women differ. The indexes for womn in the footwear plants showinsignificant variation between the axe groups. In the clothing plants, how-ever, the indexes for women exhibit a pattern similar to that of the indexesfor men--stable output until age 5k, after which there is a decline.
In addition to comparing the average productivity of age groups, it isuseful to ex the variation in performance among individuals within eachae group. The measure of this variation is provided by the coefficient ofvariation. L/ As shown in the tables, the coefficients of variation exhibitno pronounced tendency to vary consistently with age. Althoush the measuresfor both men and women in the footwear plants decline slightly with age, thesedifferences sar small. For the clothing plants, the dispersion measures appea2to increase for men after age 34 and again after ag 5. They show a slightdecline for women after a 3k, remaining stable thereafter.
The coefficients do, however, indicate considerable individual vari-ability within age groups. Also, individual dispersion awmars to be some-what greater in the clothing plants than in the shoe plants. The averagecoefficient of variation for men of all ages in the footwear plants was thesame as for women--15 percent. In the clothing Dlants the averaae coefficientfor all men was 17 percent and for women 19 percent.
When the dispersion measures for the age groups are examined tonetherwith the output per man-hour indexes, it is evident that the differences inperformmce among individuals within age groups are usually more importantthan differences between age groups. For e le, men between the ages of55 and 64 in the footwear plants bad an index of 92 and a dispersion measureof 13 percent, indicating that rouahly one-third of tbe individual scores canbe expected to be outside the index values of 104 and 80. More interesting,Perhaps, is the inference that approximately 25 percent of the men, aged 55-6k
L7/ The coefficient of variation is used to express the relative vari-ability of Aroups of data. It is calculated by dividing the standard devi-ation by the mean, and indicates the relationship between tbe value of theman and the distance from the mean within which a specified proportion ofthe observatiogwijl lie, if the distribution is approximtely nor. Forexale, i the average index of an age group were 90, and the coefficient ofvariation 10 percent, then about two-thirds of the indexes would lie between81.0 and 99.0 (these limits being the meanplus and minus 10 percent of themea). This assumes, again, that the form of the distribution is not far froanormal. There is evidence supportiNg the view that this will be the case inoutput per ma-hour scores. see Individual Productivity Differences, BLISerial No. R. 10400, February 1940, (pp. 18 and 19).
- 27 -
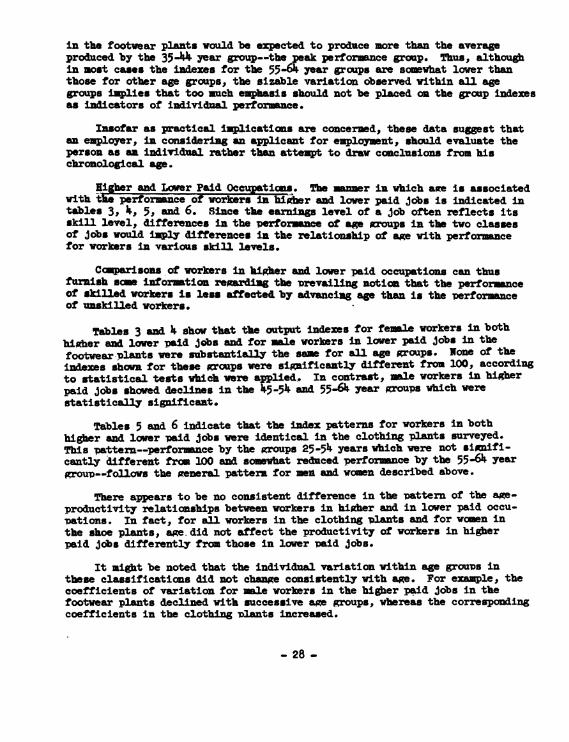
in the footwear plants would be expected to produce more than the averageproduced by the 35.4 year group--the peak performance group. Thus, althoughin most cases the indexes for the 55-64 year groups are somewhat lower thanthose for other age groups, the sizable variation observed within all agegroups implies that too much emphasis should not be placed on the group indexesas indicators of individual performance.
Insofar as practical implications are concerned, these data suggest thatan employer, in considering an applicant for employment, should evaluate theperson as an individual rather than attempt to draw conclusions from hischronological age.
Higher and Lower Paid Occupations. The nanner in which aie is associatedwith te perforce of workers in higher and lower paid Jobs is indicated intbles 3, hi, 5, and 6. Since the earnings level of a job often reflects itsskill level, differences in the performance of age groups in the two classesof Jobs would imply differences in the relationship of age with performancefor workers in various skill levels.
Comparisons of workers in higher and lower paid occupations can thusfurnish sco information regarding the prevailing notion that the performanceof skilled workers is less affected by advancing age than is the performanceof unskilled workers.
Tables 3 and 4 show that the output indexes for female workers in bothhigher and lower paid jobs and for male workers in lower paid jobs in thefootwear Plants were substantially the same for all age groups. None of theindexes shown for these groups were significantly different from 100, accordingto statistical tests which were applied. In contrast, male workers in higherpaid jobs showed declines in the 45-54 and 55-6 year groups which werestatistically significant.
Tables 5 and 6 indicate that the index patterns for workers in bothhigher and lower paid jobs were identical in the clothing plants surveyed.This pattern--perforae by the groups 25-54 years which were not simifi-cantly different from 100 and somewhat reduced perfornnce by the 55-64 yeargroup--follows the general pattern for men and wchmn described above.
There appears to be no consistent difference in the pattern of the age-productivity relationships between workers in higher and in lower paid occu-pations. In fact, for all workers in the clothing Plants and for women inthe shoe plants, age. did not affect the productivity of workers in higherpaid Jobs differently from those in lower paid jobs.
It might be noted that the individual variation within age groups inthese classifications did not change consistently with age. For exale, thecoefficients of variation for male workers in the higher paid jobs in thefootwear plants declined with successive age groups, whereas the correspondingcoefficients in the clothing plants increased.
- 28 -
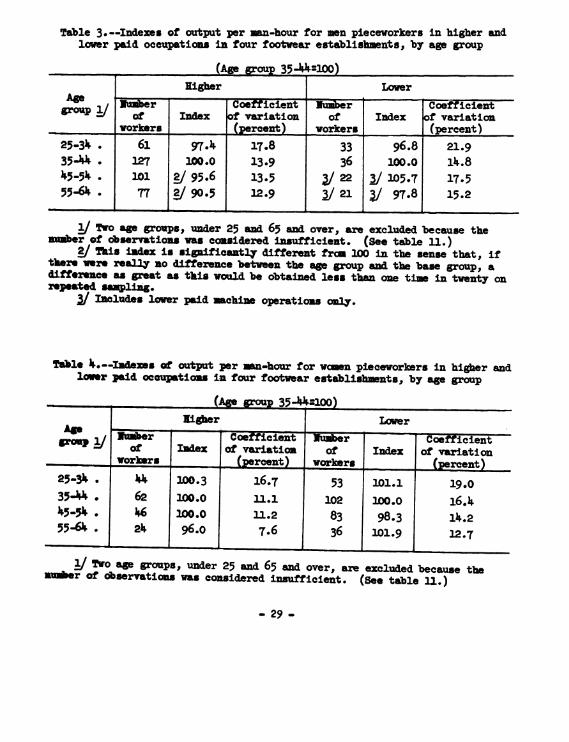
Table 3.--Indexes of output per un-hour for men pieceworkers in higher andlower paid occupations in four footwear establishments, by age group
(Age group 35Jh-4210)Higher Lower
Iiiier Coefficient Nbcf igp SI 0tof Index of variation Of Index of variation
workers (percent) workers (percent)25-34 . 61 97.4 17.8 33 96.8 21.93544 3127 100.0 13-9 36 100.0 14.845-5). 101 ?/ 95.6 13-5 22 3/105.7 17.55564 77 3'90 5 12.9 3/21 1/ 97.8 15.2
1/ TWo ae groups, under 25 and 65 and over, are excluded because thenmber of observations was considered insufficient. (See table 11.)2/ This iadex is significantly different from 100 in the sense that, ifthere were really no difference between the age group and the base group, adifferenc. as great as this would be obtained less than one time in twenty onrepeatedl sa3lig.
~/ Includes lower paid machine operations only.
Table ho.-Indems of output per mn-hour for w n piecevorkers in higher andlwer paid occupations in four footwear establishments, by age group
(Age gop 35,42100)Kigher Lower
Alp4c g, Numbr Coefficient Iiber Coefficientof Index of variation of Index of variation_workers (percent) aworkers _ _ (percent)
25-3k k 100-3 16.7 53 101.1 19.0354k . 62 100.0 11.1 102 100.0 16.445-5I . 6 10.0 11.2 83 98.3 lk.2S55- . 2k 96.o 7.6 36 101.9 12.7
Two ag groups, under 25 and 65 and over, are excluded because the_~er of observations was considered insufficient. (see table 11.)
- 29 _
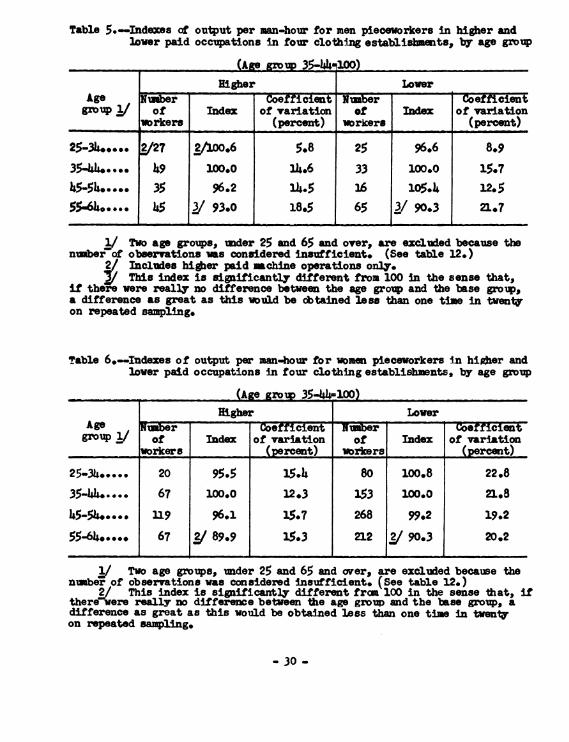
Table 5.-Indexes ot output per man-hour for men pieoevorkers in higher andlower paid occupations in four clothing establishments, by age group
(Age group 35-448 100)
Higher LowerAge Nuber Coefficint umber Coefficientgroup / of Index of variatio of Index of variation
_ __orkers _ (percent) workers _ (percent)
25-34k*,.. 2327 /1W0*6 5.8 25 96.6 8.9
35414.*..*- 49 100.0 14.6 33 100.0 15.745-514....* 35 96.2 14.5 16 105.14 12.555-640*0. 145 2 93.0 18.5 65 2/ 90.3 21.7
1/ Two age groups, imder 25 and 65 and over, are excluded because thenumber of observations was considered insufficient. (See table 12.)
2/ Includes higier paid machine operations only./ This index is sigiificantly different from 100 in the sense that,
if there were really no difference between the age group and the base group,a difference as great as this would be obtained less than one time in twentyon repeated sampling.
Table 6.-Indexes of output per man-hour for women pieceworkers in himher andlower paid occupations In four clothing establishments, by age group
_ _(Age__ro _35-44-100)Higher Lower
Age Jdber Coefficient *1uW~e Coefficientgroup 1/ Of Index of variation of Idex of variation
_________ ~workers _(percent) workers (percent)
25.34k... 20 95.5 15.4 80 100.8 22.8
35-=414... 67 100.0 12.3 153 100.0 21.8
45-560.... 119 96.1 15.7 268 99.2 19.2
55-614.... 67 3/ 89.9 15.3 212 3/90.3 20.2
1/ Two age groups, under 25 and 65 and ower, are excluded because thenumber of observations was considered insufficient. (See table 12.)
2/ This index is significantly different fram 100 in the sense that, iftherewere really no difference between the age group and the base group, adifference as groat as this would be obtained less than one time in twentyon repeated samping.
- 30 _

Consequently, variation within age groups again must be viewed in termsof its magnitude rather than in terms of its relationship to age. As notedearlier, the considerable degree of variation evidenced means that even thougha decline in average perforamce after age 5i was observed, there are manyworkers aued 55-1 whose perface equaled or even surpassed the averageperformance of younger groups.
One difference between the variation within age grous for workers inhigher paid jobs and for workers in lower paid jobs is ap . The vari-ation was, on the average, slightly greater among workers in lower paid jobsthan among those in higher paid jobs, indicating more individual differencesin productivity in less skilled occupations.
Mci Because the nature of machine work differssub l taohdr data are presented to shed light on thequestion of whether age affects the performance of workers in the one type ofoperation more than in the other.
The same general picture of stability until age 54 and nsoe declinethereafter is evident in the machine-hand comarisions (tables 7, 8, 9, and10). There were exceptions, however. The indexes for ml handworkers aged55-64I, although apparently lower in both industries, were found not to besisnificantly different from the indexes for other age groups. At the sawtine, the apparent increase in the index for female machine operators in theshoe plants was also found not to be statistically significant (table 8).
One interesting difference between band and machine operators in thefootwear plants should be noted; the index for mal machine operators aged25-34 is significantly lower than that for the 35-4 year rup. The indexesfor both sale and female hadworkers aged 25-34 are significantly higher thanthose for the correo g andworkers aged 35-4i. The indexes for theclothing workers in these age groups were not significantly different from thecorresponding base group index (according to statistical tests) for eithermachine or hand operations.
Again no consistent pattern evolved and no eneral conclusion aboutdifferences in the age--productivity relationships of machine operators ascontrasted with ixandworkers can be drawn.
The age group performance indexes should, once again, be interpreted inthe light of the variation measures. Again, the range of individual vari-ability was sizable.
Initial Occupational Groups. Tables l1 and 12 show output per man-hourindexes by industry, sex, vel of pay, and type of operation (hand or machine'
These are the indexes obtained in the initial aggregation of the specificoccupation indexes, and, in many cases, represent only a small number of wor-kers. Results are not shown for those groups containing fewer than five
- 31 -
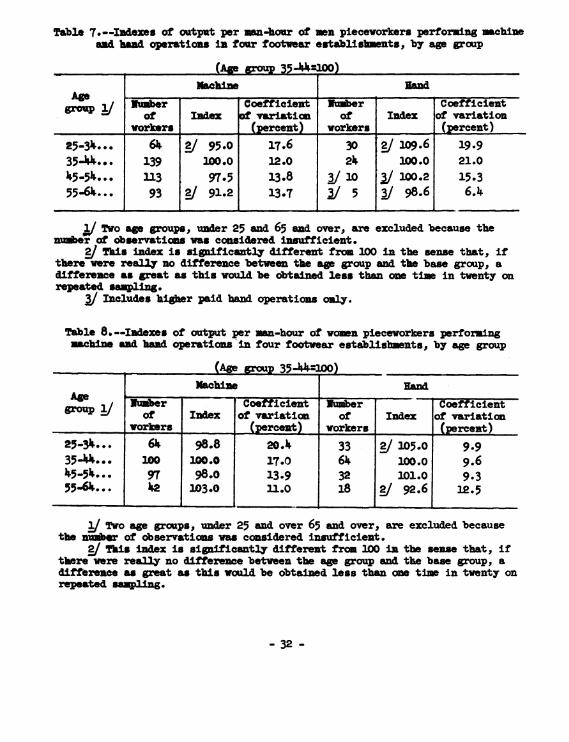
Table 7.--Indes of output per man-hour of men piecevorkers performing sachineand 1had operations in four footwear establishments, by age group
_________ . (Ag group 35-):LOO )
Ag ___...,gp / lmber Coefficient lumber Coefficient
of Index of variation of Index of variation_workers _ __ _ (percent) workers (percent)
25-34... 64 / 95.0 17.6 30 gJ1o9.6 19.935A4* 139 100.0 12.0 24 100.0 21.045-51-** 113 97.5 13.8 3/ 10 3/ 1W0.2 15.355-6k.... 93 / 91.2 13.7 ]/ 5 3/ 98.6 6.4
T/TO e groups, under 25 and 65 ad over, are excluded because thenmber of observations was considered insufficient.
?/ This index is significantly different from 100 in the sene that, ifthere were really no difference between the age group and the base group, adifference as great as this would be obtained less than one time in twenty onrepeated sampling.
3/ Includes higher paid band operations only.
Table 8.--Indezes of output per man-hour of women pieceworkers performingmachine and bahd operations in four footwear establishments, by age group
(Age xruS 3544J100)
Agegroupp
I
_numerof
wnrlmrfa
llachine
Indexcoefficientof variation
{nrVM^wft%
lumberOf
Hand
IndexCoefficientof variation
%+̂.. _- 4___ _ia W ______a_ AM_______ _I.'
25-3k... 6k 98.8 20.4 33 - / 105.0 9.935-". 100Q 10.0 17.0 64 10.0 9.645-5h- 97 98.0 13.9 32 101.0 9.335-4. - 42 103.0 11.0 18 J / 92.6 12.5
3 Two age groups, under 25 and over 65 and over, are excluded becausethe n=uber of observations was considered insufficient.
2/ Tis index is significantly different from 100 in the sense that, ifthere were really no difference between the age group and the base group, adifference as great as tbis would be obtained less than one time in twenty onrepeated s m .
- 32 -

Tble 9.--Indexes of output per nn-hour of en pieceworkers performing machineand hand operations in four clothing establishments, by age group
(A p 35- *10)Uchne Hn
Iwo-&rId r Coefficic Number ~ -Coefficientgl? ^/ of Ind of variatioa Of Index variation
-_______ rworkers (percent) workers (percent)25-3 . * 43 96.6 6.5 2/ 9 #/ i0I.I 9.535-" . 56 28s.0 15.2 26 100.0 14.645-% * . 34 100.0 15.5 17 101.6 10.255-6 . . 70 / 90.8 l8. h0 93.9 23.0
/ Two ag groups, nder 25 and 65 and over, are excluded because thember of observations was considered insufficient.
2/ Includes lower paid bad operatios only.]/ This index is sig-niicantly different fron 100 in the sense that, if
there were realy no difference between the age group and the base group, adifference as great as this would be obtained less than one time in twenty onrepeated sampling.
Table 10. --Indexes of output per man-hour of women pieceworkers performingm ne and hand operations in four clothing establishments, by age group
(Aue ruon
group i/ Number Coefficient 1Cofiof Index of variation of ne o a t
__________ workers --_____ (percent) workers (percent)z.7-.14 -354k a45-SX .*c __L
54129203.. -_
10.3100.0l00.4
22.718.717.6
Li691
l8
98.3100.096.3
21.920.718.7J.PJ . . 91.2 18.1 173 [/89.2 19.6
1f Two ag4 groups, _der 25 and 65 an ovr, are excluded because themnuber of obserratios wa cosidered imufficient.2/ This Index Is sigeificantly different from 100 in the sense that, Ifthere were really no difference between the age group and the base group, adifference as great as this would be obtained loss than on time In twenty atrepeated sampi ng.
- 33 -
.
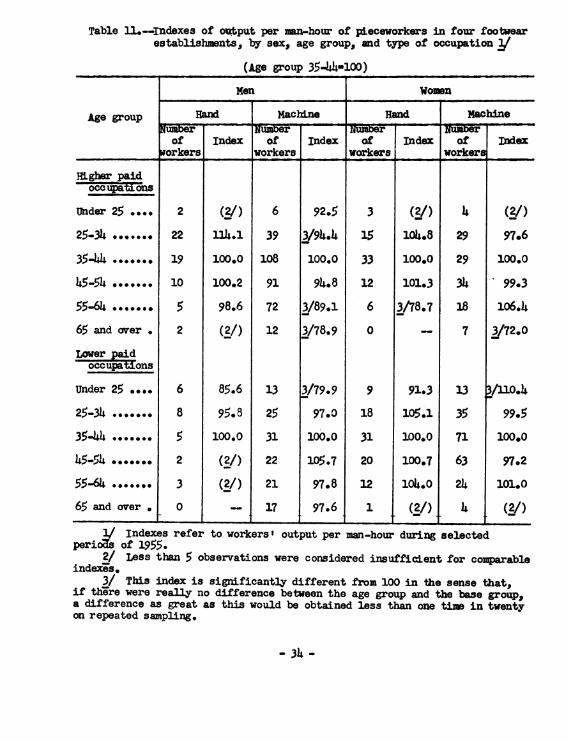
Table 1l.--Indexes of output per man-hour of pieceworkers in four footwearestablishments, by sex, age group, and type of occupation 2
(Age group 35-44-100)
Men Womn
Age group Hand Machine Hand MachineNW 1 N11umer Vale
of Index of Index Of Index Of Indexworkers workers workersHigher paid~.- -.. -M M
oicger paid
Under 25 *...* 2 (2/) 6 92.5 3 (&') 4 (2/)25-34 ....... 22 114.1 39 3/94.4 15 104.8 29 97.6
35-44 ....... 19 100.0 108 100.0 33 100.0 29 100.0
45-54 .--..-- 10 100.2 91 94.8 12 101.3 34 99.3
55-64 ....... 5 98.6 72 3/89.1 6 3/78.7 18 106.4
65 and over . 2 (2/) 12 3/78.9 0 7 2/72.0Lower paocepi ons
Under 25 .... 6 85.6 13 3/79.9 9 91*3 13 */lo.4
25-34 ....... 8 95.8 25 97.0 18 105.1 35 99.5
35-44 ..5... 5 100.0 31 100.0 31 100.0 71 100.0
45-554 ... ... 2 (2/) 22 105.7 20 100.7 63 97.2
55-64 ......* 3 (2/) 21 97.8 12 104.0 24 101.0
65 and over 0 - 17 97.6 1 (2/) 4 (2/)1/ Indexes refer to workers output per mm-hour during selected
periOs of 1955.2/ Less than 5 observations were considered insufficient for comparable
indexs.3/ This index is significantly different from 100 in the sense that,
if there were really no difference between the age group and the base group,a difference as great as this would be obtained less than one tic in twentyon repeated sampling.
- 34 -
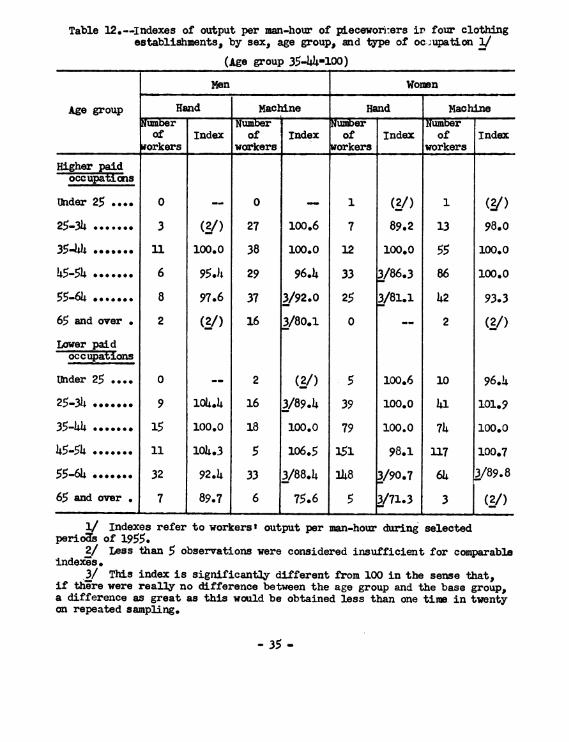
Table 12.--Indexes of output per man-hour of piecewori:ers ir. four clothingestablishments, by sex, age groups and type of occupation 3.1
(Age group 35-44-100)
men Worsen
Age group Hand Machine Hand Machinetumbe er Numer 1uMFOf Index of Index of Index of Index
workers workers orkers workers _
Higher paidoccupations
Under 25 .... 0 _ 0 _ 1 (2/) 1 (Q/)25-34 *...... 3 (2/) 27 100.6 7 89.2 13 98.0
35-44 ....... 11 100.0 38 100.0 12 100.0 55 100.0
45-54 ....... 6 9514 29 96.4 33 3/86.3 86 100.0
55-64 ....... 8 97.6 37 3/92.0 25 3/81.1 42 93.3
65 and over . 2 (2/) 16 3/80.1 0 -- 2 (2/)
Lower paidoc uafons:
Under 25 .... 0 2 (2/) 5 100.6 10 96.425-34 *...... 9 104.4 16 3/89.4 39 100.0 41 101.9
35-44 ....... 15 100.0 18 100.0 79 100.0 74 100.0
45-54 ....... 11 104.3 5 106.5 151 98.1 U17 100.7
55-64 ....... 32 92.4 33 3/88.4 148 /90.7 64 3/89.8
65 and over * 7 89.7 6 75.6 5 3/71.3 3 (2/)
1/ Indexes refer to workerst output per man-hour during selectedperiofs of 1955.
2/ Less than 5 observations were considered insufficient for comparableindexes .
3/ This index is significantly different from 100 in the sense that,if there were really no difference between the age group and the base group,a difference as great as this would be obtained less than one time in twentyon repeated sampling.
- 35 -

individuals, since it was felt that data based on such a limited number ofobservations would not be sufficiently reliable to be compared with indexesbased on greater numbers.
These tables illustrate the need for a large number of observations foreach age group in specific occupations.
The indexes shown in the tables reveal greater fluctuation than was evi-dent in the combined indexes. 18/ This greater fluctuation is attributable,for the most parts to the small number of workers umderlying each index,resulting in a greater influence on the group average of individual scoreswhich are extreme.
It should be recalled that the number of workers in any age group in eachof the classifications shown in the tables (e.g., men, aged 25_34U, in higherpaid hand occupations) alreacr is an aggregation of workers in various specificoccupations in several plants.
Although the initial indexes for occupational groups appear to fluctuatemore than those for the combined occupational groups, they nevertheless exhibitsimilar patterns. For the most part, there were no significant differencesbetween the indexes for the age groups 25-54; after age 54, a small declinesstatistically significants, occurred. While the varying composition of thesecombined groups will not impair the comparability of the different age groupswithin a series (since the same weights were applied in combining each of theage groups in the series), it will affect the comparability of one series withanother. To whatever extent the relationships between age and work performancediffer among the occupational groups, the comparability of indexes representingcombinations of these groups will be impaired.
Attendance
Data on attendance were collected for 4,009 production workers of which1s758 were in the footwear plants and 2,251 were in the clothing plants.
Although the attendance indexes show minor differences between age groups,as indicated in tables 13 and 114, these differences are of such limited magni-tude as to justify the conclusion that attendance rates in the plants surveyedshow no appreciable relatimnship with age. In the clothing plants, the indexesof all age groups fell within 95.5 and 102.3 percent of base group average.In the footwear plants, the range was even smaller-98.7 to 101.6.
With regard to individual differences, the individual attendance rateswithin comparison groups showed remarkable consistency and it became evident,at an early stage, that no purpose could be served by calculating the co-efficients of variation of these rates. The individual differences about theaverage indexes were so small that they played no role in the comparisons.
18/ Cf. tables 1 through 10.
36 -
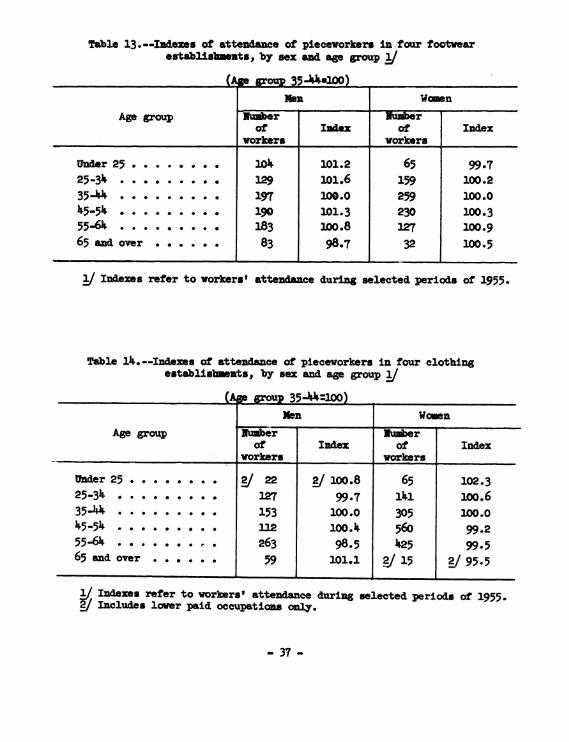
Table 13.--Indexes of attence of pieceworkers in four footwearestablishments, by sex and age group
(Aige gr2M 35410) _
YAe WomenAge group Number br
of Index of Indexworkers workers
Under 25 .. 10) 101.2 65 99.725-3 .. ....... 129 io.6 159 100.23544. .. 197 100.0 259 100.045-54 .. 190 101.3 230 100.355- a . . . ... . 183 100.8 127 100.965 and over * .* 0.... 83 98.7 32 100.5
Indexes refer to vorkers' attendance during selected periods of 1955.
Table A.--Indexes of attendance of pieceworkers in four clothingestablishments, by sex and age group
(A p oun 35-44a1_) _
len WmenAge group Number Number
of Index of Indexworkers workers
Under 25 ............. / 22 g/100.8 65 102.325-34 . . . . . . . . . 27 99.7 141 100.635.4.. . .. . . . 153 100.0 305 100.045-54 . .. .. 112 100.4 56o 99.255-64 .. .. . . . 263 98.5 425 99.565 and over 59 101.1 /15 95.5
1 Indexes refer to workers' attendance during selected periods of 1955.Includes lower paid occupations only.
- 37 -
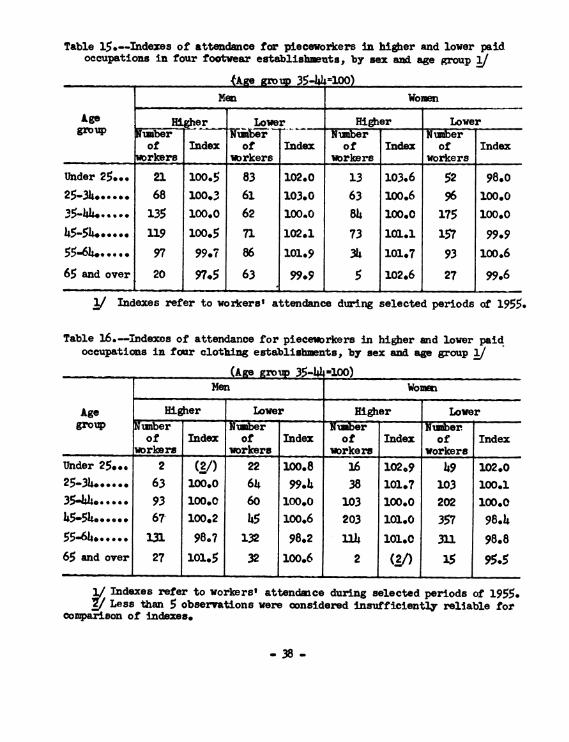
Table 15.--Indexes of attendance for pieceworkers in higher and lower paidoccupations in four footwear establishzents, by sex and age group
_Age group 35-44=)Men Women
Age Higher Lower Higher Lowergroup mnber -NirNun ._
of Index of Index of Index of Index_______w_orkers workers workers workersUnder 25... 21 10045 83 102.0 13 103.6 52 98.025_34...... 68 100.3 61 103.0 63 100.6 96 100.035-4.4.... 135 100.0 62 100.0 84 100.0C 175 100.045-54**..... 119 100.5 71 102.1 73 101.1 157 99.955-64...... 97 99.7 86 101.9 34 101.7 93 100.6
65 and over 20 97.5 63 99.9 5 102.6 27 99.6
,/ Indexes refer to workers' attendance during selected periods of 1955.
Table 16.-Indexes of attendance for pieceworkers in higher and lower paidoccupations in frar clothing establishments, by sex and age group
_________ ~~~(Age group 35-4i-100)Men Women
Age Higher Lower Higher Lowergroup Number _ Niber Nmiber
of Index of Index of Index of Index_________ workers workers workers workersUnder 25.., 2 (2/) 22 100.8 16 102.9 49 102.025-3140...- 63 100.0 64 99.4 38 101.7 103 100.135.4401...... 93 100.0 60 100.0 103 100.0 202 100.045;-54..0.0. 67 100.2 45 100.6 203 101.0 357 98.455-64*...... 131 98.7 132 98.2 1l1 101.0 311 98.865 and over 27 101,5 32 100.6 2 (/) 15 95.5
1/ Indexes refer to workers' attendance during selected periods of 1955.I/ Less than 5 observations were considered insufficiently reliable for
comparison of indexes.
- 38 -
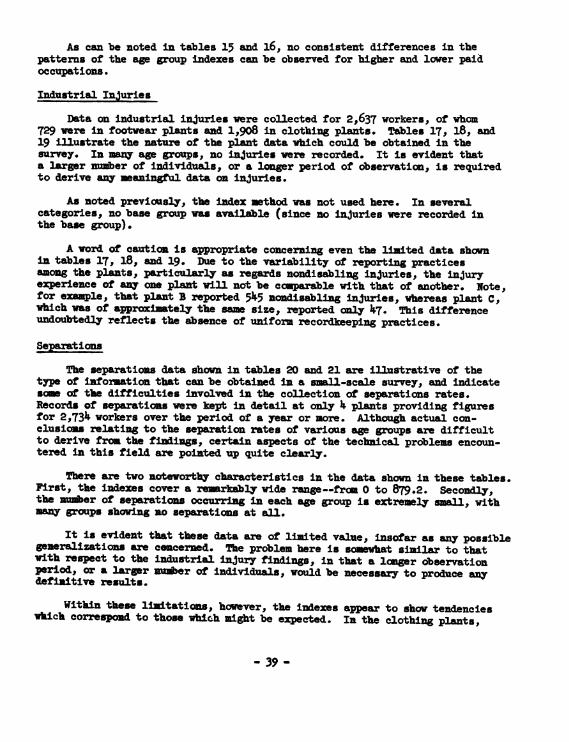
As can be noted in tables 15 and 16, no consistent differences in thepatterns of the age group indexes can be observed for higher and lower paidoccupations.
Industrial Injuries
Data on industrial injuries were collected for 2,637 workers, of whom729 were in footwear plants and 1,908 in clothing plants. Tables 17, 18, and19 illustrate the nature of the plant data which could be obtained in thesurvey. In many age groups, no injuries were recorded. It is evident thata larger nuber of individuals, or a longer period of observation, is requiredto derive any meaningful data on injuries.
As noted previously, the index method was not used here. In severalcategories, no base group was available (since no injuries were recorded inthe base group).
A word of caution is appropriate concerning even the limited data shownin tables 17, 18, and 19. Due to the variability of reporting practicesamong the plants, particularly as regards nondisabling injuries, the injuryexperience of any oe plant will not be comparable with that of another. Note,for example, that plant 3 reported 515 nondisabling injuries, whereas plant C,which was Of approximately the sae size, reported only I7. This differenceundoubtedly reflects the absence of uniform recordheeping practices.
Separations
The separations data shown in tables 20 and 21 are illustrative of thetype of information that can be obtained in a small-scale survey, and indicatesow of the difficulties involved in the collection of separations rates.Records of separations were kept in detail at only 1 plants providing figuresfor 2,734 workers over the period of a year or more. Although actual con-elusioms relating to the separation rates of various age groups are difficultto derive fron the findings, certain aspects of the technical problems encoun-tered in this field are pointed up quite clearly.
There are two noteworthy characteristics in the data shown in these tables.First, the indexes cover a remarkably wide range--from 0 to 879.2. Secondly,the umber of separations occurring in each age group is extremely mall, withMany groups showing no separations at all.
It is evident that these data are of limited value, insofar as any possiblegeneralizations are concerned. The problem here is sowhat similar to thatwith respect to the industrial injury findings, in that a longer observationPeriod, or a larger number of individuals, would be necessary to produce anydefinitive results.
Within these limitations, however, the indexes appear to show tendencieswhich correspond to those which night be expected. In the clothing plants,
- 39 -

0 0H
ft Os ft ft
I co Cv-
* 0
00 0 0
o I^C) *C*M-* i
U I.6 I*I
CMcnl
* 0* 0*
0*
0
0 0
-g g C- -1JO '. en IA
* 0
*
* 0
0
0
* -Ala*.g11 0
41\'Uig
* 0
*
* 0
4 h
IA
- 40 -
0
V
0
O ho0)
Ilk)0~
*Hto
0)
'd o00
0
0p.
0 0 H 0 0 0
900
IA,ig
0
q'U\clr\
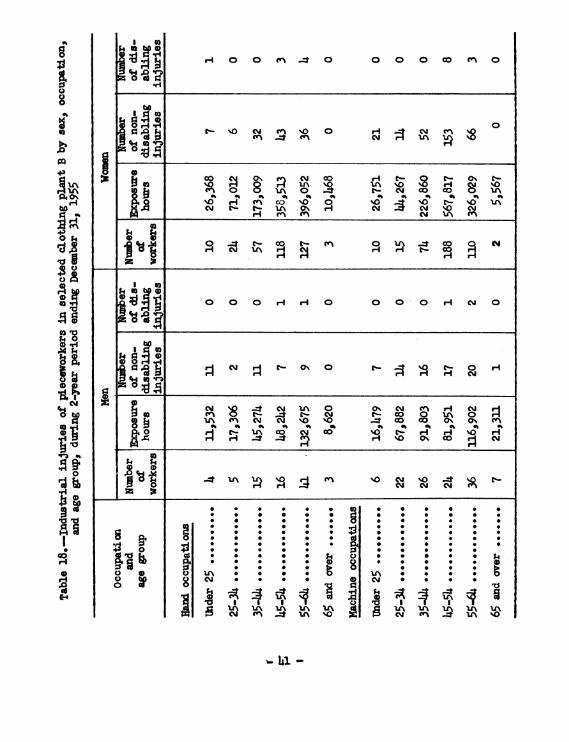
H 0 0 m J 0 0 0 0 m m 0
___ H CVl NCY
°
co m n cl UN FOA
:~~~~~~~~~c 01 CM coQ- tl 01r0-£s v Ja
PeO s0 ~~~~~~~~~Hcn co %0 so \0 r- \0 U\A~~~~~~~~~CN - \ 0\ CM C- I- CY
N >
.4 e'-C 'H l f "I Nt
0 0 0 H H 0 0 0 0 H N 0
c g NSF>oC1 CSo
11 cmN N '0 '0\ = Co 0 0 c0iC co C0M c H ' O
___i - H \'0 0' co
f A ' 0Im % g % t A
0
41 0
8CY
$4 UN
0
a'
00
0000a
000
U\I
U\It
U'
U'
N
k
0
N
0
0
4.
IIf\cr%
lA
U'
I'
b
0
w 1-
I co
is8 ti
I:3
0
0
8
06'a
Olh
Cm
43
H
hO
f4 o
11D 0H
0
ri
*0A*
hi
:Z N
CbDO 0
_
I la$4 go V 404) :6 . .
"o .0 -r--aco 4
cl-

41bS5g~~~~~~;o l
0f0| e * 0 0 H N - H 0
§ 14 so 40~~~S X di 0 o '0 %0 N 0 e %O C mn 0
O Z ~~~8ul
@~~~~~~~~~~~~~~~~~~~~~~~~~~~~~~~~ 8Is\ :ow
9 % 4%8%8 8 8 ft ft ft ft
O $4 hH$4o 0wDC) ~~~~~~~~~~~~~~~~~~~W N-(I t'- O u% 0'O> Ctt CM oo r- mH~H
~~~PC)~ ~ ~ C10 :
H h0( I U)
4) tt bad
9 0 0o o H 0 N 0 0 N H H 0 0
c) ;I4
~~~.3 0~~~:F' __oatko coa g 8 8 8 8 8
$4U)$4~~~ \ vl M - cm c
$40~~~~~4c0) . .
~ . _.** * * * *~ *
C
* * * * *S*e *2:S 0Su
* : :h
H C) 0 Q N * 0a N * * N \.0 C)~~~~ ~~~00 0 ~ 0)002O l3 $ fl t q ; 5 :S t i 5 g ; tico~ ~ a la F
- 2 -

the under 25 age group shows a very high rate of separations, aL does the 65and over group, whereas the 45-54 and 55-64 year groups show an extremely lowrate of separations reflecting the relative stability of these groups. Theyoungest age group is generally recognized to be one of greater mobility,while the 65 and over class reflects the high incidence of retirements.
The intermediate groups show rates that vary considerably. These ratesare, in general, lover than the rates for the youngest and the oldest groups.
In view of the inadequate data, it is not possible to identify any sig-nificant differences in the age-separations patterns shown by the variousgroups. In a larger scale survey, howevers it would probably be importantto retain the categories used here, in which distinctions are made accordingto sex, industry, and length of service.
- 43 -
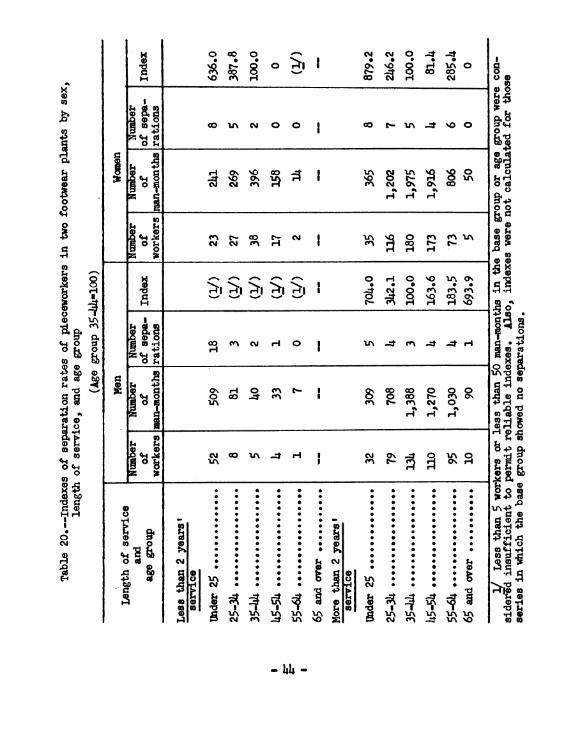
o cro _0CC
\0 e^ H
N N 0 .4s .4-* * * 0 *0I% \ g8% 0X H Co
0 04;
~~~;%.4 0NM m %. CO 4h
Zlg-I H
O)co U'-. CN
CN cN
_ - a
>1 >1 >1 >1>1 1_-- _.. _.. %_O
H 0 '0 Uj\ 0%* * 0 * *
o-%
Ii | H N H O l A 4 ' J . H|~~~~~~~~~~~~~~~~~~~~~~~~~~~1943~~~~~~~~~~~~~~~~~~~~~~~~~~r
14 4o
OCO. eCu1 o co0~~~~~~OH U\ clr\ C-i~~~~~~~~~~~~~~~~~~~
go14
A :R
N VA H I CM 0% O lAO
I M r- 4 S l--4.
0C)
0t
0) 0
0.g
C14
a0D4
* *
* * *
* * *
* * * * *
,000~~~~~CM~~~~~~~~~1
*0 0
* *
* 0 0 * *
* * ** * *
* * * * 0
* ** * * * *
* * * * **~ * * *
- 44 -
I-I
:1
ISa
r.
Etaba
f.C
aU
f.
4-
VI
I-I
0
0
:34 8
CR
VI
0
n o.
0
0
4)
tH
~Ii
0 4p
0 P0
0t
H IH
0
CQ4
N
E0
co 4
~0
D5~.
C)oH
0
nop
0
t Ol14010
0010
4, 0
1003
140
34)a
*oaC00
rx
41.CU
a
4
0111.fa
A I 0 cn ON U\I t- t-19 r-I
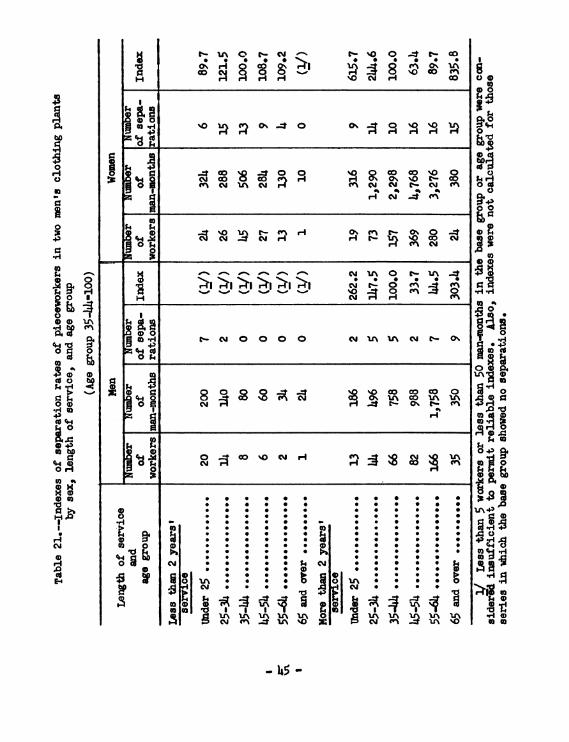
Go *l * * *..
lA 0. 9 SS*- %o 0 _* t- wo 0 0 0 0
mONH
q14aIJ° °a.k$4a0 .4
W4 1 ~~~~~~~HN -* r'n
. '0 A rl- PV HN N t N H1
0K m t- $> 0 .9MI Cf. cot0H F u Z a:cC
N . 0 .- lA
o 0 0 0N r- o m :3 m
I ~ NO O1, clIs01 t-Ci 0 0 0 0" % N W L1-0
H %0 co co
0
0
0
co 0HA o
C- cft
O . wo %O N HN 1
0
U'
0
0
'0
0X 0
kDhCM
0 U\
0
0
0
00
'0
of
00
a
0.
0
04
O49
$413
el
go
III.9*
..4131
- 45 -
$4 S$4
m 3
0
0
03
8HI
Iv'
1oI0.
CD
0
A
0
.3f40
0 0
4-f)0Cfj
0
hIO
OH
en t043~
cCH
0
H
06
I-CM
E-4
N 0C\ A
$4
I 0
0A19-. I
Wla0
I 010
131
0^04

Appendix
I. Further Notes on Statistical Methods
This section is included in order to clarify the assumptions underlyingthe statistical methods adopted, and to describe more fully the steps followedin deriving the meastres of work performance. It is not included in the bodyof the report, since it is believed to be of limited interest to many readers.
As indicated throughout this report, there were two basic problems to beresolved by the statistical methods applied in this investigation. First, itwas necessary to derive comparisons which isolated the influence of age fromthe maw other (and often more important) factors which act upon a person'swork perfomne. Second, there was the problem of combining the measuresdrawn from small groups of persons, which alone could not furnish meaningfulresults, into larger aggregates from which statistical conclusions might bedrawn.
The first problem was resolved in two ways--classification of workersand the use of relative scores. The second problem was resolved, to a certainextent, by applying the appropriate weights to the groups to be combined. Foreach of the perforsance indicators the specific classification scheme varied,as did the weights applied to the measure, but the fundamental approach wassimi ar.
Before discussing the bases for the statistical methods applied, it wouldperhaps be usefal to indicate briefly the definition of the universe which isbeing measured by this investigation.
Definition of Universe
As noted previously, the findings resulting from this study are appli-cable only to the particular plants included, and do not necessarily reflectconditions throughout the two industries In another sense, however, theindividual employees for wha data were collected constitute a sample drawnfrom a larger population. If a different survey period had been selected,or if the eight companies had employed individuals other than those whoscharacteristics were recorded in this study, the results would, of course,have been somewhat different from those reported here.
The data presented in this study are, with respect to the particularindividuals concerned, actual measurements rather than estimates Howeversthese individuals may be regarded as a sample, drawn from a universe whichincludes all possible employees who might be found, at any time, to be workingin plants which are identical to the oes studied in matters affecting employ-ment practices and working conditions. If this broader applicability isascribed to the findings, then they must be regarded as merely estimates, andsubject to certain errors.
- t6 -
Methods for evaluating the reliability of these estimates--that iss ofdetermining the probability that the estimates will fall within a specifiedpercentage of the results that would have been obtained if the entire universehad been used rather than a ample--are available through the application ofappropriate statistical techniques. It was this interpretation of the popu-lation which led to the use of reliability weights which are discussed later.
Ocuptional Classification
Direct comparisons of output per man-hour scores were made only amongindividuals in the same specific occupation. The occupations were, in turn,classified into several occupational groups according to the following charac-teristics: hand operations, machine operations, higher paying jobs, and lowerpaying jobs. For attendance, direct comparisons were made among individualswhose occupations were in the same earnings classification.
E The idea behind the classification of workersaccording to the average earnings of their occupations is that earnings, onthe whole, can be regarded as indicative of the relative degree of skill andexperience required for the job. Special exceptions, of courses have to bemade for jobs in which the level of pay is relatively high for other reasons,such as less desirable working conditions.
Initially, an attempt was made to classify jobs into skilled, semiskilled,and unskilled occupations according to classifications given by the Dictionaryof Occupational Titles. 19/ After this had been done, it was found that manyskill level classifications thus derived were inconsistent with the averageearnings of persons on the job. Some "unskilled" jobs were among the highestpaid occupations, while some "skilled" jobs were in the lowest paid group.This was probably because of the great variation in the nature of jobs whichcarry the same title in different plants. Because of these inconsistencies,it was decided that average hourly earnings for jobs would provide a betterbasis for classification.
There are several alternatives which could have been used for establishingthe limit to divide jobs into higher and lower paid groups. One is to draw adividing line for each plant surveyed; another is to establish a regionallimit. The use of plant averages would reflect special differences in condi-tions which affect earnings in particular plants, such as plant efficiency,degree of unionization, and local bargaining power of particular groups ofworkers. For purposes of this studyr, however, some criterion was desired whichwould be sensitive to the actual skill levels of workers, rather than theirstatus in relation to the rest of the workers in the plant. Such a criterion
19/ Dictionary of Occupational Titles, Federal Security Agency, U. S.Employment Service, Division of Occupational Analysis, March 1949.
- 47 -
was necessary in order to arrive at some grouping of skill levels which wouldbe consistent from plant to plants and would thus permit the aggregation ofindexes from various plants according to a skill level classification.
A specific dollar figure was establisheds therefore, for each industrywithin a given region, and was used to distinguish between higher and lowerpaid occupations. This figure was derived from the average hourly earningsfor the specific industry and region (as determined through wage surveysconducted by the Bureau 2/) adjusted for changes in wage levels since thedate of the most recent survey.
This figure was then used to classify each of the occupations found inthe present survey. Those occupations in which the average hourly earnings(within a given plant) exceeded the regional average for the industry wereconsidered higher paid, whereas those in which average earnings fell belowthis figure were considered lower paid. This was done separately for maleand female workers.
In this way, the skill level classification which was assigned to eachoccupation depended on the relationship of the average earnings in that occu-pation to the overall regional average for the industry, rather than to theaverage for the one plant alone. It was believed that the use of regionalindustry averages as cutoff points would provide more reliable indications ofactual skill requirements than would the use of individual plant averages.
Machine-Hand Classifications. The machine-hand distinctions were madein order to separate jobs which place somewhat different requirements onworkers. Mac jobs, it is believed, call for many skills and talentsdifferent from those needed for hand operations, and the skills peculiar tomachine operations or to hand operations influence the productivity of variousage groups differently. By making this distinction, the influence of thesefactors in the age group comparisons was minimized.
A machine job was somewhat arbitrarily designated as one which requiredthe use of a powered device. Most of the designations were arrived at aftera discussion with plant officials as to the particular eqiipment used in thevarious occupations. In some cases, where it was difficult to classify theJob, the judgent of the plant official who was aware of the physical require-ments of the job was used.
O/ Wage Structure - Footwear March 1953, BLS Report 46, December 1953.Men's and Boys' Suit and Coat Industry: Earnings March 1951, Monthly LaborReview, November 1951 (pp. 573-575).
- 48 -
Transformin, Absolute Scores into Indexes
As stated earlier, In the case of output per man-hours, the average hourlyearnings of the age groups in a specific occupation were related to the aver-age hourly earnings for the 35-44 year group, whidi was used as a base, Inthe actual derivations, 2 different 10-year age groups were Chosen as bases ofcomparisons the group 35-44 desigated base group Al' and the group 25-314called base group 'B',.
Indexes could be constructed only for those operations where workers ofbase group age were present. The use of 2 base groups instead of 1 permittedthe inclusion of additional occupations in the produxtivity comparisons. Inthis my a greater proportion of the raw data collected during the plant visitscould be utilised. ,/ In those occupations which included persons in bothbase groups, two pro ctivi indes were derived for each age group.
A single 20-year base group, ages 25-b44 was considered and rejectedbecause, on aggregating over occupations, the results might reflect differencesin performance associated with the average age of members of the base group,rather than differences in the performance of the age groups compared
mng 2_tion a
The occuatlon indexes of an age group uing age group 35-44 as a base(base group A) were combined with appropriate weights to furish an occupationalgroup index for that age group. The specific occupations are viewed as samplesyielding estimates of the index for the occupational group. They should,therefore, be combined, using weights which take proper account of their re-liabilityo
The occupation indexes were uually based on different numbers of peoplein the age group and different numbers of people in the base group. Accordingly,they are more reliable the greater the number of individvals in the age groupand the greater number of individuals in the base group. The formula for theweights was NaNb~/aNb where 1a is the number of individuals in the age groupand Nb is the number of individuals in the base group.,*/L/
21/ Because of the limited data available-In some cases there were noindivAuals in sme age groups-statistical techniques suh as pairing orstandardization procedures could not be applied to productivity comparisons byage groups. These techniques require equalising the occupational copositionof each group or giving results from each occupation the some weight in orderto make the age groups comparable. To apply these procedures, at least 1person from each of the 6 age groups must be present in each occupation.
22/ The derivation of this formula was worked out with the assistance ofthe BuWeau's office of Statistical Standards. Each weight should be inverselyproportional to the variance of the index to which it applies.
2/ For attendance the sam form of weights was applied in combning theeamfirgs level classifications in each plant. Oxe modification was that theweight had to be multiplied by the nuber of scheduled workdays in the plantduring the survey period.
- 49 -
A similar procedure was employed in combining the occupation indexesbased on age group B. Thus, for each age group, two indexes were derivedfor the sam occupational group.
The final step in deriving the index for the occupational grouping isto combine the indexes based on groups A and B. To do this, the B indexesfor all age groups were shifted to group A through dividing them by the Bindex for age group A (35-44). This converted all indexes into series basedon a score of 100 for base group A. The two series were then averaged bymeans of weights expressing the reliability of each index.
Measures of Dispersion
The basic maur of dispersion in an age group was the coefficient ofvariation for the specific occupation. It did not matter whether the coef-ficient was determined from the raw scores or the indexes for the individuals,because, within an occupation and age group, each raw score is divided by aconstant to derive the index for the occupation.
The dispersion measures for the occupational groupings were derived bycombining the measures for the occupations. These were actually derived bycombining the squares of the coefficients of variation with appropriateweights and then taking the square root. In this case, also, the number ofindependent observations in each age group determined the reliability and wasused as the weight. The number of observations in the base group has no in-fluence since it does not affect the value of the coefficient of variationwithin an occupation. 24/
Measures of relative dispersion for individual attendance rates in theage groups are not presented in this report. It was felt that the measureswould possibly be misleading, should inferences be drawn. The distributionsof individual attendance rates are highly skewed with the mode very close tothe maximu score of 100 a very short tail to the right of the mode, and along tail dropping sharply to the left of the mode.
Statistical Significance Testing
Procedures were employed for testing for statistical significance thedifferences between the age group indexes. Each age group index for anoccupational group and combinations of these groups was compared with thecorresponding base group index of 100. The standard error of the difference
24/ The number of independent observations is one less than the numberof persons in the occupation.
- 50 -
between the two indexes was obtained and its standard score confuted. If theprobability is less than 5 percent that the difference of a given size orlarger would occur by chance, assuming the two indexes are the sames, thedifference was considered significant. L/
It was similarly possible to test the significance of the differencebetween any two age group indexes within an occupational group or betweensuch groups. /
25/ It might be noted that, since the base group index of 100 is anexact number and not an estimate, it has no standard error and the standarderror of the difference between the two indexes is the standard error of theage group index alone.
26/ In this case the variance of the difference between the indexes isthe sim of the variances of the two indexes assuming no correlation betweenthe observations making up the two indexes and the standard error is thesquare root of that variance. This assumption is not correct for age groupindexes in the same occupational grouping. These indexes are in part composedof the same base groups and are, therefore, partially correlated. Whereverthis is true the assumption makes the computed standard error larger than thecorrect one. Here, a difference which is found significant at the 5-percentlevel, on the basis of its computed standard error, will actually be signif-icant at a lel of less than 5 percent.
- 51 -

II. Derivation of Formulas
1. Weigt' for CombininIndexes for Scific 0ccutionsThe output per man-hour indexes were combined to furnish an index
for an occupational group. Here, there are a series of indexesr of the
formas Ci)%, wherenci and Ybi are the average hourly earnings of a
sample of Nci individuals in age group C and Nbi in the base group for
occupaticm i, respectively. In order to obtain from the specific occu-
pation samples an occupatimnal group index having the Pimue varianceseach sample index should be weighted according to its reliability, i.e.
according to the reciprocal of the squared standard error of the sample
indele
If the nmerator and denominator samples are uncorrelated, then
the rel-variance of each age group index for a specific occupation is
V2(TCi) -V+2 Vb2Nci Nbi
where V 2 and Vb2 are the population rel-variances of the individual
scores in the age and base groups respectively. Another form of
V2(ICi) is: 2V
i N, Nbi)V2(Ici '
c
NbiNci
Nbi Nci
Setting Wi a i--2---% Nci + Nb
c, NbiVc,2
-0 52 so

then Tz
i- 3o2(c~i)ww
but V2(IjC) ._ _ where Ic is the population index for age group c
2
and o.2(Idj) is the variance of the sample index.
Using the reciprocal of the variance of each occupation sample
index as the weight, then the index for an occupational group is:
0 t2(Ic) Vc2IC2Te - .
0cr2($¢t) Vc2IC2
Since Vt2 and IC2 are constant with respect to the sution
Vi Nei c Nbi.IC f£Wi lci, VC
W, Nb;; NCi b
If the assumption is made that the rel-variances of the age groups2 2 NbiNci
are the same, i.e. Vb -Vcthen Wi. Nbic 2Nbi+N~ci
27/ There was little evidence in the findings to challenge the assumptionthat VC2 a Vb2. The differencea between the age group coefficients of variationwere not consistent nor, for the most part, si zeable. In fact, age groups whidchad the largest number of observations (and hence the most reliable estimates)had almst the same coefficients. 2
It should also be noted that any difference between Vb2 and Vc 'uld havelittle effect on the relative weights used for averaging the occupation indexes.
- 53 -
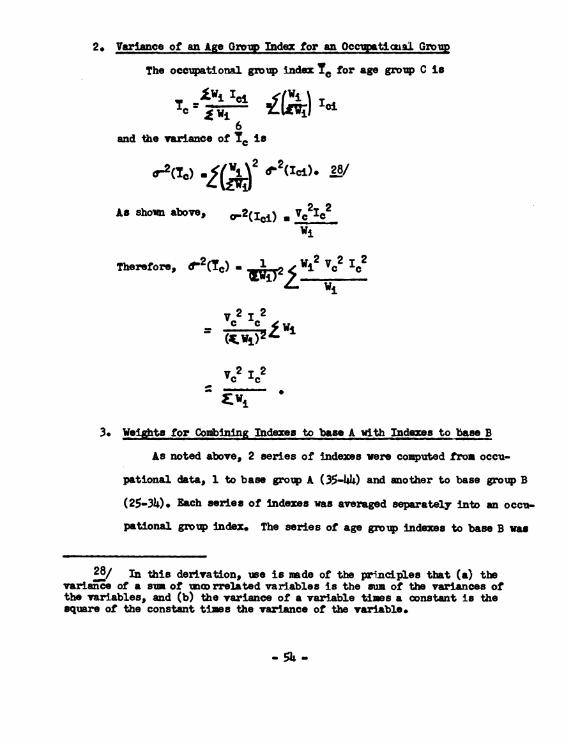
2. Varianceof anAg Grem nefor an Occ ticatal Gro2-~ ~ ~ ~ ~~~PThe occupational group index ! for age group C is
! E, 'ci I ci
6and the variance of°! is
2tsc)~ WLf; (c) 8/
As shown above, Om2(Ici) .V ICWi
Therefore, C2( ) * CI2
V 2 1 2
As noted above, 2 series of indexes wre computd from occu-
pational data, 1 to base group A (35-.44) and another to base group B
(25_34&). Each series of indexes was avreraged separately into an occu-
pational group index. The series of age grovpIndexes to base B wa
28/ In this derivation, use is ade of the principles that (a) thevariance of a sum. of imrrelated variables is the swm of the variances ofthe variables, and (b) the variance of a variable times a constant is thesquare of the constant times the variance of the variable.

converted to base A by dividing each B index by the index of age group A
based on group B. This led to a series of converted indexes of the font
aIC a bIC where the left hand subscript denotes the base used and'a,
a' represents the converted B base index.
For each age group, the index a'c was then averaged with the con-
verted index aIc by neans of reliabili.17 weights.
i~s aao 1 1
t(al2(al)V2aI
From above, 7-2(aIc): -
d"2(aiIc) is derived as follow:
V2(alIC) V2(bld) V2(b~a) 2Pt(bId)V(bla)_ V2(bIc) + V2 .,
From the formula for the variace of an occuptional group index,
it is known that
V2(bIc)- and V2(bIa)Vj
therefore V2(eIC)a)
?29/ Although there is some correlation between indexes bI and b'a9 theinfluence on the relative weights is very all when the correation tent isdropped.
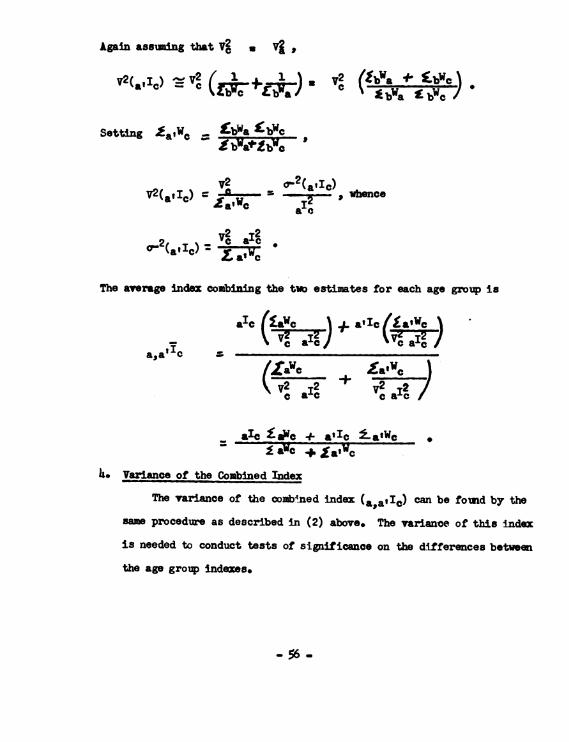
Again asaming that V ,
V2(,Lljc) _= Tc V?)T £ b cEl~~a b;Wa £b~c
Setting Oa'We £bWa-bWc
V2(at.I9) - r2(alc)V2(aIIC) a - , whence
all (atlc) al c
The aeragO index combining the two estimates for each age group is
aIc£ +al'Ic alWc_ \ ~~~V2C Vte JIZ
a,a' c a
(ta~c £aiwc)\V2 2' + V2a /CaVc*I al7
aIc £#c + a'Ic lat'Wc_YIaWc +*alwC
4* Variance of the Combined Index
The variance of the oombmned index (aawld) can be fozd by the
m procedure as described in (2) above. The variance of this index
is needed to conduct tests of significance on the differences between
the age group indemes.

The variance for an occupational group index as derived in (2)
involved no correlation between the indexes for the specific occupations.
In this case, however, soe correlation exists between the two indexes
for each age group-the A based index and the converted B based index.
Both indexes for an age grovp are derived in part from the same specific
occupation sample. For these particular occupations, though the base
group components involved different individuals, the age group components
are based on the average hourly earnings for the same individuals. Be-
came of the complicated form involved when this possible correlation is
introdu.ed, an approximation procedure was eployd
The combined index should be at least as reliable as one of its
component indexes. If the correlation were perfect then no reliability
would be gained by combining a'c and atc . As a limiting ase, therefore,
the reliability of the combined index is equal to the more reliable of
its component Indexes.
Accordingly, the variance computed for the occvptional group index
to base A, a'c,, wa used to approximate the variance of the combined
index, a, I c. The variance was , a4
The stadard error computed on this basis is generally larger than
the true standard error of the combined index. Thus, azV difference in
age group indees which are found significant at a given probability
level thmugh this procedure would actually be significant with ev
greater probability,.
- 57 -

5. Coefficient of Variation for an Occuptional Grow
The age group coefficient of variation for an occupation group was
derived by combining the rel-varianes of specific occupation saples
and taking the sqiare root of this average rel-variance. This section
explains how the weights were applied to obtain the average rel-variance.
For an age group in a specific occupation let
Ni - the nunber of individuals in occupation i (must be> 2)
mean of the saple
i: mean of the population in the specific occupation. This
value is estimated by the sample mean Ii
S2 * (XiiPf 1 )2which is an estimate of the populationI.Ni- 1
vaine sfSS2/! the rel-variance of the sample, an estimate of the
population rl-variance V2
V2 Z 10:12a
Assunzig a normal distribution in the specific occupattons the rel-varanc of2 2 1r2 V2anceo f SI is an-1d the rel-variance ofr ii1to i
v2(14t) ~' 4. according to a general rule for the rel-variance of
a square
- 58 -
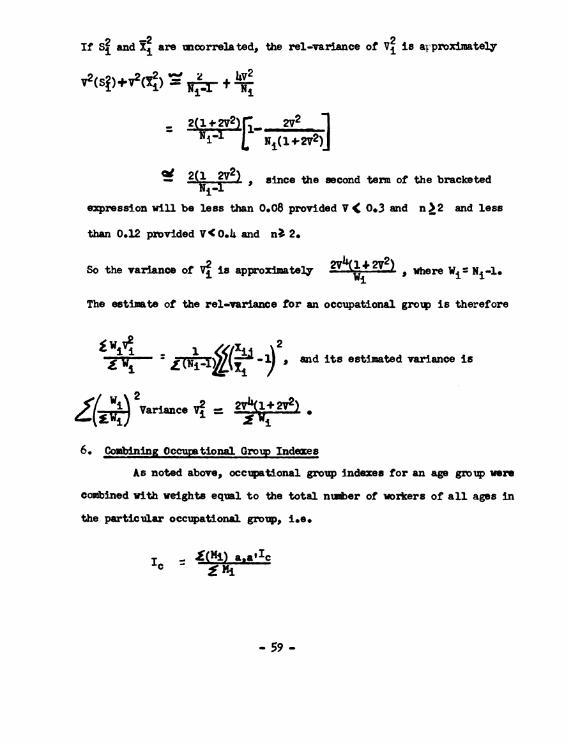
2 -22if Si and Xi are moorrelated, the rel-variance of V2 is ayproximately
V2(Sp)+V2(!~2 *- 2 14V2=T- + -I
(S 2(1<)i+ 2V2
'L 2 since the second tem of the bracketed
expression will be less than 0.08 provided V < 0.3 and n22 and less
than 0.12 provided V<0.,4 and n4 2.
So the variance of V2 is approximately 2V (l *2V2)- where WI- Ni-l.i ~~~~Wi ,hrV~ i1
The estimate of the rel-variance for an occupational group is therefore
2((i19 and its estimated variance is
Ldi(.)2 Variance V2 -
6.~ ~ ~ ~ I _ fW6. combining Occupational Gr-oup Indexes
As noted above, occupational group indexes for an age group wre
combined with weights equal to the total nuwer of workers of all ages in
the particular occupational group, i.e.
IC 4afaI
g 59 -
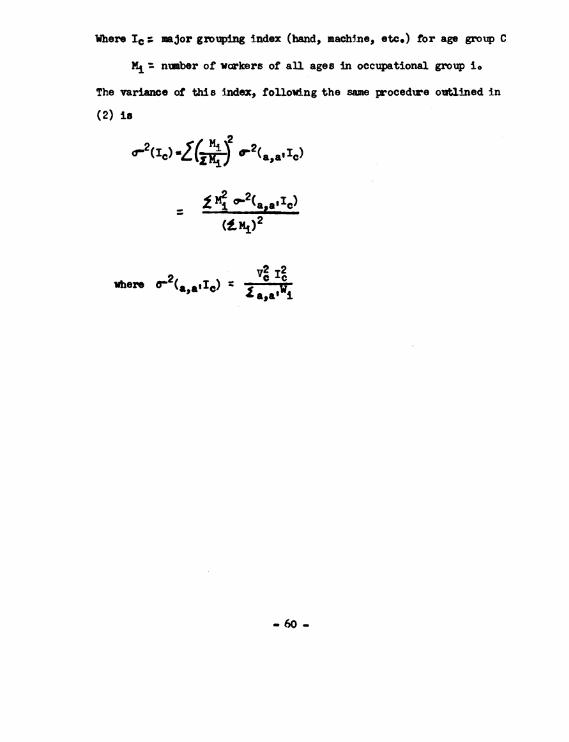
Where Ic mzjor grouping index (hand, machine, etc.) for age group C
My number of workers of aUl ages in occupational group io
The variance of this index, following the same procedure outlined in
(2) is
2(IC) 0(kO2(a aIdc)
(.M)2
whee-2( ~ V2or2where 6o'2(&,aulI 1a)
_ 60 -

UNITED STATES DEPARTMENT OF LABORBureau of Labor StatisticsWashington 25, D. C.
CCG DENTIAL
Al adk or erforace,
Industry__ _
Plant Address
Parent Com yAddress
Officials interviewed: (Cross out, 'Co.' or 'Plant")
Name Title (Co.) (Plant)
Name Title (Co.) (Plant)
Survey made -Dates___Dates______
The data submitted on this schedule wifl be seen only by srnm employees ofthe Bureau of Labor Statistics. The data will not be released in any formwhich permits identification with any specific company,$ without writtenpermission.
k. General Information
1. What are the principal products manufactured in this plant and theirprice range?
2. During normal production periods approximately how many production workersare employed?
THE FOLL(:ING QUESTTCIS REFER TO PRODUCTION WORKERS ONLY
B. Plant Records
3. For what periods during th first half of 1955 was this plant operatingon a full production schedule? (If these periods vary by department,specify)
_ 61 -
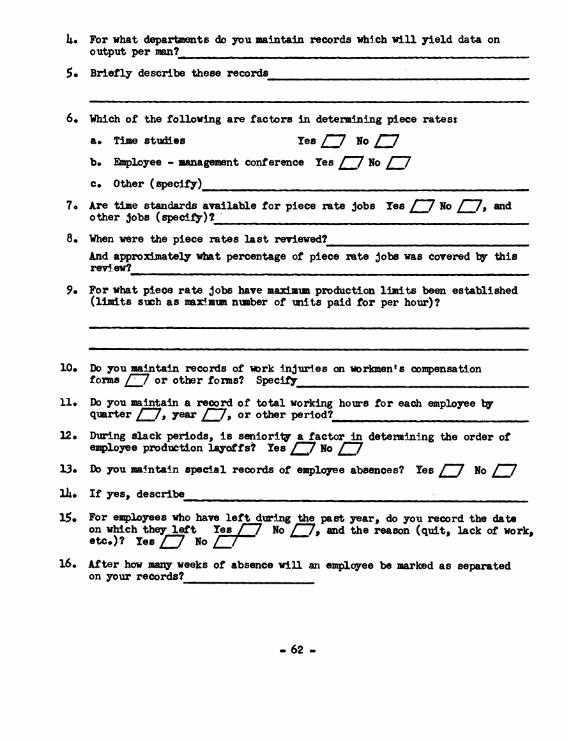
4. For what departments do you maintain records hi.ch will yield data onoutput per man?
5. Briefly describe these records
6. Which of the following are factors in determining piece rates:
a. Time studies Yes /7 No Lj7b. Employee - management conference Yes 07 No ,7c. Other (specify)
7. Are time standards available for piece rate jobs Yes £7 No 17, andother jobs (specify)?_
8. When were the piece rates last reviewed?And approximately what percentage of piece rate jobs was covered by thisrev?
9. For what piece rate jobs have maximum production limits been established(limits such as m&xuimn number of units paid for per hour)?
10. Do you maintain records of work Injuries on workmen' s compensationforms 7 or other forms? Spec
11. Do you maintain a record of total working hours for each employee byquarter D7, year D7, or other period?
12. During slack periods, is seniority a factor in determining the order ofemployee production layoffs? Yes L:7 No 1
13. Do you maintain special records of employee absences? Yes, 7 No D:7
14. If yes, describe
15. For employees who have left during the past years do you record the dateon which they left Yes No £7, and the reason (quit, lack of work,etc.)? Yes 7 No
16. After how many weeks of absence will an employee be marked as separatedon your records?_
- 62 -

17. Do your records contain any information on the quality of wrk turnedout by individual workers (such as nuiber of rejects, quality warnings,etc.)? Yes E7 No I7 If yes, describe
C. Placement Procedures
Do your procedures for placing production workers include the following:18. Initial physical examination Yes [7 No D
19. Periodic physical examination Yes L7 No £7If yes, give time interval between physical checkups
20. Aptitude testing Yes D7 No sC721. Analysis of physical job requirements:
a. Written description of physical requirements (such as working position,physical exertion, vision, etc.) Yes a7 No [7
b. Informal evaluation Yes a27 No £7
22. Other, specify
23. What program is there for the retraining and reassignment of productionworkers?
24i. What has been done to retrain and reassign older workers?
25. Have any measures been taken to review and redesign jobs held by olderworlkrs? Yes [7 No .If yes, give example, n if possibleindicate reasons for initiating these measures
D. Data for Adusting Perfomance Measures
26. Overtime rates become effective after hours per day, __hours per week.
27. What is the premiu rate for overtime work , Sunday or holiday work
28. If these rates of extra pay do not apply to piece work, specify thepremium rates on piece work for overtime and holidays
29. Dates of vacation periods of plant
- 63 _

Age and Work Performance
General Instructions forCompleting Questionnaire
The questionnaire and worksheets on "Age and Work Performance" are tobe used to collect data pertaining to productivity, absenteeism, and workinjuries of individmal production workers in the plants studied. These dataare to be collected together with employee's ages and other pertinent personalinformation. The questionnaire relates to general information, plant records,placement procedures and data-adjustments (sections A through D). Worksheet 1is used for recording personal information, data on production, absenteeismand injury for each worker; a supplementary worksheet 2 is to record detailedproductivity informatim where necessary.
The recommended procedure is to fill out the questionnaire during theinitial interview with the plant official, and then to record the ind4vidualemployee data on the worksheets.
Questionnaire
Instructions are included only for those items not considered self-exlanatory.
If additional space is needed for answers,uwe back of sheets.
1. Prineipal products -- Indicate principal products manufactured in termsof broad product classes, such as Men's Goodyear Welt Shoes, Men's Sui:ts.Designate price range at retail prices for an indication of general qualityrange of the plant' s production.
2. Balo - Enter approximate number of production and related workersinathis Iant. These incLude workers (up through the working foremanlevel) engaged in fabricating, processing, assembling, inspect4on, re-ceiving, storage, handling, packing, warehousing, shipping (but not de-livery), maintenance, repair, janitorial, watchman services, productdevelopment, auxiliary production for plant's own use, recordkeeping andother services closely associated with these production operations. Ifthe plant has less than 500 workers, record this information and terminatethe interview.
3. Production Period -- Obtain dates for 8 weeks (not necessarily consecutive)when plant wa8 operating at full production.
495. Outu Per Man Records - Payroll records which yield straight pieceworkearnings of production workers separate from timework earnings willfurnish output per man figures.
_ 64 _
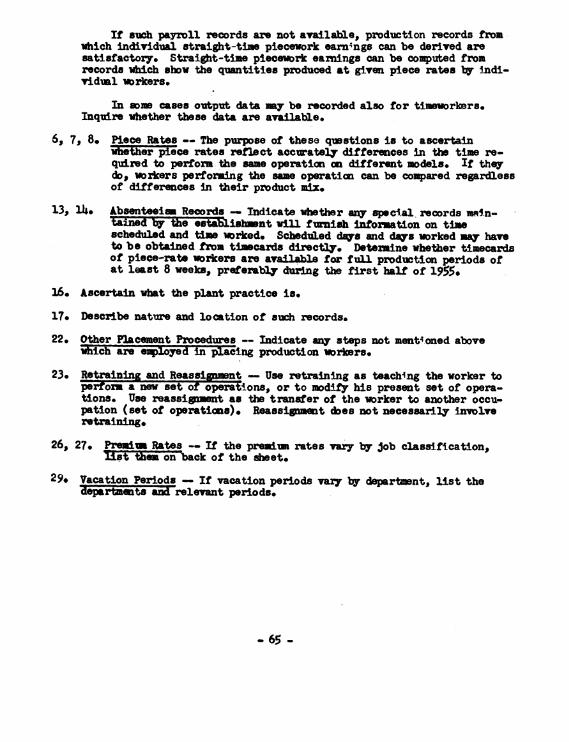
If such payroll records are not available, production records fromwhich individual straight-time piecework earnings can be derived aresatisfactory. Straight-time piecework earnings can be computed fromrecords which show the quantities produced at given piece rates by indi-vidial workers.
In some cases output data my be recorded also for timeworkers.Inquire whether these data are available.
6, 7, 8. Piece Rates -- The purpose of these qvestions is to ascertainwhether piece rates reflect accurately differences in the time re-quired to perform the same operation on different models. If theydot workers performing the sam operation can be compared regardlessof differences in their product mix.
13, 14. Absenteeism Records - Indicate whether any special records nin-tained by the esitat ishment will furnish information on timescheduled and ti worked. Scbeduled days and days worked may haveto be obtained from timecards directly. Determine whether timecardsof piece-rate workers are a lable for full production periods ofat least 8 weeks, preferably during the first half of 1955
16. Ascertain what the plant practice is.
17. Describe nature and location of such records.
22. Other Pacment Procedures -- Indicate any steps not ment4 cned abovewhich are employed in placing production workers.
23. Retraining-and ReasiUse retraining as teaching the worker toperform a new set of operat4ons, or to modify his present set of opera-tions. Use reassipment as the transfer of the worker to another occu-pation (set of operations) Reassipmuent dces not necessarily involveretraining.
26, 27. Premiu Rates -- If the prenmi rates vary by job classification,list them on back of the sheet.
29. Vacation Periods - If vacation periods vary by department, list thedepartments and relevant periods.
- 65 -
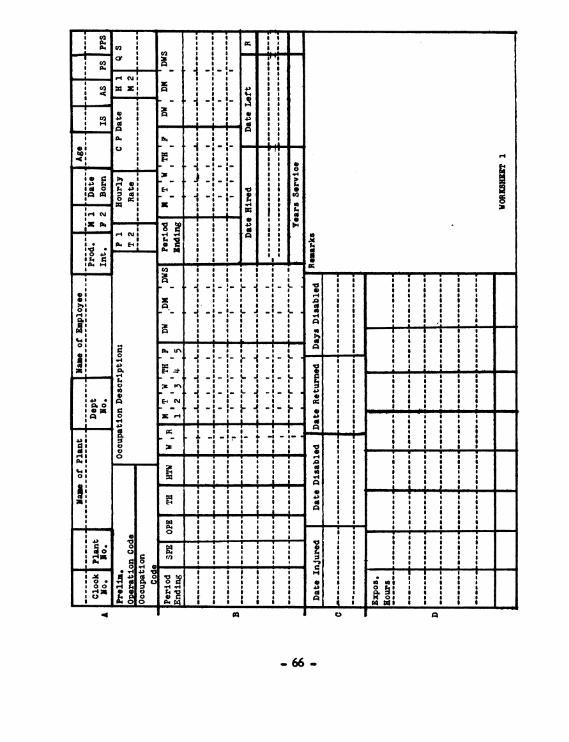
0:m
Sto

- -J-a-r-,-I-r-uJ1JT~~tIT~rTF1 - a
a a a a aa a a a a a a a a a 3~~~~~~~~~~~~~~~~~I 4
0 4 a a a a a a a
- ~ ~ ~ ~ ~ ~ ~ ~ ~ ~ ~ ~ ~ ~ ~ ~ ~ ~ -~~~~~~~~~~E
a a a a a a a a a a a ~~~~~~~~~~~~a,a. a a a
£4 4.
4 PI~~~~~~p~~aaP-3-b-*-S-*-~~~~~~~~~~~~~.4~~~~h~~~a~~ * S- 0
If 67 -

Instructions for Worksheets
Worksheet 1
Section A. Clock Number -- Record clock number listed an the worker's time-card,. If tis number differs from the number on the personnelrecords, note this in "Remarks" space.
Plant - Record plant code from questionnaire.
Iptf No.- Record departnt number as listed by the plant.If poit~does not number departments use arbitrary code, andrecord code on plant questionnaire.
Name of Employee - Record first and last name.
Production Interval - Using the following code record time periodfor Rhich production is measured.
1. - Week 2. - Two weeks 3. - Month
Sex - Indicate by 1 or 2 whether male or female.
Date Born Record number of month and last two digits of year ofbirths
Ag -- Do not fill in at plant unless convenient as a means ofs~Iecting sample.
IS))
AS) Do not fill in at plant.
PS)
MS - Pre Prod. le - Check if workers belong to a pre-lii 7 productivity sample group. Such a group consiste
of all piece-rate workers of the me sex perfonring thesame operations including at least one worker over 45 andone worker under 45 years of age. 76 groups which failto fulfill this condition do not take down productivitAinformation.
Prelimn Ration Code -- Where available, recordoperation number (a) as used by establishment. Otherwise,leave blank.
Occupation Code -- Do not fill in at plant.
- 68 -
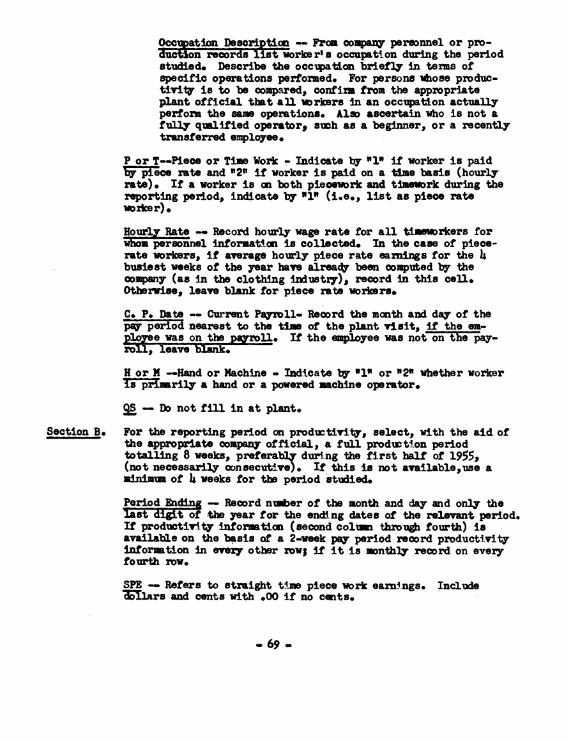
Occmation Desa tioan- From company personnel or pro-dion records listworker' a occupation during the periodstudied. Describe the occupation briefly in terms ofspecific operations performed. For persons whose produc-tivit1 is to be compared, confira from the appropriateplant official that all workers in an occupation actuallyperform the sanm operations. Alm ascertain who is not afully qualified operators such as a beginner, or a recentlytransferred employee.
P or T--Piece or Time Work - Indicate by "1" if worker is paidby piece rate and "2N if worker is paid on a time basis (hourlyrate). If a worker is on both piecework and timework during thereporting period, indicate by "1" (i.eo., list as piece rateworker).
Rate - Record hourly wage rate for all timewrkers forw personnel information is collected. In the cam of piece-
rate workers, if average hourly piece rate earnings for the 4busiest weeks of the year have already been computed by thecompany (as in the clothing industry), record in this cell.Otherwise, leave blank for piece rate workers.
C. P. Date -- Current Payroll. Record the month and day of thepay period nearest to the time of the plant visit, if the em-ploy was on the R!Mlol If the employee wasnotonthpay-roll, leaebnkH or N -Hand or Machine - Indicate by '1" or "2" whether workeris prizarily a hand or a powered machine operator.
QS -Do not fill in at plant.
Section B. For the reporting period on productivity, select, with the aid ofthe appropriate ompany official, a full production periodtotalling 8 weeks, preferably during the first half of 1955,(not necessarily consecutive)* If this is not available,use aminimu of 4 weeks for the period studied.
Period _~ Record numer of the month and day and only thelist digit of -the year for the ending dates of the relevant period.If productivity information (second colux throu& fourth) isavailable on the basis of a 2-week pay period record productivityinformation in every other row; if it is monthly record on everyfourth row.
SPE- Refers to straight time piece work earnIngs. IncludeTIlArs and cents with .00 if no cents.
- 69 _

OPE -- Refers to overtime piece work earnings. Do not adjust toitraight time levels. Where records have overtime earningsalready adjusted to straight time rates, indicate in "Remarks"space. Record both dollars and cents.
TH -- Refers to the total number of hours worked during the timepriod studied.
TW-W Hours on Time Work - Refers to the total number of hoursfor which the worker was paid on a time basis (hourly rate) duringthe period studied.
W and R - In plants which have, for individual workers, measuresof the quality of output indicate in the appropriate column thenumber of quality warnings (W) received and the number of rejects(R) charged to the worker. If another form of quality measure iskept by the plant indicate in "Remarks" spaces and if the infor-mation is quantitative, record it in the W and R columns adjustingthe titles.
Absenteeism - The remaining columns in section B relate toabsenteeism. Using the same 8-week full production period asused for productivity, record the weekday missed tn the appropri-ate cell. In most cases,these data wifl have to be obtained fromindividual employee timecard.
In addition to the 8-week full producti on period, select,with the aid of the appropriate company official, four other weeks(not necessarily consecutive) in which the plant was on a lessthan full production schedule.
Ms Ts Ws Th, F - Refer to the specific weekday missed by theworker dig the specified period. Record the code number ofthe day of the week the worker did not punch in. Note any dayfor which there is no entry on the timecard. If an individualpinched in on Saturday of any week, note this information in the"Remarks" space with the appropriate ending date of the period.
DW -- Refers to the number of days the employee worked or waspresent during the specified period.
£1)) Do not fill in at the plant.
DWS)
Date Hired -- Record original date hired and subsequent datesrehired from beginning of absentee period to time of plant visit.Include day, month, and year if available.
- 70 -

Date Left - Record all dates left (by days, month, and year), frombeginning of absenteeism period to time of plant visit.
R -- Refers to reason the worker left. Try to obtain reason foreach incident and indicate by the following coding:
Layoff 1 Retired - 4Quit - 2 Other - 5Discharge - 3
Years Service -- Do not fill in at plant.
Section C. Record only work-connected injuries. Data should be obtainedfrom workmen's compensation records, if possible. If theserecords are not available either at the plant or at an insurancecompany consult the records of the plant's first-aid station.
If possible, data on injuries and exposure hours should beobtained for a ain period of 2 years beginning 27 months priorto the date of the plant visit. Enter beginning and ending datesof time period for which exposure hours are recorded in the firstand last cells of the exposure hour space.
Note: All dates should be recorded in numerical form, e.g.:9-22-5. Do not write out the month, and record only the finaldigit of the year.
Date Disabled - Record date of beginning of disability. If sameas date of injury, enter "same.,
Date Returned - Record first date worked following disablement.tfthe-re is more than one continuous period of disablement re-
sulting from a single injury, enter starting and endIng dates foreach such period under "Date Disabled", and "Date Returned".
Eo. Days Disabled -- Leave blank.
Section D. This section is arranged to accomodate various methods plantsemploy to record individual employee's hours worked for longperiods. From appropriate plant records the data may be directlyavailable in annull, quarterly, monthly, or weekly totals.
If data are available in annual totals, xecord figures infirst and second cells of the bottom row;
in quarterly totals, record figures in cells of bottom row;
in monthly totals, record figures in adjacent six cells in eachcolumn leaving the bottom row blank;
-71 -

in weekly totalss, record figures in all cells with exception ofthose in bottom row.
For additional entries of weekly totals, use another worksheetrecording individual' s clock nambers plant number, and departmentnumber as well.
Worksheet No. 2
Section A of this worksheet should be used in place ofworksheet 1 (Row B) for recording information on piece-rateearn!ngs where individual production records are available ona daily basis rather than by pay period. Refer to instructionsfor Section B of worksheet 1.
Section B is to be used in those plants where there isreason to believe that the product mix for individual workersperforming the sam operations varies considerably. Record in-formation for one week of the 4-week production period dwingwhich earnings data are collected.
Operation Description and Model No.- Record specific operationsperformed and enter the model numbers assigned to each productworked upon. These numbers are wually available from productionrecords or from individual piece tickets.
Piece Rate and Standard Time -- Where piece rates are available,thg to the operations and models. In
addition to piece rates, record time standards, if available, forall jobs for which product mix data are obtained. Time standardsmy be expressed, for instance, as standard minutes per unit orstandard uits per minute. Enter time standards in column headedSTU and enter definition of taie standards in remarks space.
Qn Pruced -- For corresponding model numbers record theNiber of its produced during the production time period.Indicate the unit of measure in the cap after the word "mit.' Ifunit of measure is not uniform throughout the workshet, recorduits of measure in 'Remarks.'
Dates refer to one day.
Total Units )) Record only if directly available. Do not compute
Total N ) at the plant.Earnings )
Av ePie Rate - Do not fill in during plant visit.
- 7 - * U. S. GOVERNMENT PRINTING OFFICE: 19S6 0 - 403068
The Monthly Labor Review Covers the Entire Labor Field
Each issue of 120 or more pages contains factual,informed special articles on labor problems andlabor economics. In addition, these six depart-ments are regular features:
* The Labor Month in Review* Significant Decisions in Labor Cases* Chronology of Recent Labor Events* Developments in Industrial Relations* Book Reviews and Notes* Current Labor Statistics
An annual subscription to the Monthly Labor Re-view, including a yearly index, is $6.25 a year;$7.75 a year, foreign. Single copies may be pur-chased at 55 cents each.
Send orders (accompanied by check or money order) to the Superintendent of Documents, Washington25, D. C., or to any of the following Bureau of Labor Statistics regional offices341 9th Ave. 18 Oliver St. 105 West Adams St. 50 7th St., NE. 630 Sansome St.New York 1, N. Y. Boston 10, Mass. Chicago 3, III. Atlanta 23, Go. Son Francisco I 1, Calif.Price, 56.25 a yea 55 cents, single copies