jeffrey l. ezell - georgia · pdf filedear mr. potvin: enclosed is the "georgia...
TRANSCRIPT

April 21, 2016
Mr. James A. Potvin Executive Director Georgia Legislative Retirement System Two Northside 75, Suite 300 Atlanta, GA 30318-7701
Dear Mr. Potvin:
Enclosed is the "Georgia Legislative Retirement System Report of the Actuary on the Valuation Prepared as of June 30, 2015".
The valuation indicates that no employer contribution for the fiscal year ending June 30, 2018 is required to support the benefits of the System.
Please let us know if there are any questions concerning the report.
Sincerely yours,
Edward A. Macdonald, ASA, FCA, MAAA Cathy Turcot President Principal and Managing Director
Edward J. Koebel, EA, FCA, MAAA Principal and Consulting Actuary
Enclosure S:\Georgia Legislative\Pension\Valuation\2015\Valuation GA LRS Report Template.docx
Off
Cavanaugh Macdonald CC OO NN SS UU LL TT II NN GG,, LL LL CC
The experience and dedication you deserve
3550 Busbee Pkwy, Suite 250, Kennesaw, GA 30144Phone (678) 388-1700 • Fax (678) 388-1730
www.CavMacConsulting.com Offices in Englewood, CO • Kennesaw, GA • Bellevue, NE

GEORGIA LEGISLATIVE RETIREMENT SYSTEM
REPORT OF THE ACTUARY ON THE VALUATION PREPARED AS OF JUNE 30, 2015

April 21, 2016
Board of Trustees Legislative Retirement System of Georgia Two Northside 75, Suite 300 Atlanta, GA 30318-7701
Attention: Mr. James Potvin, Executive Director
Members of the Board:
Section 47-6-22 of the law governing the operation of the Georgia Legislative Retirement System provides that the actuary shall make periodic valuations of the contingent assets and liabilities of the Retirement System on the basis of regular interest and the tables last adopted by the Board of Trustees. We have submitted the report giving the results of the actuarial valuation of the System prepared as of June 30, 2015. The report indicates that no annual employer contributions for the fiscal year ending June 30, 2018 are required to support the benefits of the System.
Since the previous valuation, various assumptions and methods have been revised to reflect the results of the experience investigation for the five-year period ending June 30, 2014. In addition, the results of the valuation reflect that the Board did not grant the anticipated cost-of-living increases (COLAs) to retired members on July 1, 2015 and on January 1, 2016.
In preparing the valuation, the actuary relied on data provided by the System. While not verifying data at the source, the actuary performed tests for consistency and reasonableness. Our firm, as actuary, is responsible for all of the actuarial trend data in the financial section of the annual report and the supporting schedules in the actuarial section of the annual report.
In our opinion, the valuation is complete and accurate, and the methodology and assumptions are reasonable as a basis for the valuation. The valuation takes into account the effect of all amendments to the System enacted through the 2015 session of the General Assembly.
The System is funded on an actuarial reserve basis. The actuarial assumptions recommended by the actuary and adopted by the Board are in the aggregate reasonably related to the experience under the System and to reasonable expectations of anticipated experience under the System. The assumptions and methods used for financial reporting purposes meet the parameters set by Actuarial Standards of Practice (ASOPs). The funding objective of the plan is that contribution rates over time will remain level as a dollar per active member. The valuation method used is the entry age normal cost method. The normal contribution rate to cover current cost has been determined as a level dollar per active member. Gains and losses are reflected in the total unfunded accrued liability which is negative and being amortized as a level dollar per active member in accordance with the funding policy adopted by the Board.
The Plan and the employers are required to comply with the financial reporting requirements of GASB Statements No. 67 and 68. The necessary disclosure information is provided in separate supplemental reports.
Off
Cavanaugh Macdonald CC OO NN SS UU LL TT II NN GG,, LL LL CC
The experience and dedication you deserve
3550 Busbee Pkwy, Suite 250, Kennesaw, GA 30144Phone (678) 388-1700 • Fax (678) 388-1730
www.CavMacConsulting.com Offices in Englewood, CO • Kennesaw, GA • Bellevue, NE

April 21, 2016 Board of Trustees Page 2
We have provided the following information and supporting schedules for the Actuarial Section of the Comprehensive Annual Financial Report:
Summary of Actuarial Assumptions Schedule of Active Members Schedule of Funding Progress Schedule of Retirees Added to and Removed from Rolls Analysis of Change in Unfunded Accrued Liability Solvency Test Results
The System is being funded in conformity with the minimum funding standard set forth in Code Section 47-20-10 of the Public Retirement Systems Standards Law and the funding policy adopted by the Board. In our opinion the System is operating on an actuarially sound basis. Assuming that contributions to the System are made by the employer from year to year in the future at the rates recommended on the basis of the successive actuarial valuations, the continued sufficiency of the retirement fund to provide the benefits called for under the System may be safely anticipated.
This is to certify that the independent consulting actuary is a member of the American Academy of Actuaries and has experience in performing valuations for public retirement systems, that the valuation was prepared in accordance with principles of practice prescribed by the Actuarial Standards Board, and that the actuarial calculations were performed by qualified actuaries in accordance with accepted actuarial procedures, based on the current provisions of the retirement system and on actuarial assumptions that are internally consistent and reasonably based on the actual experience of the System.
Future actuarial results may differ significantly from the current results presented in this report due to such factors as the following: plan experience differing from that anticipated by the economic or demographic assumptions; changes in economic or demographic assumptions; increases or decreases expected as part of the natural operation of the methodology used for these measurements (such as the end of an amortization period or additional cost or contribution requirements based on the plan’s funded status); and changes in plan provisions or applicable law. Since the potential impact of such factors is outside the scope of a normal annual actuarial valuation, an analysis of the range of results is not presented herein.
Sincerely yours,
Edward A. Macdonald, ASA, FCA, MAAA Cathy Turcot President Principal and Managing Director
Edward J. Koebel, EA, FCA, MAAA Principal and Consulting Actuary

TABLE OF CONTENTS
Section Item Page No.
I Summary of Principal Results 1
II Membership 3
III Assets 4
IV Comments on Valuation 5
V Contributions Payable by Employers 7
VI Accounting Information 8
VII Experience 10
Schedule
A Valuation Balance Sheet 12
B Development of the Actuarial Value of Assets 13
C Summary of Receipts and Disbursements 14
D Outline of Actuarial Assumptions and Methods 15
E Actuarial Cost Method 17
F Board Funding Policy 18
G Amortization of UAAL 20
H Summary of Main Plan Provisions as Interpreted for Valuation Purposes 23
I Tables of Membership Data 25
J CAFR Schedules 28

Page 1
GEORGIA LEGISLATIVE RETIREMENT SYSTEM REPORT OF THE ACTUARY
ON THE VALUATION PREPARED AS OF JUNE 30, 2015
SECTION I - SUMMARY OF PRINCIPAL RESULTS
1. For convenience of reference, the principal results of the valuation and a comparison with the
preceding year's results are summarized below:
Valuation Date June 30, 2015 June 30, 2014
Number of active members: 218 222 Retired members and beneficiaries:
Number Annual allowances
260 $ 1,777,998
259 $ 1,803,348
Deferred Vested Members: Number Annual allowances
82 $ 402,620
74 $ 364,244
Assets: Market Value $ 32,359,000 $ 32,794,000 Actuarial Value 31,635,000 30,538,000
Unfunded actuarial accrued liability $ (5,944,730) $ (5,624,763)
Amortization period (years) N/A* N/A* Funded Ratio 123.1% 122.6%
For Fiscal Year Ending June 30, 2018 June 30, 2017
Total Normal Cost** Less Member Contributions
$ 708,721 319,929
$ 571,256 327,238
Employer Paid Normal Cost** $ 388,792 $ 244,018
Actuarially Determined Employer Contribution Rates (ADEC): Normal** Accrued liability
$ 388,792 (388,792)
$ 244,018 (244,018)
Total $ 0 $ 0
Employer contribution rate per active member: Normal** Accrued liability
$ 1,783.45 (1,783.45)
$ 1,099.18 (1,099.18)
Total $ 0.00 $ 0.00
* If the unfunded actuarial accrued liability is amortized in accordance with the Board’s funding policy, the ADEC is less than $0, which is not allowed under the funding policy. Therefore, the accrued liability contribution has been set to such that the total ADEC equals $0.
** Estimated budgeted administrative expenses are included in the normal contribution.

Page 2
2. The major benefit and contribution provisions of the System as reflected in the valuation are
summarized in Schedule H. The valuation takes into account the effect of amendments of the System
enacted through the 2015 session of the General Assembly. The valuation reflects that the Board
did not grant the anticipated cost-of-living increases July 1, 2015 and January 1, 2016.
3. Since the previous valuation, various assumptions and methods have been revised to reflect the
results of the experience investigation for the five-year period ending June 30, 2014. These revised
assumptions were adopted by the Board on December 17, 2015 and are summarized below.
Schedule D of this report outlines the full set of actuarial assumptions and methods used to prepare
the current valuation. The Board Funding Policy is shown in Schedule F.
Summary of Assumptions and Methods
Economic Assumptions Price Inflation Lowered assumption from 3.00% to 2.75%. Investment Return (net of investment expenses) No changes to assumed rate of 7.50%.
Demographic Assumptions
Withdrawal Changed assumed rates. Disability Changed assumed rates. Retirement Changed assumed rates. Mortality Changed assumed rates.
Other Actuarial Methods and Assumptions Administrative Expenses No change to current method. Amortization Method No change to current method. Asset Smoothing No change to current method. Option Factors Changed option factors to reflect change in
mortality rate table. All others No change to other actuarial methods.
4. The entry age actuarial cost method was used to prepare the valuation. Schedule E contains a brief
description of this method.
5. Comments on the valuation results as of June 30, 2015 are given in Section IV, and further discussion
of the contributions is set out in Section V.

Page 3
6. We have prepared the Solvency Test and Schedule of Retirants Added to and Removed from the
Rolls for the System’s Comprehensive Annual Financial Report. These tables are shown in
Schedule J.
SECTION II - MEMBERSHIP
1. Data regarding the membership of the System for use as a basis of the valuation were furnished by
the Retirement System office. The valuation included 218 active members.
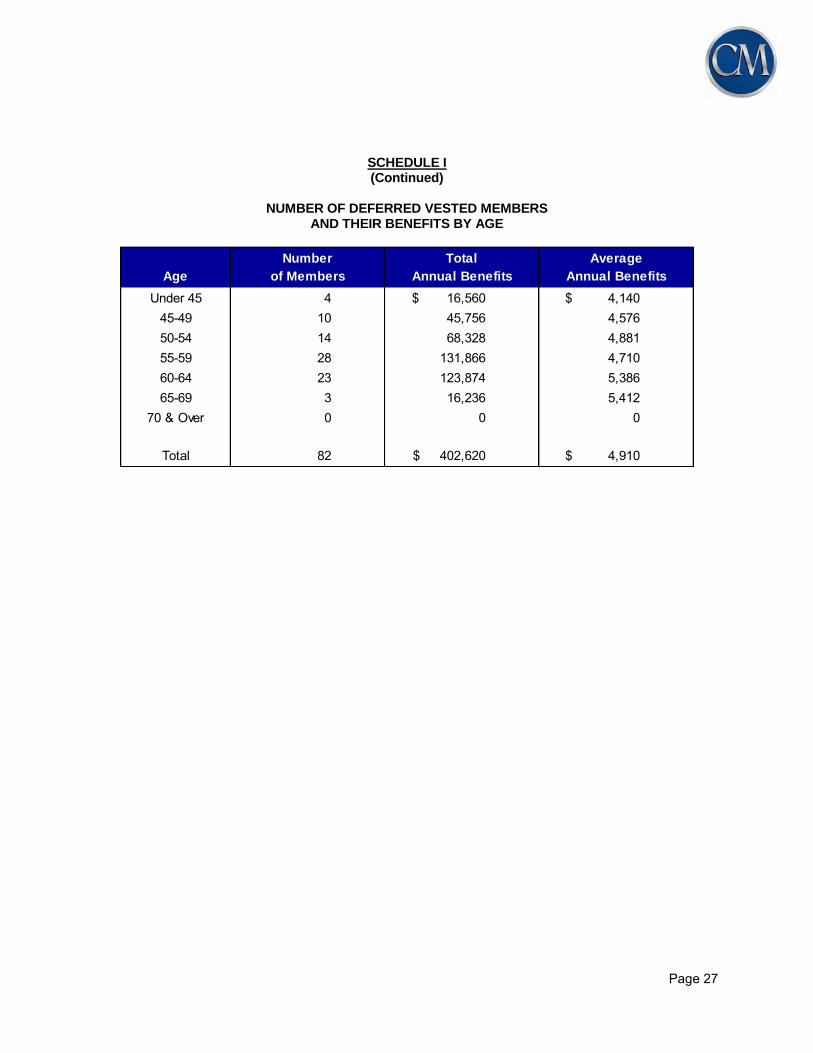
2. Data was provided by the Retirement System for inactive members who are eligible for deferred
vested benefits. The valuation included 82 deferred vested members with annual allowances totaling
$402,620. In addition, there are 76 inactive non-vested members included in the valuation entitled
to a refund of member contributions.
3. The following table shows the number of retired members and beneficiaries on the roll as of
June 30, 2015, together with the amount of their annual allowances payable under the System as of
that date.
THE NUMBER AND ANNUAL RETIREMENT ALLOWANCES OF RETIRED MEMBERS AND BENEFICIARIES ON THE ROLL
AS OF JUNE 30, 2015
GROUP
NUMBER
ANNUAL RETIREMENT
ALLOWANCES
Service Retirements 198 $ 1,355,631
Disability Retirements 0 0
Beneficiaries of Deceased Members 62 422,367
Total 260 $ 1,777,998

Page 4
SECTION III - ASSETS
1. The retirement law provides for the maintenance of two funds for the purpose of recording the
financial transactions of the System; namely, the Annuity Savings Fund and the Pension
Accumulation Fund.
(a) Annuity Savings Fund The Annuity Savings Fund is the fund to which are credited all contributions made
by members together with regular interest thereon. When a member retires, or if a death benefit allowance becomes payable to his beneficiary, his accumulated contributions are transferred from the Annuity Savings Fund to the Pension Accumulation Fund. The portion of the allowance which these contributions provide is then paid from the Pension Accumulation Fund. On June 30, 2015 the value of assets credited to the Annuity Savings Fund amounted to $4,857,000.
(b) Pension Accumulation Fund
The Pension Accumulation Fund is the fund to which all income from investments
and all contributions made by employers of members of the System and by the State for members of local retirement funds are credited. All retirement allowance and death benefit allowance payments are disbursed from this fund. Upon the retirement of a member, or upon his death if a death benefit allowance is payable, his accumulated contributions are transferred from the Annuity Savings Fund to this fund to provide the member-contributed portion of the allowance. On June 30, 2015 the market value of assets credited to the Pension Accumulation Fund amounted to $27,503,000.
2. As of June 30, 2015, the total market value of assets amounted to $32,360,000 as reported by the
Auditor of the System. The actuarial value of assets used for the current valuation was determined
to be $31,635,000 based on a five-year smoothing of investment gains and losses. Schedule B
shows the development of the actuarial value of assets as of June 30, 2015.
3. Schedule C shows receipts and disbursements of the System for the two years preceding the
valuation date and a reconciliation of the fund balances at market value.

Page 5
SECTION IV – COMMENTS ON VALUATION
1. Schedule A of this report contains the valuation balance sheet which shows the present and
prospective assets and liabilities of the System as of June 30, 2015. The valuation was prepared
in accordance with the actuarial assumptions and methods set forth in Schedule D and the actuarial
cost method which is described in Schedule E.
2. The valuation balance sheet shows that the System has total prospective liabilities of $27,451,396,
of which $19,872,888 is for the prospective benefits payable on account of present retired
members, beneficiaries of deceased members, and members entitled to deferred vested benefits,
and $7,578,508 is for the prospective benefits payable on account of present active members.
Against these liabilities, the System has total present assets for valuation purposes of $31,635,000
as of June 30, 2015. The difference of ($4,183,604) between the total liabilities and the total
present assets represents the present value of contributions to be made in the future. Of this
amount, $1,705,413 is the present value of future contributions expected to be made by or on
behalf of members, and the balance of ($5,889,017) represents the present value of future
contributions payable by the employers to the Pension Accumulation Fund.
3. The employer’s contributions to the System consist of normal contributions and accrued liability
contributions. The valuation indicates that annual employer normal contributions at the rate of $42.25
per active member are required to provide the currently accruing benefits of the System.
4. Prospective normal contributions at the rate of $42.25 have a present value of $55,713. When this
amount is subtracted from ($5,889,017), which is the present value of the total future contributions to
be made by the employers, the result is a prospective unfunded actuarial accrued liability of
($5,944,730).
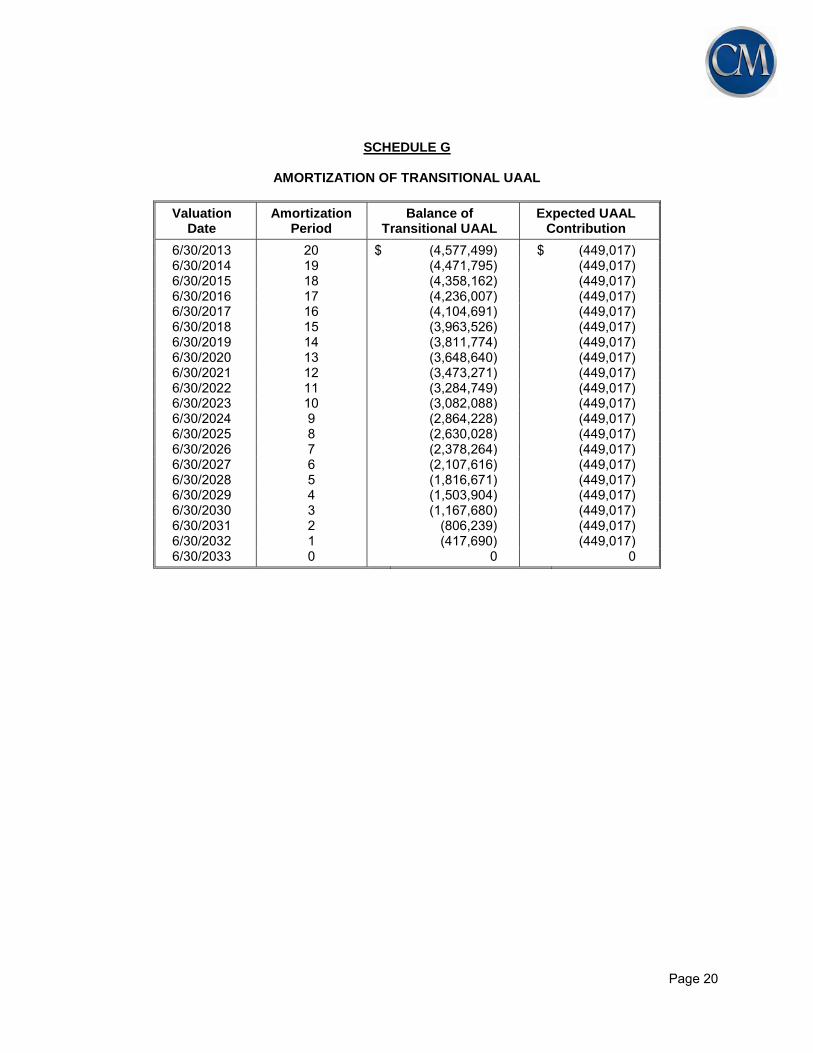
5. The funding policy adopted by the Board, as shown in Schedule F, provides that the unfunded
actuarial accrued liability as of June 30, 2013 (Transitional UAAL) will be amortized as a level dollar
amount over a closed 20-year period. In each subsequent valuation all benefit changes, assumption
and method changes and experience gains and/or losses that have occurred since the previous

Page 6
valuation will determine a New Incremental UAAL. Each New Incremental UAAL will be amortized
as a level dollar amount over a closed 20-year period from the date it is established.
6. The total UAAL contribution is $(607,258), determined in accordance with the Board’s funding policy.
However, since this payment would cause the total employer contribution to be less than $0, the final
UAAL contribution is determined to be $(388,792).
7. Schedule G of this report shows the amortization schedules for the Transitional UAAL and New
Incremental UAALs.
8. The following table shows the components of the total UAAL and the derivation of the UAAL
contribution rate in accordance with the funding policy:
TOTAL UAAL AND UAAL CONTRIBUTION RATE
Amortization Amortization
UAAL Period (years) Payment
Transitional $(4,358,162) 18 $(449,017) New Incremental 6/30/2014 (1,126,343) 19 (113,097) New Incremental 6/30/2015 (460,224) 20 (45,144) Total UAAL ($5,944,730) $(607,258) Final Amortization Payment $(388,792) Blended Amortization Period N/A*
* If the unfunded actuarial accrued liability is amortized in accordance with the Board’s funding policy, the ADEC is less than $0, which is not allowed under the funding policy. Therefore, the accrued liability contribution has been set to such that the total ADEC equals $0.

Page 7
SECTION V – CONTRIBUTIONS PAYABLE BY EMPLOYERS
1. The contributions of employers consist of a normal contribution and an accrued liability contribution
as determined by actuarial valuation.
2. The normal contribution rate is calculated as the level dollar which, if applied to each member during
the entire period of his anticipated covered service, would be required in addition to the contributions
of the member to meet the cost of all benefits payable on his behalf. On the basis of the valuation,
the normal contribution rate was determined to be $42.25 per active member, or $9,211 based on
218 active members as of June 30, 2015.
3. An additional contribution of $379,581, or $1,741.20 per active member, is required for administrative
expenses for the fiscal year ending June 30, 2018.
4. The total normal contribution including administrative expenses is, therefore, $388,792, or $1,783.45
per active member.
5. If the unfunded accrued liability is amortized in accordance with the funding policy, the employer
contribution would be less than $0. Since the funding policy also states that the employer contribution
cannot be less than $0, the accrued liability contribution has been adjusted accordingly.
The annual accrued liability contribution determined by the June 30, 2015 valuation is, therefore,
($388,792), or ($1,783.45) per active member.
6. The following table summarizes the employer contribution rates which were determined by the
June 30, 2015 valuation and are recommended for use.
ACTUARIALLY DETERMINED EMPLOYER CONTRIBUTION RATES (ADEC) FOR FISCAL YEAR ENDING JUNE 30, 2018
CONTRIBUTION
PER ACTIVE
MEMBER
ANNUAL
AMOUNT
Normal $ 1,783.45 $ 388,792 Accrued Liability (1,783.45) (388,792) Total $ 0.00 $ 0

Page 8
SECTION VI – ACCOUNTING INFORMATION
The information required under the Governmental Accounting Standards Board (GASB) Statements No. 67
and 68 will be issued in separate reports. The following information is provided for informational purposes
only.
1. The following is a distribution of the number of employees by type of membership.
NUMBER OF ACTIVE AND RETIRED MEMBERS AS OF JUNE 30, 2015
GROUP NUMBER
Retirees and beneficiaries currently receiving benefits
260
Terminated employees entitled to benefits but not yet receiving benefits
158
Active plan members 218 Total 636
2. Another such item is the schedule of funding progress as shown below.
SCHEDULE OF FUNDING PROGRESS
Actuarial Actuarial Accrued Unfunded UAAL as a
Actuarial Value of Liability (AAL) AAL Funded Covered Percentage of Valuation Assets - Entry Age* (UAAL) Ratio Payroll Covered Payroll
Date ( a ) ( b ) ( b – a ) ( a / b ) ( c ) ( ( b – a ) / c )
6/30/2010 $ 29,581,000 $ 25,002,906 $(4,578,095) 118.3% $ 3,745,803 (122.2)% 6/30/2011 29,278,000 25,244,775 (4,033,225) 116.0 3,780,486 (106.7) 6/30/2012 28,990,000 24,965,602 (4,024,398) 116.1 3,815,170 (105.5) 6/30/2013 29,481,000 24,903,501 (4,577,499) 118.4 3,867,195 (118.4) 6/30/2014 30,538,000 24,913,237 (5,624,763) 122.6 3,849,853 (146.1) 6/30/2015 31,635,000 25,690,270 (5,944,730) 123.1 3,763,866 (157.9)

Page 9
3. The following shows the schedule of employer contributions.
Year Ending
Annual Required Contribution
Amount Contributed
Percentage Contributed
6/30/2010 $ 0 $ 75,000 N/A 6/30/2011 0 75,000 N/A 6/30/2012 0 76,000 N/A 6/30/2013 0 128,000 N/A 6/30/2014 0 45,000 N/A 6/30/2015
0 0 N/A
4. The information presented in the required supplementary schedules was determined as part of
the actuarial valuation at June 30, 2015. Additional information as of the latest actuarial valuation
follows.
Valuation date 6/30/2015
Actuarial cost method Entry age Amortization method Level dollar, open
Remaining amortization period N/A* Asset valuation method 5-year smoothed market
Actuarial assumptions: Investment rate of return** 7.50% Projected salary increases** N/A Cost-of-living adjustments 3.00% Annually
*The remaining amortization period is infinite. **Includes inflation at 2.75%

Page 10
SECTION VII – EXPERIENCE
1. Section 47-6-22 of the act governing the operation of the System provides that as an aid to the
Board in adopting service and mortality tables, the actuary will prepare an experience investigation
at least once in each five-year period. The last experience investigation was prepared for the five-
year period ending June 30, 2014, and based on the results of the investigation, various
assumptions and methods were revised and adopted by the Board on December 17, 2015. The
next experience investigation will be prepared for the period July 1, 2014 through June 30, 2019.
2. The following table shows the estimated gain or loss from various factors that resulted in a decrease
of $319,967 in the unfunded actuarial accrued liability (UAAL) from ($5,624,763) to ($5,944,730)
during the fiscal year ending June 30, 2015.
3. The most significant item contributing to the $320.0 thousand decrease in the UAAL was a $491.6
thousand gain due to greater than expected investment return on actuarial value of assets.
Although the market value return for the fiscal year ending June 30, 2015 was lower than the assumed
rate of 7.50%, the return on the actuarial value of assets was 9.15% due to the smoothing of
investment gains and losses over a 5-year period. In addition, there was a gain of $452.6 thousand
due to the assumed COLAs not being granted July 1, 2015 or January 1, 2016. There were small
gains in mortality and turnover and retirements as well. The assumption changes due to the
experience study increased the UAAL approximately $852 thousand.

Page 11
ANALYSIS OF THE CHANGE IN UNFUNDED ACTUARIAL ACCRUED LIABILITY (in thousands of dollars)
ITEM
AMOUNT OF INCREASE/
(DECREASE)
Interest (7.50%) added to previous UAAL $ (421.9) Accrued liability contribution 173.4
Experience: Valuation asset growth Pensioners' mortality Turnover and retirements New entrants Method changes Amendments No 7/1/15, 1/1/16 COLAs Assumption changes Miscellaneous changes
(491.6) (50.8) (10.1) 35.1 0.0 0.0 (452.6) 852.3 46.2
Total
$ (320.0)

Page 12
SCHEDULE A
VALUATION BALANCE SHEET SHOWING THE PRESENT AND PROSPECTIVE ASSETS AND LIABILITIES OF
THE GEORGIA LEGISLATIVE RETIREMENT SYSTEM AS OF JUNE 30, 2015
ACTUARIAL LIABILITIES
(1) Present value of prospective benefits payable on account of present retired members, beneficiaries of deceased members, and members entitled to deferred vested benefits
- Service and disability benefits $ 12,744,502 - Death and survivor benefits 3,184,903 - Deferred vested benefits 3,943,483 Total $ 19,872,888 (2) Present value of prospective benefits payable on account
of present active members
7,578,508 (3) TOTAL ACTUARIAL LIABILITIES $ 27,451,396
PRESENT AND PROSPECTIVE ASSETS (4) Actuarial value of assets $ 31,635,000 (5) Present value of total future contributions = (3)-(4) $ (4,183,604) (6) Present value of future member contributions 1,705,413 (7) Present value of future employer contributions = (5)-(6) $ (5,889,017) (8) Prospective normal contributions 55,713 (9) Prospective unfunded actuarial accrued liability
contributions = (7)-(8)
(5,944,730) (10) TOTAL PRESENT AND PROSPECTIVE ASSETS $ 27,451,396

Page 13
SCHEDULE B
DEVELOPMENT OF ACTUARIAL VALUE OF ASSETS
(1) Actuarial Value Beginning of Year
$ 30,538,000
(2) Market Value End of Year $ 32,360,000 (3) Market Value Beginning of Year $ 32,794,000 (4) Cash Flow (a) Contributions $ 327,000 (b) Benefit Payments (1,782,000) (c) Administrative Expenses (169,000) (d) Investment Expenses (13,000) (e) Net: (4)(a) + (4)(b) + (4)(c) + (4)(d) $ (1,637,000) (5) Investment Income (a) Market Total: (2) – (3) – (4)(e) $ 1,203,000 (b) Assumed Rate 7.50% (c) Amount for Immediate Recognition: [(3) x (5)(b)] + [{(4)(a) + (4)(b) + (4)(c)} x (5)(b) x 0.5] – (4)(d)
$ 2,412,000
(d) Amount for Phased-In Recognition: (5)(a) – (5)(c) (1,209,000) (6) Phased-In Recognition of Investment Income (a) Current Year: (5)(d) / 5 $ (242,000) (b) First Prior Year 564,000 (c) Second Prior Year 0 (d) Third Prior Year 0 (e) Fourth Prior Year 0 (f) Total Recognized Investment Gain $ 322,000 (7) Actuarial Value End of Year: (1) + (4)(e) + (5)(c) + (6)(f) $ 31,635,000 (8) Difference Between Market & Actuarial Values: (2) – (8) $ 725,000 (9) Rate of Return on Actuarial Value 9.15%

Page 14
SCHEDULE C
SUMMARY OF RECEIPTS AND DISBURSEMENTS (Market Value)
YEAR ENDING
Receipts for the Year June 30, 2015
($1,000’s)
June 30, 2014
($1,000’s)
Contributions: Members Nonemployer Employer
$ 327 0 0
$ 282 0
45
Subtotal
Investment Earnings
TOTAL
$ 327
1,189
$ 1,516
$ 327
4,969
$ 5,296
Disbursements for the Year
Benefit Payments
Refunds to Members
Administrative Expenses
TOTAL
$ 1,756
26
169
$ 1,951
$ 1,801
30
152
$ 1,983
Excess of Receipts over Disbursements $ (435) $ 3,313
Reconciliation of Asset Balances
Asset Balance as of the Beginning of Year
Excess of Receipts over Disbursements
Asset Balance as of the End of Year
Rate of Return
$ 32,794
(435)
$ 32,359
3.72%
$ 29,481
3,313
$ 32,794
17.34%

Page 15
SCHEDULE D
OUTLINE OF ACTUARIAL ASSUMPTIONS AND METHODS
Adopted by the Board December 17, 2015. VALUATION INTEREST RATE: 7.50% per annum, compounded annually, net of investment expenses, composed of a 2.75% inflation assumption and a 4.75% real rate of investment return assumption. SALARY INCREASES: None. SEPARATIONS BEFORE SERVICE RETIREMENT: Representative values of the assumed annual rates of separation before service retirement are as follows:
Annual Rates of
Age Withdrawal Death
Men Women 20 25 30 35 40 45 50 55 60 65
8.0% 8.0 8.0 8.0 8.0 8.5 8.5 9.0 9.0 9.0
.032%
.035
.041
.072
.100
.140
.198
.281
.409
.560
.018%
.019
.025
.044
.066
.104
.156
.223
.306
.430 SERVICE RETIREMENT: The assumed annual rates of retirement are shown below:
Age Annual Rate Age Annual Rate
60 61 62 63 64 65
10% 10% 15% 10% 10% 12%
66 67 68 69
70-74 75
12% 15% 12% 12% 20% 100%
DEATHS AFTER RETIREMENT: Since the System has minimal post-retirement mortality experience, the System uses the same mortality tables used for the Employees’ Retirement System of Georgia. The RP-2000 Combined Mortality Table projected to 2025 with projection scale BB and set forward 2 years for both males and females is used for the period after service retirement and for dependent beneficiaries. Since there are no disability retirements in the System, there are no disability mortality rates utilized at this time. There is a margin for future mortality improvement in the tables used by the System. Based on the results of the most recent experience study adopted by the Board on December 17, 2015, the numbers of expected future deaths are 9-12% less than the actual number of deaths that occurred during the study period for healthy retirees.

Page 16
Representative values of the assumed annual rates of mortality after service retirement are as follows:
Age Men Women Age Men Women
40 45 50 55 60
.113%
.161
.247
.425
.699
.079%
.123
.187
.292
.492
65 70 75 80 85
1.130% 1.870 3.215 5.516 9.563
.899% 1.528 2.522 4.163 7.124
ADMINISTRATIVE EXPENSES: Budgeted administrative expenses for the fiscal year are added to the normal cost. AMORTIZATION METHOD: Level dollar amortization. ASSET METHOD: The actuarial value of assets, as developed in Schedule B. The actuarial value of assets recognizes a portion of the difference between the market value of assets and the expected value of assets, based on the assumed valuation rate of return. The actuarial value was set equal to the market value as of June 30, 2013. The amount recognized each year beginning June 30, 2014 will be 20% of the difference between market value and expected actuarial value COST-OF-LIVING ALLOWANCE (COLA): 1.5% semi-annually. PERCENT MARRIED: 90% of active members are assumed to be married with the male three years older than his spouse. VALUATION METHOD: Entry age actuarial cost method. See Schedule E for a brief description of this method.

Page 17
SCHEDULE E
ACTUARIAL COST METHOD 1. The valuation is prepared on the projected benefit basis, under which the present value, at the interest
rate assumed to be earned in the future (currently 7.50%), of each member's expected benefits at
retirement or death is determined, based on age, service and sex. The calculations take into account
the probability of a member's death or termination of employment prior to becoming eligible for a
benefit, as well as the possibility of his terminating with a service, disability or survivor's benefit. The
present value of the expected benefits payable on account of the active members is added to the
present value of the expected future payments to retired members, beneficiaries and members
entitled to deferred vested benefits to obtain the present value of all expected benefits payable from
the System on account of the present group of members and beneficiaries.
2. The employer contributions required to support the benefits of the System are determined following
a level funding approach, and consist of a normal contribution and an unfunded actuarial accrued
liability contribution.
3. The normal contribution is determined using the entry age actuarial cost method. Under this method,
a calculation is made to determine the level amount which, if applied for the average member during
the entire period of his anticipated covered service, would be required in addition to the contributions
of the member to meet the cost of all benefits payable on his behalf.
4. The unfunded actuarial accrued liability contributions are determined by subtracting the present value
of prospective employer normal contributions and member contributions, together with the current
actuarial value of assets, from the present value of expected benefits to be paid from the System.

Page 18
SCHEDULE F
FUNDING POLICY OF THE LRS BOARD OF TRUSTEES
The purpose of this Funding Policy is to state the overall objectives for the Georgia Legislative Retirement System (System), the benchmarks that will be used to measure progress in achieving those goals, and the methods and assumptions that will be employed to develop the benchmarks. It is the intent of the LRS Board of Trustees that the Funding Policy outlined herein will remain unchanged until the objectives below are met. I. Funding Objectives The goal in requiring employer and member contributions to the System is to accumulate sufficient assets during a member’s employment to fully finance the benefits the member is expected to receive throughout retirement. In meeting this objective, the System will strive to meet the following funding objectives:
To develop a pattern of contributions expressed as both a total dollar amount and as a dollar amount per active member and measured by valuations prepared in accordance with applicable State laws and the principles of practice prescribed by the Actuarial Standards Board.
To maintain a stable funded ratio (ratio of actuarial value of assets to actuarial accrued liabilities) that reflects a trend of strong actuarial condition. The long-term objective is to maintain a 100% funded ratio; in the event that the funded ratio falls below 100%, the objective will be to obtain a 100% funded ratio over a reasonable period of future years.
To maintain adequate asset levels to finance the benefits promised to members and monitor the future demand for liquidity.
To promote intergenerational equity for taxpayers with respect to contributions required for the benefits provided by the System.
II. Measures of Funding Progress To track progress in achieving the System’s funding objectives, the following measures will be determined annually as of the actuarial valuation date (with due recognition that a single year’s results may not be indicative of long-term trends):
Funded Ratio – The funded ratio, defined as the actuarial value of assets divided by the actuarial accrued liability, should increase over time, before adjustments for changes in benefits, actuarial methods, and/or actuarial adjustments. The target funded ratio will be 100 percent. In the event that the funded ratio falls below 100%, the targeted funded ratio will be 100% within 20 years of the date the funded ratio first falls below 100%.
Unfunded Actuarial Accrued Liability (UAAL) o Transitional UAAL – The UAAL established as of the initial valuation date for which this
funding policy is adopted shall be known as the Transitional UAAL. o New Incremental UAAL – Each subsequent valuation will produce a New Incremental
UAAL consisting of all benefit changes, assumption and method changes and experience gains and/or losses that have occurred since the previous valuations.
UAAL Amortization Period o The transitional UAAL will be amortized over a closed 20 year period beginning on the
initial valuation date for which this funding policy is adopted. o Each New Incremental UAAL shall be amortized over a closed 20 year period beginning
with the year it is incurred. Employer Contributions
o Employer Normal Contributions – the contribution determined as of the valuation date each year to fund the employer portion of the annual normal cost of the System based on the assumptions and methods adopted by the Board.

Page 19
o In each valuation subsequent to the adoption of this funding policy the required employer contributions will be determined as the summation of the employer Normal Contribution, a contribution for administrative expenses, the amortization cost for the Transitional UAAL and the individual amortization cost for each of the New Incremental UAAL bases.
o Employer Contributions will be expressed as both a total dollar amount and as a dollar amount per active member. In no event shall the employer contributions be less than $0.
o The valuation methodology, including the amortization of the Unfunded Actuarial Accrued Liability (UAAL), would be expected to maintain reasonably stable contributions as a dollar per active member.
o In no event will the employer contribution as determined above be less than $0. III. Methods and Assumptions The annual actuarial valuations providing the measures to assess funding progress will utilize the actuarial methods and assumptions last adopted by the Board based upon the advice and recommendations of the actuary. These include the following primary methods and assumptions:
The actuarial cost method used to develop the benchmarks will be the Entry Age Normal (EAN) actuarial cost method.
The long-term annual investment rate of return assumption will be 7.50% net of investment expenses.
The actuarial value of assets will be determined by recognizing the annual differences between actual and expected market value of assets over a five-year period, beginning with the June 30, 2013 actuarial valuation.
o Prior to the June 30, 2013 valuation, the differences between actual and expected market value of assets were recognized over a seven-year period. For the June 30, 2013 valuation, all then-current deferred gains and losses will be recognized immediately, and the initial new five-year period will begin immediately thereafter.
The employer contribution rates determined in an annual actuarial valuation will be at least sufficient to satisfy the annual normal cost of the System and amortize the UAAL as a level dollar amount over a period not to exceed 20 years (for the UAAL as of the June 30, 2013 valuation date, and for each successive year of gains and losses incurred in years following the June 30, 2013 valuation date). However in no event shall the employer contributions be less than $0. The actuary shall conduct an investigation into the System’s experience at least every five years and utilize the results of the investigation to form the basis for recommended assumptions and methods. Any changes to the recommended assumptions and methods that are approved by the Board will be reflected in this Policy. IV. Funding Policy Progress The Board will periodically have actuarial projections of the valuation results performed to assess the current and expected future progress towards the overall funding goals of the System. These periodic projections will provide the expected valuation results over at least a 30-year period. The projected measures of funding progress and the recent historical trend provided in valuations will provide important information for the Board’s assessment of the System’s funding progress.
Page 20
SCHEDULE G
AMORTIZATION OF TRANSITIONAL UAAL
Valuation Date
Amortization Period
Balance of Transitional UAAL
Expected UAAL Contribution
6/30/2013 20 $ (4,577,499) $ (449,017) 6/30/2014 19 (4,471,795) (449,017) 6/30/2015 18 (4,358,162) (449,017) 6/30/2016 17 (4,236,007) (449,017) 6/30/2017 16 (4,104,691) (449,017) 6/30/2018 15 (3,963,526) (449,017) 6/30/2019 14 (3,811,774) (449,017) 6/30/2020 13 (3,648,640) (449,017) 6/30/2021 12 (3,473,271) (449,017) 6/30/2022 11 (3,284,749) (449,017) 6/30/2023 10 (3,082,088) (449,017) 6/30/2024 9 (2,864,228) (449,017) 6/30/2025 8 (2,630,028) (449,017) 6/30/2026 7 (2,378,264) (449,017) 6/30/2027 6 (2,107,616) (449,017) 6/30/2028 5 (1,816,671) (449,017) 6/30/2029 4 (1,503,904) (449,017) 6/30/2030 3 (1,167,680) (449,017) 6/30/2031 2 (806,239) (449,017) 6/30/2032 1 (417,690) (449,017) 6/30/2033 0 0 0

Page 21
SCHEDULE G (Continued)
AMORTIZATION OF 2014 INCREMENTAL UAAL
Valuation Date
Amortization Period
Balance of New Incremental UAAL
6/30/2014
Expected UAAL Contribution
6/30/2014 20 $ (1,152,968) $ (113,097) 6/30/2015 19 (1,126,343) (113,097) 6/30/2016 18 (1,097,722) (113,097) 6/30/2017 17 (1,066,954) (113,097) 6/30/2018 16 (1,033,878) (113,097) 6/30/2019 15 (998,322) (113,097) 6/30/2020 14 (960,099) (113,097) 6/30/2021 13 (919,009) (113,097) 6/30/2022 12 (874,838) (113,097) 6/30/2023 11 (827,354) (113,097) 6/30/2024 10 (776,308) (113,097) 6/30/2025 9 (721,434) (113,097) 6/30/2026 8 (662,444) (113,097) 6/30/2027 7 (599,031) (113,097) 6/30/2028 6 (530,861) (113,097) 6/30/2029 5 (457,578) (113,097) 6/30/2030 4 (378,799) (113,097) 6/30/2031 3 (294,112) (113,097) 6/30/2032 2 (203,073) (113,097) 6/30/2033 1 (105,207) (113,097) 6/30/2034 0 0 0

Page 22
SCHEDULE G (Continued)
AMORTIZATION OF 2015 INCREMENTAL UAAL
Valuation Date
Amortization Period
Balance of New Incremental UAAL
6/30/2015
Expected UAAL Contribution
6/30/2015 20 $ (460,224) $ (45,144) 6/30/2016 19 (449,596) (45,144) 6/30/2017 18 (438,172) (45,144) 6/30/2018 17 (425,890) (45,144) 6/30/2019 16 (412,688) (45,144) 6/30/2020 15 (398,495) (45,144) 6/30/2021 14 (383,238) (45,144) 6/30/2022 13 (366,836) (45,144) 6/30/2023 12 (349,204) (45,144) 6/30/2024 11 (330,250) (45,144) 6/30/2025 10 (309,875) (45,144) 6/30/2026 9 (287,971) (45,144) 6/30/2027 8 (264,424) (45,144) 6/30/2028 7 (239,112) (45,144) 6/30/2029 6 (211,901) (45,144) 6/30/2030 5 (182,649) (45,144) 6/30/2031 4 (151,203) (45,144) 6/30/2032 3 (117,399) (45,144) 6/30/2033 2 (81,060) (45,144) 6/30/2034 1 (41,995) (45,144) 6/30/2035 0 0 0

Page 23
SCHEDULE H
SUMMARY OF MAIN SYSTEM PROVISIONS AS INTERPRETED FOR VALUATION PURPOSES
The Georgia Legislative Retirement System (LRS) is a cost-sharing multiple employer defined benefit pension plan established by the Georgia General Assembly in 1979 for the purpose of providing retirement allowances and other benefits for all members of the Georgia General Assembly. Normal Retirement Benefit Eligibility Age 65 and 8 years of creditable service or age 62 and 8 years
of membership service (for eligible purposes, 4 legislative terms are equivalent to 8 years of membership service).
Benefit Monthly benefit is $36 multiplied by years of creditable service.
For members with retirement dates prior to July 1, 2013, a one-time 1.75% increase is made at time of retirement.
Early Retirement Benefit Eligibility Age 60 and 8 years of membership service. Benefit Accrued benefit reduced by 5% for each year member is under
age 62. Disability Retirement Benefit No special benefit. Benefit is same as early or normal
retirement. Involuntary Retirement Benefit N/A Deferred Vested Retirement Benefit Eligibility 8 years of creditable service. Member contributions not
withdrawn. Benefit Accrued benefit deferred to age 65 or reduced benefit payable
at age 60. Death Benefit Eligibility If less than 15 years of creditable service, a refund of
accumulated contributions. If at least 15 years of creditable service or eligible for retirement, the benefit below.
Benefit Benefit equal to retirement benefit immediately prior to death
under 100% joint and survivorship option. Termination Benefit Eligibility Termination with less than 8 years of creditable service. Benefit Return of the member’s accumulated contributions.

Page 24
Payment Options (1) Life annuity. Guaranteed payment of accumulated member contributions.
(2) 100% joint and survivorship annuity. (3) 50% joint and survivorship annuity.
Post-Retirement Adjustments The Board may from time to time grant a Cost of Living
Adjustment. Contributions By Members Members contribute 8 ½ % of salary. By Employers Employer contributions are actuarially determined and
approved and certified by the Board to the legislative fiscal officer.

Page 25
SCHEDULE I
NUMBER OF ACTIVE MEMBERS BY AGE AND SERVICE AS OF JUNE 30, 2015
Under 1 1 to 4 5 to 9 10 to 14 15 to 19 20 to 24 25 to 29 30 to 34 35 & Up Total
Under 25 0
25 to 29 2 3 5
30 to 34 5 5
35 to 39 3 12 1 1 17
40 to 44 4 14 4 1 1 24
45 to 49 2 12 5 4 1 24
50 to 54 5 14 2 4 1 1 27
55 to 59 3 7 5 11 4 4 34
60 to 64 2 10 8 7 4 2 33
65 to 69 1 7 3 6 1 4 1 2 25
70 & Up 2 4 8 4 4 1 1 24
Total 22 86 32 42 16 15 1 2 2 218
Years of Service
Attained
Age
Average Age: 54.8 Average Service: 8.8

Page 26
SCHEDULE I (Continued)
NUMBER OF RETIRED MEMBERS
AND THEIR BENEFITS BY AGE
Number Total Average
Age of Members Annual Benefits Annual Benefits
Under 50 0 0$ 0$ 50 - 54 0 0 0 55 - 59 0 0 0 60 - 64 8 32,292 4,036 65 - 69 43 242,084 5,630 70 - 74 55 351,914 6,398 75 - 79 35 226,288 6,465 80 - 84 27 200,293 7,418 85 - 89 21 212,724 10,130 90 - 94 9 90,036 10,004
95 & Over 0 0 0
Total 198 1,355,631$ 6,847$
NUMBER OF BENEFICIARIES AND THEIR BENEFITS BY AGE
Number Total Average
Age of Members Annual Benefits Annual Benefits
Under 50 2 6,323$ 3,161$ 50 - 54 1 4,726 4,726 55 - 59 1 5,100 5,100 60 - 64 5 21,858 4,372 65 - 69 7 29,915 4,274 70 - 74 7 37,029 5,290 75 - 79 10 64,541 6,454 80 - 84 10 68,589 6,859 85 - 89 12 106,273 8,856 90 - 94 4 52,185 13,046
95 & Over 3 25,828 8,609
Total 62 422,367$ 6,812$
Page 27
SCHEDULE I (Continued)
NUMBER OF DEFERRED VESTED MEMBERS
AND THEIR BENEFITS BY AGE
Number Total Average
Age of Members Annual Benefits Annual Benefits
Under 45 4 16,560$ 4,140$ 45-49 10 45,756 4,576 50-54 14 68,328 4,881 55-59 28 131,866 4,710 60-64 23 123,874 5,386 65-69 3 16,236 5,412
70 & Over 0 0 0
Total 82 402,620$ 4,910$

Page 28
SCHEDULE J
CAFR SCHEDULES
Actuarial Valuation as of 6/30
Active Member Contributions
Retirants & Beneficiaries
Active Members (Employer
Funded Portion) Valuation Assets(1) (2) (3) (1) (2) (3)
2015 $3,287 $19,873 $2,530 $31,635 100% 100.0% 100.0%2014 3,430 19,006 2,477 30,538 100% 100.0% 100.0%2013 2,951 19,623 2,330 29,481 100% 100.0% 100.0%2012 3,185 19,200 2,581 28,990 100% 100.0% 100.0%2011 2,921 19,759 2,564 29,278 100% 100.0% 100.0%2010 3,166 19,208 2,629 29,581 100% 100.0% 100.0%2009 2,908 18,465 2,150 30,303 100% 100.0% 100.0%2008 2,853 19,366 2,235 30,706 100% 100.0% 100.0%2007 2,484 19,847 2,026 30,049 100% 100.0% 100.0%2006 2,507 18,734 2,166 29,172 100% 100.0% 100.0%
All dollar amounts are in thousands.
GA LRS: Solvency Test
Actuarial Accrued Liability for:
Portion of Aggregate Accrued Liabilities Covered by Assets
June 30, 2015 13 $ 87 12 $ 112 260 $ 1,778 -1.4% $6,838 June 30, 2014 6 30 7 61 259 1,803 -1.7% 6,961June 30, 2013 32 200 15 140 260 1,834 3.4% 7,054June 30, 2012 10 66 11 82 243 1,774 -0.9% 7,300 June 30, 2011 18 104 10 86 244 1,790 1.0% 7,336 June 30, 2010 10 106 3 36 236 1,772 4.1% 7,508 June 30, 2009 10 117 7 54 229 1,702 3.8% 7,432 June 30, 2008 13 130 11 100 226 1,639 1.9% 7,252 June 30, 2007 17 151 9 74 224 1,609 5.0% 7,183 June 30, 2006 13 103 21 165 216 1,532 -3.9% 7,093
GA LRS: Schedule of Retirants Added to and Removed from Rolls
Added to Rolls Removed from Rolls Roll End of Year
NumberAnnual Allowances
(in thousands) Number Annual Allowances
(in thousands) NumberAnnual Allowances
(in thousands)
% Increase in Annual
Allowances
Average Annual
AllowancesYear Ended