potvin presentation - cre-msd fatigue conference
TRANSCRIPT

Jim Potvin - Department of Kinesiology
Preventing Fatigue During Repetitive Tasks:
Predicting Maximal Acceptable Efforts Using Duty Cycle
Jim Potvin, PhD Department of Kinesiology
Jim Potvin - Department of Kinesiology
Introduction
• Physical ergonomists must determine acceptable demands for a variety of tasks.
• Data exists for maximum efforts
– many strength studies available
• However, less data exists for prolonged and/or fatiguing tasks
– prolonged static
– intermittent
– complex time-histories
Jim Potvin - Department of Kinesiology
Endurance as a Function of Effort
0
1
2
3
4
5
6
7
8
9
10
11
12
0 10 20 30 40 50 60 70 80 90 100
Max
imum
Hol
ding
Tim
e (m
in)
Effort as a Percentage of Maximum
Manenica (1986)
Rohmert (1973)
Frey Law & Avin (2010)
Jim Potvin - Department of Kinesiology
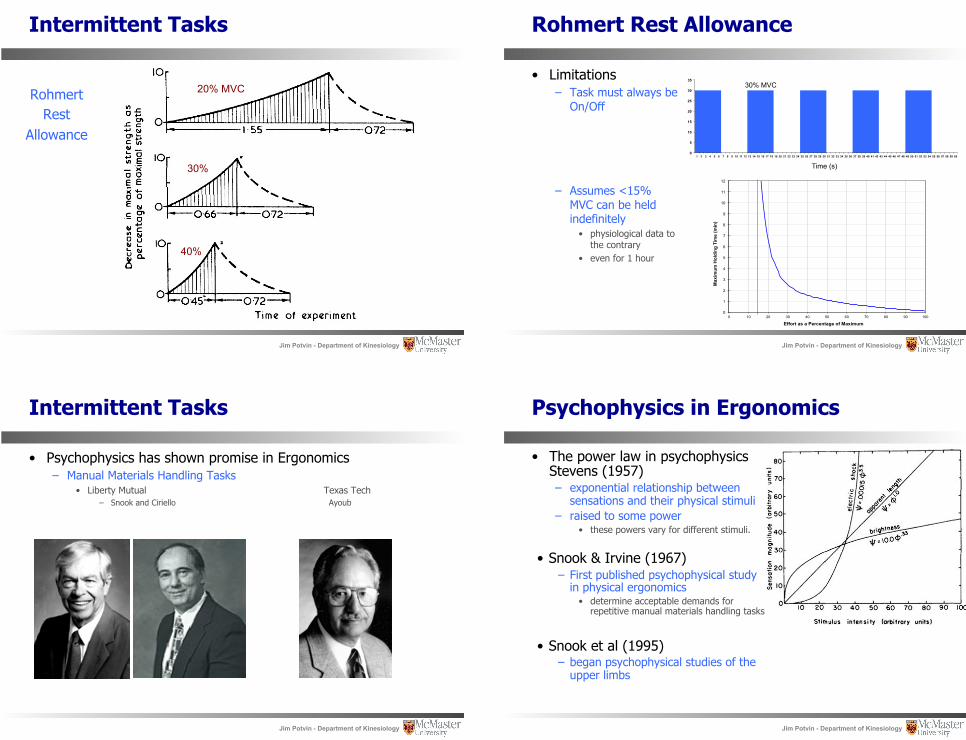
Intermittent Tasks
Rohmert Rest
Allowance
Variable Demand Capacity
Strength
Joint Moment Joint Strength
Duration
Holding Time Endurance Time
0
1
2
3
4
5
6
7
8
9
10
11
12
0 10 20 30 40 50 60 70 80 90 100
Max
imum
Hol
ding
Tim
e (m
in)
Effort as a Percentage of Maximum
0
50
100
150
200
250
30 40 50 60 70 80 90 100 110 120 130 140 150 160 170 180
Max
imum
Mom
ent (
N m
)
Angle [K] (in degrees)
MALE
FEMALE
Rest Allowance = 18 ! Holding TimeHolding Time
Endurance Time
1.4 Strength DemandMaximum Strength
-0.15
Jim Potvin - Department of Kinesiology
Intermittent Tasks
Rohmert Rest
Allowance
20% MVC
30%
40%
Jim Potvin - Department of Kinesiology
Rohmert Rest Allowance
• Limitations – Task must always be
On/Off
– Assumes <15% MVC can be held indefinitely
• physiological data to the contrary
• even for 1 hour
0
5
10
15
20
25
30
35
1 2 3 4 5 6 7 8 9 10 11 12 13 14 15 16 17 18 19 20 21 22 23 24 25 26 27 28 29 30 31 32 33 34 35 36 37 38 39 40 41 42 43 44 45 46 47 48 49 50 51 52 53 54 55 56 57 58 59 60
0
1
2
3
4
5
6
7
8
9
10
11
12
0 10 20 30 40 50 60 70 80 90 100
Max
imum
Hol
ding
Tim
e (m
in)
Effort as a Percentage of Maximum
Time (s)
30% MVC
Jim Potvin - Department of Kinesiology
Intermittent Tasks
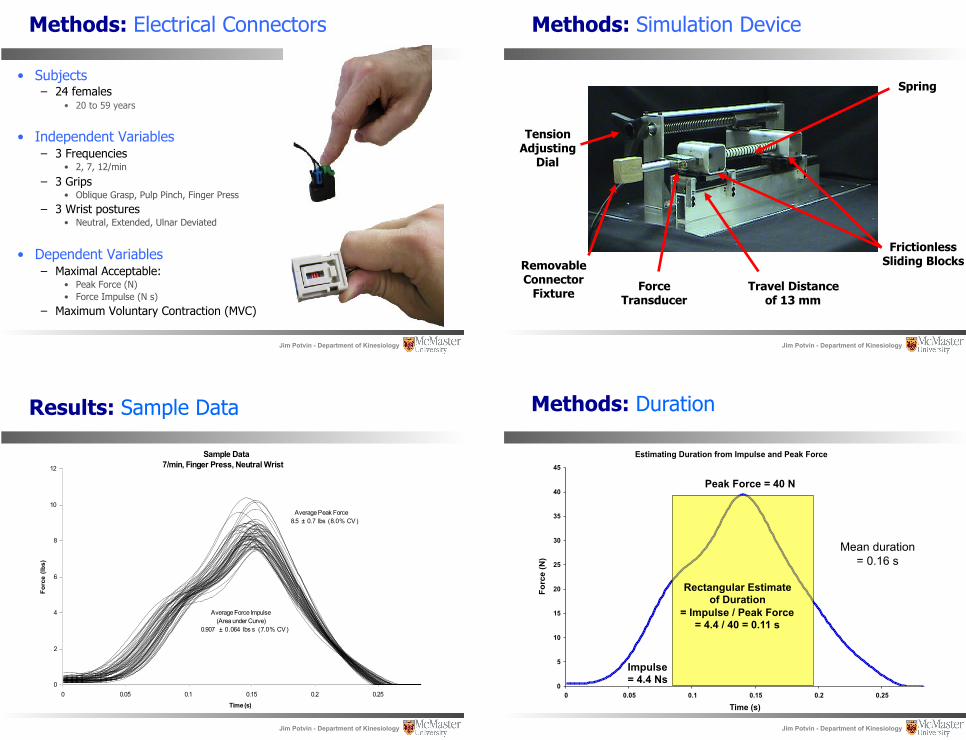
• Psychophysics has shown promise in Ergonomics – Manual Materials Handling Tasks
• Liberty Mutual Texas Tech – Snook and Ciriello Ayoub
Jim Potvin - Department of Kinesiology
Psychophysics in Ergonomics
• The power law in psychophysics Stevens (1957) – exponential relationship between
sensations and their physical stimuli – raised to some power
• these powers vary for different stimuli.
• Snook & Irvine (1967) – First published psychophysical study
in physical ergonomics • determine acceptable demands for
repetitive manual materials handling tasks
• Snook et al (1995) – began psychophysical studies of the
upper limbs

Jim Potvin - Department of Kinesiology
Psychophysical Methodology
• Snook, Ciriello et al • Subject controls maximal acceptable value
– typically resistance • could also be frequency, rest, duration
• Procedure – repetition rate controlled – task requirements
• gripping, screwdriver, wrist ulnar deviation etc
– subject controls the amount of resistance • by moving an unmarked dial
– resistance changed every 14 minutes • randomly selected direction and amount
– subjects instructed to “work as if they were on an incentive basis, getting paid for the amount of work they performed. They were asked to work as hard as they could without developing unusual discomfort in the hands, wrists, or forearms”
• symptoms were monitored
• Subject Training – 4-5 days ramping from 2 to 7 hours/day – testing over another 3 weeks
Jim Potvin - Department of Kinesiology
Example: Ciriello et al (2002)
- Screw driving - Ulnar deviation - Handgrip
Jim Potvin - Department of Kinesiology
Moore & Wells (2005)
- Wrist Extension - Simulated in-line screw running
Jim Potvin - Department of Kinesiology
Potvin et al (2006)
Manual Electrical Connections
Description – mating of electrical
connectors in automotive assembly
Study – Biomechanics and
Psychophysics – 18 hours of training – 9 hours of collection
Jim Potvin - Department of Kinesiology
Methods: Electrical Connectors
• Subjects – 24 females
• 20 to 59 years
• Independent Variables – 3 Frequencies
• 2, 7, 12/min
– 3 Grips • Oblique Grasp, Pulp Pinch, Finger Press
– 3 Wrist postures • Neutral, Extended, Ulnar Deviated
• Dependent Variables – Maximal Acceptable:
• Peak Force (N) • Force Impulse (N s)
– Maximum Voluntary Contraction (MVC)
Jim Potvin - Department of Kinesiology
Methods: Simulation Device
Spring
Frictionless Gliding Blocks
Force Transducer
Tension Adjusting
Dial
Removable Connector
Fixture Travel Distance of 13 mm
Frictionless Sliding Blocks
Jim Potvin - Department of Kinesiology
Sample Data7/min, Finger Press, Neutral Wrist
0
2
4
6
8
10
12
0 0.05 0.1 0.15 0.2 0.25
Time (s)
Fo
rce
(lb
s)
Average Peak Force8.5 ± 0.7 lbs (8.0% CV)
Average Force Impulse(Area under Curve)
0.907 ± 0.064 lbs s (7.0% CV)
Results: Sample Data
Jim Potvin - Department of Kinesiology
Estimating Duration from Impulse and Peak Force
0
5
10
15
20
25
30
35
40
45
0 0.05 0.1 0.15 0.2 0.25
Time (s)
Fo
rce
(N)
Peak Force = 40 N
Impulse = 4.4 Ns
Rectangular Estimate of Duration
= Impulse / Peak Force = 4.4 / 40 = 0.11 s
Mean duration = 0.16 s
Methods: Duration
Jim Potvin - Department of Kinesiology
Methods: Peak Force Time-History
Sample Force Time History(S03, OG, Ulnar Dev, 12/min)
0
2
4
6
8
10
12
14
16
18
20
0 15 30 45 60
Time (min)
Peak
For
ce (l
bs)
Mean = 12.6 lbsStDev = 1.0 lbsCV = 8%
Jim Potvin - Department of Kinesiology
• Hose Insertions
• Subjects – 15 females
• 21 to 59 years
• Independent Variables – 3 Frequencies
• 1, 3, 5/min
– 5 Postures
• Dependent Variables – Maximal Acceptable
• Peak force (N) • Force Impulse (N s)
– MVC
Andrews et al (2007)
Jim Potvin - Department of Kinesiology
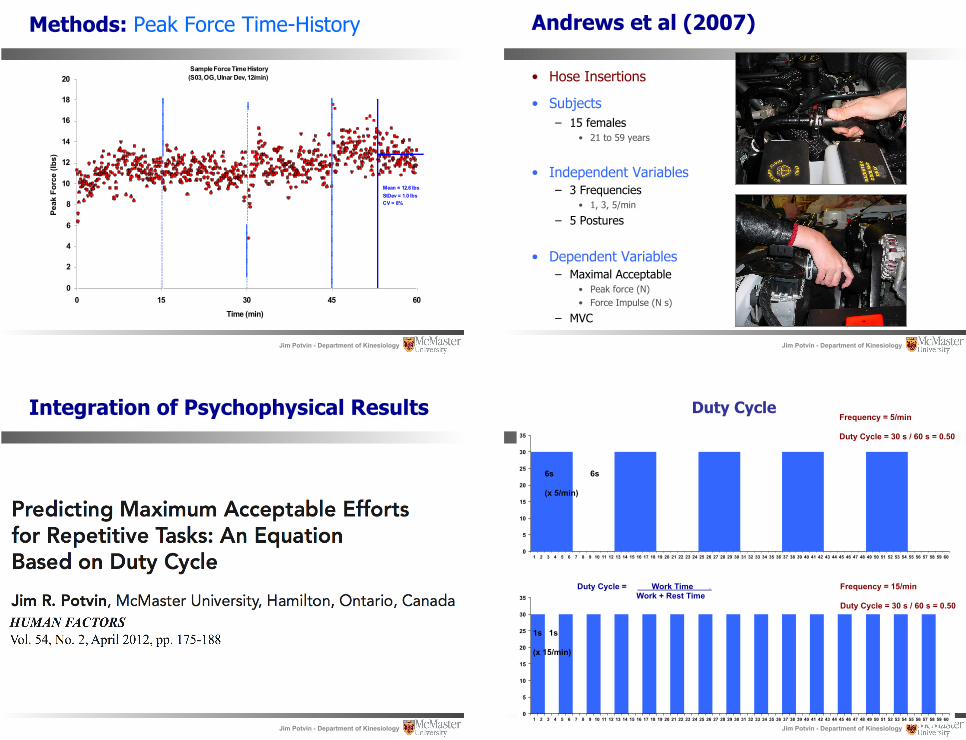
Integration of Psychophysical Results
Jim Potvin - Department of Kinesiology
0
5
10
15
20
25
30
35
1 2 3 4 5 6 7 8 9 10 11 12 13 14 15 16 17 18 19 20 21 22 23 24 25 26 27 28 29 30 31 32 33 34 35 36 37 38 39 40 41 42 43 44 45 46 47 48 49 50 51 52 53 54 55 56 57 58 59 60
6s 6s (x 5/min)
Frequency = 5/min Duty Cycle = 30 s / 60 s = 0.50
0
5
10
15
20
25
30
35
1 2 3 4 5 6 7 8 9 10 11 12 13 14 15 16 17 18 19 20 21 22 23 24 25 26 27 28 29 30 31 32 33 34 35 36 37 38 39 40 41 42 43 44 45 46 47 48 49 50 51 52 53 54 55 56 57 58 59 60
1s 1s (x 15/min)
Frequency = 15/min Duty Cycle = 30 s / 60 s = 0.50
Duty Cycle
Duty Cycle = Work Time .
Work + Rest Time

7 Studies Used
Duty Cycle =
Freq x Duration Time
n = 69
Subjects Freq(/min)
Duration (s)
Duty Cycle
(s/min)
Duty Cycle (%)
Tasks
2 0.810 1.62 2.7%5 0.810 4.05 6.8%
10 0.810 8.10 13.5%15 0.810 12.15 20.3%20 0.810 16.20 27.0%
5 days/week 14 15 0.810 12.15 20.3% - Wrist flexion: power grip (n = 1)15 1.120 16.80 28.0%20 1.050 21.00 35.0%25 1.080 27.00 45.0%15 0.640 9.60 16.0%20 0.610 12.20 20.3%25 0.550 13.75 22.9%15 1.080 15.00 27.0%20 1.080 20.00 36.0%25 1.080 25.00 45.0%15 1.215 15.00 30.4%20 1.215 20.00 40.5%25 1.215 25.00 50.6%3 5.000 15.00 25.0%5 3.000 15.00 25.0%
10 1.500 15.00 25.0%3 10.000 30.00 50.0%5 6.000 30.00 50.0%
10 3.000 30.00 50.0%20 1.500 30.00 50.0%3 16.667 50.00 83.3%5 10.000 50.00 83.3%
10 5.000 50.00 83.3%20 2.500 50.00 83.3%2 0.160 0.32 0.5%7 0.160 1.12 1.9%
12 0.160 1.92 3.2%1 0.685 0.69 1.1%3 0.717 2.15 3.6%5 0.721 3.61 6.0%
- Ulnar deviation: power grip (n = 3)
- Wrist extension: pinch grip (n = 3)
- Wrist extension: in-line powered srcrewdriver (n = 11)
- Wrist flexion: power grip- Wrist flexion: pinch grip- Wrist extension: power grip (n = Total of 15 tasks)
- Push: pulp pinch- Push: finger tip (n = 6)
- Hose insertions: 5 hand locations (n = 15)
- Ulnar deviation: power grip (n = 3)- Supination: 31 mm screwdriver- Supination: 40 mm screwdriver- Supination: 39 mm yoke- Pronation: 31 mm screwdriver (n = 12)
Duty Cycle = 83.3%
Duty Cycle = 25%
Duty Cycle = 50%
Potvin et al (2006)
Andrews et al (2008)
Moore & Wells (2005)
Ciriello et al
(2002)
24
15
8
Ulnar Deviation
Pronation & Supination
Study
15
11
20
10
Snook et al
(1995)
2 days/week
Snook et al (1997)
Snook et al (1999)
0%"
10%"
20%"
30%"
40%"
50%"
60%"
70%"
0 5 10 15 20 25
Max
imum
Acc
epta
ble
Effo
rt (%
)!
Frequency (Efforts per Minute)!
Snook et al (1995) 2D - Wrist Flexion (Power Grip)"
Snook et al (1995) 2D - Wrist Flexion (Pinch Grip)"
Snook et al (1995) 2D - Wrist Extension (Power Grip)"
Snook et al (1995) 5D - Wrist Flexion (Power Grip)"
Snook et al (1997) Ulnar Deviation"
Snook et al (1999) Wrist Extension (Pinch Grip)"
Ciriello et al (2002) Supination (31 mm handle)"
Ciriello et al (2002) Supination (40 mm handle)"
Ciriello et al (2002) Supination (39 mm yoke)"
Ciriello et al (2002) Pronation (31 mm handle)"
Ciriello et al (2002) Ulnar Deviation"
Moore & Wells (2005) Wrist Extension - DS = 0.25"
Moore & Wells (2005) Wrist Extension - DS = 0.50"
Moore & Wells (2005) Wrist Extension - DS = 0.83"
Potvin et al (2006) Pulp Pinch Push"
Potvin et al (2006) Finger Push"
Andrews et al (2007) Hose Insertion - (Medial Far)"
Andrews et al (2007) Hose Insertion - (Medial Near)"
Andrews et al (2007) Hose Insertion - (Push Forward)"
Andrews et al (2007) Hose Insertion - (Pull Back)"
Andrews et al (2007) Hose Insertion - (Push Down)"
0%"
10%"
20%"
30%"
40%"
50%"
60%"
70%"
0%" 10%" 20%" 30%" 40%" 50%" 60%" 70%" 80%" 90%"
Max
imum
Acc
epta
ble
Effo
rt (%
)!
Duty Cycle (Percent)!
Snook et al (1995) 2D - Wrist Flexion (Power Grip)"
Snook et al (1995) 2D - Wrist Flexion (Pinch Grip)"
Snook et al (1995) 2D - Wrist Extension (Power Grip)"
Snook et al (1995) 5D - Wrist Flexion (Power Grip)"
Snook et al (1997) Ulnar Deviation"
Snook et al (1999) Wrist Extension (Pinch Grip)"
Ciriello et al (2002) Supination (31 mm handle)"
Ciriello et al (2002) Supination (40 mm handle)"
Ciriello et al (2002) Supination (39 mm yoke)"
Ciriello et al (2002) Pronation (31 mm handle)"
Ciriello et al (2002) Ulnar Deviation"
Moore & Wells (2005) Wrist Extension - 3/min"
Moore & Wells (2005) Wrist Extension - 5/min"
Moore & Wells (2005) Wrist Extension - 10/min"
Moore & Wells (2005) Wrist Extension - 20/min"
Potvin et al (2006) Pulp Pinch Push"
Potvin et al (2006) Finger Push"
Andrews et al (2007) Hose Insertion - (Medial Far)"
Andrews et al (2007) Hose Insertion - (Medial Near)"
Andrews et al (2007) Hose Insertion - (Push Forward)"
Andrews et al (2007) Hose Insertion - (Pull Back)"
Andrews et al (2007) Hose Insertion - (Push Down)" 0
10
20
30
40
50
60
70
80
90
100
0% 10% 20% 30% 40% 50% 60% 70% 80% 90% 100%
Duty Cycle (Percent)
Max
imum
Acc
epta
ble
Effo
rt (%
)
Upper Extremity Psychophysical Data
Equation
r2 = 0.87 RMS Error = 7.2% MVE
MADC = (1 – Effort)4.167 – 1/28,800
DC = 0.12 (~7 s/min) Effort = 0.40 (40% MVC)

0
10
20
30
40
50
60
70
80
90
100
0% 10% 20% 30% 40% 50% 60% 70% 80% 90% 100%
Duty Cycle (Percent)
Max
imu
m A
ccep
tab
le E
ffo
rt (
%)
EquationRohmert (1973) - rest allowance equation for 360 s cycleRohmert (1973) - rest allowance equation for 30 s cycleJonsson (1982) - recommended for 8 hoursBjorksten & Jonsson (1977) - fatigue within 1 hourSjogaard et al (1986) - fatigue within 1 hourJorgensen et al (1988) - fatigue within 1 hourBystrom & Kilbom (1990) - fatigue within 1 hourBystrom & Fransson-Hall (1994) - fatigue within 1 hour
Jim Potvin - Department of Kinesiology
Frequency Effects: NIOSH Lifting Equation
Jim Potvin - Department of Kinesiology
Frequency Effects: ACGIH TLV
Tolerance Limit Value (TLV)
0
1
2
3
4
5
6
7
8
0 1 2 3 4 5 6 7 8 9 10
Hand Activity Level (HAL)
Eff
ort
(90th
perc
en
tile
)
TLV (Controls Needed)
Action Limit (General Controls)
.
Jim Potvin - Department of Kinesiology
Lifting & Lowering Curves
30
40
50
60
70
80
90
100
0% 1% 2% 3% 4% 5% 6% 7% 8% 9% 10%
Duty Cycle (Percent)
Max
Acc
epta
ble
Wei
ght o
f Lift
/Low
er (%
of 1
per
day
)
Lift (Floor to Knuckle)Lift (Knuckle to Shoulder)Lift (Shoulder to Reach)Lower (Knuckle to Floor)Lower (Shoulder to Knuckle)Lower (Reach to Shoulder)
Snook & Ciriello (1991)

Jim Potvin - Department of Kinesiology
Lifting & Lowering Fit with Equation
• 0.24 best coefficient for Lifting & Lowering
• RMS Diff = 5.0% MAE • r-squared = 0.812
0
10
20
30
40
50
60
70
80
90
100
0% 10% 20% 30% 40% 50% 60% 70% 80% 90% 100%
Duty Cycle (Percent)
Max
imum
Acc
epta
ble
Load
(%M
VC)
40
50
60
70
80
90
100
0% 1% 2% 3% 4% 5% 6% 7% 8% 9% 10%Duty Cycle (Percent)
MA
L%
Upper Extremity Psychophysical Data
Snook & Ciriello (1992) Lift & Lower MAWLs
Fitted Equation
Jim Potvin - Department of Kinesiology
Example: Maximum Acceptable Effort
Greig & Wells (2004) Assume:
• 2.3 efforts/min • 0.80 s/effort • DC = (2.3 x 0.80) / 60 • DC = 0.031 (3.1%)
MAE = 1 – (0.031 – 1/28,800)0.24
= 1 – 0.433 = 0.567 (56.7%) 50th Female Power Grip
• mean = 162.3 N • MAF = 162.3 x MAE • = 162.3 x 0.567 = 92.0 N
25th Female Lateral Pinch • mean = 64.8 N • 25th = 64.8 – (13.2 x 0.67) = 56.0 N • MAF = 56.0 x 0.567 = 31.7 N
Jim Potvin - Department of Kinesiology
Maximum Acceptable Effort = 70.6%
Jim Potvin - Department of Kinesiology
Limitation of MAE Equation:
0
5
10
15
20
25
30
35
1 2 3 4 5 6 7 8 9 10 11 12 13 14 15 16 17 18 19 20 21 22 23 24 25 26 27 28 29 30 31 32 33 34 35 36 37 38 39 40 41 42 43 44 45 46 47 48 49 50 51 52 53 54 55 56 57 58 59 60
0
5
10
15
20
25
30
35
1 2 3 4 5 6 7 8 9 10 11 12 13 14 15 16 17 18 19 20 21 22 23 24 25 26 27 28 29 30 31 32 33 34 35 36 37 38 39 40 41 42 43 44 45 46 47 48 49 50 51 52 53 54 55 56 57 58 59 60

Jim Potvin - Department of Kinesiology
Future Directions:
• More research needed – intermittent tasks – non On/Off tasks – complex time-histories – combined tasks
Sonne (2012)
Jim Potvin - Department of Kinesiology
MinMax 1 Percent
Isometric Sinusoidal On/Off
Fatigue Response Continuum
Most Fatiguing Least Fatiguing
Yung & Wells (2012)
Jim Potvin - Department of Kinesiology
Wells et al (2011)
50%
60%
70%
80%
90%
100%
110%
0%
5%
10%
15%
20%
25%
30%
35%
40%
45%
50%
21 42 63 84 105 126 147 168 199 220 241 262 283 304 325 346 367 388
Forc
e pr
oduc
ed a
fter
pla
teau
e (%
MV
C)
Pla
teau
Inte
nsity
Lev
el (%
MV
C)
Time at End of Each Plateau (s)
Changes in Force Production Between Plateaus (n = 12)
Jim Potvin - Department of Kinesiology
Wells et al (2011)
-15%
-10%
-5%
0%
5%
10%
0%
5%
10%
15%
20%
25%
30%
35%
40%
45%
50%
42 63 84 105 126 147 168 199 220 241 262 283 304 325 346 367 388
Cha
nge
in M
VC
For
ce P
rodu
ctio
n B
etw
een
Cur
rent
and
Pre
viou
s Fo
rce
Pla
teau
(C
olou
red
Bar
s) (%
MV
C)
Pla
teau
Inte
nsity
Lev
el (B
lue
Bar
s) (%
MV
C)
Time at End of Each Plateau (s)
Changes in Force Production Between Plateaus (n = 12)

Jim Potvin - Department of Kinesiology
Mike Sonne PhD Thesis
• High duty cycle psychophysics study
0
10
20
30
40
50
60
70
80
90
100
0% 10% 20% 30% 40% 50% 60% 70% 80% 90% 100%
Duty Cycle (Percent)
Max
imum
Acc
epta
ble
Effo
rt (%
)
Upper Extremity Psychophysical Data
Equation
Jim Potvin - Department of Kinesiology
Mike Sonne PhD Thesis
• Peripheral vs central fatigue in complex tasks – flexor pollicis longus – complex intermittent task – voluntary vs stimulation maximums
• Xia & Frey-Law (2008) Model – further development – motor unit model
Jim Potvin - Department of Kinesiology
Take Home Message
1. Most tasks are repetitive, but most of the research data relates to single effort strengths
2. Psychophysics can provide valuable data related to acceptable forces and torques during repetitive tasks
3. Duty cycle can be used to estimate maximum acceptable efforts for repetitive, intermittent tasks with no associated psychophysical data
4. Rohmert Rest Allowances appear to overestimate acceptable demands
5. More research is needed for tasks that are: – intermittent – complex – combined
Jim Potvin - Department of Kinesiology
Acknowledgements

Jim Potvin - Department of Kinesiology
Contact Information
Jim Potvin Associate Professor Department of Kinesiology, McMaster University 1280 Main Street West, Hamilton, Ontario, L8S 4K1 phone: (905) 730-9473 email: [email protected] website: http://www.science.mcmaster.ca/kinesiology/people/faculty/293-Jim%20Potvin.html