japan’s market is open - jetro.go.jp · ・ air asia has been operating 3 airbus (a320). recent...
TRANSCRIPT

Japan’s Market is Open to the World
October 2013
*As a review of the situation surrounding the EU-Japan EPA, JETRO compiled data materials released or provided by the parties into this file.

Some Examples of Openness
1

・Skymark Airlines determined to adopt 6 Airbus (A330). ・ Peach Aviation and Starflyer adopted respectively 10 and 7Airbus (A320). ・ Air Asia has been operating 3 Airbus (A320).
Recent Success Stories of European Business in Japanese Transportation Market(Aircraft)
Airbus delivers 100th aircraft in Japan
Airbus delivered its first aircraft to a Japanese carrier in 1980 (an A300B2) and in the last two years deliveries have accelerated rapidly. In 2012, Airbus delivered a total of 16 A320s, and in 2013 nearly 30 A320s (28) will be delivered to four Japanese operators. ・・・“With 100% market share, Airbus aircraft clearly are the preferred choice for Japanese low cost carriers” said John Leahy, Airbus Chief Operating Officer, Customers. (Press release by Airbus 15th March 2013)
Air line Boeing Airbus
Air Asia Japan 0% 100%
Jetstar Japan 0% 100%
Peach Aviation 0% 100%
Starflyer 0% 100%
(in Europe)
Air Berlin 49% 51%
easyJet 0% 100%
Flybe 0% 0%
Ryanair 100% 0%
Airbus’s Share in Japanese LCC Market (2012)
Source: Japan Aircraft Development Corporation
2

Names of the manufactures selected
“ALSTOM” and “THALES”
Steps in the selection of manufacturers
On June 22, 2012, JR East placed an announcement on their website HP calling for experience of interest from manufacturers for the introduction of CBTC on the Joban Local Line. By July 15 we had received expressions of interest from 10 manufacturers both within Japan and overseas. JR East then asked these manufacturers to submit proposals by the end of October, providing a system outline, etc. They received all of theses proposals thoroughly, made comparisons, and selected the 2 manufacturers .
Plans for the future
We will now make a more detailed review with each of the 2 manufacturers that we have selected regarding the introduction of CBTC to their Joban Local Line, and the end of December, 2013 we will select one of these two manufacturers with whom they will officially place an order. We plan that actual introduction of CBTC to our Joban Local Line will occur around 2020.
Results of the procedure for selecting manufacturers, considering the introduction of CBTC on the railway system
JR East have selected 2 European manufactures with whom we will continue to work, to discuss more details of the railway system.
(Citation) Source: JR East Press Release (http://www.jreast.co.jp/e/press/2012/pdf/20130221.pdf)
3

EU Public Procurement Markets Professor, Patrick Messerlin’s Policy Brief
Source: “EU public procurement market: How open are they? “(Patrick Messerlin), Sebastien Miroudot /Policy Brief July18,2012
URL:http://gem.sciences-po.fr/content/publications/pdf/Messerlin-Miroudot_EU_public_procurement072012.pdf
Penetration ratios of public procurement markets Ratio3: Extra-EU public imports to public demand※
※Source: Ramboll [2012] ※EU21:GDP-weighted average for the 21 EU Member States ※Showing several ration, Professor Messerlin suggests that “the correct comparison should rely on the shares of only extra-EU public imports to the EU public demand of goods and services”. ※Penetration ratios:The share of extra-EU public imports to total demand for public good and services.
0.0
2.0
4.0
6.0
8.0
EU21 Canada China Japan USA
4.7
2.7
4.6
6.9
6.1
EU2 and Japan penetration rations,1995-2008
※EU2 Germany and France
※Japan’s penetration rations have caught up the EU 2 penetration
ratios since2002 and that Japan is more open than the EU since2006.
That “EU public procurement markets are relatively more open than those of key East Asian trading partners (China, Japan, Korea and Taiwan) is not substantiated by robust evidence”.
“EU situation would be similar to the one of a country with zero tariffs but no (or very limited) imports.” There are some hidden “non-tariff barriers” at work in the EU public procurement markets. There may be some reasons—the feeling that it is better to grant public procurements to the firms best known because they are geographically close and/or more trusted.
Professor Messerlin at Sciences Po. Showed his analysis of EU public procurement markets. He suggests that “there is no evidence that the EU public procurement markets are more open than those of a few large trading partners”.
(%)
4

Central Government
Entities
47 Prefectures 19 Designated Cities
Over 1,000 Local Municipalities (about 80%)
Rest of Local Municipalities
40 Core Cities 41 Exceptional
Cities
Current JETRO site Mar 2011 Dec 2011 Dec 2012
Providing tender information from all relevant government entities in English
More procurement information available in English
Source: METI
・JETRO website on government procurement information, including that of major local governments
http://www.jetro.go.jp/en/database/procurement/ ・New Government Procurement Information Website, covers over 1000 local governments http://information1.gov-procurement.go.jp
5

Succeeded in signing contracts with five local
governments (more than 19 billion yen)
Veolia Water Japan A Japanese corporation under a French company (environment)
Received a large order for an anti-influenza drug
for government stock (more than 5 billion yen)
GlaxoSmithKline (Japanese corporation) A Japanese corporation under a British company (pharmaceuticals)
Received orders for expensive medical instruments from
institutions, including national university hospitals (more than 4
billion yen)
Siemens Japan A Japanese corporation under a German company (industrial machinery)
Examples of European Companies that Participate in Government Procurement in Japan
Source: JETRO
6
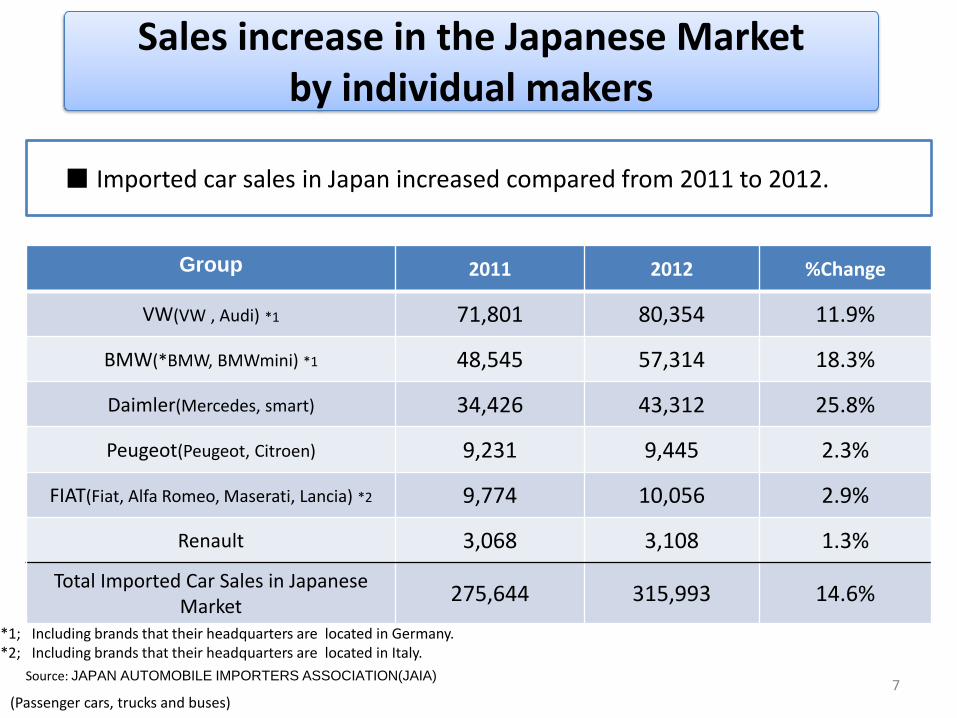
■ Imported car sales in Japan increased compared from 2011 to 2012.
Group 2011 2012 %Change
VW(VW , Audi) *1 71,801 80,354 11.9%
BMW(*BMW, BMWmini) *1 48,545 57,314 18.3%
Daimler(Mercedes, smart) 34,426 43,312 25.8%
Peugeot(Peugeot, Citroen) 9,231 9,445 2.3%
FIAT(Fiat, Alfa Romeo, Maserati, Lancia) *2 9,774 10,056 2.9%
Renault 3,068 3,108 1.3%
Total Imported Car Sales in Japanese Market
275,644 315,993 14.6%
Source: JAPAN AUTOMOBILE IMPORTERS ASSOCIATION(JAIA)
(Passenger cars, trucks and buses)
*1; Including brands that their headquarters are located in Germany. *2; Including brands that their headquarters are located in Italy.
Sales increase in the Japanese Market by individual makers
7

(2012)
5.0%
Other95.0%
Bigger share of imported EU cars in Japan than that of imported Japanese cars in Europe
Share of import cars
5.0% Share of European imported cars in the Japanese market.
new car registrations of 2012 in Japan: 4,572,332 imported cars from Europe : 227,148 3.3% Share of import cars from Japan in the EU market new car registrations of 2012 in the EU: 12,053,904 imported cars from Japan :398,127
(Passenger cars)
(Source:JAMA)
(2012)
Other88.5%
8.2%
3.3%
Imported from Japan European Brands
Manufactured in EU
(Source:ACEA,JAMA)
Market Share in Japan Market Share in the EU
8

• On 1 Feb 2013, the ban on import of cattle meat
and offal from France and the Netherlands was
lifted to allow the imports derived from cattle
aged 30 months or under, and 12 months or
under, respectively.
• On-site visit to Ireland and Poland carried out in
Jun 2012. Both countries submitted additional
data (January, March 2013) and Japan is now
preparing to request the risk assessment to Food
Safety Commission.
Beef Import
9

Substance of Japan’s EPA
Trade in goods
Trade in service Investment
Go
vernm
ent P
rocu
remen
t
Intellectu
al Pro
perty
Co
mp
etition
Imp
rovem
ent
Of B
usin
ess Enviro
nm
ent
Co
op
eration
En
ergy and
Min
eral Reso
urces
Market A
ccess
SPS/TB
T
Mu
tual R
ecogn
ition
Market A
ccess
Natio
nal Treatm
ent
MFN
Treatm
ent
Mo
vemen
t of N
atural P
erson
Natio
nal Treatm
ent
MFN
Treatm
ent
Pro
hib
ition
of p
erform
ance
requ
iremen
ts D
ispu
te Settlemen
t betw
een
state and
investo
r
ASEA
N
E AN
Vietnam ○ ○ ○ ○ ○ ○ ○ ○ ○
Philippines ○ ○ ○ ○ ○ ○ ○ ○ ○ ○ ○ ○ ○
ASEAN ○ ○ ○
Brunei ○ ○ ○ ○ ○ ○ ○ ○ ○ ○ ○ ○
Indonesia ○ ○ ○ ○ ○ ○ ○ ○ ○ ○ ○ ○ ○ ○
Thailand ○ ○ ○ ○ ○ ○ ○ ○ ○ ○ ○ ○ ○ ○
Malaysia ○ ○ ○ ○ ○ ○ ○ ○ ○ ○ ○ ○ ○ ○
Singapore ○ ○ ○ ○ ○ ○ ○ ○ ○ ○ ○
Latin
Am
erica
Chile ○ ○ ○ ○ ○ ○ ○ ○ ○ ○ ○ ○ ○
Mexico ○ ○ ○ ○ ○ ○ ○ ○ ○ ○ ○ ○ ○
Euro
pe
Switzerland
○ ○ ○ ○ ○ ○ ○ ○ ○ ○ ○ ○ ○ ○
FTA+ elements in FTAs Japan concluded
Source:Dr.Yorizumi Watanabe , Keio University 10
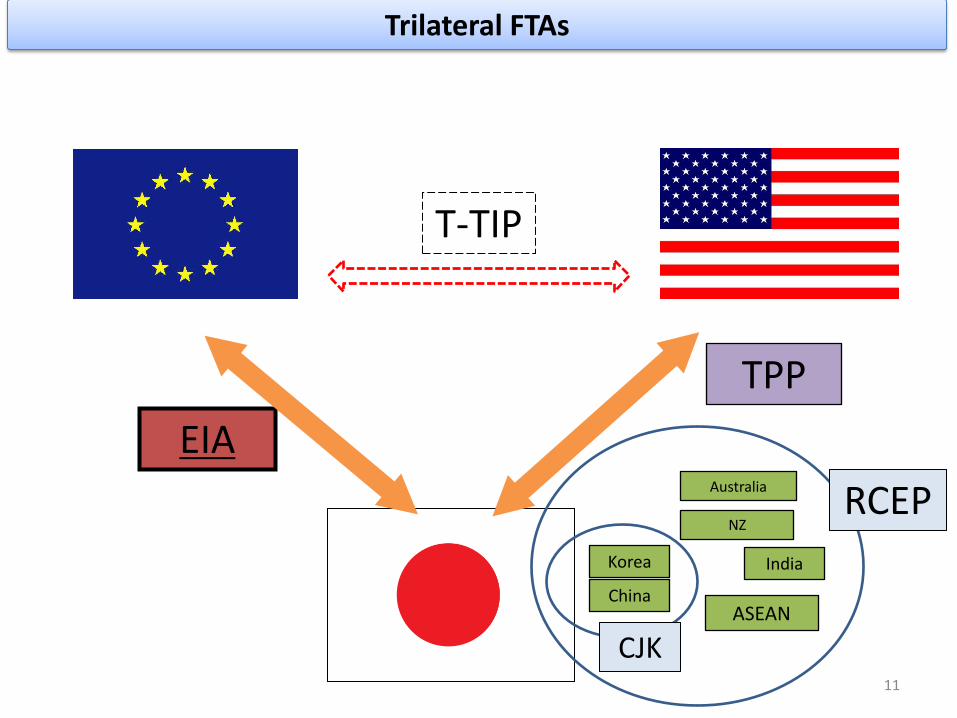
T-TIP
EIA
NZ
TPP
Australia
ASEAN China
Korea India
CJK
RCEP
Trilateral FTAs
11

Automobile
- Toyota: CEO of Toyota Motor Europe is French.
Most of sales companies’ CEOs are local persons.
- Nissan: CEO of Nissan Motor Manufacturing is British.
- Honda: Main sales companies’ CEOs (Spain, Austria, UK, Czech Republic) have been changed to local persons from 2010.
ICT
- Panasonic: CEO of Panasonic Europe was changed to European (French) from 2009
- Hitachi: CEO of Hitachi Europe was changed to European (UK) from 2004.
- NEC: Almost all sales companies’ CEOs are local persons.
- Fujitsu: CEO of Fujitsu Services and Fujitsu Technology Solutions are European (UK and Germany).
Most of Japanese companies based in Europe have been appointing European people as top executives of their companies.
European CEOs in Japanese Companies in Europe
Source: Japan Machinery Center for Trade and Investment
12

PSA – Toyota Motors
PSA – Mitsubishi Motors
Daimler – Toray Isagro – Sumitomo Chemical
FIAT – Toshiba Areva – Mitsubishi Heavy Industries
& etc.…
Expanding Japan-EU Industry Partnership
Source:METI 13

EU and Japanese industries have started the discussion on EU-Japan EPA . - Establishing common aim on EU-Japan EPA - Identifying NTBs for both sides and seeking for possible solutions or the enhancement of market access
Automobiles: ACEA-JAMA
Business Europe - Keidanren - Chairman’s meeting in July 2011 (Agreed on starting the discussion on EU-Japan) - B-B dialogue with the participation of 7 sectors in March 2012 - The second B-B dialogue in April 2013
- Meetings in April and May 2013 - Discussing on non-tariff issues (e.g. implementing UN regulations, zoning, WLTP, etc.)
ICT: Digitaleurope - JEITA
Successful EU-Japan Sector Discussion
Railways : EU railway manufacturers - Japanese railway companies - Meeting in October 2011 organized by JR East and Tokyo Metro in response to the EU side’s requests
- Exchanging views constructively on enhancing market access (e.g. Japan’s non-discriminatory procurement) - Opening EAST JAPAN RAILWAY COMPANY Brussels Branch in November 2012
- Trade policy chairman’s meeting in September 2011 - Publishing joint statement for promoting EU-Japan EIA in November 2011 - Publishing joint statement of the early concluding of the EU –Japan EPA/FTA in April 2013 - Discussing on the non-tariff issues (e.g. Environmental regulation, intellectual property, movement of people etc. )
14

Potential of Japan’s Market
15
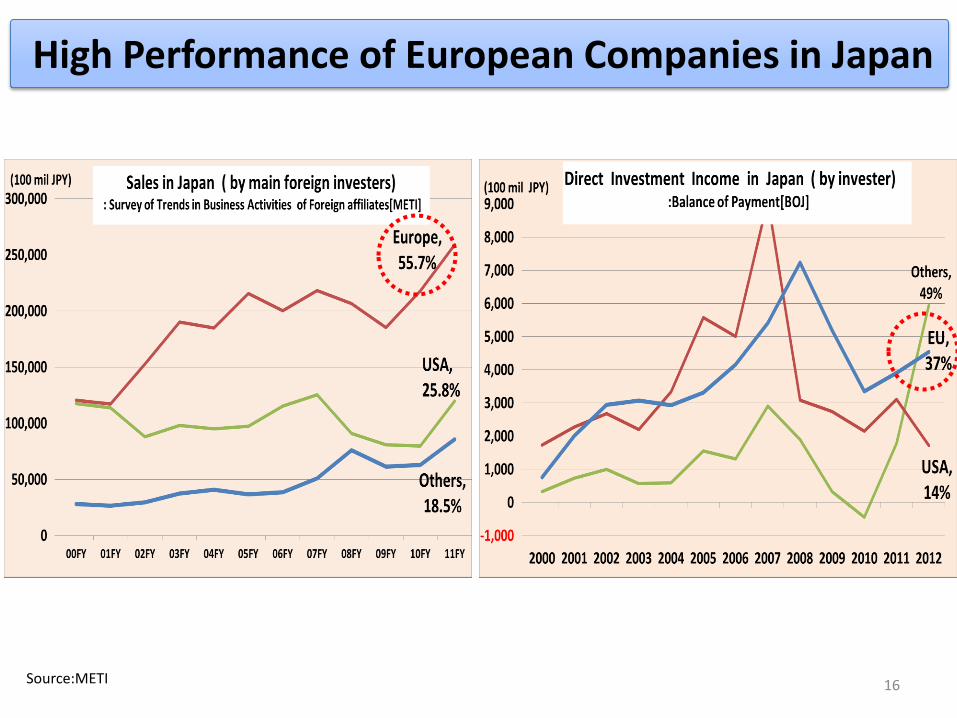
High Performance of European Companies in Japan
16 Source:METI

Popular European Products and Services in the Japanese Market
17

Missed Opportunities by European Companies
(2012) 70,689
(1990) 33,855
Source: Ministry of Finance
(Billion Yen)
Total Value 209% China 869%, EU(12⇒27) 131%, Australia 252% S. Korea 191%, Indonesia 141%, Malaysia 181%
Despite the growth of Japan’s import market, EU has not been capturing its benefit even after enlargement
China, 1730
US, 7586
EU, 5071
Australia, 1787
S Korea, 1690
Indonesia, 1821
Taiwan, 1232
Malaysia, 780
Others, 12158
18 Source:METI

Current Japan-EU Trade and Investment
19

Japan’s trade balance with the EU
20
1.10
1.25 1.30
1.37
1.51
1.79
1.69
1.14
1.25 1.30
1.38
0.86
1.02 1.04
0.90 0.92 0.92 0.81
0.54 0.57
0.52
0.40
44%45% 44% 40%
38%34%
32% 32%
31%29%
22%
0%
5%
10%
15%
20%
25%
30%
35%
40%
45%
50%
0.0
0.2
0.4
0.6
0.8
1.0
1.2
1.4
1.6
1.8
2.0
2002 2003 2004 2005 2006 2007 2008 2009 2010 2011 2012
(million units)
EU Production
Japan → EU Import
Imports/Imports+EU Production
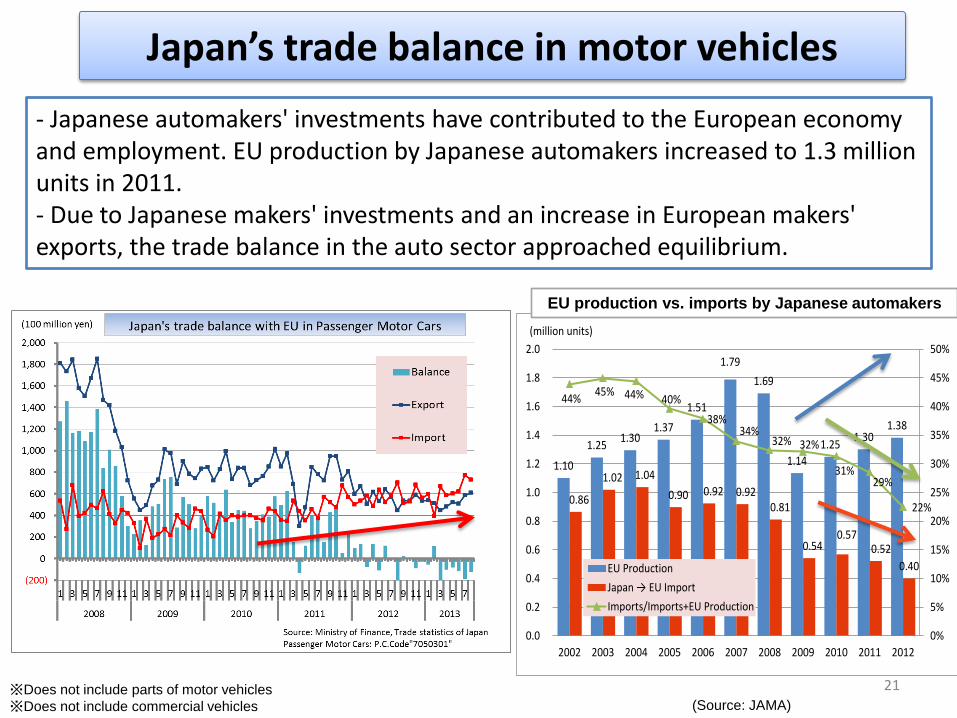
- Japanese automakers' investments have contributed to the European economy and employment. EU production by Japanese automakers increased to 1.3 million units in 2011. - Due to Japanese makers' investments and an increase in European makers' exports, the trade balance in the auto sector approached equilibrium.
Japan’s trade balance in motor vehicles
※Does not include parts of motor vehicles
※Does not include commercial vehicles (Source: JAMA)
EU production vs. imports by Japanese automakers
21

0
50
100
150
200
250
300
350
400
450
500
0
20,000
40,000
60,000
80,000
100,000
120,000
140,000
160,000
180,000
2001 2002 2003 2004 2005 2006 2007 2008 2009 2010 2011
JP→EU (Export)
JP→EU(Invest, stock)
employmentin EU
(100 million yen) (thousand people)
Japan’s investment and employment in the EU
■ Japan’s investment and employment in the EU has increased, while Japan’s exports have decreased.
Source: Ministry of Finance Japan, Ministry of Economy, Trade, and Industry
Japan’s export/investment/employment in the EU
Number of employees: over 437,225 Sales: 247 B euros Intraregional procurement: 51 B euros
Japanese overseas affiliates in the EU in FY2011
*Number of Employees by Japanese affiliates UK 140,705
Germany 59,304 Netherland 58,227
Belgium 33,226 France 25,319 Italy 21,545
Spain 12,848
22

Japan’s Trade in Medical Products
Surging Drug Imports Hit Japan’s Trade Balance (Nikkei, 15 May, 2012) <Summary> Japan's pharmaceutical imports are growing at a blistering pace due to the rapid aging of the population and the weak global competitiveness of domestic drugmakers. Japan incurred an overall trade deficit of about 2.5 trillion yen in 2011, as exports slumped while imports surged. More than half of that amount came from the pharmaceutical trade alone. Japan's pharmaceutical imports are expected to keep growing in the long term, putting further pressure on the nation's trade balance. Japan's pharmaceutical imports expanded by about 730 billion yen in the past five years alone , while exports have remained almost unchanged during the same period, at around 370 billion yen.
0
500
1,000
1,500
2,000
2,500
3,000
3,500
FRANCE GERMANY USA SWITZLD ITALY UK BELGIUM
hundred million yen Import surplus of Medical Products by Nation in 2012
Source:Ministry of Finance, Trade statistics of JapanMedical Producs: P.C. Code"507" 23

■ Purchases of EU-made parts by Japanese automakers totalled €11.77 billion in 2012.
■ In their pursuit of maximised global purchasing, JAMA members open their
contact points to all potential European suppliers looking for long-term partnerships.
Japanese Automaker’s Purchases of EU Parts
Source: JAMA 24
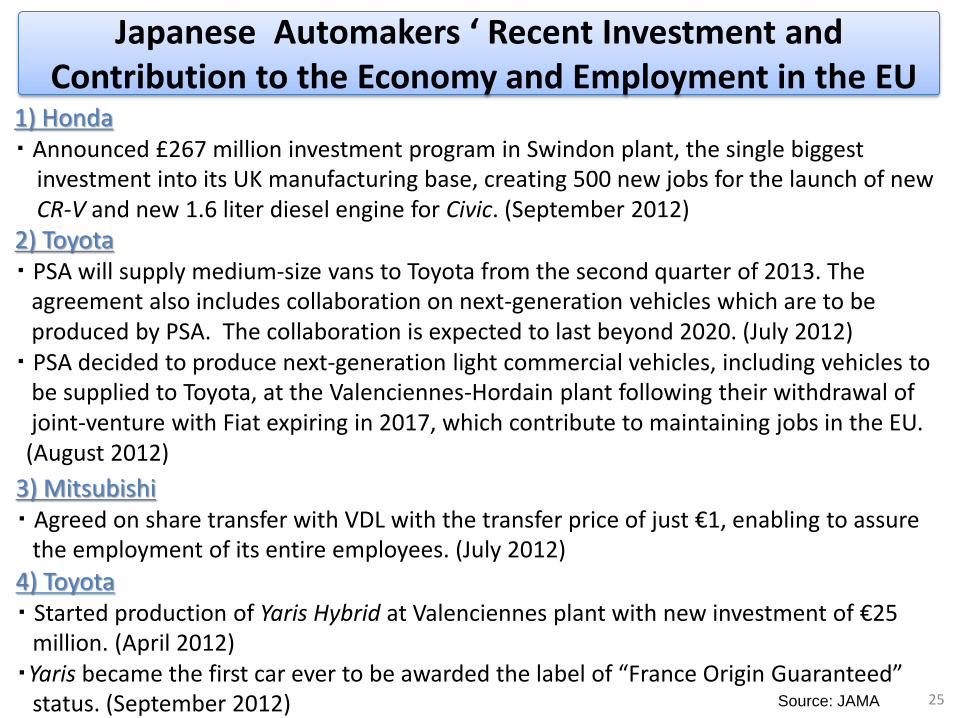
1) Honda ・ Announced £267 million investment program in Swindon plant, the single biggest investment into its UK manufacturing base, creating 500 new jobs for the launch of new CR-V and new 1.6 liter diesel engine for Civic. (September 2012) 2) Toyota ・ PSA will supply medium-size vans to Toyota from the second quarter of 2013. The agreement also includes collaboration on next-generation vehicles which are to be produced by PSA. The collaboration is expected to last beyond 2020. (July 2012) ・ PSA decided to produce next-generation light commercial vehicles, including vehicles to be supplied to Toyota, at the Valenciennes-Hordain plant following their withdrawal of joint-venture with Fiat expiring in 2017, which contribute to maintaining jobs in the EU. (August 2012)
3) Mitsubishi ・ Agreed on share transfer with VDL with the transfer price of just €1, enabling to assure the employment of its entire employees. (July 2012)
4) Toyota ・ Started production of Yaris Hybrid at Valenciennes plant with new investment of €25 million. (April 2012) ・Yaris became the first car ever to be awarded the label of “France Origin Guaranteed” status. (September 2012)
Japanese Automakers ‘ Recent Investment and Contribution to the Economy and Employment in the EU
Source: JAMA 25

Addressing “Non Tariff Measures”
26
Progress of NTM issues ・UN/ECE regulations → MLIT had published the roadmap toward the adoption of UN/ECE Regulations in March 2013. MLIT also adopted 2 UN/ECE regulations(R121 and R127).
・Zoning for automobile service shops → MLIT published the result of the facilitation of the establishment of automobile service shops in March 2013 and the Technical Guideline affected well on the facilitation of the establishment.
・Radio equipment → The process of public comments for the amendment of Ministerial Ordinance had been completed in April.
・Food additives → Two food additives(Magnesium hydrogen phosphate, and Calcium saccharin) had been designated in 2012. Other two additives(Potassium lactate, and Potassium sulfate) also had been designated in May 2013. Isopropanol is in the process of designation. Roadmap for designation process for internationally used food additives had been formulated and been published in September 2012.
・Medical Devices → Revision of the Pharmaceutical Affairs Law was submitted to the Diet session.
・Pharmaceuticals → GCP Ordinance was amended in December 2012. Revised “Minimum Requirements for Biological Products” is expected to be promulgated soon.
・Pyrotechnic Safety Devices → The Ministerial Notice(METI) of the Explosive Control Act came into force in February 2012.
・Liquor wholesale license → The amended public notice entered into force in September 2012, establishing new license categories such as liquor wholesale license for cash-and-carry wholesalers.
・Beef Import → On 1 Feb 2013, the importation of beef and bovine products from France (aged 30 months or under) and the Netherlands (aged 12 months or under) into Japan was reopened.
・Organic food → A comprehensive package agreed by MAFF and DG-AGRI was implemented on 1 April 2013. 27
Contribution of Japan to Europe
28

Number of employees: over 437,000 Sales: 27,437 bln Yen Intraregional procurement: 5,646 bln Yen
*Number of Employees by Japanese affiliates UK 140,705 Netherland 58,227 Germany 59,304 Belgium 33,226 France 25,319 Italy 21,545 Spain 12,848
Japanese overseas affiliates in the EU
Huge Job Creation by Japanese Companies in Europe
The EU: No.1 Investor to Japan 8,214 billion yen(2012)
Japan: No.3 Investor to the EU 144 billion euro(2011) Source: BOJ, Eurostat
Survey of Overseas Business Activities as of 2011(FY) , METI
29

Toyota
@Burnaston
Honda
@Swindon
Toyota
@Valenciennes
Nissan
@Barcelona, Avila,
Cantabria Mitsubishi Fuso
@Tramagal
Suzuki
@Esztergom
Toyota
@Walbrzych
Toyota
@Jelcz Laskowice
Nissan
@Sunderland
Toyota
@Kolin Honda
@Swindon
Nissan
@London
Honda
@Offenbach
Isuzu
@Gustavsburg
Mazda
@Oberursel
Mitsubishi
@Trebur
Toyota
@Koln
Subaru
@Ingelheim am Rhein
Isuzu
@Tychy
Toyota
@Nice
Nissan
@Cranfield, Barcelona,
Madrid, Brussels, Bruhl
Subaru
@Zaventem Toyota
@Zaventem,
Bernaston
: Production Facilities : R&D Facilities
・Production: 13 plants in 8 countries
・R&D: 12 centres in 5 countries
・Employment: 164,000 people
・Purchases of EU parts*: €11.75 billion
(*in FY 2011)
Toyota
@Ovar
Mitsubishi
@Born
Japanese Automakers’ Production/R&D Facilities in the EU
Source: JAMA 30

Spain
Austria
Belgium
Czech
France
Germany
Hungary
Italy
Netherlands
Slovakia
Ireland
Sweden
UK Poland
Denmark
Spain 15 / 2,812
Poland 11 / 3,662
UK 35 / 30,575
Germany 26 / 21,132
France 28 / 6,010
Italy 14 / 1,552
Netherlands 12 / 2,157
Denmark 2 / 347
Austria 7 / 1,725
Belgium 6 / 2,380
Romania
Bulgaria 1 / 12
Czech 9 / 4,760
Finland
Finland 2 / 416
Hungary 5 / 2,935
Ireland 4 / 562
Luxembourg
Luxembourg 1 / 42
Portugal
Portugal 3 / 327
Slovakia 6 / 5,162
Slovenia
Slovenia 1 / 10
Greece
Greece 1 / 2
Bulgaria
Romania 2 / 37
Others
- / 14,733
Sweden 7 / 708
Number in the box: Operations of the companies of Japanese IT industries association
/ Employees of the companies of Japanese IT industries association
• More than 200 operations
in 22 countries
• More than 100,000 employees
in 22 countries
Japanese IT Companies’ Operations and Employment in the EU
31 Source:JEITA

Japan’s Large Contribution to the IMF
Total 430 over Billions of USD share
Euro Area about 200 Billions of USD 46.5%
Japan 60 Billions of USD 14.0%
Korea 15 Billions of USD 3.5%
Saudi Arabia 15 Billions of USD 3.5%
UK 15 Billions of USD 3.5%
Sweden at least 10 Billions of USD 2.3%
Switzerland 10 Billions of USD 2.3%
Norway about 9 Billions of USD 2.2%
Poland about 8 Billions of USD 1.9%
Australia 7 Billions of USD 1.6%
Denmark Nationalbank about 7 Billions of USD 1.6%
Singapore 4 Billions of USD 0.9%
Czech about 2 Billions of USD 0.5%
Source: IMF press release Apr 20,2012
■ A contribution of over 43 billion USD was announced at the G20/IMFC (Meeting of the International Monetary and Financial Committee) on Apr 20. Japan announced a contribution of 60 billion USD.
■ These resources are being made available for crisis prevention and resolution and to meet the potential financing needs of all IMF members.
32

Benefit of EU-Japan FTA
33

Possible Benefit of FTAs for the EU
Nominal GDP (US$ 1trillion)
(2010)
FTA’s Impact on EU’s real GDP
(%)
Japan India Canada Korea Malaysia Singapore
5.5 1.6 1.0
0.2 0.2
0.12 0.07 0.03 0.04
Source: World Bank
0.00
Source: World Bank
*EU’s real GDP: 16.25 trillion US$ (2010)
1.7
0.09
Source: RIETI (estimated by Dr. Kenichi Kawasaki) ※Considered only tariff elimination, not NTM and spillovers effect
34

B: EU-Japan FTA (all tariff elimination and reduction of NTBs)
Impact Assessment Report on EU-Japan Trade Relations
A: No policy change (baseline scenario)
B1: Conservative - A-symmetric reduction of NTBs (20% NTBs reduction in Japan, 6.6% reduction in the EU for goods, and 20% reduction in the EU for services)
B2: Conservative - Symmetric reduction of NTBs (20% NTBs reduction both in Japan and the EU)
B3: Ambitious - A-symmetric reduction of NTBs (50% NTBs reduction in Japan, 16.5% reduction in the EU for goods, and 50% reduction in the EU for services)
B4: Ambitious - Symmetric reduction of NTBs (50% NTBs reduction both in Japan and the EU)
“Option (b), calls for full-scale FTA negotiations, with different degrees of trade liberalization, and
reductions in the costs of trade, all of which result in considerable benefits in both the EU and Japan.
Benefits include increases in GDP, increases in exports, overall increases in employment, increases in
wages for both semi-skilled and skilled employees, together with increases in competitiveness and an
improved standing for both the EU and Japan in respect of other global competitors.”
The European Commission concluded the EU-Japan FTA/EPA will bring benefit for both the EU
and Japan, in the Impact Assessment issued in August 2012;
Economic impact of the asymmetric scenarios (Mln €, percentage change)
Sectoral impact of the asymmetric scenarios (percentage change)
< Policy Option>
35

New Direct Investment in Mexico by Japanese Automakers following Implementation of the Japan-Mexico EPA
Tariff reduction on auto parts through the Japan-Mexico EPA, in effect from April 2005, encouraged an
84% increase in local production by the Japanese automakers between 2004 and 2010. The EPA is stimulating many new direct investments. Japanese automakers currently operate 6 production facilities in Mexico. Mazda and Honda recently
announced the construction of new production plants in Salamanca City (starting in FY2013) and Celaya (starting in 2014), respectively.
Vehicle Production by Japanese Automakers in Mexico
(2004-2010) Manufacturer Location
Honda El Salto
Toyota Tijuana
Nissan Aguascalientes
Civac (Cuernavaca)
Isuzu Cuautitlan
Hino Silao
Japanese Automakers’ Production Facilities in Mexico
335336
372711
456089
547877 541761
443843
616791
300000
400000
500000
600000
700000
2004 2005 2006 2007 2008 2009 2010
In units
Source: Marklines Database
Japan-Mexico EPA in effect (April 2005)
Surge of Investment to Mexico after the Japan-Mexico EPA
36

EU Japan
Export Effects (Tariffs)
+€14bn +€25bn
Export Effects (NTMs)
+€29bn +€28bn
Welfare Effects +€33bn +€18bn
- While tariff dismantling would be beneficial to both economies, the real gains would be reaped by lowering regulatory differences.
- The study focuses predominantly on regulatory measures in seven key sectors in Japan. (Pharmaceuticals, medical devices, processed foods, cars, transport equipment, telecoms and financial services)
• The study estimates that trade flows could increase by €43 billion for the EU and €53 billion for Japan.
e.g.) - EU motor vehicles exports to Japan could increase by up to 84% (by up to €4.7billion)
- EU pharmaceutical exports to Japan could increase by 60-100% (by up to €3.4billion)
- EU medical devices exports to Japan could increase by 51% (by €1.1billion)
• While more than half of the trade benefits go to Japan, two-thirds of the welfare benefits go to the EU (€33 billion for the EU and €18 billion for Japan).
- The study uses information on the trade costs of regulatory barriers obtained through a survey of European firms operating in Japan.
“Assessment of barriers to trade and investment between the EU and Japan” (3 February, 2010) prepared for the European Commission, DG Trade, by Copenhagen Economics
Summary of Impact
Benefit of EIA for EU and Japan through Reducing Tariffs and NTMs
37 Source:Copenhagen Economics
38 38
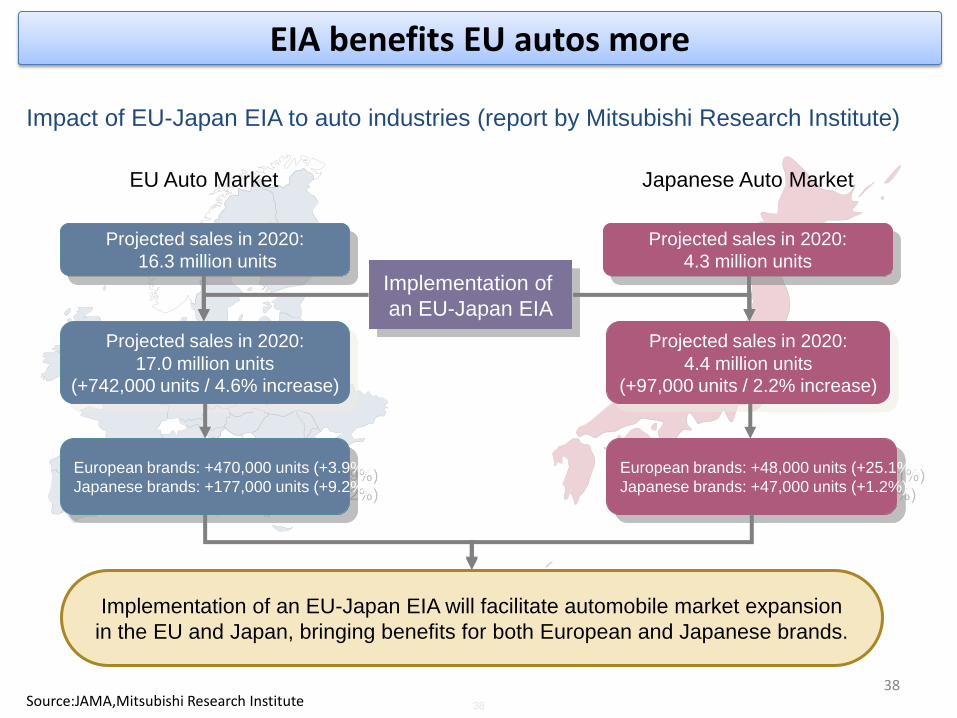
Projected sales in 2020:
16.3 million units
Projected sales in 2020:
4.3 million units
EU Auto Market Japanese Auto Market
Projected sales in 2020:
17.0 million units (+742,000 units / 4.6% increase)
Projected sales in 2020:
4.4 million units (+97,000 units / 2.2% increase)
European brands: +48,000 units (+25.1%)
Japanese brands: +47,000 units (+1.2%)
Implementation of
an EU-Japan EIA
Implementation of an EU-Japan EIA will facilitate automobile market expansion
in the EU and Japan, bringing benefits for both European and Japanese brands.
European brands: +470,000 units (+3.9%)
Japanese brands: +177,000 units (+9.2%)
Impact of EU-Japan EIA to auto industries (report by Mitsubishi Research Institute)
EIA benefits EU autos more
38 Source:JAMA,Mitsubishi Research Institute

Joint Statement by European business organizations (Chemical, Digital tech, Cultural and creative, Pharmacy, Retail, Service, Sports, Food and drink, Trade, Record, Leather, Metals, Textile, Ceramic)
The signatories of this statement strongly call upon the EU and Japan to launch the negotiations for a deep and comprehensive Free Trade Agreement (FTA) as soon as possible. An FTA will deliver significant economic benefits and contribute to the development of both the EU and Japan.
An FTA with Japan has the potential to improve market access and regulatory coherence, and thus expand trade and investment, enhance productivity, contribute to mutually enhanced competitiveness of both economies, promote economic growth, and increase employment.
…The EU and Japan economic relations are vital for European companies, whose business links with Japan extend beyond import/export to include alliances and partnerships in supply chains, joint research projects and direct investments… (citation)
Call for a Free Trade Agreement with Japan - Brussels, 12 November 2012
39

100
110
120
130
140
150
160
170
400,000
600,000
800,000
1,000,000
1,200,000
1,400,000
1,600,000
1,800,000
2000 2001 2002 2003 2004 2005 2006 2007 2008 2009 2010
EU Production
Japan ⇒ EU vehicle exports
Average currency rate (Yen/Euro)
Un
its
Currency rate
(Yen)
nn
nn
Strong
Weak
Japanese automakers’ EU production and exports to the EU, 2000-2010
Sources: JAMA; Mitsubishi UFJ Research and Consulting
From 2000 to 2007, Japan ⇒ EU vehicle exports slightly declined, while Japanese automakers’ production in the EU nearly doubled, despite the fact that the Japanese yen depreciated against the euro by nearly 60% during that period.
Although currency rates can be a critical factor in pricing, directly affecting cost competitiveness, history shows that factors which should favour increased exports do not necessarily do so.
Japanese automakers are committed to contributing to the further growth of the European auto industry, and therefore we are confident that tariff reduction via an EU-Japan EIA will not lead to increases in exports from Japan.
Surge of Japan’s Car Exports? Not Likely
40
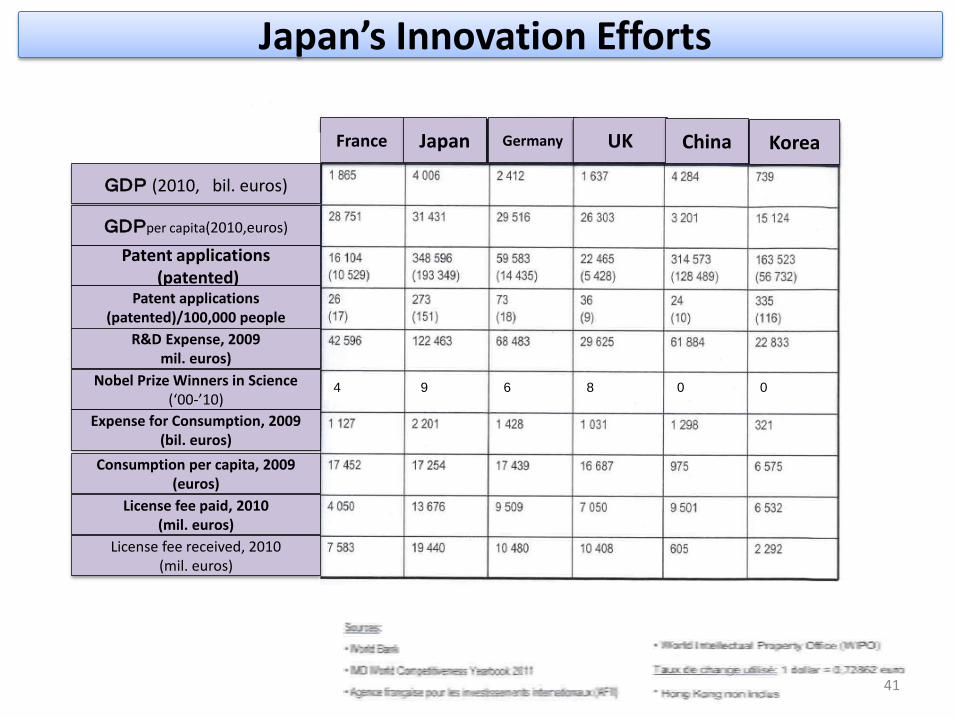
Japan’s Innovation Efforts
France Japan Germany UK China Korea
GDP (2010, bil. euros)
GDPper capita(2010,euros)
Patent applications (patented)
Patent applications (patented)/100,000 people
R&D Expense, 2009 mil. euros)
Nobel Prize Winners in Science (‘00-’10)
Expense for Consumption, 2009 (bil. euros)
Consumption per capita, 2009 (euros)
License fee paid, 2010 (mil. euros)
License fee received, 2010 (mil. euros)
4 9 6 8 0 0
41