jagran prakashan ltd absolute : long ) regular coverage 15 ... · nai dunia, i-next punjabi jagran...
TRANSCRIPT
January 31, 2018 Analysts: Depesh Kashyap, CFA (+91-7228934327)/ Harshit Patel (+91 9825406497) Page 1 of 12
Before reading this report, you must refer to the disclaimer on the last page.
Jagran Prakashan Ltd Absolute : LONG
Relative : Overweight
3QFY18 Result: Estimate (), TP (), Rating () Regular Coverage 15% ATR in 14 Months
Weak quarter but green shoots of recovery emerging - maintain LONG Media & Entertainment
© 2017EquirusAll rights reserved
Rating Information
Price (Rs) 173
Target Price (Rs) 200
Target Date 31st Mar'19
Target Set On 31st Jan'18
Implied yrs of growth (DCF) 15
Fair Value (DCF) 246
Fair Value (DDM) 91
Ind Benchmark SPBSMIP
Model Portfolio Position NA
Stock Information
Market Cap (Rs Mn) 53,999
Free Float (%) 39.15 %
52 Wk H/L (Rs) 208.9/160
Avg Daily Volume (1yr) 2,44,849
Avg Daily Value (Rs Mn) 44
Equity Cap (Rs Mn) 623
Face Value (Rs) 2
Bloomberg Code JAGP IN
Ownership Recent 3M 12M
Promoters 60.9 % 0.0 % 0.1 %
DII 15.3 % 1.3 % 2.8 %
FII 9.2 % -1.3 % -6.1 %
Public 14.6 % 0.0 % 3.2 %
Price % 1M 3M 12M
Absolute -2.5 % -2.4 % -5.0 %
Vs Industry 0.1 % -7.1 % -40.0 %
DBCORP -6.6 % -9.9 % -12.2 %
HTMEDIA 0.0 % 6.7 % -6.6 %
Consolidated Quarterly EPS forecast
Rs/Share 1Q 2Q 3Q 4Q
EPS (17A) 2.6 2.6 3.0 2.5
EPS (18E) 2.8 2.3 2.8 2.8
Jagran Prakashan’s (JPL) 3QFY18 consolidated revenues were at Rs 5981mn (-1% yoy),
while print advertising revenues slid ~4% yoy (vs. -6% yoy for DB Corp, and +5% yoy for
HMVL). Circulation revenues remained flattish (vs. 1.5% growth in 1QFY18 and ~1% in
2QFY18) as increased competition in UP and Bihar continued to put pressure on cover
prices. JPL’s radio advertising (MBL) volumes grew by 5% yoy, outperforming industry
growth (2% yoy). The months of November and December have shown encouraging trends
and we expect the recovery to continue in 4QFY18, partly helped by soft comps. We
however cut our FY18/FY19 EPS estimates by 3%/6% to factor in a weak 3Q and rising
newsprint costs; maintain LONG with a rolled over Mar’19 TP of Rs 200 (from a Dec’18 TP
of Rs 200).
Advertising was weak due to split of festive season into two quarters: Advertising
growth for print media companies continued to be hit by GST disruption, a festive
season split into two quarters and lower government advertisements. This led to a ~2%
decline in print advertisement revenues for JPL on standalone basis. However, as per
management, revival has been seen in discretionary, BFSI, real estate and education
related advertisements. Circulation revenues remained under pressure (flattish yoy) as
competition in key markets of UP and Bihar remained intense at the onset of IRS 2017.
Management believes that cover prices have bottomed out and they would be improving
realizations in coming quarters. Also, according to the recently released IRS survey,
Jagran has maintained its leadership position (see our Indian Readership Survey 2017
Note for survey results). According to management, this survey may help the company
to negotiate better ad-rates.
Radio continued to outperform peers but Mid-Day disappointed: JPL’s radio
subsidiary, Music Broadcast Limited (MBL), posted a ~5% yoy growth in 3QFY18 (vs. 7%
decline for DB Corp and 5% growth for HT Media). EBITDA margins disappointed at 31%
(-229bps vs. EE and -596bps yoy) (See our Result update note on MBL). For Mid-Day,
advertising revenues fell by 15% yoy (vs. +3% yoy last quarter) and EBITDA margins
contracted to 12% (vs. 20% in 3QFY17 and 13% in 2QFY18). Revenues for all other
publications (Nai Dunia, I-Next, Punjabi Jagran and Sakhi) grew ~3% yoy during 3QFY18.
Maintain LONG with a rolled over Mar’19 TP of Rs 200: We remain hopeful of
recovery in advertisements from 4Q onwards and also IRS survey results shall remain
supportive of the print media story in India. We have updated our numbers post 3Q
results and revised our FY18/FY19 EPS estimates by -3%/-6%. We continue to value JPL
on SOTP basis (Exhibit 5) and roll over to a Mar’19 TP of Rs 200 (from a Dec’18 TP of Rs
200). Maintain LONG.
Change in Estimates
Rs. Mn FY18E Chg (%) FY19E Chg (%)
Sales 23,607 -2% 25,682 -2%
EBITDA 6,310 -2% 7,092 -4%
EPS 10.5 -3% 12.2 -6%
Consolidated Financials
Rs. Mn YE Mar FY17A FY18E FY19E FY20E
Sales 22,830 23,607 25,682 27,942
EBITDA 6,396 6,310 7,092 7,929
Depreciation 1,289 1,350 1,424 1,464
Interest Expense 350 302 232 232
Other Income 412 470 513 677
Reported PAT 3,475 3,283 3,792 4,368
Recurring PAT 3,475 3,283 3,792 4,368
Total Equity 21,549 20,624 23,047 25,838
Gross Debt 4,865 3,865 3,865 3,363
Cash 3,783 2,520 5,338 8,156
Rs Per Share FY17A FY18E FY19E FY20E
Earnings 10.6 10.5 12.2 14.0
Book Value 66 66 74 83
Dividends 3.1 3.3 3.8 4.3
FCFF 11.8 12.8 13.0 14.8
P/E (x) 16.3 16.4 14.2 12.4
P/B (x) 2.6 2.6 2.3 2.1
EV/EBITDA (x) 8.6 8.8 7.4 6.2
ROE (%) 18 % 16 % 17 % 18 %
Core ROIC (%) 18 % 17 % 19 % 22 %
EBITDA Margin (%) 28 % 27 % 28 % 28 %
Net Margin (%) 15 % 14 % 15 % 16 %

Jagran Prakashan Limited Absolute – LONG Relative – Overweight 15% ATR in 14 Months
January 31, 2018 Analysts: Depesh Kashyap, CFA (+91-7228934327)/ Harshit Patel (+91 9825406497) Page 2 of 12
Quarterly trends in charts
Exhibit 1: Print advertising growth was weak this quarter
Source: Company, Equirus Securities
Exhibit 2: Circulation growth was flattish due to a drop in cover prices
Source: Company, Equirus Securities
Exhibit 3: EBITDA margins recovered post a dismal show in last quarter
Source: Company, Equirus Securities
Exhibit 4: Other publications (excl. Dainik Jagran) had better profitability
Source: Company, Equirus Securities
3,141
2,730
3,122 3,127
3,474
3,053
3,334 3,229
3,521
3,206
3,465 3,256
3,435
4.7%
3.1%
8.4% 9.1%
10.6%
11.8%
6.8%
3.3%
1.4%
5.0% 3.9%
0.8%
-2.4%
-4%
-2%
0%
2%
4%
6%
8%
10%
12%
14%
0
500
1000
1500
2000
2500
3000
3500
4000
Q315 Q415 Q116 Q216 Q316 Q416 Q117 Q217 Q317 Q417 Q118 Q218 Q318
Advertisement revenues (Rs mn) Ad growth (y-o-y %)(RHS)
942
922
945 939
959
999 1,003
993
1,025 1,034
1,018
996
1,030
9.4%
7.2%
5.4%
3.4%
1.7%
8.4%
6.2% 5.8%
6.9%
3.4%
1.4%
0.3% 0.5%
0%
1%
2%
3%
4%
5%
6%
7%
8%
9%
10%
860
880
900
920
940
960
980
1000
1020
1040
1060
Q315 Q415 Q116 Q216 Q316 Q416 Q117 Q217 Q317 Q417 Q118 Q218 Q318
Circulation revenues ( Rs mn) Circulation growth (y-o-y %)
1034
1261
1034
1233 1241
1401
1118
1307 1214
1549
1196
1328
1105
1362 25%
29%
26%
28% 29% 30%
26% 28%
26% 31% 26%
27%
24% 27%
0%
5%
10%
15%
20%
25%
30%
35%
0
200
400
600
800
1000
1200
1400
1600
1800
Q215 Q315 Q415 Q116 Q216 Q316 Q416 Q117 Q217 Q317 Q417 Q118 Q218 Q318
EBITDA ( Rs mn) EBITDA margins(%)
72
-13
69 70 100 45 82 21 117 86 90 50 76
8.2%
-1.7%
8.7% 8.8%
11.5%
5.5%
9.8%
2.5%
13.0%
10.3% 10.1%
5.8%
8.6%
-4%
-2%
0%
2%
4%
6%
8%
10%
12%
14%
-20
0
20
40
60
80
100
120
140
Q315 Q415 Q116 Q216 Q316 Q416 Q117 Q217 Q317 Q417 Q118 Q218 Q318
Operating profit ( Rs mn) Operating margin(%) (RHS)

Jagran Prakashan Limited Absolute – LONG Relative – Overweight 15% ATR in 14 Months
January 31, 2018 Analysts: Depesh Kashyap, CFA (+91-7228934327)/ Harshit Patel (+91 9825406497) Page 3 of 12
Conference call highlights
Business Overview
Management believes that IRS 2017 has provided reliable measurement to the
advertisers. Investment in growing circulation has paid up for Dainik Jagran as it has
maintained its no 1 position which augurs well for future revenues.
Dainik Jagran has become no 1 in Haryana and Patna for the first time while
maintained its no 1 position in UP and NCR. Also, Nai Dunia has become one of top10
dailies of the country.
Average Issue Readership for Dainik Jagran has increased to ~22mn from ~16.4mn
five years ago. AIR growth potential is not seen across the market; it depends on the
existing penetration levels in a particular market. In UP overall AIR growth should
have been ~20-25%.
Share of Gov advertisement for the company is ~20%.
IRS numbers will make a big impact on ad rates as all leading national advertising
agencies rely on it; big local clients are also looking into numbers (however impact
won’t be as much as for national advertisers). ~40-50% of advertising revenues come
from advertisers who will take this data seriously
Standalone Print advertising revenue has declined by ~2% in 3QFY18. Main reasons
for the same would be loss of revenues from political parties/Government (to the
tune of ~Rs. 150mn) which was there last year and split of festive season.
Ad yields were better on yoy basis whereas volumes have declined by ~5-6% in
3QFY18.
Circulation revenues remained flattish (vs. growth of ~1.5% in 1QFY18 and ~1% in
2QFY18). However, company saw improvement in per copy realization for all
newspaper brands in 3QFY18. Management believes that the era of dropping cover
prices seems to be over and they would be improving realizations in coming quarters.
Dainik Jagran’s standalone circulation is ~4.1mn and all other brands put together
circulation is ~0.3-0.4mn.
Real estate sector is doing well in the geographies that company operates in. FMCG
category has started to do better however Pharma has not shown much growth after
the demonetization. Government advertisement should improve in FY19 due to
central elections related advertisements.
Other publications (Midday, Naidunia, I-Next, Punjabi Jagran, Sakhi) and Radio
Other publications registered a revenue decline of ~2% yoy in 3Q18 (vs. growth of
~5% in 2QFY18). Operating margins also shrunk to ~8.6% (-442bps/+278bps on
yoy/qoq basis). Management expects Mid-day and Nai Dunia to do better going
ahead.
Company has been formulating strategy to grow circulation of Nai Dunia in MP; they
are getting good traction in Bhopal and Indore.
Sharp decline in Mid-day advertising revenues (-15%) was due to two reasons: (a)
festive season was broken up, (b) last October was an exceptionally good month for
Mid-day (its highest ever ad revenues). Advertising growth in Nov-Dec was ~18-20%.
Radio business in 3QFY18 outperformed the industry to grow by ~5% in 3QFY18.
Newsprint Prices
Domestic newsprint prices would increase by ~6-7% in FY19 whereas imported
newsprint prices would increase ~25-30%. On a blended level newsprint cost should
increase by ~10-12% in FY19.
Company will suffer more as they had tied up quantities for nearly one and a half
year therefore they were not impacted recently.

Jagran Prakashan Limited Absolute – LONG Relative – Overweight 15% ATR in 14 Months
January 31, 2018 Analysts: Depesh Kashyap, CFA (+91-7228934327)/ Harshit Patel (+91 9825406497) Page 4 of 12
Valuation and risks
JPL is currently trading at a PE multiple of 14x and an EV/EBITDA multiple of 7x on our
FY19E estimates.
We continue to prefer sum-of-the-parts (SOTP) methodology to value the company, and
value the standalone and radio business separately. JPL has always traded in the
EV/EBITDA range of 8x-12x. To the print business, we have ascribed a TTM EV/EBITDA
multiple of 9x to our TTM Mar’19 EBITDA estimate of Rs 5,801m to derive the equity
value of Rs 52,079mn. We have applied a 40% holding value discount to our Music
Broadcast Ltd’s valuation.
Exhibit 5 below illustrates the step-by-step process followed to derive our Mar’19 TP of
Rs 200.
Exhibit 1: Target price derivation through SOTP valuation
Jagran (Rs mn) EBITDA
(TTM Mar’19) Multiple Valuation
Standalone 5,801 9x 49,877
(-) Total debt
1,400
(+) Total Cash
3,592
Equity value(1)
52,079
Radio City Valuation
23,282
JPL holding
70.58%
Equity value(2)
16,433
Holding company discount
40%
Net equity value
9,860
Equity value
61,938
Outstanding shares (mn)
311.4
Target price(Rs) (rounded)
200
Source: Company, Equirus Securities
Key downside risks
Another economic slowdown to lead to below-expected growth in advertising
revenue: A slowdown in the economy can result in lower than expected media
spends by corporate, which can negatively impact advertising revenue.
Higher than expected increase in newsprint costs to hurt operating margins:
Newsprint prices account for 30-40% of total sales and 40-50% of total costs.
Newsprint prices are strongly correlated to crude oil prices, which have been rising
of late. Rising RM costs may put some stress on operating margins.
Rising competition: JPL operates in a highly competitive environment, with two or
three players present in most of the states. The company would come under stress if
competitors cut cover prices or reduce advertisement rates to gain market share.

Jagran Prakashan Limited Absolute – LONG Relative – Overweight 15% ATR in 14 Months
January 31, 2018 Analysts: Depesh Kashyap, CFA (+91-7228934327)/ Harshit Patel (+91 9825406497) Page 5 of 12
Quarterly performance, consolidated
Rs Mn 3QFY18 3QFY18E 2QFY18 3QFY17 % Change
Comments 3QFY18E 2QFY18 3QFY17
Net Sales 5,981 6,392 5,665 6,016 -6% 6% -1%
Consumption of raw materials 1,691 1,761 1,652 1,664 -4% 2% 2%
Employees cost 990 1,005 999 958 -1% -1% 3%
Other expenditure 1,617 1,831 1,574 1,479 -12% 3% 9%
License fees 54
54 50
0% 9%
Total Expenditures 4352 4597 4279 4151 -5% 2% 5%
EBITDA 1629 1794 1386 1866 -9% 17% -13%
Depreciation 343 329 340 329 4% 1% 4%
EBIT 1,286 1,465 1,046 1,537 -12% 23% -16%
Interest 76 73 74 89 4% 2% -15%
Other Income 108 124 125 78 -13% -14% 38%
PBT 1,318 1,516 1,098 1,526 -13% 20% -14%
Tax 446 507 375 546 -12% 19% -18%
PAT before MI & Associates 872 1009 722 980 -14% 21% -11%
Minority Interest -25 -28 -27 -7 -11% -9% 268%
Profit from Assoc. 0 0 0 1
-54% -112%
Recurring PAT 848 981 695 974 -14% 22% -13%
Extraordinaries 0 0 0 0
Reported PAT 848 981 695 974 -14% 22% -13%
EPS (Rs) 2.80 3.15 2.32 3.00 -11% 21% -7%
EBITDA Margin 27.2% 28.1% 24.5% 31.0% -84 bps 277 bps -378 bps
EBIT Margin 22% 23% 18% 26% -143 bps 303 bps -404 bps
PBT Margin 22% 24% 19% 25% -168 bps 266 bps -332 bps
PAT Margin 14% 15% 12% 16% -117 bps 190 bps -202 bps
Tax Rate 34% 33% 34% 36% 34 bps -37 bps -196 bps

Jagran Prakashan Limited Absolute – LONG Relative – Overweight 15% ATR in 14 Months
January 31, 2018 Analysts: Depesh Kashyap, CFA (+91-7228934327)/ Harshit Patel (+91 9825406497) Page 6 of 12
Company Snapshot
How we differ from Consensus
- Equirus Consensus % Diff Comment
EPS FY18E 10.5 11.5 -8 % Consensus numbers have not been
updated yet. FY19E 12.2 13.4 -9 %
Sales FY18E 23,607 24,120 -2 %
FY19E 25,682 26,337 -2 %
PAT FY18E 3,283 3,615 -9 %
FY19E 3,792 4,224 -10 %
Key Estimates (Standalone):
Particulars FY17 FY18E FY19E FY20E
Ad revenue (in Rs mn) 13,291 13,620 14,918 16,355
Circulation revenue(in Rs mn) 4,055 4,093 4,217 4,344
Revenue from digital excl. ads(in Rs mn) 19 21 23 25
OOH and event mgmt business(in Rs mn) 1,242 1,341 1,528 1,681
Risk to Our View:
1. Slowdown in economy
2. Newsprint prices rising more than expected
Key Triggers
Revival in advertisement growth
Declaration of dividends or some strategic acquisition
DCF Valuations & Assumptions
Rf Beta Ke Term. Growth Debt/IC in Term. Yr
6.8 % 0.8 11.3 % 2.5 % 10.0 %
- FY18E FY19E FY20-22E FY23-27E FY28-32E
Sales Growth 3 % 9 % 8 % 7 % 7 %
NOPAT Margin 14 % 15 % 15 % 15 % 15 %
IC Turnover 1.21 1.33 1.56 1.61 1.61
RoIC 16.9 % 19.2 % 24.3 % 25.0 % 25.0 %
Years of strong growth 1 2 5 10 15
Valuation as on date (Rs) 139 160 194 208 221
Valuation as of 31st Mar'19 153 176 214 230 244
Based on DCF, we derive 31st Mar’19 fair value of Rs 244.
Company Description:
Jagran Prakashan Ltd (JPL) is a media conglomerate with interests spanning across Print,
FM Radio, OOH, Activation & Digital covers all of India as its footprint – and is amongst
one of the largest media conglomerates in the country. Jagran group publishes 12 print
titles in 5 different languages spread across 15 states with over 100 editions and these
include some veritable titles as the World's largest read daily, India's No.1 compact
daily, India's No.1 Afternoon daily, and India's No.1 Urdu daily.
Comparable valuation Mkt Cap
Rs. Mn.
Price
Target
Target
Date
EPS P/E BPS P/B RoE Div Yield
Company Reco. CMP FY17A FY18E FY19E FY17A FY18E FY19E FY17A FY18E FY17A FY18E FY19E FY17A FY18E
Jagran Prakashan LONG 173 53,999 200 31st Mar'19 10.6 10.5 12.2 16.3 16.4 14.2 65.9 2.6 18 % 16 % 17 % 1.7 % 1.8 %
DBCL LONG 326 59,992 430 31st Mar'19 20.2 19.0 22.9 16.1 17.2 14.3 86.7 3.5 25 % 21 % 23 % 1.5 % 3.5 %
HMVL LONG 252 18,521 330 31st Mar'19 25.8 24.4 28.6 9.8 10.4 8.8 159.0 1.4 18 % 14 % 15 % 0.5 % 0.5 %
Particulars FY11 FY12 FY13 FY14E FY15E FY16E
ADHO Revenue (Rs Mn) 3,432 4,443 5,771 6,381 7,270 8,397
Nomark (Rs Mn) - - - 148 400 600
EBITDA (Rs Mn) 1,089 1,166 1,729 1,848 2,102 2,460
EBITDA Margin (%) 30.3% 24.6% 28.5% 27.2% 26.2% 26.3%
PAT (Rs Mn) 1,031 1,201 1,674 1,473 1,439 1,752
PAT Margin (%) 28.7% 25.4% 27.6% 21.7% 18.0% 18.7%

Jagran Prakashan Limited Absolute – LONG Relative – Overweight 15% ATR in 14 Months
January 31, 2018 Analysts: Depesh Kashyap, CFA (+91-7228934327)/ Harshit Patel (+91 9825406497) Page 7 of 12
Consolidated Quarterly Earnings Forecast and Key Drivers Rs in Mn 1Q17A 2Q17A 3Q17A 4Q17A 1Q18A 2Q18A 3Q18A 4Q18E 1Q19E 2Q19E 3Q19E 4Q19E FY17A FY18E FY19E FY20E
Revenue 5,644 5,548 6,016 5,620 5,913 5,665 5,981 6,048 6,398 6,163 6,602 6,519 22,830 23,607 25,682 27,942 Consumption of raw materials 1,693 1,612 1,664 1,555 1,698 1,652 1,691 1,680 1,795 1,711 1,814 1,968 6,525 6,720 7,288 7,774
Employees cost 898 929 958 954 992 999 990 1,006 1,050 1,076 1,059 1,081 3,740 3,987 4,266 4,614
Other expenditure 1,495 1,476 1,479 1,670 1,611 1,574 1,617 1,626 1,693 1,638 1,750 1,722 5,977 6,376 6,803 7,359
- - - - - - - - - - - - - - - - -
- - - - - - - - - - - - - - - - - EBITDA 1,558 1,531 1,866 1,441 1,613 1,386 1,629 1,683 1,801 1,679 1,920 1,692 6,396 6,310 7,092 7,929 Depreciation 302 308 329 351 328 340 343 339 356 356 356 356 1,289 1,350 1,424 1,464 EBIT 1,257 1,223 1,537 1,090 1,285 1,046 1,286 1,344 1,445 1,323 1,564 1,336 5,107 4,961 5,668 6,465 Interest 102 78 89 81 72 74 76 80 58 58 58 58 350 302 232 232 Other Income 93 112 78 128 120 125 108 117 128 128 128 128 412 470 513 677 PBT 1,248 1,257 1,526 1,138 1,333 1,098 1,318 1,381 1,516 1,394 1,634 1,406 5,168 5,129 5,949 6,910 Tax 407 396 546 327 446 375 446 477 515 474 556 478 1,675 1,744 2,023 2,349 PAT bef. MI & Assoc. 841 861 980 811 887 722 872 903 1,000 919 1,078 929 3,493 3,385 3,926 4,561 Minority Interest 3 8 7 0 22 27 25 29 34 34 34 34 18 102 135 193 Profit from Assoc. 0 0 1 0 0 0 0 0 0 0 0 0 1 0 0 0 Recurring PAT 838 853 974 811 866 695 848 875 967 886 1,044 895 3,475 3,283 3,792 4,368 Extraordinaries 0 0 0 0 0 0 0 0 0 0 0 0 0 0 0 0 Reported PAT 838 853 974 811 866 695 848 875 967 886 1,044 895 3,475 3,283 3,792 4,368
EPS (Rs) 2.57 2.63 3.00 2.48 2.82 2.32 2.80 2.81 3.10 2.84 3.35 2.87 10.63 10.54 12.18 14.03
Key Drivers
- - - - - - - - - - - - - - - - - - - - - - - - - - - - - - - - - - - - - - - - - - - - - - - - - - - - - - - - - - - - - - - - - - - - - - - - - - - - - - - - - - - - -
- - - - - - - - - - - - - - - - -
Sequential Growth (%)
Revenue 7 % -2 % 8 % -7 % 5 % -4 % 6 % 1 % 6 % -4 % 7 % -1 % - - - - Consumption of raw materials 8 % -5 % 3 % -7 % 9 % -3 % 2 % -1 % 7 % -5 % 6 % 8 % - - - - EBITDA 15 % -2 % 22 % -23 % 12 % -14 % 17 % 3 % 7 % -7 % 14 % -12 % - - - - EBIT 13 % -3 % 26 % -29 % 18 % -19 % 23 % 5 % 8 % -8 % 18 % -15 % - - - - Recurring PAT 5 % 2 % 14 % -17 % 7 % -20 % 22 % 3 % 11 % -8 % 18 % -14 % - - - -
EPS 4 % 2 % 14 % -17 % 14 % -18 % 21 % 0 % 11 % -8 % 18 % -14 % - - - -
Yearly Growth (%)
Revenue 17 % 7 % 4 % 6 % 5 % 2 % -1 % 8 % 8 % 9 % 10 % 8 % 10 % 3 % 9 % 9 % EBITDA 16 % 4 % 8 % 6 % 3 % -9 % -13 % 17 % 12 % 21 % 18 % 1 % 8 % -1 % 12 % 12 % EBIT 13 % 3 % 7 % -2 % 2 % -14 % -16 % 23 % 12 % 26 % 22 % -1 % 9 % -3 % 14 % 14 % Recurring PAT 7 % 11 % 4 % 1 % 3 % -19 % -13 % 8 % 12 % 27 % 23 % 2 % 14 % -6 % 15 % 15 %
EPS -54 % -7 % 4 % 0 % 10 % -12 % -7 % 13 % 10 % 23 % 20 % 2 % 13 % -1 % 15 % 15 %
Margin (%)
EBITDA 28 % 28 % 31 % 26 % 27 % 24 % 27 % 28 % 28 % 27 % 29 % 26 % 28 % 27 % 28 % 28 % EBIT 22 % 22 % 26 % 19 % 22 % 18 % 22 % 22 % 23 % 21 % 24 % 20 % 22 % 21 % 22 % 23 % PBT 22 % 23 % 25 % 20 % 23 % 19 % 22 % 23 % 24 % 23 % 25 % 22 % 23 % 22 % 23 % 25 %
PAT 15 % 15 % 16 % 14 % 15 % 12 % 14 % 14 % 15 % 14 % 16 % 14 % 15 % 14 % 15 % 16 %

Jagran Prakashan Limited Absolute – LONG Relative – Overweight 15% ATR in 14 Months
January 31, 2018 Analysts: Depesh Kashyap, CFA (+91-7228934327)/ Harshit Patel (+91 9825406497) Page 8 of 12
Consolidated Financials
P&L (Rs Mn) FY17A FY18E FY19E FY20E
Balance Sheet (Rs Mn) FY17A FY18E FY19E FY20E
Cash Flow (Rs Mn) FY17A FY18E FY19E FY20E
Revenue 22,830 23,607 25,682 27,942 Equity Capital 654 623 623 623 PBT 5,169 5,129 5,949 6,910
Op. Expenditure 16,434 17,297 18,590 20,013 Reserve 20,895 20,001 22,424 25,215 Depreciation 1,289 1,350 1,424 1,464
EBITDA 6,396 6,310 7,092 7,929 Networth 21,549 20,624 23,047 25,838 Others 131 -169 -281 -445
Depreciation 1,289 1,350 1,424 1,464 Long Term Debt 1,334 1,334 1,334 832 Taxes Paid -1,388 -1,744 -2,023 -2,349
EBIT 5,107 4,961 5,668 6,465 Def Tax Liability 2,141 2,141 2,141 2,141 Change in WC -427 59 -483 -457
Interest Expense 350 302 232 232 Minority Interest 2,363 2,465 2,600 2,793 Operating C/F 4,774 4,625 4,586 5,123
Other Income 412 470 513 677 Account Payables 1,467 1,436 1,478 1,576 Capex -1,145 -850 -680 -670
PBT 5,168 5,129 5,949 6,910 Other Curr Liabi 3,531 2,531 2,531 2,531 Change in Invest -3,109 0 0 0
Tax 1,675 1,744 2,023 2,349 Total Liabilities & Equity 32,386 30,532 33,131 35,711 Others 61 470 513 677
PAT bef. MI & Assoc. 3,493 3,385 3,926 4,561 Net Fixed Assets 14,919 14,419 13,675 12,882 Investing C/F -4,193 -379 -167 7
Minority Interest 18 102 135 193 Capital WIP 759 759 759 759 Change in Debt -2,212 -1,000 0 -502
Profit from Assoc. 1 0 0 0 Others 5,864 5,864 5,864 5,864 Change in Equity 4,000 -3,023 0 0
Recurring PAT 3,475 3,283 3,792 4,368
Inventory 935 829 898 958 Others -1,157 -1,487 -1,601 -1,809
Extraordinaires 0 0 0 0 Account Receivables 5,158 5,174 5,629 6,124 Financing C/F 631 -5,510 -1,601 -2,311
Reported PAT 3,475 3,283 3,792 4,368 Other Current Assets 967 967 967 967 Net change in cash 1,212 -1,264 2,818 2,818
FDEPS (Rs) 10.6 10.5 12.2 14.0 Cash 3,783 2,520 5,338 8,156 RoE (%) 18 % 16 % 17 % 18 %
DPS (Rs) 3.1 3.3 3.8 4.3 Total Assets 32,386 30,532 33,131 35,711
RoIC (%) 14 % 12 % 14 % 15 %
CEPS (Rs) 14.6 14.9 16.7 18.7 Non-cash Working Capital 2,062 3,003 3,486 3,943
Core RoIC (%) 18 % 17 % 19 % 22 %
FCFPS (Rs) 11.8 12.8 13.0 14.8 Cash Conv Cycle 33.0 46.4 49.5 51.5 Div Payout (%) 34 % 36 % 36 % 36 %
BVPS (Rs) 65.9 66.2 74.0 83.0 WC Turnover 11.1 7.9 7.4 7.1 P/E 16.3 16.4 14.2 12.4
EBITDAM (%) 28 % 27 % 28 % 28 % FA Turnover 1.5 1.6 1.8 2.0 P/B 2.6 2.6 2.3 2.1
PATM (%) 15 % 14 % 15 % 16 % Net D/E -0.1 -0.1 -0.2 -0.3 P/FCFF 14.7 13.6 13.3 11.7
Tax Rate (%) 32 % 34 % 34 % 34 % Revenue/Capital Employed 0.9 0.8 0.9 0.9 EV/EBITDA 8.6 8.8 7.4 6.2
Sales Growth (%) 10 % 3 % 9 % 9 %
Capital Employed/Equity 1.4 1.3 1.3 1.3
EV/Sales 2.4 2.3 2.0 1.8
FDEPS Growth (%) 13 % -1 % 15 % 15 %
Dividend Yield (%) 1.7 % 1.8 % 2.1 % 2.4 %
TTM P/E vs. 2 yr forward EPS growth TTM EV/EBITDA vs. 2 yr forward EBITDA growth TTM P/B vs. 2 yr forward RoE
5x
10x
15x
20x
25x
-10%
0%
10%
20%
30%
40%
050
100150200250300350400
Sep
/09
Mar
/10
Sep
/10
Mar
/11
Sep
/11
Mar
/12
Sep
/12
Mar
/13
Sep
/13
Mar
/14
Sep
/14
Mar
/15
Sep
/15
Mar
/16
Sep
/16
Mar
/17
Sep
/17
Mar
/18
Sep
/18
Mar
/19
EPS Growth
-20%-10%0%10%20%30%40%50%60%
0
20000
40000
60000
80000
100000
120000
Sep
/09
Mar
/10
Sep
/10
Mar
/11
Sep
/11
Mar
/12
Sep
/12
Mar
/13
Sep
/13
Mar
/14
Sep
/14
Mar
/15
Sep
/15
Mar
/16
Sep
/16
Mar
/17
Sep
/17
Mar
/18
Sep
/18
Mar
/19
5x
8x
10x
12x
15xEBITDA Growth
0%5%10%15%20%25%30%35%40%
050
100150200250300350400450
Sep/
09
Mar
/10
Sep/
10
Mar
/11
Sep/
11
Mar
/12
Sep/
12
Mar
/13
Sep/
13
Mar
/14
Sep/
14
Mar
/15
Sep/
15
Mar
/16
Sep/
16
Mar
/17
Sep/
17
Mar
/18
Sep/
18
Mar
/19
RoE
1x
2x
3x
4x
5x
Jagran Prakashan Limited Absolute – LONG Relative – Overweight 15% ATR in 14 Months
January 31, 2018 Analysts: Depesh Kashyap, CFA (+91-7228934327)/ Harshit Patel (+91 9825406497) Page 9 of 12
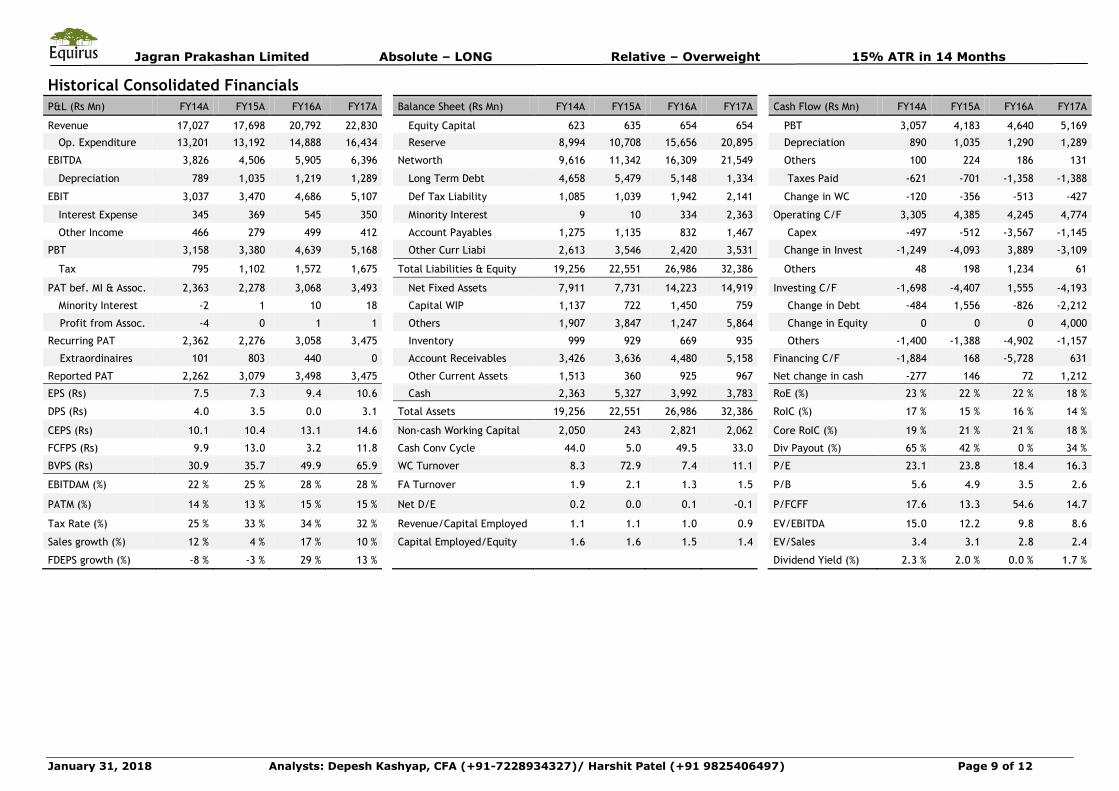
Historical Consolidated Financials
P&L (Rs Mn) FY14A FY15A FY16A FY17A
Balance Sheet (Rs Mn) FY14A FY15A FY16A FY17A
Cash Flow (Rs Mn) FY14A FY15A FY16A FY17A
Revenue 17,027 17,698 20,792 22,830 Equity Capital 623 635 654 654 PBT 3,057 4,183 4,640 5,169
Op. Expenditure 13,201 13,192 14,888 16,434 Reserve 8,994 10,708 15,656 20,895 Depreciation 890 1,035 1,290 1,289
EBITDA 3,826 4,506 5,905 6,396 Networth 9,616 11,342 16,309 21,549 Others 100 224 186 131
Depreciation 789 1,035 1,219 1,289 Long Term Debt 4,658 5,479 5,148 1,334 Taxes Paid -621 -701 -1,358 -1,388
EBIT 3,037 3,470 4,686 5,107 Def Tax Liability 1,085 1,039 1,942 2,141 Change in WC -120 -356 -513 -427
Interest Expense 345 369 545 350 Minority Interest 9 10 334 2,363 Operating C/F 3,305 4,385 4,245 4,774
Other Income 466 279 499 412 Account Payables 1,275 1,135 832 1,467 Capex -497 -512 -3,567 -1,145
PBT 3,158 3,380 4,639 5,168 Other Curr Liabi 2,613 3,546 2,420 3,531 Change in Invest -1,249 -4,093 3,889 -3,109
Tax 795 1,102 1,572 1,675 Total Liabilities & Equity 19,256 22,551 26,986 32,386 Others 48 198 1,234 61
PAT bef. MI & Assoc. 2,363 2,278 3,068 3,493 Net Fixed Assets 7,911 7,731 14,223 14,919 Investing C/F -1,698 -4,407 1,555 -4,193
Minority Interest -2 1 10 18 Capital WIP 1,137 722 1,450 759 Change in Debt -484 1,556 -826 -2,212
Profit from Assoc. -4 0 1 1 Others 1,907 3,847 1,247 5,864 Change in Equity 0 0 0 4,000
Recurring PAT 2,362 2,276 3,058 3,475 Inventory 999 929 669 935 Others -1,400 -1,388 -4,902 -1,157
Extraordinaires 101 803 440 0 Account Receivables 3,426 3,636 4,480 5,158 Financing C/F -1,884 168 -5,728 631
Reported PAT 2,262 3,079 3,498 3,475 Other Current Assets 1,513 360 925 967 Net change in cash -277 146 72 1,212
EPS (Rs) 7.5 7.3 9.4 10.6 Cash 2,363 5,327 3,992 3,783
RoE (%) 23 % 22 % 22 % 18 %
DPS (Rs) 4.0 3.5 0.0 3.1
Total Assets 19,256 22,551 26,986 32,386
RoIC (%) 17 % 15 % 16 % 14 %
CEPS (Rs) 10.1 10.4 13.1 14.6 Non-cash Working Capital 2,050 243 2,821 2,062 Core RoIC (%) 19 % 21 % 21 % 18 %
FCFPS (Rs) 9.9 13.0 3.2 11.8 Cash Conv Cycle 44.0 5.0 49.5 33.0 Div Payout (%) 65 % 42 % 0 % 34 %
BVPS (Rs) 30.9 35.7 49.9 65.9 WC Turnover 8.3 72.9 7.4 11.1
P/E 23.1 23.8 18.4 16.3
EBITDAM (%) 22 % 25 % 28 % 28 % FA Turnover 1.9 2.1 1.3 1.5 P/B 5.6 4.9 3.5 2.6
PATM (%) 14 % 13 % 15 % 15 % Net D/E 0.2 0.0 0.1 -0.1 P/FCFF 17.6 13.3 54.6 14.7
Tax Rate (%) 25 % 33 % 34 % 32 % Revenue/Capital Employed 1.1 1.1 1.0 0.9 EV/EBITDA 15.0 12.2 9.8 8.6
Sales growth (%) 12 % 4 % 17 % 10 %
Capital Employed/Equity 1.6 1.6 1.5 1.4
EV/Sales 3.4 3.1 2.8 2.4
FDEPS growth (%) -8 % -3 % 29 % 13 %
Dividend Yield (%) 2.3 % 2.0 % 0.0 % 1.7 %

Jagran Prakashan Limited Absolute – LONG Relative – Overweight 15% ATR in 14 Months
January 31, 2018 Analysts: Depesh Kashyap, CFA (+91-7228934327)/ Harshit Patel (+91 9825406497) Page 10 of 12
Equirus Securities
Research Analysts Sector/Industry E-mail
Equity Sales E-mail
Abhishek Shindadkar IT Services [email protected] 91-22-43320643 VishadTurakhia [email protected] 91-22-43320633
AshutoshTiwari Auto, Metals & Mining [email protected] 91-79-61909517 SubhamSinha [email protected] 91-22-43320631
Depesh Kashyap Mid-Caps [email protected] 91-79-61909528 SwetaSheth [email protected] 91-22-43320634
DevamModi Power & Infrastructure [email protected] 91-79-61909516 Viral Desai [email protected] 91-22-43320635
DhavalDama FMCG, Mid-Caps [email protected] 91-79-61909518 Rushabh Shah [email protected] 91-22-43320632
Manoj Gori Consumer Durables [email protected] 91-79-61909523 Dealing Room E-mail
Maulik Patel Oil and Gas [email protected] 91-79-61909519 Ashish Shah [email protected] 91-22-43320662
PrafulBohra Pharmaceuticals [email protected] 91-79-61909532 IleshSavla [email protected] 91-22-43320666
Rohan Mandora Banking & Financial Services [email protected] 91-79-61909529 Manoj Kejriwal [email protected] 91-22-43320663
Associates E-mail Dharmesh Mehta [email protected] 91-22-43320661
Ankit Choudhary [email protected] 91-79-61909533 SandipAmrutiya [email protected] 91-22-43320660
Bharat Celly [email protected] 91-79-61909524 Compliance Officer E-mail
Harshit Patel [email protected] 91-79-61909522 Jay Soni [email protected] 91-79-61909561
Meet Chande [email protected] 91-79-61909513 Corporate Communications E-mail
Nishant Bagrecha [email protected] 91-79-61909526 MahdokhtBharda [email protected] 91-22-43320647
ParvaSoni [email protected] 91-79-61909521
Pranav Mehta [email protected] 91-79-61909514
RonakSoni [email protected] 91-79-61909525
Samkit Shah [email protected] 91-79-61909520
ShreepalDoshi [email protected] 91-79-61909541
VarunBaxi [email protected] 91-79-61909595
Vikas Jain [email protected] 91-79-61909531
Rating & Coverage Definitions: Absolute Rating • LONG : Over the investment horizon, ATR >= Ke for companies with Free Float market cap >Rs 5 billion and ATR>= 20% for rest of the companies • ADD: ATR >= 5% but less than Ke over investment horizon • REDUCE: ATR >= negative 10% but <5% over investment horizon • SHORT: ATR < negative 10% over investment horizon Relative Rating • OVERWEIGHT: Likely to outperform the benchmark by at least 5% over investment horizon • BENCHMARK: likely to perform in line with the benchmark • UNDERWEIGHT: likely to under-perform the benchmark by at least 5% over investment horizon Investment Horizon Investment Horizon is set at a minimum 3 months to maximum 18 months with target date falling on last day of a calendar quarter. Lite vs. Regular Coverage vs. Spot Coverage We aim to keep our rating and estimates updated at least once a quarter for Regular Coverage stocks. Generally, we would have access to the company and we would maintain detailed financial model for Regular coverage companies. We intend to publish updates on Lite coverage stocks only an opportunistic basis and subject to our ability to contact the management. Our rating and estimates for Lite coverage stocks may not be current. Spot coverage is meant for one-off coverage of a specific company and in such cases, earnings forecast and target price are optional. Spot coverage is meant to stimulate discussion rather than provide a research opinion.
Registered Office: Equirus Securities Private Limited Unit No. 1201, 12th Floor, C Wing, Marathon Futurex, N M Joshi Marg, Lower Parel, Mumbai-400013. Tel. No: +91 – (0)22 – 4332 0600 Fax No:+91-(0)22 – 4332 0601
Corporate Office: 3rd floor, House No. 9, Magnet Corporate Park, Near Zydus Hospital, B/H Intas Sola Bridge, S.G. Highway Ahmedabad-380054 Gujarat Tel. No: +91 (0)79 - 6190 9550 Fax No:+91 (0)79 – 6190 9560
Jagran Prakashan Limited Absolute – LONG Relative – Overweight 15% ATR in 14 Months
January 31, 2018 Analysts: Depesh Kashyap, CFA (+91-7228934327)/ Harshit Patel (+91 9825406497) Page 11 of 12
© 2017 Equirus Securities Private Limited. All rights reserved. For Private Circulation only. This report or any portion hereof may not
be reprinted, sold or redistributed without the written consent of Equirus Securities Private Limited
Analyst Certification
I, Depesh Kashyap/Harshit Patel, author to this report, hereby certify that all of the views expressed in this report accurately reflect my personal views about the subject company or companies and its or their
securities. I also certify that no part of my compensation was, is or will be, directly or indirectly, related to the specific recommendations or views expressed in this report.
Disclosures
Equirus Securities Private Limited (ESPL) having Corporate Identification Number U65993MH2007PTC176044 is registered in India with Securities and Exchange Board of India (SEBI) as a trading member on the
Capital Market (Reg. No. INB231301731), Futures & Options Segment (Reg. No.INF231301731) of the National Stock Exchange of India Ltd. (NSE) and on Cash Segment (Reg. No.INB011301737) of Bombay Stock
Exchange Limited (BSE).ESPL is also registered with SEBI as Research Analyst under SEBI (Research Analyst) Regulations, 2014 (Reg. No. INH000001154), as a Portfolio Manager under SEBI (Portfolio Managers
Regulations, 1993 (Reg. No.INP000005216) and as a Depository Participant of the Central Depository Services (India) Limited (Reg. No.IN-DP-324-2017). There are no disciplinary actions taken by any regulatory
authority against ESPL. ESPL is a subsidiary of Equirus Capital Pvt. Ltd. (ECPL) which is registered with SEBI as Category I Merchant Banker and provides investment banking services including but not limited to
merchant banking services, private equity, mergers & acquisitions and structured finance.
As ESPL and its associates are engaged in various financial services business, it might have: - (a) received compensation (except in connection with the preparation of this report) from the subject company for
investment banking or merchant banking or brokerage services in the past twelve months;(b) managed or co-managed public offering of securities for the subject company in the past twelve months; or (c) have
received a mandate from the subject company; or (d) might have other financial, business or other interests in entities including the subject company (ies) mentioned in this Report. ESPL & its associates, their
directors and employees may from time to time have positions or options in the company and buy or sell the securities of the company (ies) mentioned herein. ESPL and its associates collectively do not own (in
their proprietary position) 1% or more of the equity securities of the subject company mentioned in the report as the last day of the month preceding the publication of the research report. ESPL or its Analyst or
Associates did not receive any compensation or other benefits from the companies mentioned in the report or third party in connection with preparation of the research report. Accordingly, neither ESPL nor
Research Analysts have any material conflict of interest at the time of publication of this report. Compensation of our Research Analysts is not based on any specific merchant banking, investment banking or
brokerage service transactions. ESPL has not been engaged in market making activity for the subject company.
The Research Analyst engaged in preparation of this Report:-
(a) has not received any compensation from the subject company in the past twelve months; (b) has not managed or co-managed public offering of securities for the subject company in the past twelve months; (c)
has not received any compensation for investment banking or merchant banking or brokerage services from the subject company in the past twelve months; (d) has not received any compensation for products or
services other than investment banking or merchant banking or brokerage services from the subject company in the past twelve months; (e) has not received any compensation or other benefits from the subject
company or third party in connection with the research report; (f) might have served as an officer, director or employee of the subject company; (g) is not engaged in market making activity for the subject
company.
This document is not directed or intended for distribution to, or use by, any person or entity who is a citizen or resident of or located in any locality, state, country or other jurisdiction, where such distribution,
publication, availability or use would be contrary to law, regulation or which would subject ESPL and affiliates to any registration or licensing requirement within such jurisdiction. The securities described herein
may or may not be eligible for sale in all jurisdictions or to a certain category of investors. Persons in whose possession of this document are required to inform themselves of, and to observe, such applicable
restrictions. Please delete this document if you are not authorized to view the same. By reading this document you represent and warrant that you have full authority and all rights necessary to view and read this
document without subjecting ESPL and affiliates to any registration or licensing requirement within such jurisdiction.
This document has been prepared solely for information purpose and does not constitute a solicitation to any person to buy, sell or subscribe any security. ESPL or its affiliates are not soliciting any action based on
this report. The information and opinions contained herein is from publicly available data or based on information obtained in good faith from sources believed to be reliable but ESPL provides no guarantee as to
its accuracy or completeness. The information contained herein is as on date of this report, and is subject to change or modification and any such changes could impact our interpretation of relevant information
contained herein. While we would endeavour to update the information herein on reasonable basis, ESPL and its affiliates, their directors and employees are under no obligation to update or keep the information
current. Also there may be regulatory, compliance, or other reasons that may prevent ESPL and its group companies from doing so. This document is prepared for assistance only and is not intended to be and must
not alone be taken as the basis for an investment decision. Each recipient of this document should make such investigations as it deems necessary to arrive at an independent evaluation of an investment in the
securities of companies referred to in this document including the merits and risks involved. This document is intended for general circulation and does not take into account the specific investment objectives,
financial situation or particular needs of any particular person. ESPL and its group companies, employees, directors and agents accept no liability, and disclaim all responsibility, for the consequences of you or
anyone else acting, or refraining to act, in reliance on the information contained in this publication or for any decision based on it. ESPL/its affiliates do and seek to do business with companies covered in its
research report. Thus, investors should be aware that the firm may have conflict of interest.

Jagran Prakashan Limited Absolute – LONG Relative – Overweight 15% ATR in 14 Months
January 31, 2018 Analysts: Depesh Kashyap, CFA (+91-7228934327)/ Harshit Patel (+91 9825406497) Page 12 of 12
A graph of daily closing prices of securities is available at http://www.nseindia.com/ChartApp/install/charts/mainpage.jsp and www.bseindia.com (Choose a company from the list on the browser and select the
“three years” period in the price chart).
Disclosure of Interest statement for the subject Company Yes/No If Yes, nature of such interest
Research Analyst’ or Relatives’ financial interest No
Research Analyst’ or Relatives’ actual/beneficial ownership of 1% or more No
Research Analyst’ or Relatives’ material conflict of interest No
Disclaimer for U.S. Persons
ESPL/its affiliates are not a registered broker–dealer under the U.S. Securities Exchange Act of 1934, as amended (the“1934 act”) and under applicable state laws in the United States. In addition Equirus is not a
registered investment adviser under the U.S. Investment Advisers Act of 1940, as amended (the "Advisers Act" and together with the 1934 Act, the “Acts”), and under applicable state laws in the United States.
Accordingly, in the absence of specific exemption under the Acts, any brokerage and investment services provided by Equirus, including the products and services described herein are not available to or intended
for U.S. persons. The information contained in this Report is not intended for any person who is a resident of the United States of America or a resident of any jurisdiction, the laws of which imposes prohibition on
soliciting the securities business in that jurisdiction without going through the registration requirements and/ or prohibit the use of any information contained in this report. This Report and its respective contents
do not constitute an offer or invitation to purchase or subscribe for any securities or solicitation of any investments or investment services and/or shall not be considered as an advertisement tool. "U.S. Persons"
are generally defined as a natural person, residing in the United States or any entity organized or incorporated under the laws of the United States. US Citizens living abroad may also be deemed "US Persons" under
certain rules.