sell - hdfcsec.com patil - 3qfy18 - hdfc sec... · kolte patil developers ltd. (kpdl) delivered...
TRANSCRIPT

RESULTS REVIEW 3QFY18 15 FEB 2018
Kolte Patil Developers SELL
HDFC securities Institutional Research is also available on Bloomberg HSLB <GO>& Thomson Reuters
Strong show Kolte Patil Developers Ltd. (KPDL) delivered strong 3QFY18 revenue growth of 17.8% YoY, lead by year end sales promotions in key projects viz. Life Republic, Ivy Estate, Western Avenue & Downtown. KPDL has achieved 0.6mn sqft of pre-sales during 3QFY18 and guided for sustaining the pre-sales momentum in Q4FY18E.
KPDL is aligning its product strategy with 3mn sqft of launches planned under 80IA in existing projects like Life Republic and Ivy Estate. KPDL has guided for 18-20% growth in pre-sales and top-line for FY19E on back of these initiatives.
KPDL has launches of 4mn sqft planned across the next few quarters. This shall result in pre-sales recovery from FY19E. Much of positive of (1) Affordable housing foray (2) BS deleveraging & (3) Asset monetization is already in price. Underlying real estate markets remain muted. We maintain SELL on KPDL with NAV based TP to Rs 312/sh.
Highlights of the Quarter
Partnership with KKR: KKR has committed Rs1.9bn in R1 sector of Life republic in the form of zero coupon debentures. KPDL has received 50% of the funds while the remainder is construction linked. As and when the 1/3rd inventory gets sold, the NCD balance on the books will start reducing and the profits will be booked as premium for NCDs. This deal has reduced net D/E to 0.34x vs 0.49x QoQ.
Divestment of land parcels: During 3QFY18 balance divestment of Wakad land parcel was completed. KPDL also exited Sanjivani project for Rs 500mn consideration, given the location was not ready to attract buyers at this point of time.
Annual Surplus to aid deleveraging: We expect KPDL to generate Rs 1.3-1.4bn/annum FCF which may be utilized towards balance sheet deleveraging.
Financial Summary* Year Ending March (Rs mn) 3QFY18 3QFY17 YoY (%) 2QFY18 QoQ (%) FY17E FY18E FY19E FY20E Net Sales 2,670 2,267 17.8 2,280 17.1 9,656 9,661 11,083 12,740 EBITDA 692 557 24.2 711 (2.6) 2,400 2,486 2,871 3,208 APAT 280 182 53.8 298 (6.1) 872 1,087 1,090 1,312 Diluted EPS (Rs) 3.7 2.4 53.8 3.9 (6.1) 11.5 14.3 14.4 17.3 P/E (x) 31.9 25.6 25.5 21.2 EV / EBITDA (x) 14.4 13.5 11.7 10.1 RoE (%) 10.6 12.0 10.9 12.0 Source: Company, HDFC sec Inst Research, * Consolidated
INDUSTRY REAL ESTATE
CMP (as on 14 Feb 2018) Rs 367
Target Price Rs 312 Nifty 10,501
Sensex 34,156
KEY STOCK DATA
Bloomberg KPDL IN
No. of Shares (mn) 76
MCap (Rs bn) / ($ mn) 28/434
6m avg traded value (Rs mn) 219
STOCK PERFORMANCE (%)
52 Week high / low Rs 405/100
3M 6M 12M
Absolute (%) 49.2 126.8 251.7
Relative (%) 45.8 117.3 231.2
SHAREHOLDING PATTERN (%)
Promoters 74.54
FIs & Local MFs 0.03
FPIs 10.68
Public & Others 14.75 Source : BSE
Parikshit Kandpal [email protected] +91-22-6171-7317
Kunal Bhandari [email protected] +91-22-6639-3035

KOLTE PATIL DEVELOPERS : RESULTS REVIEW 3QFY18
Page | 2
Quarterly Financial Snapshot (Consolidated) Particulars (Rs mn) 3QFY18 3QFY17 YoY (%) 2QFY18 QoQ (%) 9MFY18 9MFY17 YoY (%) Net Sales 2,670 2,267 17.8 2,280 17.1 7,415 6,330 17.1 Material Expenses (1,637) (1,429) 14.6 (1,300) 25.9 (4,507) (3,818) 18.1 Employee Expenses (98) (107) (8.4) (91) 7.9 (278) (282) (1.6) Other Operating Expenses (243) (174) 39.7 (179) 36.1 (637) (505) 26.2 EBITDA 692 557 24.2 711 (2.6) 1,993 1,725 15.5 Interest Cost (238) (216) 10.2 (249) (4.4) (719) (637) 12.8 Depreciation (33) (35) (5.7) (37) (10.1) (105) (106) (0.8) Other Income 41 9 355.6 24 72.3 85 41 107.6 PBT 462 315 46.7 449 3.0 1,255 1,023 22.6 Extraordinary Items (7) - - (11) (36.4) (22) - - Minority Interest (88) 22 (500.0) (5) 1,695.9 (115) 6 (2,013.3) Tax (87) (155) (43.9) (135) (35.4) (312) (471) (33.8) RPAT 280 182 53.8 298 (6.1) 805 558 44.3 Source: Company, HDFC sec Inst Research
Margin Analysis (Consolidated) MARGIN ANALYSIS 3QFY18 3QFY17 YoY (bps) 2QFY18 QoQ (bps) 9MFY18 9MFY17 YoY (bps) Material Expenses % Net Sales 61.3 63.0 (172) 57.0 429 60.8 60.3 47 Employee Expenses % Net Sales 3.7 4.7 (105) 4.0 (31) 3.7 4.5 (71) Other Operating Expenses % Net Sales 9.1 7.7 143 7.8 127 8.6 8.0 62 EBITDA Margin (%) 25.9 24.6 135 31.2 (525) 26.9 27.3 (37) Tax Rate (%) 18.8 49.2 (3,038) 30.0 (1,117) 24.9 46.0 (2,117) APAT Margin (%) 10.5 8.0 246 13.1 (259) 10.9 8.8 205 Source: Company, HDFC sec Inst Research
Pre – Sales Trend Pre-sales trend 3QFY18 3QFY17 YoY (%) 2QFY18 QoQ (%) 9MFY18 9MFY17 YoY (%) Sales Volume (mn sqft) 0.59 0.32 84.4 0.59 0.0 1.59 1.55 2.6 Sales Value (Rs mn) 3,283 1,948 68.5 3,337 (1.6) 9,194 8,940 2.8 Average Realization (Rs/sqft) 5,542 6,150 (9.9) 5,703 (2.8) 5,844 5,855 (0.2) Collections (Rs mn) 2,800 2,470 13.4 1,988 40.8 7,319 7,101 3.1 Source: Company, HDFC sec Inst Research
Adjusted revenue (Rs 2,670mn) *, EBIDTA ( Rs 692mn)* & Net Profit(Rs 280mn)* grew 17.8%, 24.2% & 53.8% YoY, ahead of our estimates by 11.4%, 16.8% & 39.2% respectively. *For 3QFY18 and 2QFY18, adjustments of Rs 1,610/213 mn in revenue and Rs 1,623/220 mn in material exp. relate to sale of Wakad land parcel monetization EBIDTA margins expanded 135bps YoY to 25.9% aided partly by an increasing contribution from Mumbai projects Net profit came in at Rs 280mn on account of lower interest costs/taxes Strong uptick of 13.4% YoY and 40.8% QoQ in collections seen in Q3 FY18 on the back of sale of ready-to-move-in inventory in Tuscan, Three Jewels and Ivy Estate to Rs 2.8bn. Product mix change led to 9.9% YoY declined in realization

KOLTE PATIL DEVELOPERS : RESULTS REVIEW 3QFY18
Page | 3
Surplus cashflows – to help deleverage balance sheet In the exhibit below, we highlight KPDL’s proforma
cashflows. We expect KDPL to achieve Rs 10-13bn of real estate collections annually. The spend on construction is pegged at Rs 5-7bn/annum. This will result in gross surplus of Rs 4-5bn from real estate operations
Employee cost and over head will consume about Rs 1.2-1.3bn annually whilst outgo on interest servicing shall be Rs 0.8-0.9bn. With limited outflow on
maintenance/new land capex, KPDL would be Rs 1.3-1.4bn/annum cash surplus.
KPDL doesn’t have any large maintenance/fixed assets capex and the company neither has big planned outlay on rental asset business. The current approval pipeline remains strong (~10.9mn sqft) and doesn’t require any aggressive land capex to be incurred.
The deleveraging efforts seem to be reasonable on back of strong real estate collections and limited capex.
Proforma Cashflows Rs mn FY17 FY18E FY19E FY20E Real Estate Collections 9,643 10,156 11,387 12,767 Construction Spend 5,100 5,610 6,339 7,227 Operating Cash flows - Dev Co 4,543 4,546 5,048 5,540 Employes+Other Expenses 1,175 1,191 1,310 1,441 Taxes 740 431 743 909 Total OCF 2,629 2,924 2,995 3,190 Less: Assets Capex - 100 100 100 Less: Land Capex/TDR’s 900 500 750 850 Net OCF 1,729 2,324 2,145 2,240 Less: Interest Outgo 950 950 969 988 FCFE 779 1,374 1,176 1,252 Other Income 82 98 103 108 Net Surplus 861 1,472 1,279 1,360 Source: Company, HDFC sec Inst Research
Strong collections and limited capex on land/rental/fixed assets to help deleverage balance sheet We expect KPDL to be net cash surplus annually by Rs 1.3-1.4bn

KOLTE PATIL DEVELOPERS : RESULTS REVIEW 3QFY18
Page | 4
NET D/E: – may have peaked – to remain at <0.5x (Rs mn) 4QFY16 1QFY17 2QFY17 3QFY17 4QFY17 1QY18 2QFY18 3QFY18 Comments Gross Debt 5,930 7,640 7,690 7,740 7,580 7,750 7,620 7,200
Structure NCD's (1,030) (1,970) (2,340) (2,340) (2,330) (2,290) (2,290) (3,040) Deducting NCD & CCD as they are equity structured as debt by KPDL and JVs. Increase on account of KKR NCD
Cash 820 680 431 820 730 (950) (830) (950) Current investments 30 400 236
Net debt 4,050 4,590 4,684 4,580 4,520 4,520 4,510 3,210
Debt reduction in 3QFY18 on back of KKR Zero Coupon NCD part amount receipt. This has been added to Structure NCD above
Net Worth 8,770 8,860 8,370 8,520 8,630 8,990 9,150 9,420 Net Debt/ equity (x) 0.46 0.52 0.56 0.54 0.52 0.50 0.49 0.34 Source: Company, HDFC sec Inst Research
Change in Estimates
FY18E New FY18E Old % Change Comments Pre-sales (mn sqft) 2.1 2.1 - Realization (Rs/sqft) 5,989 5,989 - Pre-sales (Rs mn) 12,306 12,306 -
Revenues (Rs mn) 9,661 9,661 - EBITDA (Rs mn) 2,486 2,486 -
APAT (Rs mn) 1,087 906 20.0 Effective tax rate rationalized at 28% considering Sec 80IB benefit for affordable projects
EPS (Rs) 14.3 12.0 20.0 Source: HDFC sec Inst Research
We expect consolidated Net D/E to remain <0.5x Cash surplus to be utilized towards debt reduction We have raised our FY18E APAT and EPS estimates on account of Effective tax rate rationalization to 28% considering Sec 80IB benefit for affordable projects We have maintained our estimates for FY19E and FY20E
KOLTE PATIL DEVELOPERS : RESULTS REVIEW 3QFY18
Page | 5
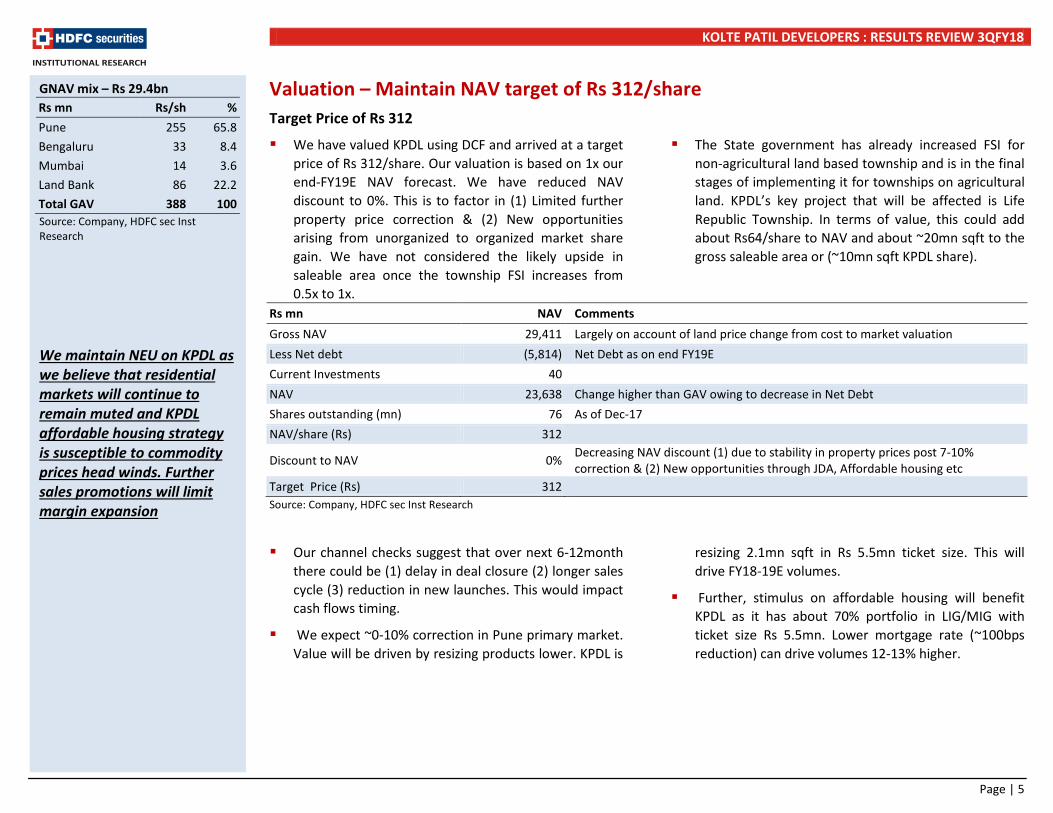
Valuation – Maintain NAV target of Rs 312/share Target Price of Rs 312
We have valued KPDL using DCF and arrived at a target price of Rs 312/share. Our valuation is based on 1x our end-FY19E NAV forecast. We have reduced NAV discount to 0%. This is to factor in (1) Limited further property price correction & (2) New opportunities arising from unorganized to organized market share gain. We have not considered the likely upside in saleable area once the township FSI increases from 0.5x to 1x.
The State government has already increased FSI for non-agricultural land based township and is in the final stages of implementing it for townships on agricultural land. KPDL’s key project that will be affected is Life Republic Township. In terms of value, this could add about Rs64/share to NAV and about ~20mn sqft to the gross saleable area or (~10mn sqft KPDL share).
Rs mn NAV Comments Gross NAV 29,411 Largely on account of land price change from cost to market valuation Less Net debt (5,814) Net Debt as on end FY19E Current Investments 40 NAV 23,638 Change higher than GAV owing to decrease in Net Debt Shares outstanding (mn) 76 As of Dec-17 NAV/share (Rs) 312 Discount to NAV 0% Decreasing NAV discount (1) due to stability in property prices post 7-10%
correction & (2) New opportunities through JDA, Affordable housing etc Target Price (Rs) 312 Source: Company, HDFC sec Inst Research
Our channel checks suggest that over next 6-12month there could be (1) delay in deal closure (2) longer sales cycle (3) reduction in new launches. This would impact cash flows timing.
We expect ~0-10% correction in Pune primary market. Value will be driven by resizing products lower. KPDL is
resizing 2.1mn sqft in Rs 5.5mn ticket size. This will drive FY18-19E volumes.
Further, stimulus on affordable housing will benefit KPDL as it has about 70% portfolio in LIG/MIG with ticket size Rs 5.5mn. Lower mortgage rate (~100bps reduction) can drive volumes 12-13% higher.
GNAV mix – Rs 29.4bn Rs mn Rs/sh % Pune 255 65.8 Bengaluru 33 8.4 Mumbai 14 3.6 Land Bank 86 22.2 Total GAV 388 100 Source: Company, HDFC sec Inst Research
We maintain NEU on KPDL as we believe that residential markets will continue to remain muted and KPDL affordable housing strategy is susceptible to commodity prices head winds. Further sales promotions will limit margin expansion

KOLTE PATIL DEVELOPERS : RESULTS REVIEW 3QFY18
Page | 6
Real estate development – NAV calculation methodology
We have divided KPDL’s entire land bank (with launch visibility over the next 5 years) into residential projects (based on the information given by the company).
We have arrived at the sale price/sq ft. and the anticipated sales volumes for each project based on our discussions with industry experts.
We have deducted the cost of construction based on our assumed cost estimates, which have been arrived at after discussions with industry experts.
We have further deducted marketing and other costs that have been assumed at 5% of the sales revenue.
We have then deducted income tax based on the tax applicable for the project.
The resultant cash inflows at the project level have been discounted based on WACC of 13% (cost of equity 15.1% based on beta of 1.1x & debt/equity ratio of 0.4x). All the project level NAVs have then been summed up to arrive at the NAV of the company.
From the NAV, we have deducted the net debt and likely outgo on balance land payments as of FY19E to arrive at the final valuation of the company.

KOLTE PATIL DEVELOPERS : RESULTS REVIEW 3QFY18
Page | 7
Key valuation assumptions In the exhibit below we highlight our sales and cost
inflation forecasts. We expect property price appreciation in line with WPI inflation, i.e. 5% and peg cost inflation slightly higher at 6%. We forecast other costs including marketing, SGA and employee costs at 15% of sales. We have discounted the cash flows using 13% as hurdle rate.
Base Case Assumptions Assumptions % Discount rate 13 Annual rate of inflation - sales price 5 Annual rate of inflation - cost of construction 6 Other costs - marketing, SGA, employee cost (as % sales) 15
Tax rate 33 Source: Company, HDFC sec Inst Research
Our pricing assumptions are moderate and at a 5-10% discount to the current prevailing prices. Construction cost assumptions are higher than the KPDL estimates.
Base Property Price And Construction Cost Assumptions
Location City Prices Rs/sqft
Cost Rs/sqft
Wagholi Pune 3,750 1,800 Hinjewadi Pune 4,900 2,100 Kharadi Pune 5,000 2,200 Undri-NIBM Pune 4,500 2,200 Mohamad Wadi Pune 4,500 2,200 Aundh Annexe Pune 5,200 2,500 Boat Club Road Pune 9,100 3,500 Kondhwa Pune 3,900 2,000 Viman Nagar Pune 8,600 3,500 Aundh Pune 6,700 2,600 Kalyani Nagar Pune 7,500 2,800 Bavdhan Pune 4,600 2,000 Atria Pune 7,200 2,800 Wakad Pune 5,400 2,500 Andheri Mumbai 14,500 7,500 Vile Parle Mumbai 20,000 9,500 Koramangla Block III Bangalore 6,200 2,400 Hosur Road Bangalore 5,700 2,300 Kannur Road Bangalore 3,750 1,800 Source: Company, HDFC sec Inst Research
Our pricing assumptions are moderate and at a 5-10% discount to the current prevailing prices.

KOLTE PATIL DEVELOPERS : RESULTS REVIEW 3QFY18
Page | 8
NAV sensitivity analysis Sensitivity to our assumption of property price
Our model is sensitive to changes in the assumptions regarding property prices. For every 1% change in the base property prices, the NAV will change by approximately 2.7%.
NAV Sensitivity To Changes In Base Sale Price % change in sale price (10) (5) 0 5 10
NAV/share (Rs) 227 270 312 354 393 Change in NAV (%) (27.1) (13.4) - 13.5 26.1 Source : Company, HDFC sec Inst Research
Sensitivity of NAV to changes in sale inflation
In our base case, we have assumed annual sale price inflation of 5%. For every 100bps increase in the annual sale price inflation, the NAV will increase by approximately 6.9%.
NAV Sensitivity To Change In Sales Inflation Sales inflation rates (%) 3 4 5 6 7
NAV/share (Rs) 270 291 312 333 355 Change in NAV (%) (13.4) (6.7) - 6.9 13.7 Source: Company, HDFC sec Inst Research
Sensitivity of NAV to changes in cost inflation
In our base case, we have assumed cost inflation to be 6%. For every 100bps increase in construction cost inflation, the NAV will change by approximately 4.5%.
NAV Sensitivity To Change In Cost Inflation Cost inflation rates (%) 4 5 6 7 8 NAV/share (Rs) 341 326 312 298 284 Change in NAV (%) 9.2 4.6 - (4.5) (9.1) Source : Company, HDFC sec Inst Research
The combined impact of a 100bps increase in sale price inflation and cost inflation will be a NAV increase of 2.4%.
Sensitivity of NAV to changes in discount rate
In our base case, we have assumed a discount rate of 13%. For every 100bps increase in the discount rate, the NAV will fall by ~5.1%.
NAV Sensitivity To Change In Wacc WACC rates (%) 11 12 13 14 15 NAV/share (Rs) 344 328 312 296 280 Change in NAV (%) 10.3 5.2 - (5.1) (10.2) Source: Company, HDFC sec Inst Research
1% increase in average base sale price impacts our NAV positively by 2.7% Every 100bps increase in sale price inflation impacts our NAV positively by 6.9% 100bps increase in cost inputs decreases our NAV by 4.5% 100bps increase in discounting rate impacts our NAV negatively by 5.1%
KOLTE PATIL DEVELOPERS : RESULTS REVIEW 3QFY18
Page | 9
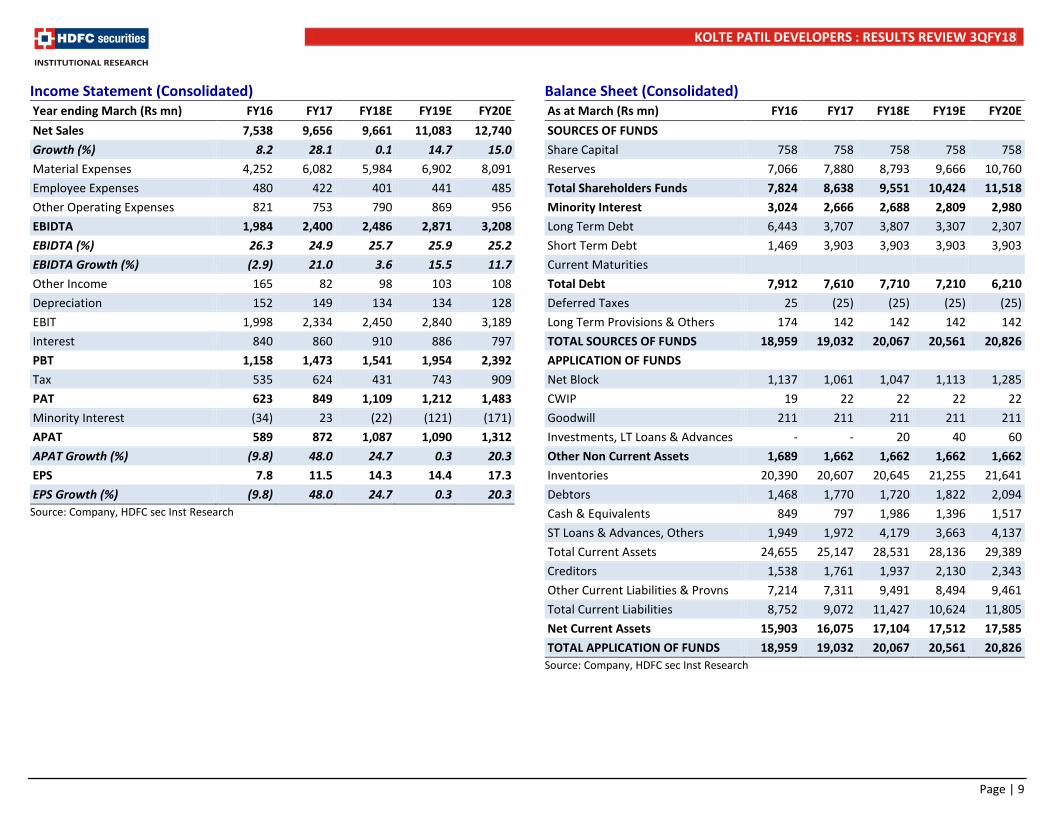
Income Statement (Consolidated) Year ending March (Rs mn) FY16 FY17 FY18E FY19E FY20E Net Sales 7,538 9,656 9,661 11,083 12,740 Growth (%) 8.2 28.1 0.1 14.7 15.0 Material Expenses 4,252 6,082 5,984 6,902 8,091 Employee Expenses 480 422 401 441 485 Other Operating Expenses 821 753 790 869 956 EBIDTA 1,984 2,400 2,486 2,871 3,208 EBIDTA (%) 26.3 24.9 25.7 25.9 25.2 EBIDTA Growth (%) (2.9) 21.0 3.6 15.5 11.7 Other Income 165 82 98 103 108 Depreciation 152 149 134 134 128 EBIT 1,998 2,334 2,450 2,840 3,189 Interest 840 860 910 886 797 PBT 1,158 1,473 1,541 1,954 2,392 Tax 535 624 431 743 909 PAT 623 849 1,109 1,212 1,483 Minority Interest (34) 23 (22) (121) (171) APAT 589 872 1,087 1,090 1,312 APAT Growth (%) (9.8) 48.0 24.7 0.3 20.3 EPS 7.8 11.5 14.3 14.4 17.3 EPS Growth (%) (9.8) 48.0 24.7 0.3 20.3
Source: Company, HDFC sec Inst Research
Balance Sheet (Consolidated) As at March (Rs mn) FY16 FY17 FY18E FY19E FY20E SOURCES OF FUNDS Share Capital 758 758 758 758 758 Reserves 7,066 7,880 8,793 9,666 10,760 Total Shareholders Funds 7,824 8,638 9,551 10,424 11,518 Minority Interest 3,024 2,666 2,688 2,809 2,980 Long Term Debt 6,443 3,707 3,807 3,307 2,307 Short Term Debt 1,469 3,903 3,903 3,903 3,903 Current Maturities Total Debt 7,912 7,610 7,710 7,210 6,210 Deferred Taxes 25 (25) (25) (25) (25) Long Term Provisions & Others 174 142 142 142 142 TOTAL SOURCES OF FUNDS 18,959 19,032 20,067 20,561 20,826 APPLICATION OF FUNDS Net Block 1,137 1,061 1,047 1,113 1,285 CWIP 19 22 22 22 22 Goodwill 211 211 211 211 211 Investments, LT Loans & Advances - - 20 40 60 Other Non Current Assets 1,689 1,662 1,662 1,662 1,662 Inventories 20,390 20,607 20,645 21,255 21,641 Debtors 1,468 1,770 1,720 1,822 2,094 Cash & Equivalents 849 797 1,986 1,396 1,517 ST Loans & Advances, Others 1,949 1,972 4,179 3,663 4,137 Total Current Assets 24,655 25,147 28,531 28,136 29,389 Creditors 1,538 1,761 1,937 2,130 2,343 Other Current Liabilities & Provns 7,214 7,311 9,491 8,494 9,461 Total Current Liabilities 8,752 9,072 11,427 10,624 11,805 Net Current Assets 15,903 16,075 17,104 17,512 17,585 TOTAL APPLICATION OF FUNDS 18,959 19,032 20,067 20,561 20,826
Source: Company, HDFC sec Inst Research

KOLTE PATIL DEVELOPERS : RESULTS REVIEW 3QFY18
Page | 10
Cash Flow (Consolidated) Year ending March (Rs mn) FY16 FY17 FY18E FY19E FY20E PBT before minority 1,158 1,473 1,541 1,954 2,392 Non-operating & EO items (132) (29) (98) (103) (108) Taxes (652) (494) (431) (743) (909) Interest expenses 840 860 910 886 797 Depreciation 152 149 134 134 128 Working Capital Change (1,002) (543) 160 (998) 49 OPERATING CASH FLOW ( a ) 364 1,417 2,215 1,130 2,347 Capex (328) (77) (120) (200) (300) Free cash flow (FCF) 37 1,340 2,095 930 2,047 Investments (1,046) 496 78 83 88 INVESTING CASH FLOW ( b ) (1,374) 419 (42) (117) (212) Share capital Issuance - - - - - Debt Issuance 2,310 (655) 100 (500) (1,000) Interest expenses (696) (792) (910) (886) (797) Dividend (421) (262) (174) (217) (218) FINANCING CASH FLOW ( c ) 1,194 (1,709) (984) (1,603) (2,015) NET CASH FLOW (a+b+c) 185 126 1,189 (590) 121 Opening Cash 367 552 797 1,986 1,396 Other Bank Deposits 297 119 Closing Cash & Equivalents 849 797 1,986 1,396 1,517
Source: Company, HDFC sec Inst Research
Key Ratios (Consolidated)
FY16 FY17 FY18E FY19E FY20E PROFITABILITY (%) GPM 43.6 37.0 38.1 37.7 36.5 EBITDA Margin 26.3 24.9 25.7 25.9 25.2 EBIT Margin 26.5 24.2 25.4 25.6 25.0 APAT Margin 7.8 9.0 11.3 9.8 10.3 RoE 7.3 10.6 12.0 10.9 12.0 Core RoCE 10.4 13.6 16.9 16.5 18.3 RoCE 12.1 12.3 12.5 14.0 15.4 EFFICIENCY Tax Rate (%) 46.2 42.4 28.0 38.0 38.0 Asset Turnover (x) 0.4 0.5 0.5 0.5 0.6 Inventory (days) 849 775 779 690 614 Debtors (days) 60 61 66 58 56 Payables (days) 66 62 70 67 64 Cash Conversion Cycle (days) 843 774 775 681 606 Debt/EBITDA (x) 4.0 3.2 3.1 2.5 1.9 Net D/E 0.9 0.8 0.6 0.6 0.4 Interest Coverage 2.4 2.7 2.7 3.2 4.0 PER SHARE DATA EPS (Rs/sh) 7.8 11.5 14.3 14.4 17.3 CEPS (Rs/sh) 9.8 13.5 16.1 16.2 19.0 DPS (Rs/sh) 1.2 2.3 2.9 2.9 3.5 BV (Rs/sh) 103.3 114.0 126.0 137.6 152.0 VALUATION P/E 47.2 31.9 25.6 25.5 21.2 P/BV 3.6 3.2 2.9 2.7 2.4 EV/EBITDA 17.6 14.4 13.5 11.7 10.1 OCF/EV (%) 1.0 0.0 0.1 0.0 0.1 FCF/EV (%) 0.1 3.9 6.2 2.8 6.3 FCFE/Market Cap 8.4 2.5 7.9 1.5 3.8 Dividend Yield (%) 0.3 0.6 0.8 0.8 0.9
Source: Company, HDFC sec Inst Research

KOLTE PATIL DEVELOPERS : RESULTS REVIEW 3QFY18
Page | 11
Rating Definitions
BUY : Where the stock is expected to deliver more than 10% returns over the next 12 month period NEUTRAL : Where the stock is expected to deliver (-)10% to 10% returns over the next 12 month period SELL : Where the stock is expected to deliver less than (-)10% returns over the next 12 month period
Date CMP Reco Target 13-Apr-17 177 NEU 177 7-Jun-17 177 BUY 195
11-Oct-17 216 NEU 195 7-Nov-17 258 NEU 253 12-Jan-18 383 SELL 310 15-Feb-18 367 SELL 312
70
120
170
220
270
320
370
Feb-
17
Mar
-17
Apr-
17
May
-17
Jun-
17
Jul-1
7
Aug-
17
Sep-
17
Oct
-17
Nov-
17
Dec-
17
Jan-
18
Feb-
18
Kolte-Patil TP
RECOMMENDATION HISTORY

KOLTE PATIL DEVELOPERS : RESULTS REVIEW 3QFY18
Page | 12
Disclosure: We, Parikshit Kandpal, MBA, and Kunal Bhandari, ACA, authors and the names subscribed to this report, hereby certify that all of the views expressed in this research report accurately reflect our views about the subject issuer(s) or securities. HSL has no material adverse disciplinary history as on the date of publication of this report. We also certify that no part of our compensation was, is, or will be directly or indirectly related to the specific recommendation(s) or view(s) in this report. Research Analyst or his/her relative or HDFC Securities Ltd. does not have any financial interest in the subject company. Also Research Analyst or his relative or HDFC Securities Ltd. or its Associate may have beneficial ownership of 1% or more in the subject company at the end of the month immediately preceding the date of publication of the Research Report. Further Research Analyst or his relative or HDFC Securities Ltd. or its associate does not have any material conflict of interest. Any holding in stock –No HDFC Securities Limited (HSL) is a SEBI Registered Research Analyst having registration no. INH000002475. Disclaimer: This report has been prepared by HDFC Securities Ltd and is meant for sole use by the recipient and not for circulation. The information and opinions contained herein have been compiled or arrived at, based upon information obtained in good faith from sources believed to be reliable. Such information has not been independently verified and no guaranty, representation of warranty, express or implied, is made as to its accuracy, completeness or correctness. All such information and opinions are subject to change without notice. This document is for information purposes only. Descriptions of any company or companies or their securities mentioned herein are not intended to be complete and this document is not, and should not be construed as an offer or solicitation of an offer, to buy or sell any securities or other financial instruments. This report is not directed to, or intended for display, downloading, printing, reproducing or for distribution to or use by, any person or entity who is a citizen or resident or located in any locality, state, country or other jurisdiction where such distribution, publication, reproduction, availability or use would be contrary to law or regulation or what would subject HSL or its affiliates to any registration or licensing requirement within such jurisdiction. If this report is inadvertently send or has reached any individual in such country, especially, USA, the same may be ignored and brought to the attention of the sender. This document may not be reproduced, distributed or published for any purposes without prior written approval of HSL. Foreign currencies denominated securities, wherever mentioned, are subject to exchange rate fluctuations, which could have an adverse effect on their value or price, or the income derived from them. In addition, investors in securities such as ADRs, the values of which are influenced by foreign currencies effectively assume currency risk. It should not be considered to be taken as an offer to sell or a solicitation to buy any security. HSL may from time to time solicit from, or perform broking, or other services for, any company mentioned in this mail and/or its attachments. HSL and its affiliated company(ies), their directors and employees may; (a) from time to time, have a long or short position in, and buy or sell the securities of the company(ies) mentioned herein or (b) be engaged in any other transaction involving such securities and earn brokerage or other compensation or act as a market maker in the financial instruments of the company(ies) discussed herein or act as an advisor or lender/borrower to such company(ies) or may have any other potential conflict of interests with respect to any recommendation and other related information and opinions. HSL, its directors, analysts or employees do not take any responsibility, financial or otherwise, of the losses or the damages sustained due to the investments made or any action taken on basis of this report, including but not restricted to, fluctuation in the prices of shares and bonds, changes in the currency rates, diminution in the NAVs, reduction in the dividend or income, etc. HSL and other group companies, its directors, associates, employees may have various positions in any of the stocks, securities and financial instruments dealt in the report, or may make sell or purchase or other deals in these securities from time to time or may deal in other securities of the companies / organizations described in this report. HSL or its associates might have managed or co-managed public offering of securities for the subject company or might have been mandated by the subject company for any other assignment in the past twelve months. HSL or its associates might have received any compensation from the companies mentioned in the report during the period preceding twelve months from t date of this report for services in respect of managing or co-managing public offerings, corporate finance, investment banking or merchant banking, brokerage services or other advisory service in a merger or specific transaction in the normal course of business. HSL or its analysts did not receive any compensation or other benefits from the companies mentioned in the report or third party in connection with preparation of the research report. Accordingly, neither HSL nor Research Analysts have any material conflict of interest at the time of publication of this report. Compensation of our Research Analysts is not based on any specific merchant banking, investment banking or brokerage service transactions. HSL may have issued other reports that are inconsistent with and reach different conclusion from the information presented in this report. Research entity has not been engaged in market making activity for the subject company. Research analyst has not served as an officer, director or employee of the subject company. We have not received any compensation/benefits from the subject company or third party in connection with the Research Report. HDFC securities Limited, I Think Techno Campus, Building - B, "Alpha", Office Floor 8, Near Kanjurmarg Station, Opp. Crompton Greaves, Kanjurmarg (East), Mumbai 400 042 Phone: (022) 3075 3400 Fax: (022) 2496 5066 Compliance Officer: Binkle R. Oza Email: [email protected] Phone: (022) 3045 3600 HDFC Securities Limited, SEBI Reg. No.: NSE-INB/F/E 231109431, BSE-INB/F 011109437, AMFI Reg. No. ARN: 13549, PFRDA Reg. No. POP: 04102015, IRDA Corporate Agent License No.: HDF 2806925/HDF C000222657, SEBI Research Analyst Reg. No.: INH000002475, CIN - U67120MH2000PLC152193 Mutual Funds Investments are subject to market risk. Please read the offer and scheme related documents carefully before investing.

KOLTE PATIL DEVELOPERS : RESULTS REVIEW 3QFY18
Page | 13
HDFC securities Institutional Equities Unit No. 1602, 16th Floor, Tower A, Peninsula Business Park, Senapati Bapat Marg, Lower Parel,Mumbai - 400 013 Board : +91-22-6171 7330 www.hdfcsec.com