ireland: boston or berlin? - tasc · welfare regimes emerge from historical ... germany sweden uk...
TRANSCRIPT
Ireland: Boston or Berlin?
David Jacobson
DCU
Mary Harney, 2000
“[T]he American way…
economic model …heavily based on enterprise and incentive, on individual effort and with limited government intervention.
[T]he European way…
strong concern for social harmony and social inclusion, with governments being prepared to intervene strongly through the tax and regulatory systems to achieve their desired outcomes.”

Mary Harney, 2000
“We in Ireland have tended to steer a course between the two but I think it is fair to say that we have sailed closer to the American shore than the European one.”

The Framework
Esping-Andersen (1990) Three Worlds of Welfare Capitalism + many other writings
Welfare regimes emerge from historical evolution of national institutions, influenced by international factors
Key concepts: de-commodification of labour, familialism, welfare pillars, welfare regimes
De-commodification of
Labour
The greater the ease with which people can leave the labour force without suffering serious reduction in income, the greater the de-commodification of labour
Indicators: unemployment benefits, social income supports, rent supplements, social housing, etc.
Familialism
The greater the participation rate of women in the labour force, the less familialistic the society
Commodification of female labour is associated with de-familialised societies
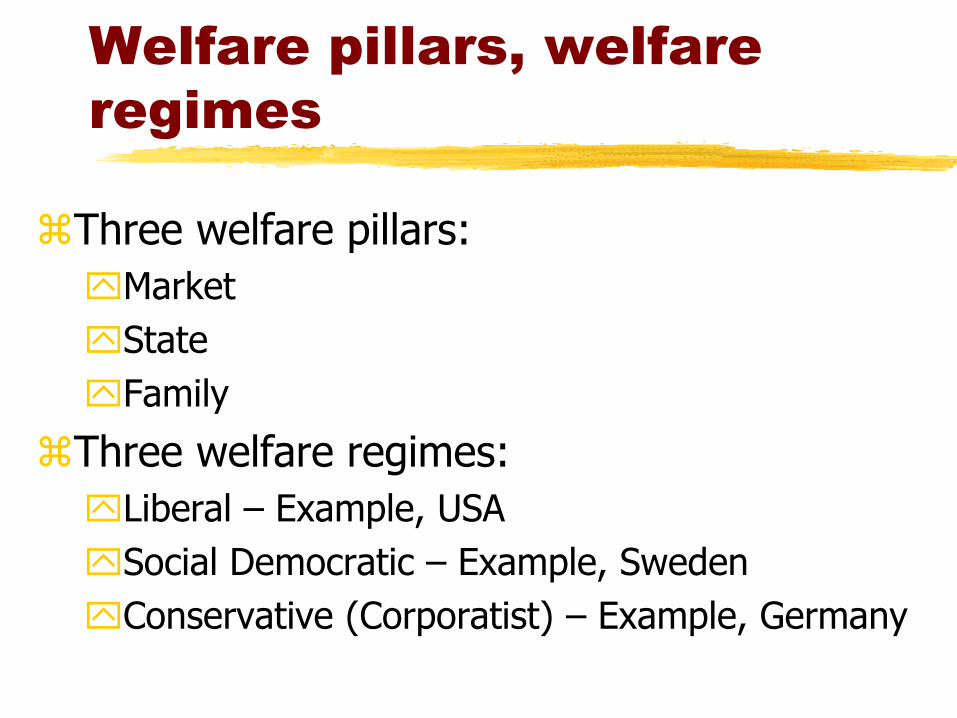
Welfare pillars, welfare
regimes
Three welfare pillars:
Market
State
Family
Three welfare regimes:
Liberal – Example, USA
Social Democratic – Example, Sweden
Conservative (Corporatist) – Example, Germany
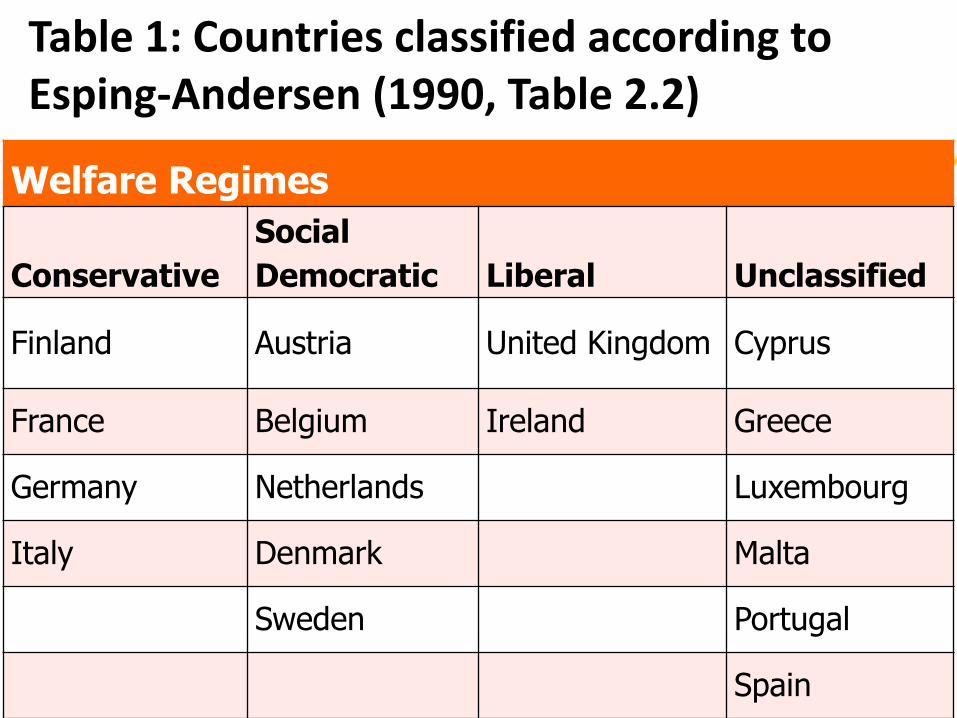
Welfare Regimes
Conservative
Social
Democratic Liberal Unclassified
Finland Austria United Kingdom Cyprus
France Belgium Ireland Greece
Germany Netherlands Luxembourg
Italy Denmark Malta
Sweden Portugal
Spain
Table 1: Countries classified according to Esping-Andersen (1990, Table 2.2)
Ireland in Context
In 22 (24) studies using quantitative
methods to categorise countries by
welfare regime, Table 2 shows findings for
Ireland (UK):

Table 2: Categorisation of Ireland and UK (Quant.)
Cons./Corp. Soc. Dem. Liberal
SE/M (Rud.) Other
Ireland (6) 27% (0) 0% (13) 59% (1*) 5% (2) 9%
UK (1) 4% (1) 4% (19) 79% (0) 0% (3) 13%
*Obinger and Wagschal, 2001
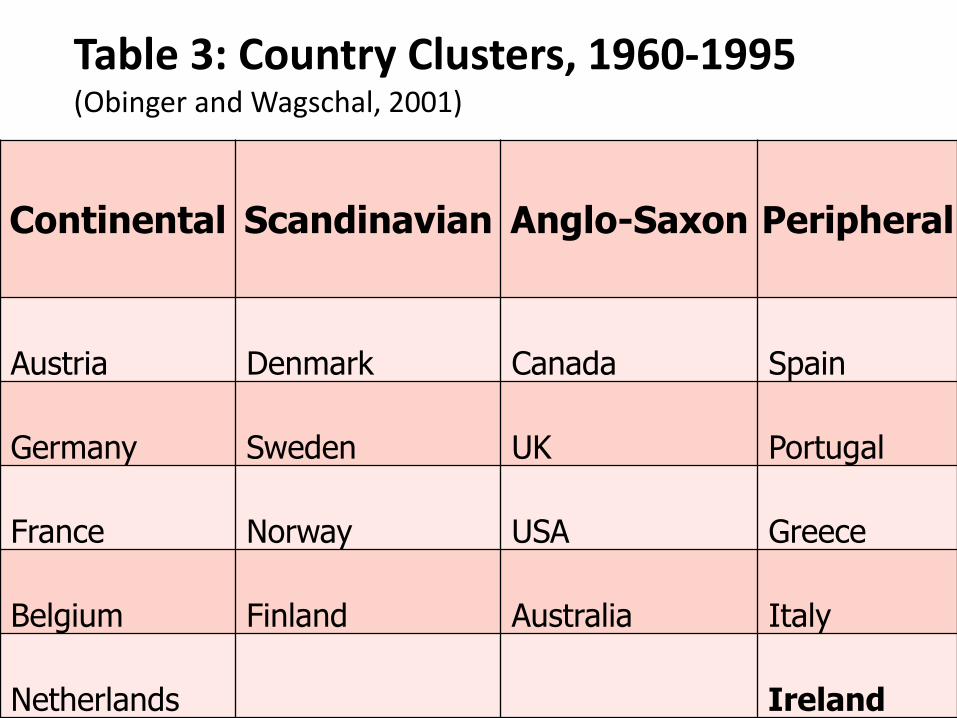
Table 3: Country Clusters, 1960-1995(Obinger and Wagschal, 2001)
Continental Scandinavian Anglo-Saxon Peripheral
Austria Denmark Canada Spain
Germany Sweden UK Portugal
France Norway USA Greece
Belgium Finland Australia Italy
Netherlands Ireland
Ireland in Context
In the vast majority of publications using
qualitative methods Ireland is again seen
as conforming to the characteristics of the
Liberal Welfare Regime:
Author(s) Year Welfare Regime NotesLib. Cons/Corp Soc. Dem. SE/M
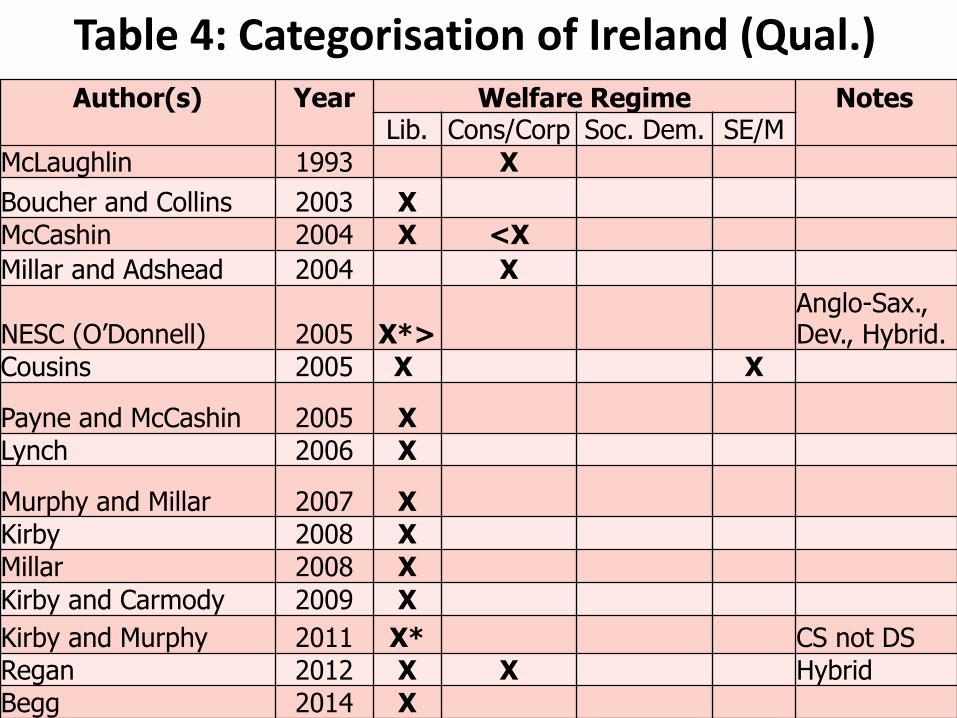
McLaughlin 1993 X
Boucher and Collins 2003 X
McCashin 2004 X <X
Millar and Adshead 2004 X
NESC (O’Donnell) 2005 X*>Anglo-Sax., Dev., Hybrid.
Cousins 2005 X X
Payne and McCashin 2005 X
Lynch 2006 X
Murphy and Millar 2007 X
Kirby 2008 X
Millar 2008 X
Kirby and Carmody 2009 X
Kirby and Murphy 2011 X* CS not DS
Regan 2012 X X Hybrid
Begg 2014 X
Table 4: Categorisation of Ireland (Qual.)

New Research
“Welfare regime, welfare pillar and
southern Europe”
Journal of European Social Policy
(2014)
Minas, Jacobson, Antoniou and McMullan

Dimension Variables
Family People per Household
Age Leaving Home
State vs MarketExpenditure on Social Protection
as % of GDP
ReligionAttendance at Religious Service
at least Once a Week
Clientelism/CorruptionPerception of Corruption as Part
of Business Culture
Perception of Corruption as
Major Problem
Table 5: Dimensions, Variables
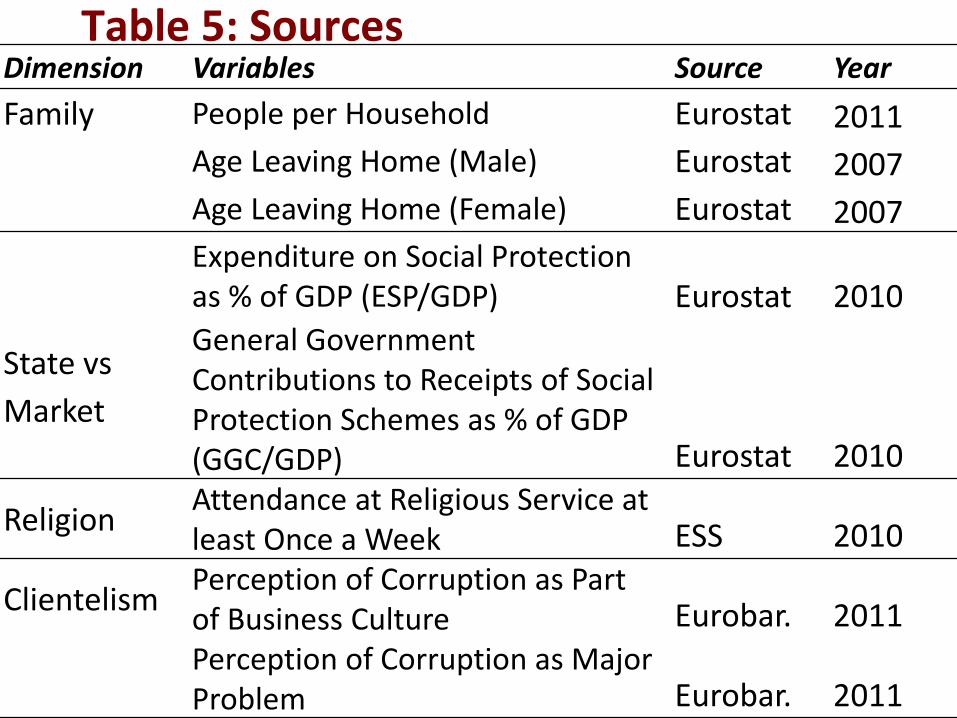
Table 5: Sources Dimension Variables Source Year
Family People per Household Eurostat 2011
Age Leaving Home (Male) Eurostat 2007
Age Leaving Home (Female) Eurostat 2007
State vs
Market
Expenditure on Social Protection as % of GDP (ESP/GDP) Eurostat 2010General Government Contributions to Receipts of Social Protection Schemes as % of GDP (GGC/GDP) Eurostat 2010
ReligionAttendance at Religious Service at least Once a Week ESS 2010
ClientelismPerception of Corruption as Part of Business Culture Eurobar. 2011Perception of Corruption as Major Problem Eurobar. 2011
Results
HCA Dendogram: where is Ireland?
Where is the UK?
What are the European clusters?
What are the main welfare regimes?
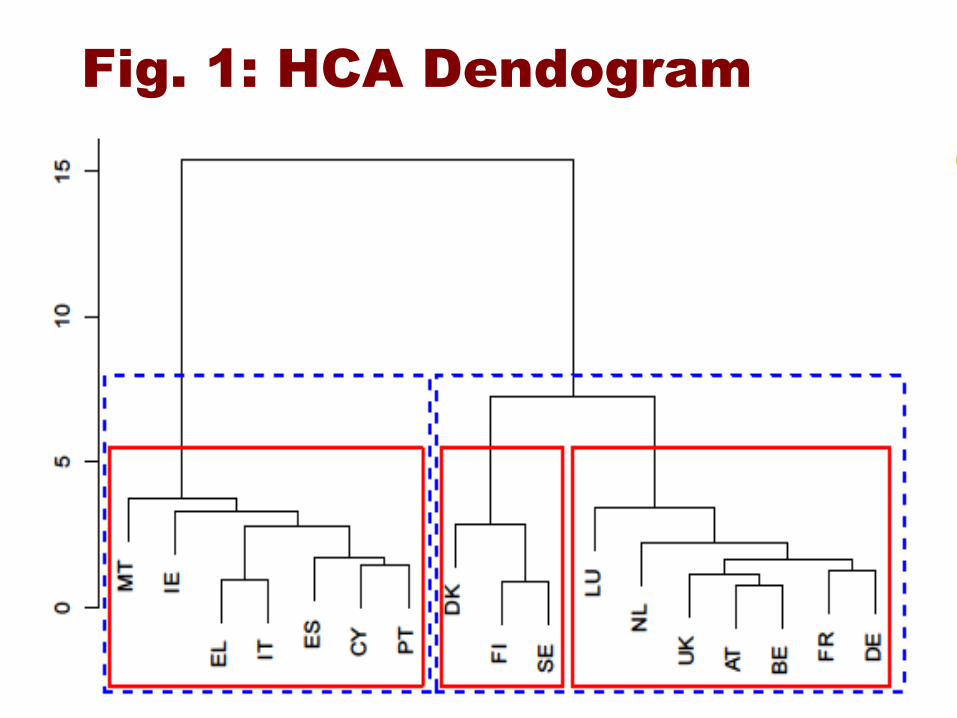
Fig. 1: HCA Dendogram
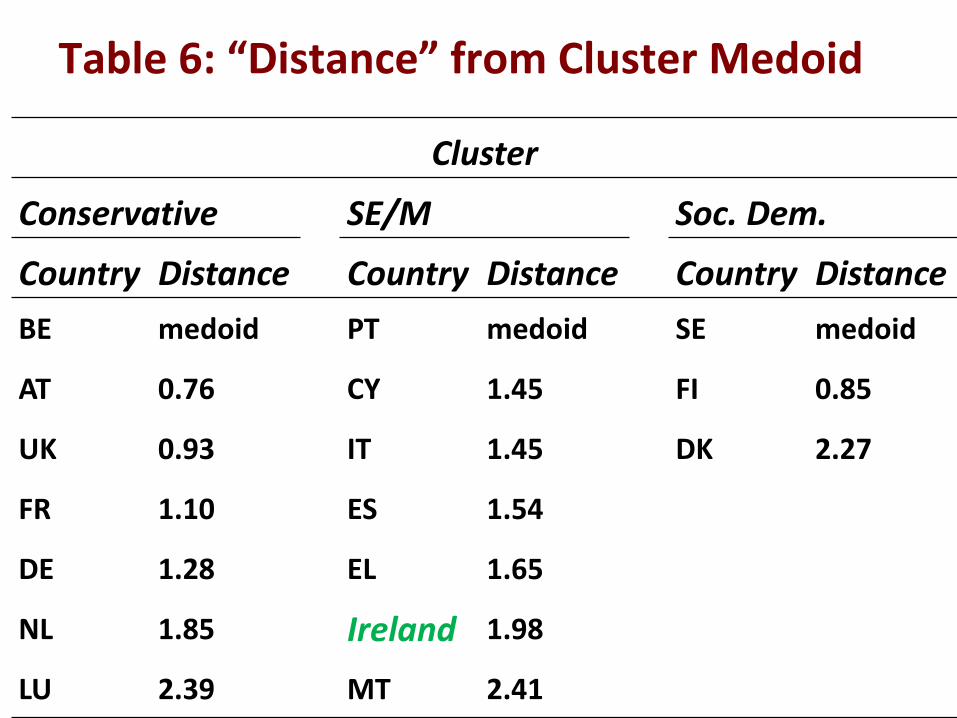
Table 6: “Distance” from Cluster Medoid
Cluster
Conservative SE/M Soc. Dem.
Country Distance Country Distance Country Distance
BE medoid PT medoid SE medoid
AT 0.76 CY 1.45 FI 0.85
UK 0.93 IT 1.45 DK 2.27
FR 1.10 ES 1.54
DE 1.28 EL 1.65
NL 1.85 Ireland 1.98
LU 2.39 MT 2.41
Results: Summary 1
Using primarily post-Celtic tiger data, Ireland falls firmly into the SE/M/P cluster
The UK falls firmly into the Conservative/Corporatist cluster
In terms of the clusters themselves, the SE/M cluster is more different statistically from the Liberal and Social Democratic clusters than they are from one another
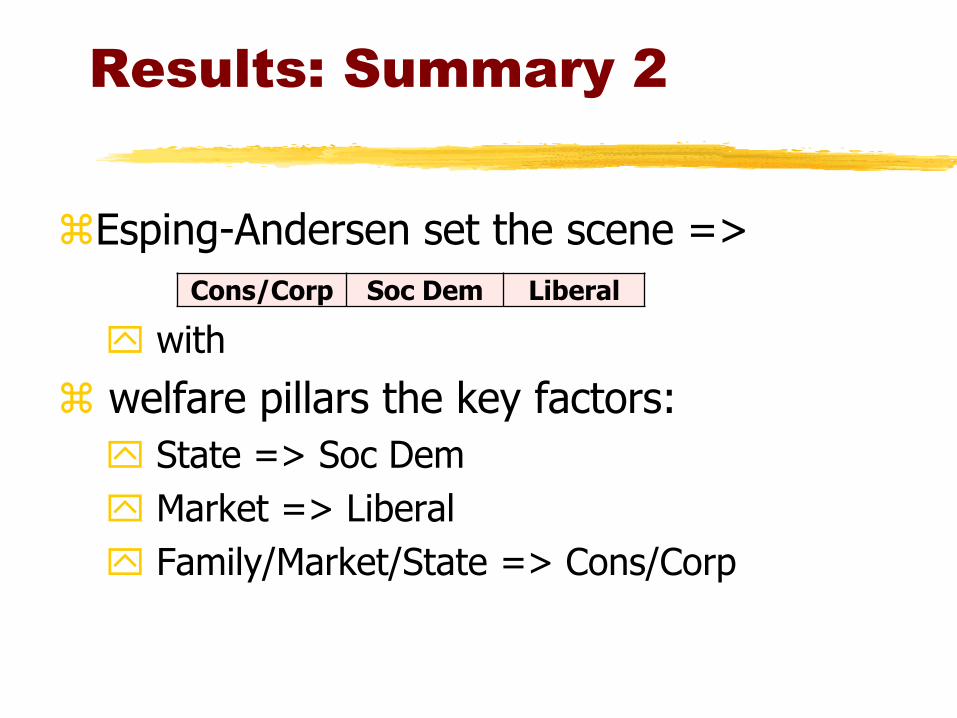
Results: Summary 2
Esping-Andersen set the scene =>
with
welfare pillars the key factors:
State => Soc Dem
Market => Liberal
Family/Market/State => Cons/Corp
Cons/Corp Soc Dem Liberal
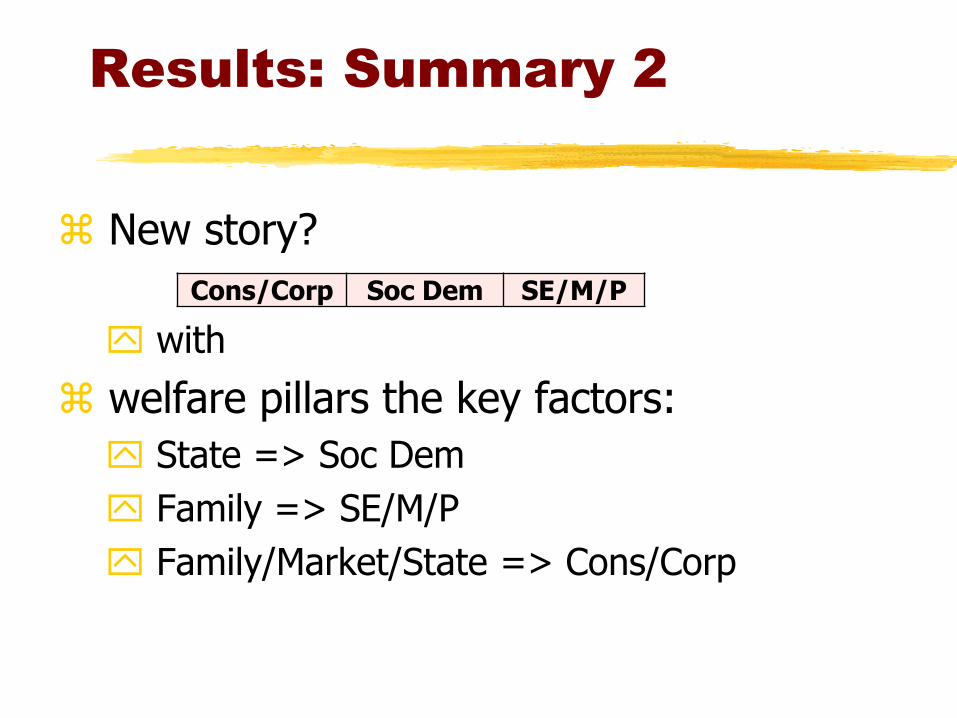
Results: Summary 2
New story?
with
welfare pillars the key factors:
State => Soc Dem
Family => SE/M/P
Family/Market/State => Cons/Corp
Cons/Corp Soc Dem SE/M/P

Fig. 2: New Typology of WSs
Dominant Pillar Welfare Regime Family State Market
Family SE/M or Peripheral Less More More
State Social Democratic More Less More
Market Liberal More More Less
Conservative in comparison,
with respect to: