iref working paper series - iref europe · iref working paper series . and yet it grows . crisis,...
TRANSCRIPT

Institute for Research in Economic and Fiscal issues
Institute for Research in Economic and Fiscal issues
IREF Working Paper Series
And yet it grows Crisis, ideology, and interventionist policy ratchets
Christian Bjørnskov Martin Rode
IREF WORKING PAPER NO. 201705
NOVEMBER 2017
IN ENGLISH: EN.IREFEUROPE.ORG IN FRENCH: FR.IREFEUROPE.ORG IN GERMAN: DE.IREFEUROPE.ORG
1
And Yet It Grows Crisis, Ideology, and Interventionist Policy Ratchets
Christian Bjørnskov*
Martin Rodeϕ
October 25, 2017
Abstract: Government reaction to economic crisis has long been a central element of public policy debate
and is experiencing a certain revival after the Great Recession of 2008. Previous studies argue on
theoretical and empirical grounds that crises may lead to more interventionist policies, but also cause
deregulation and liberalization. Findings are thus diverse and unable to systematically explain idiosyncratic
policy reactions. The present paper claims that whether or not governments implement more or less
interventionist policy responses will depend on their core political ideology, leading to ideologically
heterogeneous post-crisis strategies. Employing a panel of 68 countries with Western political institutions
observed between 1975 and 2010, we find that growth crises cause larger increases in government size and
regulatory policy when countries have left-wing governments. Interestingly, we also find clear evidence of
policy ratchets, meaning that crisis policies present a strong tendency to become permanent, regardless of
the ideology of successive governments in power.
Keywords: Government growth, Regulation, Economic crisis, Government ideology, Policy ratchets
JEL Codes: D72, H11, H12
* Department of Economics, Aarhus University, Fuglesangs Allé 4, DK-8210 Aarhus V, Denmark; and Research Institute of
Industrial Economics (IFN), P.O. Box 55665, 102 15 Stockholm, Sweden; Institute for Research in Economic and Fiscal Issues
(IREF), France; e-mail: [email protected]. ϕ Department of Economics, University of Navarra, Campus Universitario, 31009 Pamplona, Navarra, Spain; Institute for
Research in Economic and Fiscal Issues (IREF), France; e-mail: [email protected].

2
1. Introduction
Discussions on the optimal level of government intervention in the economy have become very intense in
recent years, especially following the 2008 financial and economic crisis. The hardships produced by this
temporal economic downturn have led to some very heated debates among the economics profession on
how much government should intervene in the economy to offset the associated negative effects for
income and unemployment. Some prominent voices, such as Krugman (2012), or Piketty (2014), have
recently argued for much more active government, postulating that current public sector size, or regulatory
activity, are insufficient to overcome the long-term effects of what has also become known as the Great
Recession.
Interestingly, large increases in government spending were precisely the initial reaction to the 2008
crisis followed by practically all affected high-income countries, according to recent findings by Alesina et
al. (2015). In an attempt to offset the expansionary increase in government spending though, many OECD
governments shortly afterwards designed deficit reduction policies that had exactly the opposite objective,
namely to diminish the weight of the public sector in economic activity once again. As this concrete
example highlights, the question whether crisis-driven increases in government size and regulation become
permanent, whether they are purely temporary, or whether perhaps the overall effect is even negative, is a
highly relevant and very contemporary question in economic policy.
Previous theoretical and empirical studies argue that economic crises may lead to more
interventionist policies and bigger governments, but also cause deregulation and reductions of public sector
size. Notably, Peacock and Wiseman (1961) highlight with their famous displacement effect hypothesis that
government not only increases as a consequence of economic growth (i.e. Wagner 1893), but explicitly
focus on political crises, namely interstate wars. Such events permanently displace the government’s
capacity to tax, as spending is never re-adjusted to pre-war levels and new ideas have meanwhile emerged
among the electorate on what tolerable tax levels should look like. Similarly, Buchanan and Wagner (1977)
argue that in the case of an economic crisis, the acceptance of Keynesian economic policy tends to relax
political constraints on deficit finance, allowing government to spend more than otherwise possible. As
such, while Buchanan and Wagner focus on what may be termed the political supply side, Peacock and
Wiseman’s theory rests on changes in the electorate’s demand for interventionist policies.
Regarding the long-term effects of an economic crisis, Higgs (1987) believes it to be unlikely that
government size will be rolled back to pre-crisis levels, once the slump is over, thereby also giving every

3
economic crisis a permanent component via a lasting expansion of the public sector, which he denotes as
the ratchets effect. On the other hand, several authors sustain that an economic crisis should actually be
beneficial to the acceptance of pro-market reforms, including the reduction of public sector size and
economic regulation (e.g. Drazen and Grilli 1993; Kruger 1993; Rodrick 1996). In this view, an economic
crisis is a unique moment in time where deteriorating economic conditions facilitate major policy changes
to permit a more liberalized economy with a smaller public sector.
Interestingly, both viewpoints interpret major economic crises as a type of critical juncture, where
political reactions will, at least in part, be determined by historically path dependent processes, but where
the decisions taken at the moment of the critical juncture will also affect future events in a path dependent
manner (cf. Capoccia and Keleman 2007; Soifer 2012). So because of small differences in initial conditions
and the decisions taken to combat the slump, the same crisis can send countries down radically different
paths with respect to government intervention in the economy. According to Acemoglu et al. (2009), this is
why all empirical studies dealing with critical juncture events need to control for constant, potentially
historical, factors.
Maybe for this same reason, the empirical evidence from cross-country studies on crisis and
government size is equally mixed as the theoretical literature, with some authors finding that crises cause
governments to tighten the interventionist grip on the economy, and others concluding that they are used
as moments in which deregulation and less interventionist policy can be implemented: For example,
Funashima (2017) finds the displacement effect to play a crucial role in the long-run growth of the public
sector, and Baier et al. (2012) conclude that crisis episodes are associated with lower overall economic
freedom. In contrast, de Haan et al. (2009) only find this effect to be temporary and that in the long run,
public sector size is actually reduced after a banking crisis. Likewise, Pitlik and Wirth (2003) find that
substantial crisis episodes facilitate overall economic de-regulation, and Pitlik (2008) adds the important
notion that this relationship is mediated by political institutions, with democratic governments being more
prone to liberalize the economy after a crisis. Recently, Young and Bologna (2016) undertake an exhaustive
study of how several different types of crises affect the size and scope of government, concluding that
reactions are for the most part very idiosyncratic and cannot be generalized across different countries.
According to their findings, whether a crisis results in increases or decreases of government are therefore
conditional on the particulars of time and country.
Given the previous findings, our paper introduces an important innovation that has not been
empirically tested in the existing literature. First, we argue that while economic crises do represent

4
politically critical junctures and history will thus partly determine the political reaction, it is also a moment
where more substantial change is possible, and whether or not governments implement more or less
interventionist policies will depend on their core political ideology. We therefore explicitly test for one of
the particulars of time and country, namely the political ideology of those who decide upon the size and
scope of a government stabilization program.
Theoretically, the extent of stabilization policies undertaken should heavily depend on the political
ideology of present authorities, due to the fact that views of government intervention and the market
economy differ greatly across the ideological policy spectrum. On the political demand side, a long
tradition in political science on issue ownership documents that specific types of parties own, or clearly
represent, subjects that are of particular relevance to certain groups in society (Petrocik 1996), and that
voters align their political choices along mental models where many different positions on political, social,
and economic issues are aggregated into a single political ideology (Denzau and North 1994). Regarding
the political supply side, Haidt (2012) further shows that political ideology is highly stable over an
individual’s lifetime and that it principally functions as a moral belief system which determines personal
views on capitalism and the appropriate role of government in the economy. Therefore, it should also have
a decisive impact on the political answer to a crisis, as those in government will fall back on this belief
system to make decisions at a point in time, when reliable information about the economy is only available
with a certain time-lag.
Recent empirical studies by Potrafke (2010), Pickering and Rockey (2011, 2013), Bjørnskov and
Potrafke (2012), and Faccini and Melki (2014) all confirm that government ideology is a potentially
important determinant of economic policy, particularly regarding increases in the size of government and
its regulatory role. We thus expect ideologically heterogeneous policy reactions to crises, with more left-
wing governments creating bigger and more permanent stabilization programs, and more right-wing
governments creating smaller and purely temporary programs.1
Second, we argue that Tullock’s (1975) transitional gains trap, as well as democratic political dynamics,
may prevent crisis policies from being rolled back when the crisis is over. Tullock (1975) argued that any
policy by government benefitting a particular industry with monopoly power will inevitably create a
dynamic, where the short-run transitional losses from renewed deregulation exceed the immediate welfare
1 Potentially, ideology could have an effect, either because it informs the government about what would be the appropriate
response, or because the crisis provides an opening for the government to more aggressively push its ideology.

5
cost of reduced output and higher prices from regulation. In addition, the industry in question will use
intense lobbying activity to prevent the program from being eliminated, despite the fact that exceptional
benefits only accrue to the first generation of license holders. Rent-seeking groups may thus be able to
maintain such regulations for extended periods of time, especially if substantial technological change is
absent in a particular market (Thomas 2009; Coates et al. 2010). Given that this dynamic is extended to a
sufficient amount of groups, for example via Keynesian anti-crisis programs, democratic economic policy
may very well become dominated by intense lobbying activity that has the principal goal to maintain or
expand these programs. In the words of Olson (1982), these lobbying activities lead to institutional sclerosis in
which special interests and poor policies reinforce each other.2 To the extent that interventionist crisis
policies create transitional special interests and political credibility problems, we therefore expect to
observe policy ratchets, i.e. that temporary crisis policies become permanent by increasing government
share of GDP and overall economic regulation.
Employing a panel of 68 countries with Western political institutions observed between 1975 and
2010, we find that crises in general cause more interventionist policies when countries have centrist or left-
wing governments. We track the development in indicators of government size and regulatory
interventions by using two subcomponents of the Economic Freedom of the World index developed by
Gwartney et al. (2015). The affected ideological policies are mainly related to government consumption,
taxation, and market regulation. We also find clear evidence of policy ratchets in all policy areas, indicating
that governments of all ideological convictions tend to perpetuate the policies chosen during the crisis.
Finally, we discuss evidence suggesting that our main findings are robust and can be interpreted as
reasonably causal, and conclude that economic crises can have permanent effects through these policy
ratchets.
The rest of the paper is structured as follows. Section 2 describes our data and the estimation
strategy. Section 3 reports the results in three subsections covering main results, ratchets and specific policy
domains. We discuss the findings and conclude in section 4.
2 A major difference between these theories is that Tullock’s transitional gains trap supposes that the crisis policy itself creates
the potential rent-seeking lobby, while Olson’s argument rests on the fact that these lobbies already exist and are simply able to
further divert the flow of resources in the event of an economic crisis. While these theories have been highly influential in public
choice and political economy, a third option that must be considered is that the structure of post-crisis politics implies that the
sector or policy is so far from political salience that no one has any interest of changing the crisis policy in any direction.

6
2. Data
In this paper, we explicitly focus on government growth and changes in its regulatory activity. Potentially,
each can act as substitutes for the other, as highlighted by Posner (1971). If one accepts his description of
regulation as a form of taxation, any empirical investigation will automatically need to take both aspects
into account, because by focusing only on the budgetary actions of government, we would be leaving out
an important dimension of government activity that is directly related to its overall size (i.e. Holcombe
2005).3
To measure government size and economic regulation, we employ two underlying elements of the
Economic Freedom of the World (EFW) index by Gwartney et al. (2015). This index is published annually
by the Canadian Fraser Institute, reflecting the degree to which the economic institutions and policies of a
country correspond to free market principles. The index is divided into five major areas: 1 Size of government:
Expenditure, taxes, and enterprises, 2 Legal structure and security of property rights, 3 Access to sound money, 4 Freedom to
trade internationally, and 5 Regulation of credit, labor, and business. In all areas, zero represents the least free and
ten the most free.
For reasons of better interpretation, we reverse the index such that higher index values imply larger
government consumption and more intervention. For our purpose, area 1 is employed to measure variations
in the size of government, and area 5 to measure changes in governments’ regulatory activity. Both are
rather broadly encompassing measures, which assures that we do not overlook any possible relationship by
focusing on just a single indicator. In addition, we split area 1 into its four individual components, so as to
highlight the exact variations of the underlying variables and make sure that our investigation does not miss
out on some important details. These are: 1a Government consumption, 1b Transfers and subsidies, 1c Government
enterprises and investment, and 1d Top marginal tax rate.
The focus in this paper will be on explaining the changes in government size and regulatory
activity, not in comparative levels. Holcombe (2005) highlights that explanations for the size of
government and its growth are naturally interrelated and differences are subtle, but they are nonetheless
important for the following reason: While government size could hypothetically be the outcome of some
collective choice mechanism with a preference-driven optimality, related theories ultimately fail to explain
why government would keep growing, unless preferences change to a substantial degree. Ultimately, this
3 Similarly, Young and Bologna (2016) focus on the size and scope of government in their recent work, even though their
measurement of specific variables is somewhat different.
7
makes collective choice theories incompatible with explanations that highlight budget maximization and
policy ratchets, where there is really no pre-defined maximum size that government can have (e.g.
Peltzman 1980; Miller and Moe 1983; Holcombe 1993). As this paper explicitly tests for political-
ideological budget maximization motives and crisis as a critical juncture that affects the relaxation of
constraints on taxation, spending, and debt accumulation, we will focus on the explanation of government
growth in this paper.
To relate an economic crisis to the size and scope of government, we further need a good measure
to capture an economic crisis.4 In this paper we opt for defining it as the count of years with negative
annual growth at five year intervals, meaning that we really measure growth crises. Obviously, alternative
definitions and measures are also available, some of which we employ as robustness checks in the results
section and the appendix. In addition, we create two variables that distinguish between a hard crisis and a soft
crisis operationalized as follows: Hard crises are defined so that the cumulative GDP losses for the
corresponding economy have to be larger than four percent of GDP, while all other crises are defined as a
soft crisis. Both variables capture the amount of years that a country spends with the corresponding
negative annual growth. Effectively, this also separates short crises from longer crises, as we observe no
crises with large GDP losses that last only for one year.
Whether or not governments implement more or less interventionist policies during an economic
crisis will most likely depend on their core political ideology, with more left-wing governments tending to
create bigger increases in government spending and regulation. Several measures of government ideology
are available for developed countries, but this is not the case for most of the developing world.
Nonetheless, we are able to use an alternative to the Database of Political Institutions (DPI) by Beck et al.
(2010) from Bjørnskov and Potrafke (2011), which has two particular features: First, the database includes
information on many of the missing data points for developing and middle-income countries not covered
in the DPI, and second, the ideology measure is based on a more fine-grained operationalization of
ideological differences between political parties.
In detail, the ideology variable is measured with modern social democrat parties as an anchor
around which other parties are placed. All parties in parliament are distributed on a scale from -1 to 1, with
4 Even though we don’t test for this hypothesis, political crises might also produce similar results. The recent coup attempt in
Turkey is a good example of a political crisis that is being used for a deep transformation of the state, which could perfectly
affect its size and also its regulatory role.
8
-1 representing completely left-wing (communist or unreformed socialist) parties, -.5 representing modern
socialist parties, 0 representing modern social democratic parties such as the SPD in Germany, .5
represents conservative parties, and 1 is set to represent parties with an ideological base in classical
liberalism. As such, all parties in our dataset are explicitly rated based on their position on economic policy,
so that their ideological approach to non-economic social issues or immigration can differ substantially
from their economic ideology. This is an important difference to other ideology measures that focus
heavily on social policy positions to classify parties, often judging economic policy positions to be of
secondary importance.5 Due to the fact that the economic ideology of parties in government are of vital
interest for the policies adopted during an economic crisis though, we believe that our measure is far more
adequate for the investigations conducted in this paper. This categorization is employed to place all
governments on a -1 to 1 scale, where the seat share in parliament of each party is used as weights when
calculating the ideology of coalition governments.
Most importantly, we introduce an interaction term between government ideology and our crisis
variables, which will be used to test any possible heterogeneous crisis reactions by governments of differing
political ideology. In accordance with evidence from previous research, we expect the reactions of left-wing
administrations to be stronger and more durable across time, when compared to the reactions of right-
wing governments.
Furthermore, we introduce a number of additional controls, which have been shown by previous
research to be significantly related to government size across countries. These are all summarized in Table
1. Additional control variables are as follows: Following the famous Wagnerian law, stating that the size of
government grows as a share of GDP with rising average per capita income (i.e. Wagner 1893), GDP per
capita is a primary control to explain cross country variations in government size. Studies by Pitlik and
Wirth (2003), Pitlik (2008), and Young and Bologna (2016) also utilize per capita income as a control
5 It bears mention that some parties such as Front National in France, the Austrian Freedom Party, or the Danish People’s Party
are often considered very right-wing in public media and occasionally by political scientists due to their particular position on
immigration policy and focus on traditional social values. Our exclusive focus on economic policy in the present paper means
that we do not code them as right-wing. Instead, we code the strongly interventionist Front National as socialist (-.5) and the
Austrian Freedom Party and the Danish People’s Party as social democrat (0). This classification is supported by the fact that all
these parties have recently received much electoral support from formerly socialist and social democratic electorates. However,
the particular way we code these mostly populist parties is relatively unimportant because they rarely enter government. The full
ideology dataset is available from the authors upon request.

9
variable in their models, finding that initial GDP is a fundamental determinant of changes in government
size and scope. Therefore, the logarithm of initial GDP per capita in purchasing power parity terms is also
included to our basic model. This data is taken from the Penn World Tables, mark 7.1 (Heston et al. 2012),
which also provides data for coding the crisis variables.
Table 1. Descriptive statistics Variable Mean Std. deviation Observations Area 1 4.226 1.636 484 Area 5 3.498 1.278 463 Area 1 a 20.309 6.896 485 Area 1 b 12.169 8.516 466 Area 1 c 27.468 14.639 455 Area 1 d 5.477 2.836 455 Crisis years 1.216 1.161 485 Light crisis .351 .478 485 Hard crisis .328 .469 485 Log GDP per capita 9.427 .839 485 Openness .814 .553 485 Log population size 8.968 1.637 485 Presidential democracy .279 .449 485 Civilian autocracy .097 .296 485 Military dictatorship .058 .234 485 Coalition government .437 .497 485 Government ideology .199 .408 473
Similarly to the reasoning underlying the Wagnerian law; it has more recently been argued by a
number of scholars that there is a direct connection between openness to trade and the size of
government. Most notably, Rodrik (1998) treats this relationship in his famous compensation hypothesis, which
states that more open economies also have larger public sectors, thereby creating a security mechanism
against external trade shocks.6 So as to account for the existence of such a possible mechanism, we
introduce a measure of openness to our basic model, which is the total value of all traded goods over
GDP. In a related manner, recent papers have further found smaller countries to present larger public
sectors, arguing that country size, government size, and trade openness are all interconnected (i.e. Alesina
and Wacziarg 1998). The underlying logic is that by default smaller countries trade more, but also create
comparatively larger governments as a mentioned security mechanism. Therefore, we also include the log
6 Recently, Bennaroch and Pandey (2012) re-examine Rodrik’s findings with different data, failing to encounter such a
relationship.
10
of total population into our model, so as to control for the size of countries. Data for these two variables is
also from the Penn World Tables.
Another important factor that has been argued to affect the size and scope of government in
reform processes is a country’s political regime (Pitlik 2008). Here, it is generally accepted knowledge
among political economists that under democratic regimes the public sector grows, as a response to voter’s
redistributive demands, while non-socialist authoritarian regimes are able to keep public sectors small (e.g.
Tavarés and Wacziarg 2001). This hypothesis is also indirectly supported by Aidt and Jensen (2009), who
find that the expansion of the voting franchise significantly raised government taxation and spending in the
19th and early 20th century. We therefore introduce two different dummy variables to our model that takes
the value of one, if the country in question presents a political regime that is a civilian autocracy, or a
military dictatorship. Both variables are from the much-used dataset by Cheibub et al. (2010), which codes
democratic and autocratic regimes worldwide since 1946.7
Relatedly, Persson and Tabellini (1998) find strong support that the size of government is smaller
under presidential regimes, when compared to parliamentary regimes. A dummy variable that takes the
value of one if a country has a democratic presidential regime is further introduced to our basic model.
Again, this variable is taken from the dataset by Cheibub et al. (2010). Finally, Persson and Tabellini (1998)
and Kontopoulos and Perotti (1999) also find that countries with proportional representation electoral
systems and frequent coalition governments have, on average, comparatively larger governments.
Therefore, we further introduce a common measure of government concentration to our basic model, the
Herfindahl-Hirschmann index of the legislature, which is derived from our data on political parties. The
underlying reason that is usually mentioned to explain both findings is that political bargaining processes in
parliamentary coalitions have a tendency to increase the size of new spending programs.
Regarding the data structure and our estimation procedure, it should be noted that we observe
aggregated five-year changes in government size and regulatory activity as a function of the variables
mentioned above. The dataset contains 68 countries with Western political institutions, aggregated at five-
year periods between 1975 and 2010 (following the structure of the Economic Freedom of the World
dataset), giving us up to 471 individual observations. Our sample is restricted by requiring that all countries 7 The dataset in Cheibub et al. (2010) ends in 2008. However, we have in connection to other work expanded the data to include
more recent years until 2016. With respect to the category of civilian autocracy, it closely corresponds to what is otherwise
sometimes called electoral autocracy, competitive authoritarianism, and illiberal democracy (LeDuc et al. 2010; Levitsky and Way
2002; Zakaria 1997).
11
have a constitution similar to that of Western democracies, such that the de jure political institutions
resemble those of Western Europe and North America. This restriction is theoretically necessary as our
background for understanding and interpreting the relation between crises and policy changes rests on the
existence of, at least in principal, democratically structured political processes. Table A7 of the Appendix
list all the countries included in the analysis.
All estimations were conducted using simple OLS fixed effects regression for panel data,
introducing a one-period time lag of five years between the dependent and independent variables. The
initial levels of government size and regulation are also introduced as primary control variables to the
model, but due to the estimation procedure with country (and time) fixed effects, the dependent variable
will only capture changes in both variables of interest.8 The use of country fixed effects also means that we
can effectively control for the possible presence of path dependent reactions to the extraordinary event of
an economic crisis, as highlighted by Acemoglu et al. (2009). Marginal effects of interacted variables are
calculated by the Delta method (Brambor et al. 2006). Our baseline specification models changes in the
size and scope of government in country i at time t, as follows:
GovSizeit = β0 + β1GovSizeit−1 + β2Crisisit−1 + β3Ideologyit−1 + β4(Crisisit−1 × Ideologyit−1)
+ β5Controlsit−1 + cfei + tfet + εi
A potential problem in this setting is that countries with a comparatively larger government (or
excessive and inadequate regulation) might also present a larger crisis risk. In fact, this seems to be highly
probable, according to some recent contributions (e.g. Taylor 2008; Coll 2014; Bjørnskov 2016). Still, while
the crisis variables may be endogenous to changes in interventionist policies, we argue that the interaction
term between government ideology and crises is unlikely to suffer from endogeneity bias. According to
Nizalova and Murtazashvili (2016), when one of the interaction variables is plausibly exogenous, an
interaction term and the heterogeneity of an effect can still be interpreted causally. This is exactly the
situation in our case, because the ideology of the government is not affected by crises: Our data shows that
governments often change during an economic crisis, but what is important in this context is that the
8 As any study that employs a lagged dependent variable, this will inevitably introduce Nickell bias into our estimations. Still, this
issue is difficult to solve in such a setting, as all possible solutions likely introduce more harm than good, and it is further unclear
whether such a bias is really poses a serious problem in applied work (cf. Beck et al. 2014).

12
change in government ideology is not in any way directional, meaning that voters are not any more likely to
vote for governments of a specific ideology during an economic downturn.9 In addition, there is also no
reason to believe that either right- or left-wing governments are more likely to create an economic crisis,
due to the fact that crisis-conductive policies are usually of a much more structural and long-term nature
(Taylor 2008). Our dataset also shows a very similar distribution of government ideology with and without
the occurrence of an economic crisis.
If we interpret government ideology as exogenous to crisis, as we argue it is, our interaction term
will also produce unbiased coefficients, as long as the direction and extent of omitted variable bias
produced by the crisis measure does not directly depend on government ideology (cf. Dreher et al. 2016).
As we argue, this is unlikely to be the case and, in addition, all country-specific structural factors that could
jointly produce crisis and governments of a certain ideology are effectively controlled for by the country
and time fixed effects of our basic estimation model. Therefore, coefficients on the crisis-ideology
interaction variable can reasonably be interpreted as exogenous.10
3. Results
3.1. Main results
Taking a quick look at the evolution of our dependent variables across all included countries, Figure 1
shows that government size was particularly large in the early 1980’s, after the second oil crisis. Since then
it has experienced an almost continuous decline, with an absolute low point being reached around the year
2005. Probably as a consequence of the crisis episode that started in 2008, the figure shows a renewed
increase for the period between 2005 and 2010. A similar evolution is visible for overall regulation, albeit at
a much lower level. Overall, the graphical evolution gives some support to the hypothesis that government
9 The average change in ideology in countries within our sample experiencing a crisis is .007 while that of countries in periods
without a crisis is .008; the difference between the two is as far from significance as one could wish (p<.98). Even with hard
crises, the difference is between -.004 and .013 (p<.61), illustrating how unlikely it is that crises affect the ideological make-up of
the government. To rule out an additional source of bias, we also check whether the possibility to call early elections will make a
difference here: most democratic governments do not have the possibility, or the rational foresight, to call elections just before
the onset of a crisis, when it might best suit them to do so. The governments that do have this possibility are a minority, and
they do not significantly influence our results (see Table A4 of the appendix). 10 In the appendix, we nevertheless conduct a number of placebo tests, where all findings further point towards the
interpretation of causality forwarded above (see Tables A1, A2, and A4).

13
size and regulation increase as a reaction to economic crisis, even though it does not support the idea that
government continuously grows over time and cannot be rolled back.
Figure 1. Government size and regulation over time
Table 2 presents the results of our baseline model, where we look at the current effects of a crisis,
presenting also the full set of individual control variables. Area 1 is employed to capture changes in the size
of government, and area 5 to capture changes in overall economic regulatory activity. Columns 1 and 2
show estimates for the entire country sample, while columns 3 and 4 exclude military dictatorships, and
equations 5 and 6 exclude all political autocracies – civilian or military – from the model.
Before describing the principal association of interest between government size, economic crisis,
and ideology, a few words apply regarding the other control variables and their relation to the dependent
variables. First, we find that initial levels of government size and economic regulation enter all columns in
Table 2 with a positive and statistically highly significant coefficient at the 1% level. Contrary to common
intuition, this result indicates that those countries with already bigger governments and more regulation
also have a larger tendency to increase both elements in the following period. Second, we find little or no
indication that GDP per capita levels, openness, or coalition governments bear any relation to changes in
2
2.5
3
3.5
4
4.5
5
5.5
6
1970 1975 1980 1985 1990 1995 2000 2005 2010
Regulation Government size

14
government size and economic regulation, although this result may arguably be influenced by the fact that
we are not looking at comparative levels but medium-run changes in our model. Third, we find some
indications that larger countries, those with a presidential regime, and military dictatorships all share a
tendency to increase economic regulation, all else being equal. Interestingly, all three are usually associated
with smaller public sectors, as reviewed in the previous section. In line with Posner (1971), these results
would indicate that a smaller government is perhaps compensated for by comparatively higher increases in
economic regulation. Fourth, the latter finding is further confirmed by the results for civilian autocracies,
which also present a tendency to increase economic regulation, but show a parallel inclination to reduce
government size in the economy.
Coming to our principle variables of interest, Table 2 confirms ordinary expectations and previous
research by showing that governments with a more conservative (i.e. economically classic liberal) ideology
reduce public sector size in the economy outside of crises, but that government ideology presents
absolutely no relation with changes in economic regulation.11 In turn, coefficients on the current crisis
variable show that more years spent in an economic downturn are associated with larger following
increases in both the size of the public sector and overall regulation. Still, these coefficients should not be
interpreted without considering the interaction effects of both variables, which is also our primary focal
point in this paper. The lower part of Table 2 present the marginal effect of years spent in an economic
crisis, dependent on different levels of government ideology. Here it can be seen in column 1 that all
governments seem to present a tendency to increase government size during a crisis, regardless of their
political ideology. Coefficients further imply that socialist governments generate larger public sector
increases as a reaction to an economic crisis, even though ideological differences are not statistically
significant and should thus be regarded as indicative. In turn, ideological differences are statistically
significant in the case of regulation, where left-wing governments present larger regulation increases in
column 2, while results for right-wing governments are insignificant. These findings are confirmed when
excluding military and civilian dictatorships in columns 4 to 6, demonstrating that they are not driven by a
specific type of political regime that may only have the appearance of democracy. In fact, a comparison of
the coefficients indicates that the effect seems to be stronger, while the ideological differences are further
11 It must be stressed that because the specification includes an interaction term between ideology and crisis, the point estimate
of government ideology per se represents the effect of ideology when there is no crisis. Any effect of ideology within a crisis is
the sum of this point estimate and the interaction.

15
significant and more precisely estimated when excluding these regimes. These results are further
represented in Figures 2 and 3, where we graphically show the marginal effects of an economic crisis on
government size and regulation, dependent on political ideology. In both figures, black represents the full
sample, while grey shows the effect for democratic governments only.
Table 2. Current effects Sample All All No military No military No autocracies No autocracies Dependent Area 1 Area 5 Area 1 Area 5 Area 1 Area 5 1 2 3 4 5 6 Initial level .385***
(.041) .475*** (.045)
.384*** (.043)
.470*** (.046)
.381*** (.043)
.469*** (.046)
Log GDP per capita
-.326 (.235)
.281 (.196)
-.164 (.273)
.313 (.211)
.004 (.337)
.522** (.259)
Openness -.395 (.267)
-.134 (.194)
-.565** (.277)
-.123 (.198)
-.483 (.308)
.026 (.214)
Log population size
-.229 (.443)
.752** (.349)
-.198 (.465)
.687* (.357)
.188 (.509)
1.115*** (.389)
Presidential democracy
-.308 (.349)
.584** (.265)
-.489 (.445)
.807** (.357)
- -
Civilian autocracy -.806*** (.302)
.452** (.222)
-.890*** (.337)
.555** (.253)
- -
Military dictatorship
-.487 (.361)
.468* (.272)
- - - -
Coalition government
-.056 (.124)
-.038 (.091)
-.009 (.125)
-.055 (.092)
-.015 (.128)
.025 (.092)
Government ideology
-.343** (.168)
-.136 (.121)
-.346** (.173)
-.134 (.125)
-.342* (.178)
-.029 (.128)
Number of crises years
.152*** (.039)
.123*** (.029)
.129*** (.042)
.124*** (.032)
.168*** (.044)
.153*** (.032)
Crisis * ideology -.078 (.079)
-.143** (.058)
-.065 (.083)
-.169*** (.062)
-.156* (.087)
-.211*** (.063)
Period FE Yes Yes Yes Yes Yes Yes Country FE Yes Yes Yes Yes Yes Yes Observations 471 435 443 422 407 392 Countries 68 68 68 68 66 66 Within R squared .449 .681 .442 .674 .461 .666 Between R squared
.357 .299 .557 .294 .498 .125
F statistic 17.46 41.42 16.71 41.01 18.59 41.41 Crisis effect at: 10th percentile .183***
(.057) .180*** (.043)
.156** (.060)
.192*** (.046)
.231*** (.063)
.237*** (.047)
25th percentile .152*** (.039)
.123*** (.029)
.129*** (.042)
.124*** (.032)
.168*** (.044)
.153*** (.032)
Median .131*** (.040)
.084*** (.029)
.112*** (.042)
.078** (.031)
.126*** (.043)
.096*** (.031)
75th percentile .113** (.048)
.052 (.035)
.097* (.051)
.039 (.036)
.091* (.052)
.047 (.036)
90th percentile .107** (.052)
.041 (.037)
.092 (.055)
.027 (.039)
.079 (.056)
.031 (.039)

16
Note: Standard errors in parentheses. *** (**) [*] denote significance at p<.01 (p<.05) [p<.10]. Marginal effects of interactions are calculated by the Delta method (Brambor et al., 2006).
Figure 2. Marginal effect of crisis on government size
Note: Grey shade is sample for democratic countries only (table 2, column 5).
So far, a main finding from Table 2 is that governments react to a current economic crisis in rather
heterogeneous ways, which is also in line with common expectations from political economy:
Governments of all political ideology increase the size of government as an immediate crisis reaction, but
this increase is probably more pronounced for governments on the left side of the political spectrum than
for those on the right. Similarly, to the extent that the average crisis estimates are unbiased, only socialist
governments increase economic regulation to a significant degree, while governments with a classically
liberal ideology in general seem to refrain from doing so. In both cases, coefficients denote that the
combined effect is not overly sizable, but neither is it inconsequential.
-0.3
-0.2
-0.1
0
0.1
0.2
0.3
0.4
0.5
0.6
-1 -0.9 -0.8 -0.7 -0.6 -0.5 -0.4 -0.3 -0.2 -0.1 0 0.1 0.2 0.3 0.4 0.5 0.6 0.7 0.8 0.9 1

17
Figure 3. Marginal effect of crisis on economic regulation
Note: Grey shade is sample for democratic countries only (table 2, column 6).
Given the fact that we find heterogeneous reactions to a current economic crisis raises the question
whether potential ratchet effects are also primarily driven by political ideology, and if left-wing
administrations create more lasting increases in the size and scope of government than right-wing
administrations? Table 3 evaluates this particular question by simply introducing a one-period lagged crisis
effect to our basic model to capture policy ratchets. All models presented here further employ the full set
of control variables from the previous table, but due to the fact that findings are practically identical, these
are simply omitted in Table 3.
Generally, the estimates in Table 3 confirm the earlier results that governments with a more
conservative / classical liberal ideology reduce public sector size in the economy, while more years spent in
a current economic downturn are associated with larger following increases in the size of the public sector
and overall regulation. In turn, there is absolutely no overall effect of the lagged crisis variable whatsoever.
The lower part of Table 3 again presents the marginal effect of years spent in a current economic crisis,
depending on different levels of government ideology. Here, the earlier finding that, as a reaction to a
current economic crisis, more left-wing governments also generate larger increases in the size and scope of
-0.3
-0.2
-0.1
0
0.1
0.2
0.3
0.4
0.5
0.6
-1 -0.9 -0.8 -0.7 -0.6 -0.5 -0.4 -0.3 -0.2 -0.1 0 0.1 0.2 0.3 0.4 0.5 0.6 0.7 0.8 0.9 1

18
government is confirmed.12 In addition, marginal effects for lagged economic crises are further presented
in the lower part of the table where we find absolutely no significant evidence at all for heterogeneous
policy reversals: Lagged economic crises present no association with increases in the size of government or
economic regulation, regardless of the political ideology of the following government in power.
The results of Table 3 thus show no evidence of any policy reversals, regardless of the ideology of
the next government in power. Still, this also means that the previous increases are, at least on average, not
rolled back again after the crisis is over, indicating that Higgs (1987) was correct and that policy ratchets are
a general phenomenon in Western democracies. Reconciling these findings with the evolution of
government size in Figure 1 is somewhat challenging, because the latter shows that government size can,
and has, been rolled back over the time period under observation. Perhaps, both are not incompatible
though, as the relative reduction of government size does not occur as a long-term consequence of
economic crisis, but perhaps rather during strong growth phases.
Table 3. Including ratchet effects Sample All All No military No military No autocracies No
autocracies Dependent Area 1 Area 5 Area 1 Area 5 Area 1 Area 5 1 2 3 4 5 6 Full baseline included Government ideology
-.433** (.198)
-.106 (.145)
-.435** (.203)
-.115 (.149)
-.552*** (.212)
.013 (.156)
Number of crises years
.151*** (.040)
.122*** (.030)
.132*** (.043)
.124*** (.032)
.179*** (.044)
.156*** (.033)
Crisis * ideology -.080 (.079)
-.142** (.058)
-.069 (.084)
-.167*** (.062)
-.164* (.087)
-.207*** (.063)
Lagged crises -.055 (.044)
.015 (.034)
-.035 (.045)
.014 (.034)
-.046 (.047)
.046 (.036)
Lagged crisis * ideology
.084 (.083)
-.028 (.064)
.078 (.086)
-.018 (.066)
.171* (.092)
-.047 (.069)
Period FE Yes Yes Yes Yes Yes Yes Country FE Yes Yes Yes Yes Yes Yes Observations 471 435 443 422 407 392 Countries 68 68 68 68 66 66 Within R squared .452 .681 .444 .674 .467 .668 Between R squared .331 .295 .525 .289 .519 .110 F statistic 15.81 37.10 14.97 36.51 16.69 36.61 Current crisis effect at: 10th percentile .183***
(.057) .179*** (.043)
.159*** (.051)
.191*** (.047)
.244*** (.064)
.239*** (.048)
25th percentile .151*** .122*** .132*** .124*** .179*** .156***
12 For ease of description, we now refer to the crisis with only a one period time lag as a “current economic crisis”, while the
crisis with a two period time lag is referred to as a “lagged economic crisis”.

19
(.040) (.030) (.043) (.032) (.044) (.033) Median .129***
(.040) .084*** (.029)
.113*** (.043)
.079** (.031)
.134*** (.044)
.099*** (.031)
75th percentile .111** (.049)
.052 (.035)
.097* (.051)
.041 (.037)
.096* (.053)
.052 (.037)
90th percentile .105** (.053)
.041 (.038)
.092 (.055)
.028 (.039)
.084 (.057)
.037 (.039)
Lagged crisis effect at 10th percentile -.089
(.064) .026
(.051) -.067 (.066)
.022 (.052)
-.114 (.070)
.065 (.055)
25th percentile -.055 (.044)
.015 (.034)
-.035 (.045)
.014 (.034)
-.046 (.047)
.046 (.036)
Median -.032 (.042)
.007 (.030)
-.014 (.043)
.009 (.031)
.001 (.043)
.034 (.031)
75th percentile -.013 (.048)
.001 (.034)
.004 (.050)
.005 (.036)
.039 (.051)
.023 (.035)
90th percentile -.007 (.052)
-.001 (.037)
.009 (.054)
.004 (.038)
.053 (.055)
.019 (.038)
Note: Standard errors in parentheses. *** (**) [*] denote significance at p<.01 (p<.05) [p<.10]. Marginal effects of interactions are calculated by the Delta method (Brambor et al., 2006).
3.2. Specific areas
The previous two tables show that one main association of current economic crisis reactions by
government seems to be in the area of government size. As area 1 of the EFW index is by itself a
compound indicator of government size, we believe it is interesting to delve deeper into which underlying
factors are actually responsible for this overall increase. Therefore, Table 4 repeats estimations from the
previous tables, but splits area 1 into its four principal components. These measure the separate concepts
of government consumption (1a), transfers and subsidies (1b), government enterprises and investment (1c),
and top marginal tax rate (1d). As in Table 3, we include the full baseline but only report the specific
results.
The lower part of Table 4 indicates that governments with a left-wing ideology tend to increase
government consumption and transfers and subsidies as a reaction to a current economic crisis, while no
such thing can be observed for right-wing governments. Hence, we observe strong, politically
heterogeneous responses to government consumption and transfers and subsidies. In turn, both sides of
the political spectrum seem to somewhat increase government enterprises and investment, which would
point to a non-ideological response in this particular area. Again, we find almost no evidence for
heterogeneous ratchet effects. Lagged economic crises present no association with variations in
government consumption, transfers and subsidies, and government enterprises and investment,
disregarding political ideology. Only in the case of top marginal tax rates, there is some evidence that left-

20
wing governments have a stronger tendency to increase these in the years following, which somewhat
confirms common intuition.
Table 4. Including ratchet effects, specific sub-indices Sample All All All All Dependent Area 1a Area 1b Area 1c Area 1d 1 2 3 4 Full baseline included Government ideology .556
(.761) .437
(.685) 6.902*** (2.242)
-.749* (.383)
Number of crises years -.569*** (.158)
-.336** (.138)
-.773* (.461)
.028 (.081)
Crisis * ideology .507 (.309)
.254 (.281)
-.370 (.924)
.078 (.169)
Lagged crises .279 (.171)
.118 (.149)
.279 (.496)
-.147* (.083)
Lagged crisis * ideology .025 (.322)
-.263 (.288)
-.760 (.947)
.159 (.161)
Period FE Yes Yes Yes Yes Country FE Yes Yes Yes Yes Observations 484 440 429 399 Countries 68 67 67 68 Within R squared .375 .288 .478 .593 Between R squared .501 .614 .137 .128 F statistic 11.85 7.14 15.64 22.68 Current crisis effect at: 10th percentile -.772***
(.226) -.438** (.203)
-.625 (.656)
-.003 (.125)
25th percentile -.569*** (.158)
-.336** (.138)
-.773* (.461)
.028 (.081)
Median -.432*** (.157)
-.267* (.137)
-.873* (.468)
.049 (.074)
75th percentile -.316* (.188)
-.209 (.165)
-.958* (.568)
.067 (.088)
90th percentile -.277 (.203)
-.190 (.179)
-.986 (.613)
.073 (.096)
Lagged crisis effect at 10th percentile .270
(.250) .223
(.222) .583
(.718) -.211* (.126)
25th percentile .279 (.171)
.118 (.149)
.279 (.496)
-.147* (.083)
Median .287* (.159)
.046 (.139)
.072 (.475)
-.104 (.073)
75th percentile .292 (-185)
-.014 (.162)
-.101 (.558)
-.067 (.084)
90th percentile .294 (.198)
-.034 (.175)
-.159 (.600)
-.055 (.091)
Note: Standard errors in parentheses. *** (**) [*] denote significance at p<.01 (p<.05) [p<.10]. Marginal effects of interactions are calculated by the Delta method (Brambor et al., 2006).
21
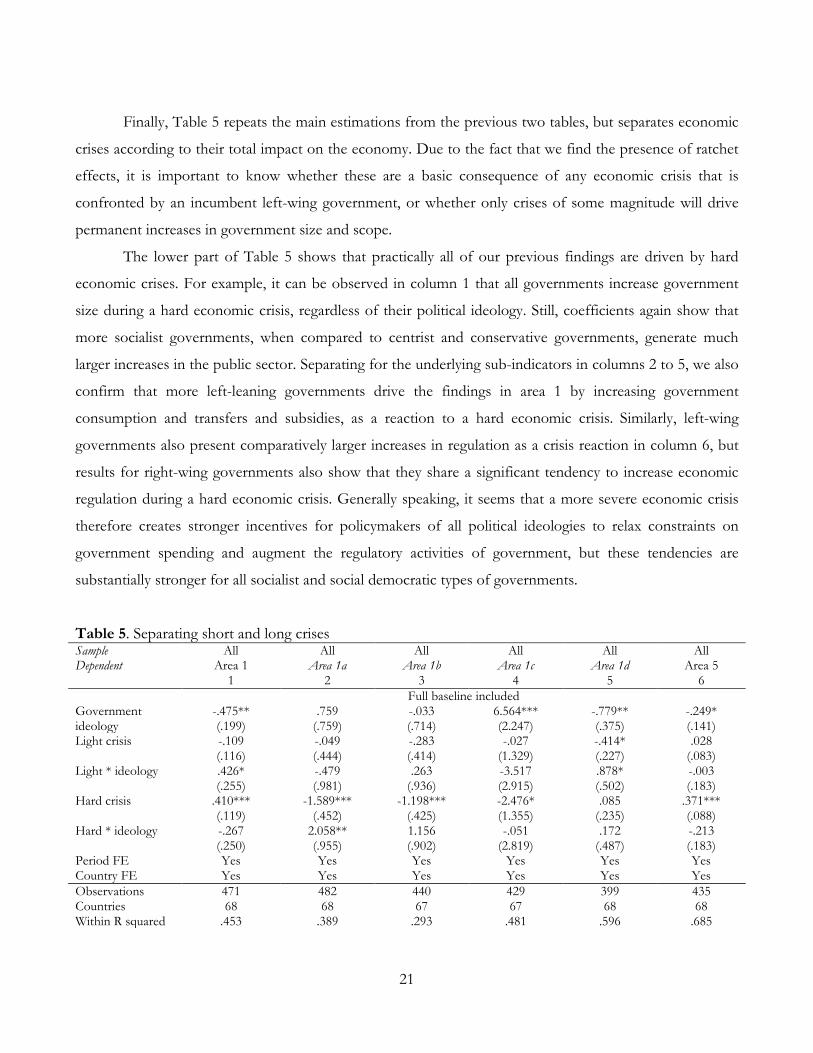
Finally, Table 5 repeats the main estimations from the previous two tables, but separates economic
crises according to their total impact on the economy. Due to the fact that we find the presence of ratchet
effects, it is important to know whether these are a basic consequence of any economic crisis that is
confronted by an incumbent left-wing government, or whether only crises of some magnitude will drive
permanent increases in government size and scope.
The lower part of Table 5 shows that practically all of our previous findings are driven by hard
economic crises. For example, it can be observed in column 1 that all governments increase government
size during a hard economic crisis, regardless of their political ideology. Still, coefficients again show that
more socialist governments, when compared to centrist and conservative governments, generate much
larger increases in the public sector. Separating for the underlying sub-indicators in columns 2 to 5, we also
confirm that more left-leaning governments drive the findings in area 1 by increasing government
consumption and transfers and subsidies, as a reaction to a hard economic crisis. Similarly, left-wing
governments also present comparatively larger increases in regulation as a crisis reaction in column 6, but
results for right-wing governments also show that they share a significant tendency to increase economic
regulation during a hard economic crisis. Generally speaking, it seems that a more severe economic crisis
therefore creates stronger incentives for policymakers of all political ideologies to relax constraints on
government spending and augment the regulatory activities of government, but these tendencies are
substantially stronger for all socialist and social democratic types of governments.
Table 5. Separating short and long crises Sample All All All All All All Dependent Area 1 Area 1a Area 1b Area 1c Area 1d Area 5 1 2 3 4 5 6 Full baseline included Government ideology
-.475** (.199)
.759 (.759)
-.033 (.714)
6.564*** (2.247)
-.779** (.375)
-.249* (.141)
Light crisis -.109 (.116)
-.049 (.444)
-.283 (.414)
-.027 (1.329)
-.414* (.227)
.028 (.083)
Light * ideology .426* (.255)
-.479 (.981)
.263 (.936)
-3.517 (2.915)
.878* (.502)
-.003 (.183)
Hard crisis .410*** (.119)
-1.589*** (.452)
-1.198*** (.425)
-2.476* (1.355)
.085 (.235)
.371*** (.088)
Hard * ideology -.267 (.250)
2.058** (.955)
1.156 (.902)
-.051 (2.819)
.172 (.487)
-.213 (.183)
Period FE Yes Yes Yes Yes Yes Yes Country FE Yes Yes Yes Yes Yes Yes Observations 471 482 440 429 399 435 Countries 68 68 67 67 68 68 Within R squared .453 .389 .293 .481 .596 .685

22
Between R squared .295 .469 .627 .129 .131 .284 F statistic 15.87 12.56 7.31 15.83 22.95 37.72 Light crisis effect at: 10th percentile -.279
(.189) .142
(.727) -.388 (.699)
1.379 (2.161)
-.765** (.381)
.029 (.137)
25th percentile -.109 (.116)
-.049 (.444)
-.283 (.414)
-.027 (1.329)
-.414* (.227)
.028 (.083)
Median .006 (.099)
-.179 (.383)
-.211 (.340)
-.979 (1.158)
-.176 (.184)
.028 (.071)
75th percentile .104 (.119)
-.289 (.464)
-.151 (.411)
-1.785 (1.398)
.025 (.219)
.027 (.086)
90th percentile .136 (.131)
-.325 (.509)
-.131 (.454)
-2.049 (1.533)
.091 (.241)
.027 (.094)
Hard crisis effect at 10th percentile .517***
(.183) -2.413***
(.697) -1.661**
(.668) -2.455 (2.052)
.016 (.368)
.456*** (.135)
25th percentile .410*** (.119)
-1.589*** (.452)
-1.198*** (.425)
-2.476* (1.355)
.085 (.235)
.371*** (.088)
Median .338*** (.111)
-1.032** (.423)
-.885** (.386)
-2.489* (1.293)
.132 (.209)
.313*** (.082)
75th percentile .276** (.134)
-.561 (.512)
-.621 (.464)
-2.501 (1.564)
.171 (.247)
.265*** (.098)
90th percentile .256* (.146)
-.406 (.557)
-.534 (.505)
-2.505 (1.697)
.184 (.269)
.285** (.106)
Note: Standard errors in parentheses. *** (**) [*] denote significance at p<.01 (p<.05) [p<.10]. Marginal effects of interactions are calculated by the Delta method (Brambor et al., 2006). Hard crises are distinguished from light crises by having cumulative GDP losses larger than four percent of GDP.
So as to check the robustness of our results, we present a number of additional tests in the
appendix. These provide good indications that our findings are not influenced by reverse causality or
omitted variable bias. In addition, results are robust to different types of crisis, different measurement
techniques, and a whole array of subsamples that could theoretically influence the outcome. None of these
tests suggests that our findings present any serious problems and, as such, we can be pretty confident that
they actually do represent crisis reactions by ideologically different governments, and not something else.
4. Conclusions
The hardships produced by the 2008 financial and economic crisis have led to some very heated public
debate on how much government should intervene in the economy. Previous theoretical and empirical
studies argue that economic crises may lead to more interventionist policies and bigger governments, but
also cause deregulation and reductions of public sector size. In this paper, we argue that whether or not
governments implement more or less interventionist economic policy may well depend on their core
political ideology. So far, this hypothesis has not been tested in the empirical literature on the topic.
23
Employing a panel of 68 countries with Western political institutions observed between 1975 and
2010, and using the development of a set of indicators of government size and regulation, we find that
crises in general cause more interventionist policies when countries have left-wing governments. These
generate larger increases in the size of government, which appear mainly to be driven by surges in
government final consumption and government transfers and subsidies. Likewise, socialist governments
also increase economic regulation to a significant degree, while conservative or other right-wing
governments seem to refrain from doing so. Finally, we encounter that more severe economic crises create
stronger incentives for policymakers of all political ideologies to relax constraints on government spending
and augment the regulatory activities of government, but these tendencies remain much stronger for left-
leaning governments.
Interestingly, we find absolutely no evidence at all for heterogeneous policy reversals as a crisis
reaction, meaning that all following increases in the size and scope of government present a somewhat
permanent component, regardless of the political ideology of the incumbent government. It seems as if
economic crisis acts as an event that permanently relaxes the ordinary political constraints on government,
which especially left-wing administrations are prone to momentarily use to maximize government budgets
and introduce tighter regulations on markets. Conversely, right-wing administrations tend not to reduce the
size of government on their next ascent to power, thereby effectively creating policy ratchets. Roll backs of
the public sector thus only seem to be possible during extended phases of economic growth.
To some degree, these findings point to a fundamental flaw in many economic policy
recommendations, where government is often modelled as an omniscient benevolent dictator that will
eliminate market failures and thereby benefit overall economic outcome (i.e. Buchanan and Wagner 1977;
Holcombe 2012). In such a world, any government would choose an optimal size, given the economic
situation of the country, which should be adapted to current performance and be entirely independent of
the political ideology of those in power. Needless to say, that with such an underlying model of
government, it would be impossible to explain the findings presented in this paper.
Acknowledgements
We thank Sutirtha Bagchi, Niclas Berggren, Sebastián Coll, Enrico Colombatto, Sven-Olov Daunfeldt,
Vera Eichenauer, Erich Gundlach, Jerg Gutmann, Randy Holcombe, Henrik Jordahl, Florian Neumeier,
and Panu Poutvaara for comments and suggestions on earlier versions of the paper. We gratefully

24
acknowledge financial support from the Institute for Research in Economic and Fiscal Issues. Bjørnskov
also gratefully acknowledges financial support from the Jan Wallander and Tom Hedelius Foundation.
Naturally, all remaining errors are entirely ours.
Appendix
This appendix contains a set of additional robustness tests for the present paper. We begin by providing
two placebo tests. In the first placebo test, we provide an intuitive test for reverse causality. If the crisis is
not the initiating event, but the policy response either causes the crisis or is simultaneously determined with
the crisis (an option for which we see no theoretical background), we would expect to be able to see signs
of this when lagging the crisis variable. In other words, the first placebo test consists of placing all crises
half a decade too late. To some extent, this is also the way we identify the potential policy ratchets, yet here
we only include the lagged crisis variable. The intuition behind this test is simple: if causality really ran the
other way and government size and scope were the main drivers of crisis risk, we should observe the
estimates getting larger and more significant. Instead, Table A1 suggests otherwise, as the lagged crisis
variables only attains significance in one case – government consumption – and the ideological
heterogeneity is substantially weaker and imprecisely measured.
Table A1. Lagging crisis Sample All All All All All All Dependent Area 1 Area 1a Area 1b Area 1c Area 1d Area 5 1 2 3 4 5 6 Full baseline included Government ideology
.533*** (.164)
-1.199* (.634)
-.763 (.558)
-6.344*** (1.861)
.636* (.326)
.260** (.126)
Lagged crises .067 (.045)
-.341** (.172)
-.139 (.150)
-.339 (.496)
.152 (.082)
-.012 (.034)
Lagged crisis * ideology
-.059 (.084)
-.116 (.325)
.205 (.288)
.649 (.946)
-.153 (.159)
.057 (.065)
Period FE Yes Yes Yes Yes Yes Yes Country FE Yes Yes Yes Yes Yes Yes Observations 471 484 440 429 399 435 Countries 68 68 67 67 68 68 Within R squared .432 .353 .276 .472 .592 .665 Between R squared
.312 .565 .602 .161 .132 .328
F statistic 16.27 12.08 7.52 17.10 25.28 38.46 Note: Standard errors in parentheses. *** (**) [*] denote significance at p<.01 (p<.05) [p<.10].
25
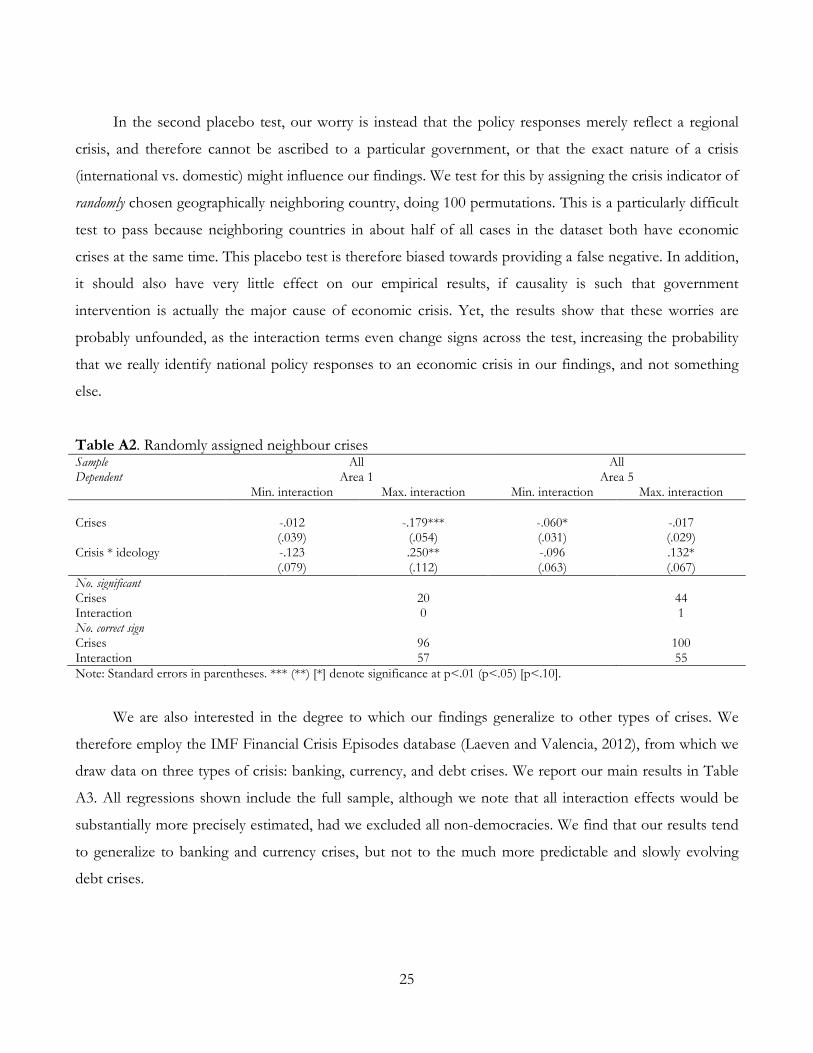
In the second placebo test, our worry is instead that the policy responses merely reflect a regional
crisis, and therefore cannot be ascribed to a particular government, or that the exact nature of a crisis
(international vs. domestic) might influence our findings. We test for this by assigning the crisis indicator of
randomly chosen geographically neighboring country, doing 100 permutations. This is a particularly difficult
test to pass because neighboring countries in about half of all cases in the dataset both have economic
crises at the same time. This placebo test is therefore biased towards providing a false negative. In addition,
it should also have very little effect on our empirical results, if causality is such that government
intervention is actually the major cause of economic crisis. Yet, the results show that these worries are
probably unfounded, as the interaction terms even change signs across the test, increasing the probability
that we really identify national policy responses to an economic crisis in our findings, and not something
else.
Table A2. Randomly assigned neighbour crises Sample All All Dependent Area 1 Area 5 Min. interaction Max. interaction Min. interaction Max. interaction Crises -.012
(.039) -.179***
(.054) -.060* (.031)
-.017 (.029)
Crisis * ideology -.123 (.079)
.250** (.112)
-.096 (.063)
.132* (.067)
No. significant Crises 20 44 Interaction 0 1 No. correct sign Crises 96 100 Interaction 57 55 Note: Standard errors in parentheses. *** (**) [*] denote significance at p<.01 (p<.05) [p<.10].
We are also interested in the degree to which our findings generalize to other types of crises. We
therefore employ the IMF Financial Crisis Episodes database (Laeven and Valencia, 2012), from which we
draw data on three types of crisis: banking, currency, and debt crises. We report our main results in Table
A3. All regressions shown include the full sample, although we note that all interaction effects would be
substantially more precisely estimated, had we excluded all non-democracies. We find that our results tend
to generalize to banking and currency crises, but not to the much more predictable and slowly evolving
debt crises.

26
Table A3. Alternative crisis indicators Sample All All All All All All Dependent Area 1 Area 5 Area 1 Area 5 Area 1 Area 5 1 2 3 4 5 6 Full baseline included Government ideology
.565*** (.131)
.404*** (.098)
.477*** (.138)
.272*** (.099)
.466*** (.132)
.342*** (.097)
Banking crisis -.166 (.133)
-.098 (.096)
Banking * ideology
-.534* (.298)
-.399* (.217)
Currency crisis -.291** (.134)
-.500*** (.100)
Currency * ideology
.051 (.265)
.426** (.194)
Debt crisis -.269 (.185)
-.308** (.144)
Debt * ideology .033 (.319)
-.131 (.250)
Period FE Yes Yes Yes Yes Yes Yes Country FE Yes Yes Yes Yes Yes Yes Observations 471 435 471 435 471 435 Countries 68 68 68 68 68 68 Within R squared .442 .672 .436 .687 .432 .669 Between R squared
.508 .281 .295 .287 .340 .319
F statistic 16.94 39.77 16.53 42.51 16.25 39.13 Crisis effect at 10th percentile .047
(.217) .062
(.159) -.311 (.196)
-.671*** (.146)
-.282 (.222)
-.256 (.176)
25th percentile -.166 (.133)
-.098 (.096)
-.291** (.134)
-.500*** (.100)
-.269 (.185)
-.308** (.144)
Median -.311*** (.117)
-.206** (.082)
-.277** (.129)
-.385*** (.096)
-.259 (.207)
-.344** (.159)
75th percentile -.433*** (.143)
-.298*** (.101)
-.266* (.155)
-.287** (.113)
-253 (248)
-.374** (.191)
90th percentile -.473*** (.157)
-.328*** (.111)
-.261 (.167)
-.255** (.122)
-.250 (.265)
-.383* (.204)
Note: Standard errors in parentheses. *** (**) [*] denote significance at p<.01 (p<.05) [p<.10]. Marginal effects of interactions are calculated by the Delta method (Brambor et al., 2006). Hard crises are distinguished from light crises by having cumulative GDP losses larger than four percent of GDP.
Next, we deal with a particular problem associated with ascribing the policy response to a particular
exogenously given ideology. For us to be able to interpret the interaction effect causally, at least one of the
interacting variables must be approximately exogenous (Nizalova and Murtazashvili, 2016). We argue that
although deep economic crises may raise the risk that the incumbent government is ousted from power,
the ideology of the potentially new government is not associated with either the crisis or the policy
response. However, in a relatively limited number of countries, it is within the power of the government or
parliament to call an early election. Denmark provides the starkest example of this particular institutional

27
detail, as the prime minister can call an election at practically any time in the four years following the last
election.
The problem we address is therefore that when an early election is possible, government ideology
may not be properly exogenous to the policy response. The reason is that if the incumbent government can
call an early election, it could theoretically test its electoral support for a proposed crisis response. The
policy response may thus decide the election and thereby the ideology of the government that implements
any crisis response. A similar logic applies to situations in which parliament forces an early election as a
response to a policy proposal or a political crisis associated with the economic crisis. These considerations
only apply when early elections are constitutionally or de facto possible. Based on information from the
CIA (2016) and the PARLINE (2016) database, we code a variable that captures whether or not it is
possible to call an early election. In Table A4, we introduce this variable in a triple interaction with
government ideology and the crisis indicator, allowing us to assess whether the main findings are driven by
early elections.
Although it is difficult to interpret triple interactions, we observe a consistent pattern across all
regulation regressions, and the government size regression in column 5. We find that while the interaction
between government ideology and the crisis indicator is significant and slightly larger than in the
corresponding Table 2 in the paper, the triple interaction early * crisis * ideology, which captures the
additional effect in countries that allow for early elections, is always of the opposite sign and almost as large.
This indicates that the results in the paper are almost entirely driven by the large majority of democracies
with fixed term limits whereas we cannot make any conclusive, causal statements about the comparative
effects in the smaller number of countries that allow early elections.
Table A4. Accounting for early elections Sample All All No military No military No
autocracies No
autocracies Dependent Area 1 Area 5 Area 1 Area 5 Area 1 Area 5 1 2 3 4 5 6 Full baseline included Government ideology
.342* (.205)
.209 (.145)
.306 (.214)
.166 (.151)
.289 (.224)
.010 (.159)
Number of crises years
-.113** (.048)
-.085** (.037)
-.069 (.052)
-.076* (.039)
-.104* (.054)
-.118*** (.039)
Early elections .439 (.499)
1.132*** (.372)
.698 (.569)
1.775*** (.447)
1.534* (.886)
2.309*** (.593)
Crisis * ideology .102 (.092)
.147** (.066)
.108 (.097)
.192*** (.070)
.216** (.103)
.247*** (.074)
Early * ideology -.041 -.242 .009 -.187 .046 -.058

28
(.378) (.259) (.381) (.261) (.379) (.259) Early * crisis -.097
(.093) -.033 (.065)
-.136 (.095)
-.043 (.067)
-.108 (.095)
-.013 (.066)
Early * crisis * ideology
-.057 (.207)
-.113 (.143)
-.078 (.208)
-.159 (.144)
-.195 (.208)
-.202 (.142)
Period FE Yes Yes Yes Yes Yes Yes Country FE Yes Yes Yes Yes Yes Yes Observations 471 435 443 422 407 392 Countries 68 68 68 68 66 66 Within R squared .453 .694 .449 .695 .473 .688 Between R squared
.338 .364 .532 .315 .116 .174
F statistic 14.35 35.52 13.77 36.06 15.23 35.70 Note: Standard errors in parentheses. *** (**) [*] denote significance at p<.01 (p<.05) [p<.10].
Another test consists of only including countries that have a perfect record of democracy for all
years since 1970, or since independence. For example, we count Estonia as fully democratic since 1992,
while Uruguay is not included, due to its military dictatorship in the 1970s. This final test ensures that our
results are not driven by regime changes, but can actually be generalized for democratic systems.
Although the estimates in Table A5 are necessarily less precise, due to the somewhat smaller sample
size, a comparison with the results in Table 4 reveal that the overall pattern is unchanged: even with a
substantially smaller sample of 48 relatively similar countries with a long democratic tradition, we find that
crisis responses are ideologically heterogeneous in overall government size, government consumption,
transfers and subsidies, and most clearly in regulatory activity.
Table A5. Only stable democracies Sample All All All All All All Dependent Area 1 Area 1a Area 1b Area 1c Area 1d Area 5 1 2 3 4 5 6 Full baseline included Government ideology
.261 (.216)
-.290 (.783)
-.892 (.967)
-7.696*** (2.748)
.499 (.482)
.243* (.144)
Lagged crises -.237*** (.053)
.750*** (.172)
.489** (.210)
1.433*** (.597)
-.023 (.109)
-.122*** (.036)
Lagged crisis * ideology
.191* (.110)
-.661* (.343)
-.651 (.437)
.127 (1.265)
.022 (.228)
.145** (.073)
Period FE Yes Yes Yes Yes Yes Yes Country FE Yes Yes Yes Yes Yes Yes Observations 318 329 302 276 273 311 Countries 48 48 48 47 48 48 Within R squared .504 .514 .331 .534 .619 .710 Between R squared
.380 .536 .121 .062 .034 .134
F statistic 14.22 13.80 5.78 11.97 17.66 33.38 Note: Standard errors in parentheses. *** (**) [*] denote significance at p<.01 (p<.05) [p<.10].

29
Of course, some might argue that the findings presented above are actually an artefact, produced by
the compound nature of the EFW index, which has an overall tendency to increase over the time period
under observation. To some degree, we already show by disaggregating area 1 (government size) that this is
probably not the case. Still, in order to further enhance the certainty that our findings actually present crisis
reactions by governments and not something else, we repeat all estimations with EFW area 3 as dependent
variable, which measures the access to sound money. Theoretically, there is no reason to believe that
governments of different political ideology should produce different reactions in monetary policy when
combatting a crisis, due to the fact that most Western style political systems nowadays have central banks
that are rather independent of the political process. In particular since the 1980s, Western democracies
have moved towards having more politically independent central banks. We should therefore not observe
any clear results when employing area 3 – sound money – as the predicted variable in our estimations.
However, the possibility remains that right-wing governments employ alternative interventionist policies
such as monetary interventions instead of fiscal interventions. We test this option in Table A6 in which we
employ area 3 in the same specification as all other tests. As is evident, we find no significantly different
responses across types of political ideology, and even fail to find any clear responses when we restrict the
sample to including only stable regimes. This also means that our findings probably do represent crisis
reactions by governments and we can reject that the ideological difference is simply due to the choice of
policy instrument.
Table A6. Determinants of monetary policy responses Sample All No military No autocracies Only stable Dependent Area 3 Area 3 Area 3 Area 3 1 2 3 4 Initial level .394***
(.045) .398*** (.046)
.410*** (.049)
.364*** (.056)
Log GDP per capita .653 (.403)
.492 (.455)
.436 (.581)
2.141*** (.597)
Openness -.009** (.004)
-.009** (.004)
-.009* (.005)
-.017*** (.005)
Log population size -.778 (.747)
-.639 (.774)
-.683 (.891)
-1.403 (.909)
Presidential democracy -.109 (.603)
.889 (.754)
- -.913 (1.551)
Civilian autocracy .472 (.509)
.978* (.559)
- .804 (.742)
Military dictatorship -.261 (.619)
- - -2.025*** (.773)

30
Coalition government .455** (.211)
.526** (.212)
.435* (.224)
.501** (.254)
Government ideology .147 (.287)
.173 (.292)
.282 (.317)
.192 (.337)
Number of crises years -.314*** (.067)
-.292*** (.070)
-.268*** (.077)
-.057 (.082)
Crisis * ideology .193 (.135)
.112 (.141)
.086 (.154)
.004 (.169)
Period FE Yes Yes Yes Yes Country FE Yes Yes Yes Yes Observations 486 457 417 329 Countries 68 68 66 48 Within R squared .531 .525 .517 .534 Between R squared .342 .357 .384 .129 F statistic 25.13 24.17 23.99 16.77 Crisis effect at: 10th percentile -.391***
(.086) -.337***
(.101) -.303***
(.111) -.058 (.121)
25th percentile -.314*** (.067)
-.292*** (.070)
-.268*** (.077)
-.057 (.082)
Median -.262*** (.068)
-.261*** (.071)
-.245*** (.076)
-.056 (.081)
75th percentile -.218** (.082)
-.236*** (.086)
-.225** (.091)
-.055 (.098)
90th percentile -.203** (.089)
-.227** (.093)
-.218** (.099)
-.055 (.106)
Note: Standard errors in parentheses. *** (**) [*] denote significance at p<.01 (p<.05) [p<.10]. Marginal effects of interactions
are calculated by the Delta method (Brambor et al., 2006)
Finally, we have performed a set of country jackknife tests, in which we repeat the main estimates
excluding single country observations at a time. We illustrate the results of these tests in Figures A1-A3,
where we plot the estimated effect of crises evaluated at the 25th and 75th percentiles of government
ideology. These correspond to the reactions of a social democrat and a clearly conservative government.
We plot the results for the two policy types for which we find clear evidence: area 1a, i.e. government
consumption, area 1b, transfers and subsidies, and area 5, market regulations. For all three, the figures
illustrate how stable the estimates are across the jackknife tests. Overall, the figures first reveal that the
estimates for transfers and subsidies are substantially less stable than for the two other policy areas. Only
three of the estimates as evaluated with a social democrat government (the 25th percentile) are significant at
p<.01, and in one case (excluding Romania, country no. 56), the estimate fails significance at p<.05.
Our estimates turn out to be much more stable for government consumption and market
regulations. However, in both cases, the exclusion of Nicaragua (country no. 49) reduces the ideological
difference visibly. In the case of government consumption, the exclusion of Bolivia (country no. 9)
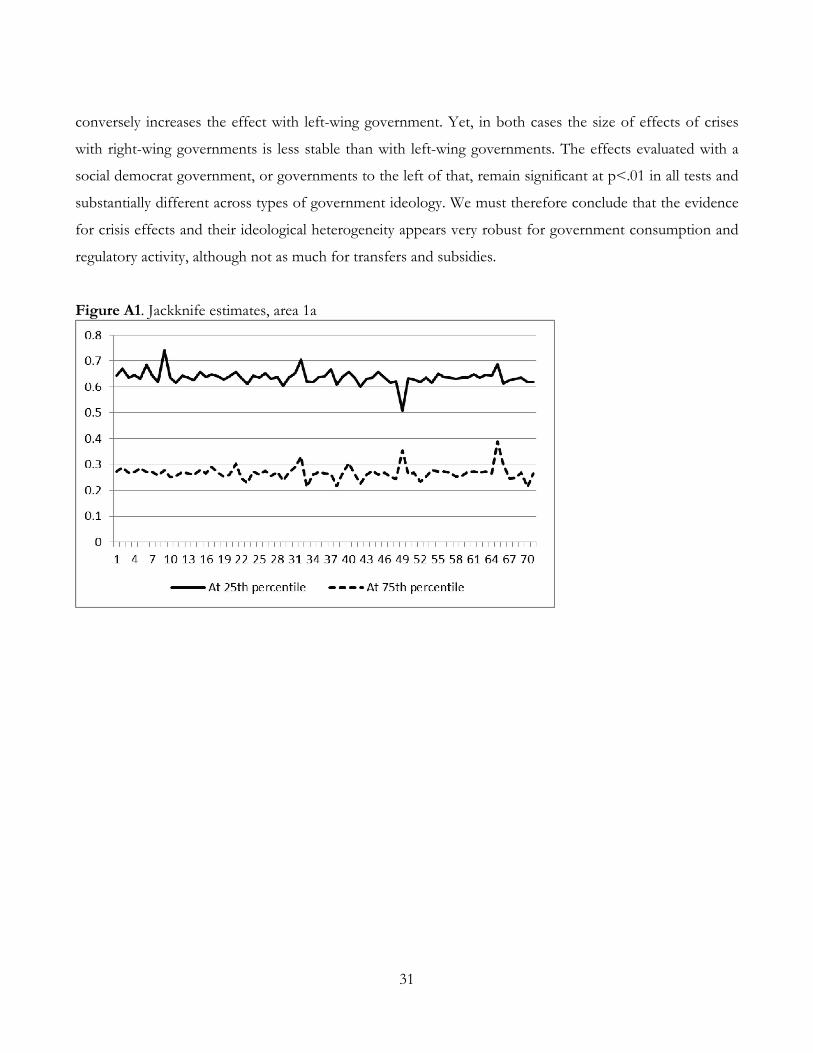
31
conversely increases the effect with left-wing government. Yet, in both cases the size of effects of crises
with right-wing governments is less stable than with left-wing governments. The effects evaluated with a
social democrat government, or governments to the left of that, remain significant at p<.01 in all tests and
substantially different across types of government ideology. We must therefore conclude that the evidence
for crisis effects and their ideological heterogeneity appears very robust for government consumption and
regulatory activity, although not as much for transfers and subsidies.
Figure A1. Jackknife estimates, area 1a

32
Figure A2. Jackknife estimates, area 1b
Figure A3. Jackknife estimates, area 5
0
0.05
0.1
0.15
0.2
0.25
0.3
0.35
0.4
0.45
1 4 7 10 13 16 19 22 25 28 31 34 37 40 43 46 49 52 55 58 61 64 67 70
At 25th percentile At 75th percentile

33
Table A7. Countries included in the sample Albania Czech Rep. Italy Poland Argentina Denmark Jamaica Portugal Australia Dominican Rep. Japan Romania Austria Ecuador Korea Serbia Bahamas El Salvador Latvia Singapore Barbados Estonia Lithuania Slovak Rep Belgium Finland Luxembourg Slovenia Belize France Macedonia Spain Bolivia Germany Malta Sweden Brazil Greece Mexico Switzerland Bulgaria Guatemala Netherlands Taiwan Canada Guyana New Zealand Trinidad and Tobago Chile Honduras Nicaragua Turkey Colombia Hungary Norway United Kingdom Costa Rica Iceland Panama United States Croatia Ireland Paraguay Uruguay Cyprus Israel Peru Venezuela Note: countries in italics have at least one observation in the sample during a period in it were not democratic

34
5. References
Acemoglu, D., Johnson S, Robinson J.A, & Yared, P. (2009). Reevaluating the modernization hypothesis.
Journal of Monetary Economics, 56, 1043-1058.
Aidt, T.S., & Jensen, P.S. (2009). Tax structure, size of government, and the extension of the voting
franchise in Western Europe, 1860–1938. International Tax and Public Finance, 16, 362-394.
Alesina, A. & Wacziarg, R. (1998). Openness, country size and government. Journal of Public Economics,
69, 305-321.
Alesina, A., Barbiero, O., Favero, C., Giavazzi, F., & Paradisi, M. (2015). Austerity in 2009-13. Economic
Policy, 30, 383-437.
Baier, S.L., Clance, M., & Dwyer, G.P. (2012). Banking crises and economic freedom. In: J.D. Gwartney, R.
Lawson, & J.C. Hall (Ed.), Economic Freedom of the World 2012 Annual Report. Vancouver, BC: Fraser
Institute.
Beck, N.L., Katz, J.N., & Migozzetti, U.G. (2014). Of Nickell Bias and its Cures: Comment on Gaibulloev,
Sandler, and Sul. Political Analysis, 22(2), 274-278.
Beck, T., Clarke, G., Groff, A., Keefer, P., & Walsh, P. (2010). New tools in comparative political
economy: The database of political institutions. World Bank Economic Review, 15, 165-176.
Benarroch, M., & Pandey, M. (2012). The relationship between trade openness and government size: Does
disaggregating government expenditure matter? Journal of Macroeconomics, 34, 239-252.
Bjørnskov, C. (2016). Economic freedom and economic crises. European Journal of Political Economy,
doi:10.1016/j.ejpoleco.2016.08.003
Bjørnskov, C., & Potrafke, N. (2011). Strikes, ideology and inequality: Is there any connection?
Washington, DC: Southern Economic Association, annual meeting.
Bjørnskov, C., & Potrafke, N. (2012). Political ideology and economic freedom across Canadian provinces.
Eastern Economic Journal, 38, 143-166.

35
Brambor, T., Clark, W.R. & Golder, M. (2006). Understanding interaction models: Improving empirical
analyses. Political Analysis, 14, 63-82.
Buchanan, J.M., & Wagner, R.F. (1977). Democracy in deficit. The political legacy of Lord Keynes. New
York City, NY: Academic Press.
Capoccia, G., & Keleman, R.D. (2007). The study of critical junctures: Theory, narrative, and
counterfactuals in historical institutionalism. World Politics, 59, 341-369.
Cheibub, J.A., Gandhi, J., & Vreeland, J.R. (2010). Democracy and dictatorship revisited. Public Choice,
143, 67-101.
CIA (2016). CIA World Factbook. Langley, VA: Central Intelligence Agency.
Coates, D., Heckelman, J.C., & Wilson, B. (2010). The political economy of investment: Sclerotic effects
from interest groups. European Journal of Political Economy, 26, 208-221.
Coll, S. (2014). Is there too much government in developed countries? A time-series analysis of 24 OECD-
economies, 1(1), 1-30.
de Haan, J., Sturm, J.E., & Zandberg, E. (2009). The impact of financial and economic crises on economic
freedom. In: J.D. Gwartney, R. Lawson, & J.C. Hall (Ed.), Economic Freedom of the World 2009 Annual
Report. Vancouver, BC: Fraser Institute.
Denzau, A.T., & North, D.C. (1994). Shared mental models: Ideologies and institutions. Kyklos, 47, 3-31.
Drazen, A., & Grilli, V. (1993). The benefit of crises for economic reforms. American Economic Review,
83, 598-607.
Dreher, A., Eichenauer, V.Z., Gehring, K. (2016). Geopolitics, aid, and growth: The impact of UN Security
Council membership on the effectiveness of aid. World Bank Economic Review, doi.org/10.1596/1813-
9450-7771
Faccini, F., & Melki, M. (2014). Political ideology and economic growth: evidence from the French
democracy. Economic Inquiry, 52, 1408-1426.
36
Funashima, Y. (2017). Wagner’s law versus displacement effect. Applied Economics, 49(7), 619-634.
Gwartney, J.D., Lawson, R., & Hall, J.C. (2015). Economic Freedom of the World 2015 Annual Report.
Vancouver, BC: Fraser Institute.
Haidt, J. (2012), The Righteous Mind: Why good People are divided by Politics and Religion. New York,
NY: Random House.
Heston, A., Summers, R., & Aten, B. (2012). Penn World Tables Version 7.1. Philadelphia, PA: Center for
International Comparisons of Production, Income, and Prices, University of Pennsylvania.
Higgs, R. (1987). Crisis and Leviathan: Critical Episodes in the Growth of American Government. Oxford,
GB: Oxford University Press.
Holcombe, R.G. (1993). Are there ratchets in the growth of federal government spending? Public Finance
Quarterly, 21, 33-47.
Holcombe, R.G. (2005). Government growth in the twenty-first century. Public Choice, 124, 95-114.
Holcombe, R.G. (2012). Make economics policy relevant. Depose of the omniscient benevolent dictator.
The Independent Review, 17, 165-176.
Kontopoulos, Y., & Perotti, R. (1999). Government fragmentation and fiscal policy outcomes: Evidence
from OECD countries. In: J.M. Poterba (Ed.), Fiscal Institutions and Fiscal Performance. Chicago, IL:
University of Chicago Press.
Krueger, A.O. (1993). Virtuous and vicious circles in economic development. American Economic Review,
83, 351-355.
Krugman, P. (2012). End this Depression Now. New York City, NY: W. W. Norton & Company.
Laeven, L., & Valencia, F. (2012). Systemic banking crises database: An update. IMF working paper
12/163. International Monetary Fund

37
LeDuc, L., Niemi, R.G., & Norris, P. (2010). Introduction. In: L. LeDuc, R.G. Niemi, & P. Norris (Ed.),
Comparing Democracies 3: Elections and Voting in the 21st Century. London: Sage.
Levitsky, S., & Way, L. (2002). The rise of competitive authoritarianism. Journal of Democracy, 13, 51-65.
Miller, G.J., & Moe, T.M. (1983). Bureaucrats, legislators, and the size of government. American Political
Science Review, 77, 297-322.
Nizalova, O.Y., & Murtazashvili, I. (2016). Exogenous treatment and endogenous factors: Vanishing of
omitted variable bias on the interaction term. Journal of Econometric Methods, 5, 71-77.
PARLINE (2016). Database on national parliaments. http://www.ipu.org/parline-e/parlinesearch.asp
(accessed June 2016).
Peacock, A.T., & Wiseman, J. (1961). The growth of public expenditure in the United Kingdom. London,
UK: National Bureau of Economic Research.
Peltzman, S. (1980). The growth of government. Journal of Law and Economics, 23, 209-287.
Persson, T., & Tabellini, G. (1998). The Size and Scope of Government: Comparative Politics with
Rational Politicians. National Bureau of Economic Research, Working Paper No. 6848.
Petrocik, J. R. (1996). Issue ownership in presidential elections, with a 1980 case study. American Journal
of Political Science, 40, 825-850.
Piketty, T. (2014). Capital in the Twenty-First Century. Cambridge, MA: Harvard University Press.
Pickering, A.C. & Rockey, J. (2011). Ideology and the growth of government. Review of Economics and
Statistic, 93, 907-919.
Pickering, A.C. & Rockey, J. (2013). Ideology and the size of US state government. Public Choice, 156,
443-465.
Pitlik, H., & Wirth, S. (2003). Does crises promote the extent of economic liberalization? An empirical test.
European Journal of Political Economy, 19, 565-581.
38
Pitlik, H. (2008). The impact of growth performance and political regime type on economic policy
liberalization. Kyklos, 61, 258-278.
Potrafke, N. (2010). Does government ideology influence deregulation of product markets? Empirical
evidence from OECD countries. Public Choice, 143, 135-155.
Posner, R.A. (1971). Taxation by regulation. Bell Journal of Economics and Management Science, 2, 22-50.
Rodrik, D. (1996). Understanding Economic Policy Reform. Journal of Economic Literature, 34, 9-41.
Rodrik, D. (1998). Why do more open economies have bigger governments? Journal of Political Economy,
106, 997-1032.
Soifer, H.D. (2012). The causal logic of Critical Junctures. Comparative Political Studies, 45, 1572-1597.
Tavarés, J., & Wacziarg, R. (2001). How democracy affects growth. European Economic Review, 45, 1341-
1378.
Taylor, J.B. (2008). The financial crisis and the policy responses: An empirical analysis of what went wrong.
National Bureau of Economic Research, Working Paper No. 14631.
Thomas, D.W. (2009). Deregulation despite transitional gains. The brewers guild of Cologne 1461. Public
Choice, 140, 329-340.
Tullock, G. (1975). The transitional gains trap. The Bell Journal of Economics, 6, 671-678.
Wagner, A. (1893). Grundlegung der Politischen Ökonomie. Teil I: Grundlagen der Volkswirtschaft.
Leipzig, DE: C.F. Winter’sche Verlagshandlung.
Young, A.T., & Bologna, J. (2016). Crisis and government: Some empirical evidence. Contemporary
Economic Policy, 34, 234-249.
Zakaria, F. (1997). The rise of illiberal democracy. Foreign Affairs, 76, 22-43.