investor presentation research study results 2016
TRANSCRIPT

Investor presentation research2016 results
Piotr BiernackiWarsaw, Poland, 1.12.2016

Piotr Biernacki Marcin PiechotaJustyna Biernacka
Research done by:

For the 4th time we’ve done a study of 140 largest companies listed on the Warsaw Stock ExchangeAll companies of the WIG20, mWIG40 and sWIG80 indices (of over a total of 400+ companies listed on the WSE)The most up-to-date annual results presentations were studied. In the 4th wave of the research (2016) we’ve compared results of the study to 2015. Slides lacking % o pp changes regard topics studied for the first time in 2016.The study and analysis were executed by Piotr Biernacki, JustynaBiernacka and Marcin Piechota (see last slide for further detail)
Additional information: check the last (61.) slide of this presentation

Contents of the presentation

5
The majority of companies prepare presentations
95% 78%
60%
WIG20 mWIG40 sWIG80
Are any investor presentations available on the company’s website?
70%-1pp
-3pp+1pp
+5pp

Warning: the following results relate only to companies that publish their investor presentations online
7
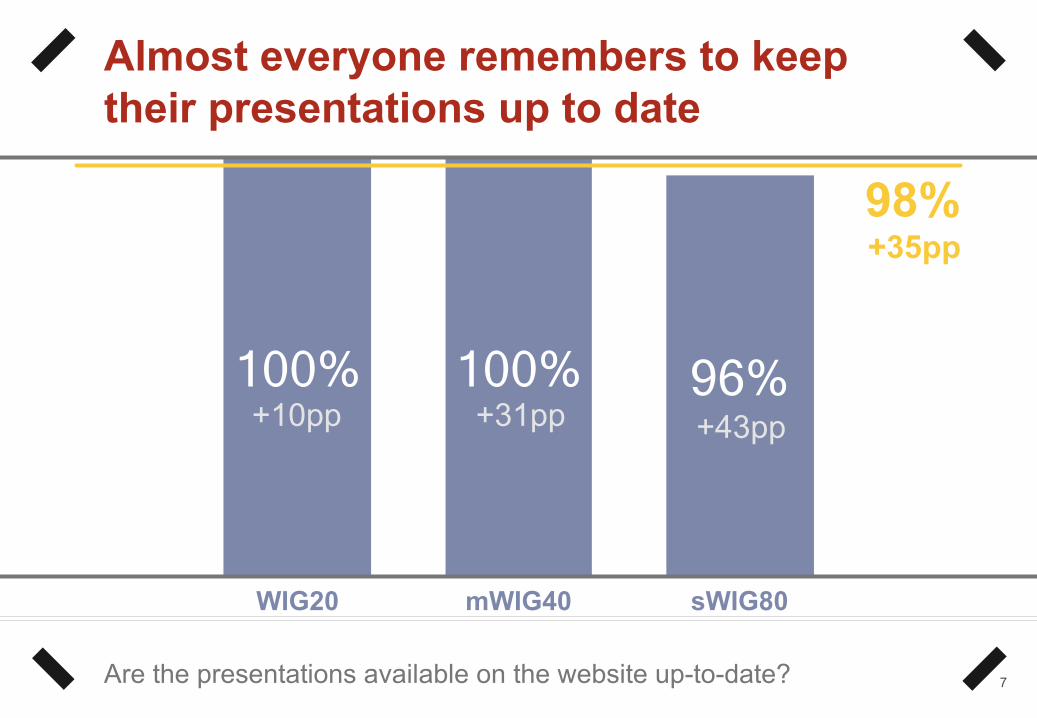
Almost everyone remembers to keep their presentations up to date
100% 100% 96%
WIG20 mWIG40 sWIG80
Are the presentations available on the website up-to-date?
98%+35pp
+43pp+31pp+10pp

8
Not everyone publishes presentations in Polish
95% 88% 94%
WIG20 mWIG40 sWIG80What percentage of companies publishes investor presentations in Polish on their websites?
92%+1pp
+2pp+1pp~

9
And smaller companies lack presentations in English
100% 91% 50%
WIG20 mWIG40 sWIG80What percentage of companies publishes investor presentations in English on their websites?
73%-14pp
-24pp
-9pp~

4,8 4,32,6
WIG20 mWIG40 sWIG80
10
In 2015 we’ve published a little less presentations that a year before
How many presentations has a company published in 2015?
3,5
-0,8
+0,2-0,3
-0,3
Highest no. of presentations published in 2015: 13
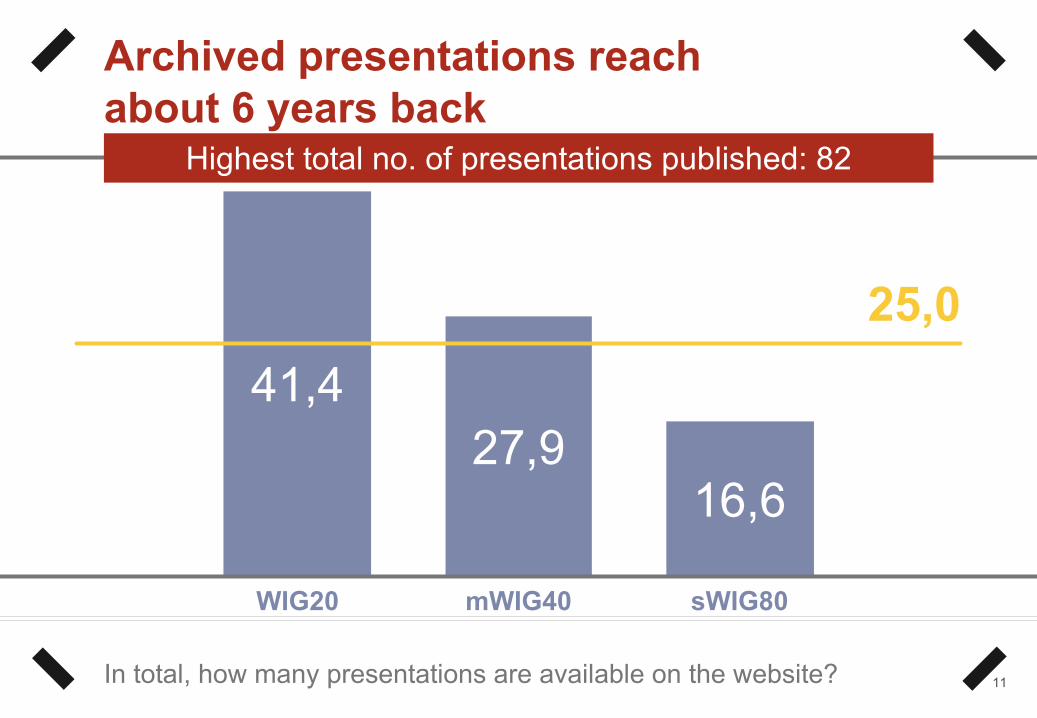
41,427,9
16,6
WIG20 mWIG40 sWIG80
11
Archived presentations reach about 6 years back
In total, how many presentations are available on the website?
25,0
Highest total no. of presentations published: 82

4,1 3,72,6
WIG20 mWIG40 sWIG80
12
We use presentations mainly at disclosure of financial results…
How many presentations published in 2015 relate to financial results?
3,3
-8,6%+7,3%+1,2%
+0,5%

1,1
0,60,2
WIG20 mWIG40 sWIG80
13
… and only very rarely and less often to communicate other issues
How many presentations published in 2015 relate to other issues?
0,5
-65,5%-21,9%
+4,7% -29,1%
Highest no. of presentations relating to other issues: 8

14
Only every 5th company prepares a general presentation, for example Equity Story
32% 28% 11% WIG20 mWIG40 sWIG80
What percentage of companies publishes a general presentation for investors (equity story, investment presentation etc.)?
21%

41,427,5 26,7
WIG20 mWIG40 sWIG80
15
The no. of slides in a presentation hasn’t changed in the last year…
How many slides counts the latest annual results presentations?
30,1
+1,3%-6,3%
-1,5%
-2,2%
Highest no. of slides in a presentation: 67
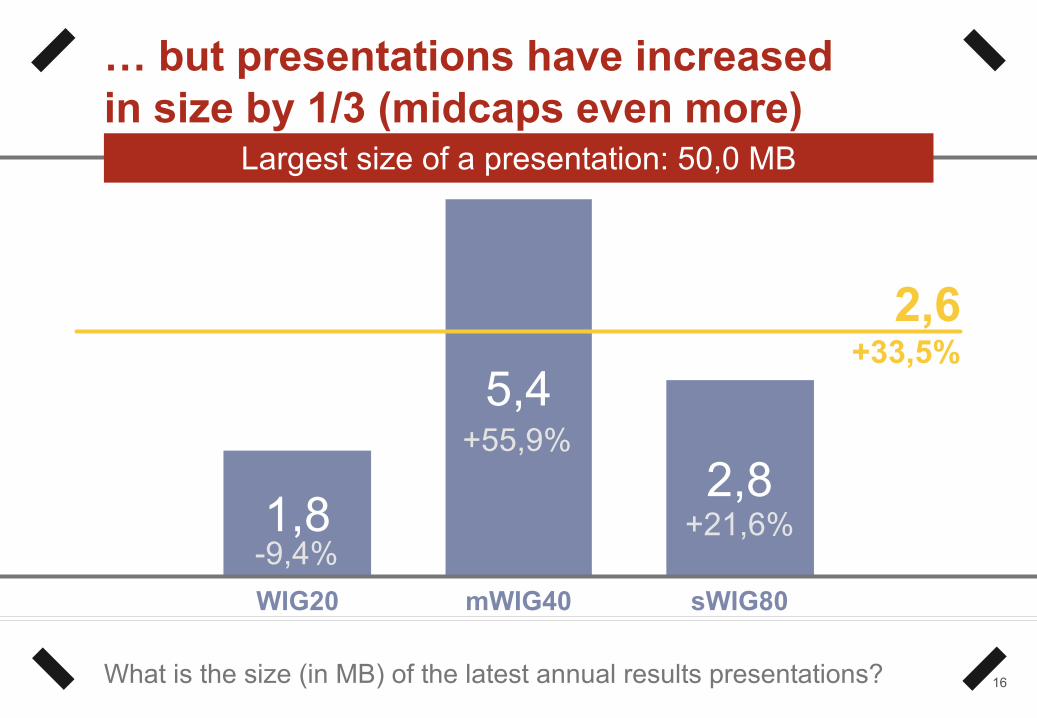
1,8
5,4
2,8
WIG20 mWIG40 sWIG80
16
… but presentations have increased in size by 1/3 (midcaps even more)
What is the size (in MB) of the latest annual results presentations?
2,6
+21,6%
+55,9%
-9,4%
+33,5%
Largest size of a presentation: 50,0 MB

17
Large- and mid-caps try more often to structure the presentations…
58% 66% 48%
WIG20 mWIG40 sWIG80Does the presentation include agenda / content’s summary / tracker slides?
56%+1pp
-22pp+23pp+14pp

18
… while small-caps slowly learn to use appendices / back-ups…
63% 50% 23%
WIG20 mWIG40 sWIG80Does the presentation include a separated appendix / back-up section?
40%-1pp
+5pp
~-15pp

11,5
5,1 6,1
WIG20 mWIG40 sWIG80
19
which are shorter by ¼ and take up less then ¼ of the presentation
How many slides does the appendix / back-up section count?
7,1
-15,0%+0,3%
-21,2%
-24,6%
Highest no. of slides in an appendix: 29
20
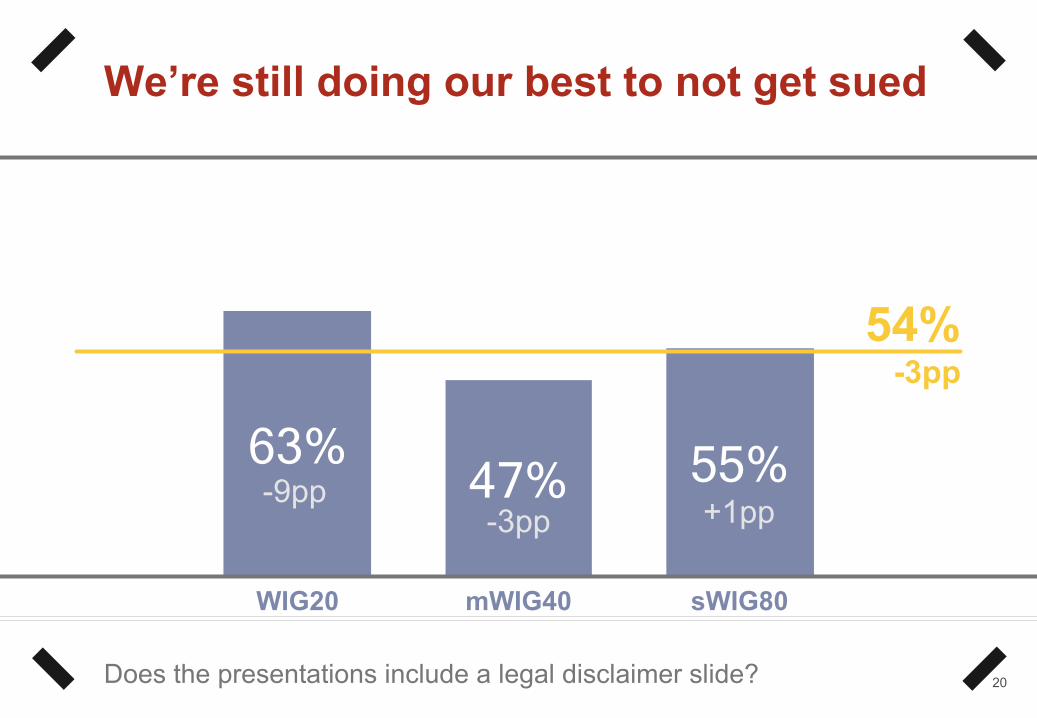
We’re still doing our best to not get sued
63% 47% 55%
WIG20 mWIG40 sWIG80
Does the presentations include a legal disclaimer slide?
54%-3pp
+1pp-3pp-9pp

21
And we still prefer not to introduce ourselves to the audience
16% 22% 9% WIG20 mWIG40 sWIG80
Are the presenters introduced or mentioned in the presentation?
15%-3pp
-4pp+8pp
-18pp

22
Large-caps more often and small-caps less often include any contact details…
84% 66%
48%
WIG20 mWIG40 sWIG80
Are there in the presentation any contact details at all?
61%+1pp
-9pp+8pp
+12pp
23
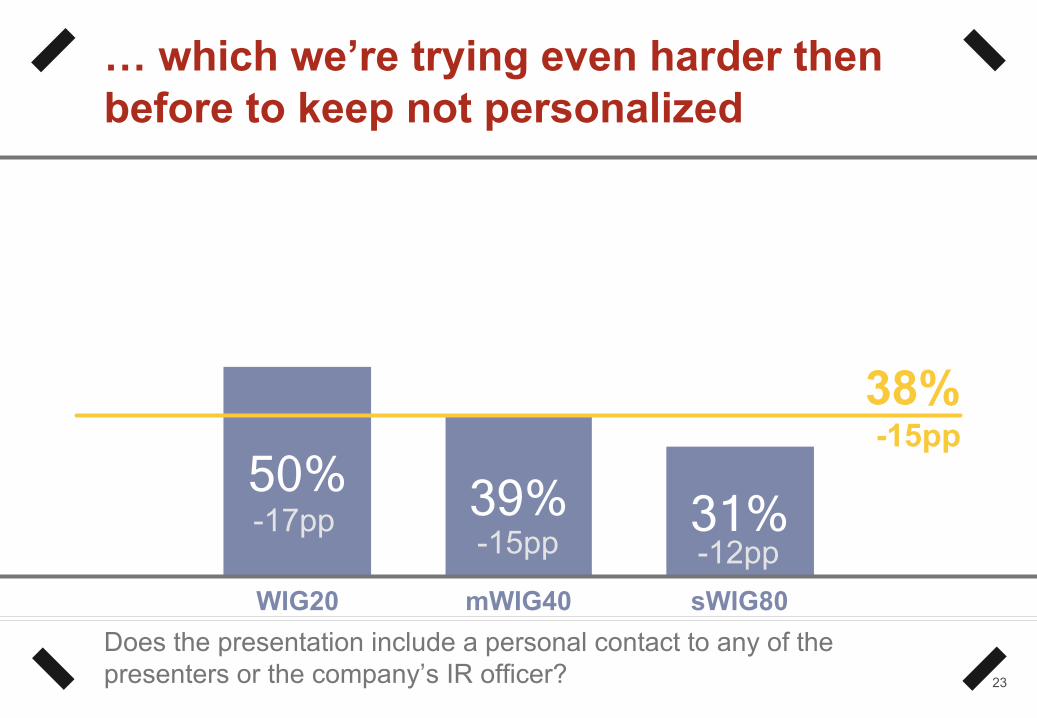
… which we’re trying even harder then before to keep not personalized
50% 39% 31% WIG20 mWIG40 sWIG80
Does the presentation include a personal contact to any of the presenters or the company’s IR officer?
38%-15pp
-12pp-15pp-17pp
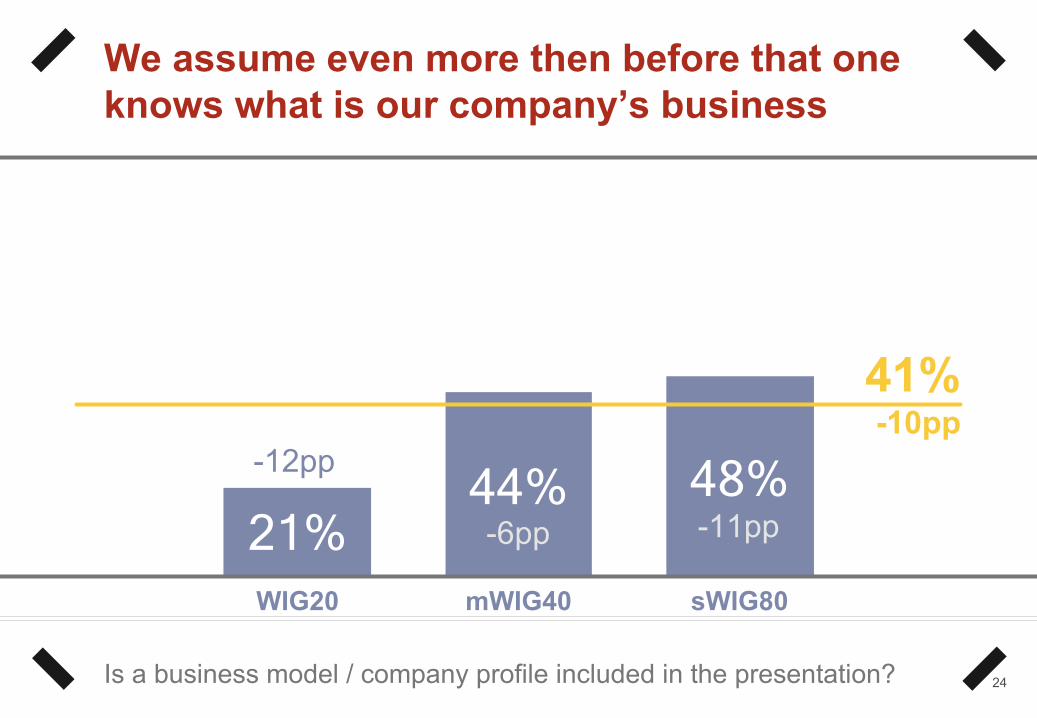
24
We assume even more then before that one knows what is our company’s business
21% 44% 48%
WIG20 mWIG40 sWIG80
Is a business model / company profile included in the presentation?
41%-10pp
-11pp-6pp
-12pp

25
Only large-caps talk about their business in a macroeconomic context
58% 16% 9%
WIG20 mWIG40 sWIG80
Does the presentation include a macroeconomic overview?
21%-12pp
-9pp-21pp
-3pp

26
All companies, especially mid-caps, cease to talk about their markets…
79%
34% 48%
WIG20 mWIG40 sWIG80Does the presentation include an overview of the market the company is operating on?
49%-27pp
-19pp-44pp
-15pp
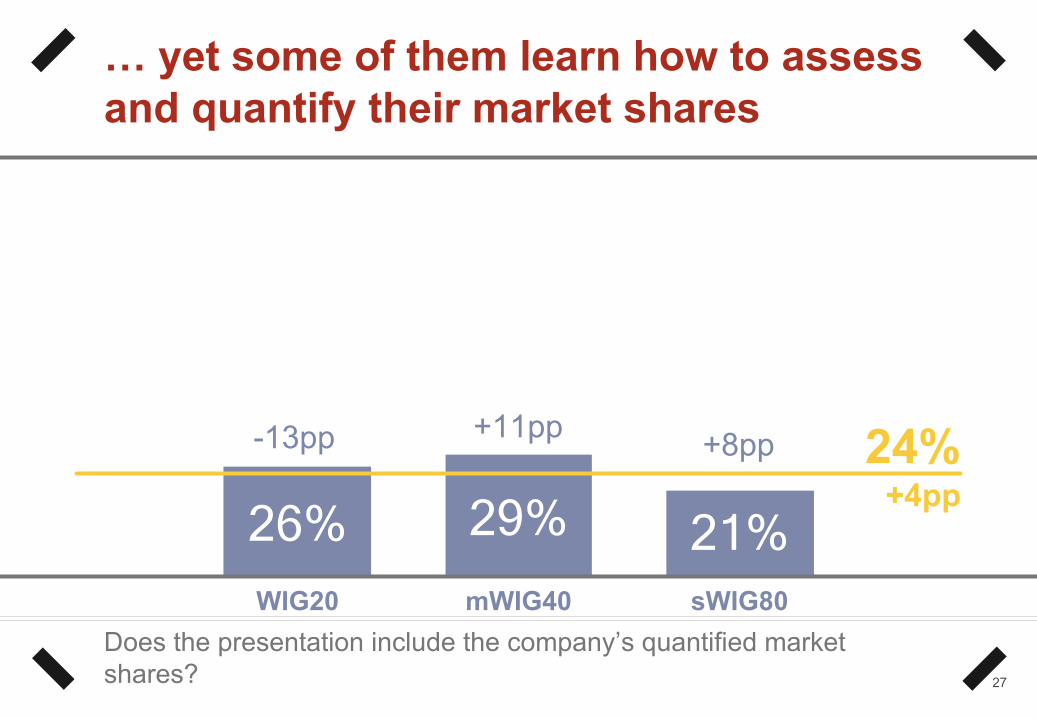
27
… yet some of them learn how to assess and quantify their market shares
26% 29% 21% WIG20 mWIG40 sWIG80
Does the presentation include the company’s quantified market shares?
24%+4pp
+8pp+11pp-13pp
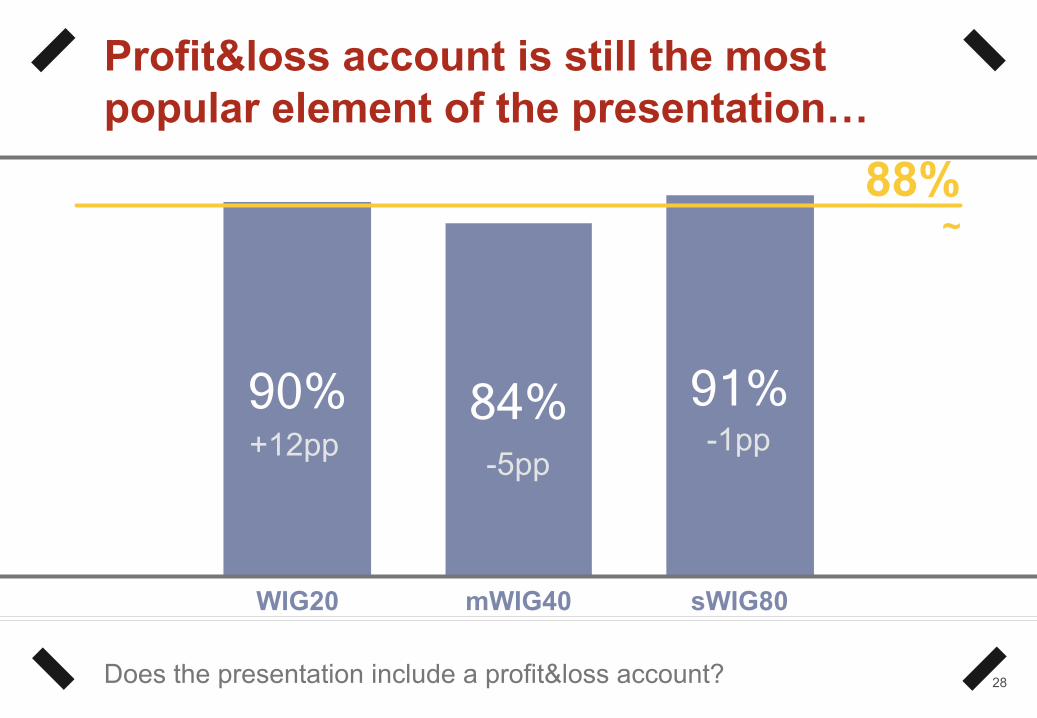
28
Profit&loss account is still the most popular element of the presentation…
90% 84% 91%
WIG20 mWIG40 sWIG80
Does the presentation include a profit&loss account?
88%~
-1pp-5pp+12pp

29
… yet the balance sheet gains on popularity, especially among small-caps…
47% 56% 68%
WIG20 mWIG40 sWIG80
Does the presentation include a balance sheet?
60%+9pp
+19pp-4pp+8pp

30
… while large- and mid-caps like to present cash flow more and more
44% 56% 39%
WIG20 mWIG40 sWIG80
Does the presentation include a cash flow statement?
45%+13pp
+3pp+21pp
+27pp

31
Larger companies assume more often that their financial results are self-explanatory…
68% 47% 59%
WIG20 mWIG40 sWIG80Does the presentation include a commentary to the company’s financial results?
57%-5pp
~-7pp
-15pp
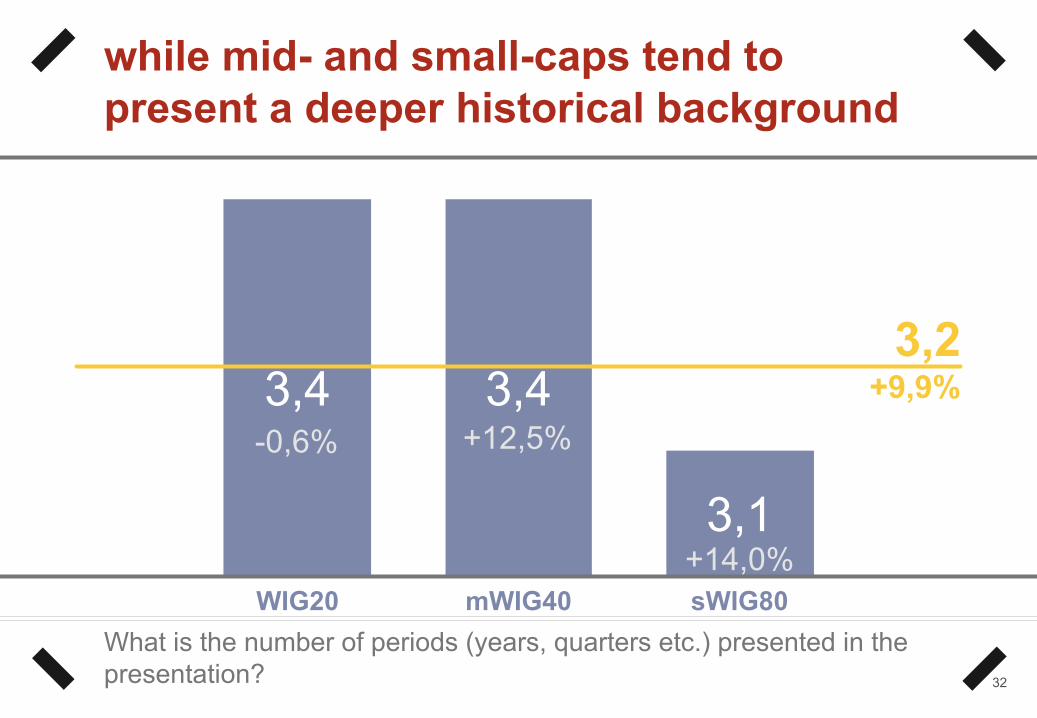
3,4 3,4
3,1WIG20 mWIG40 sWIG80
32
while mid- and small-caps tend to present a deeper historical background
What is the number of periods (years, quarters etc.) presented in the presentation?
3,2
+14,0%
+12,5%-0,6%
+9,9%

33
We like to show visions of our future as much as before…
68% 66% 59%
WIG20 mWIG40 sWIG80Does the presentation include information about the company’s strategy, operating goals or planned investments?
63%-5pp
-8pp+1pp-9pp

34
yet we still avoid being specific about future of the market we operate on
42% 9% 27%
WIG20 mWIG40 sWIG80
Does the presentation include any forecast of market trends?
24%-5pp
+4pp
-16pp-8pp

35
Some large- and small-caps started to forecast their financial results…
21% 9% 14% WIG20 mWIG40 sWIG80
Does the presentation include a financial results forecast / guidelines or any information on factors that may influence results in the future?
14%+3pp
+9pp-8pp+10pp

36
… and even twice as many companies explain risks they’re facing
47% 13% 25%
WIG20 mWIG40 sWIG80
Are risk factors covered or mentioned in the presentation?
26%+3pp
+2pp-1pp
+14pp

37
We’re still sure our audience understands perfectly the language we speak
26% 6% 5% WIG20 mWIG40 sWIG80
Does the presentation include a glossary or are difficult industry terms and unpopular indices explained in any other way?
9%+4pp
-1pp+6pp+10pp

38
… but small- and large-caps start using a more simple language
58% 53% 25%
WIG20 mWIG40 sWIG80Are there in the presentation any industry terms or other commonly unknown indices that aren’t explained (in a glossary or footnotes)?
41%-7pp
-11pp
~-9pp

39
We assume that presenting who is managing the company is useless…
5% 9% 18%
WIG20 mWIG40 sWIG80Does the presentation include a slide on the management / supervisory board and/or structure of the capital group?
13%-4pp
-5pp-5pp~

40
… as well as explaining who actually owns the company
11% 19% 23% WIG20 mWIG40 sWIG80
Does the presentation include information on shareholders’ structure?
19%~
~-6pp+11pp
41
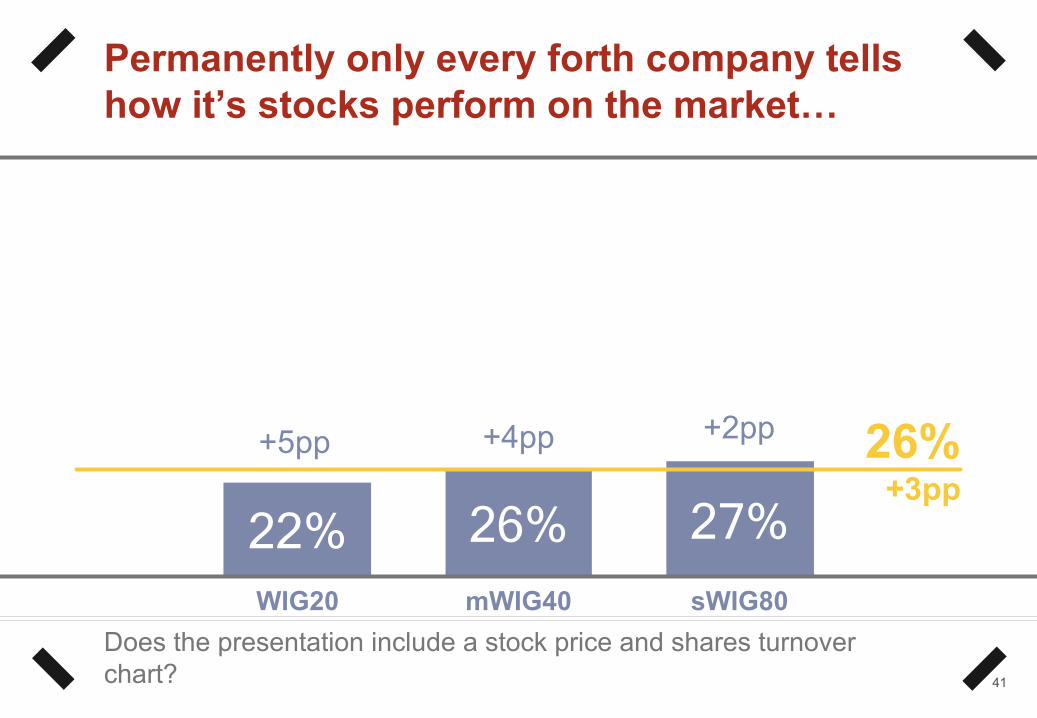
Permanently only every forth company tells how it’s stocks perform on the market…
22% 26% 27% WIG20 mWIG40 sWIG80
Does the presentation include a stock price and shares turnover chart?
26%+3pp
+2pp+4pp+5pp

42
… and we cease to help investors assess the stocks’ performance
16% 22% 16% WIG20 mWIG40 sWIG80
Does the presentation include any capital market indices or any other information helping investors to assess the company’s situation?
18%-28pp
-23pp-32pp-34pp

43
There was a slight decline in storytelling abilities in the last year
47% 34% 25% WIG20 mWIG40 sWIG80
Are any storytelling (not just descriptive) titles used in the presentation?
33%-4pp
+2pp-5pp-14pp

4,03,1 3,0
WIG20 mWIG40 sWIG80
44
In a 1-5 school grade scale we get a (subjective) three plus (C+)
General subjective evaluation of the presentation content: (in a Polish school grade scale of 1 (lowest) to 5 (highest))
3,2
+13,6%+11,6%+11,8%
+12,1%
Number of minimum (1) grades attributed: 5
Visual design of the presentation
46
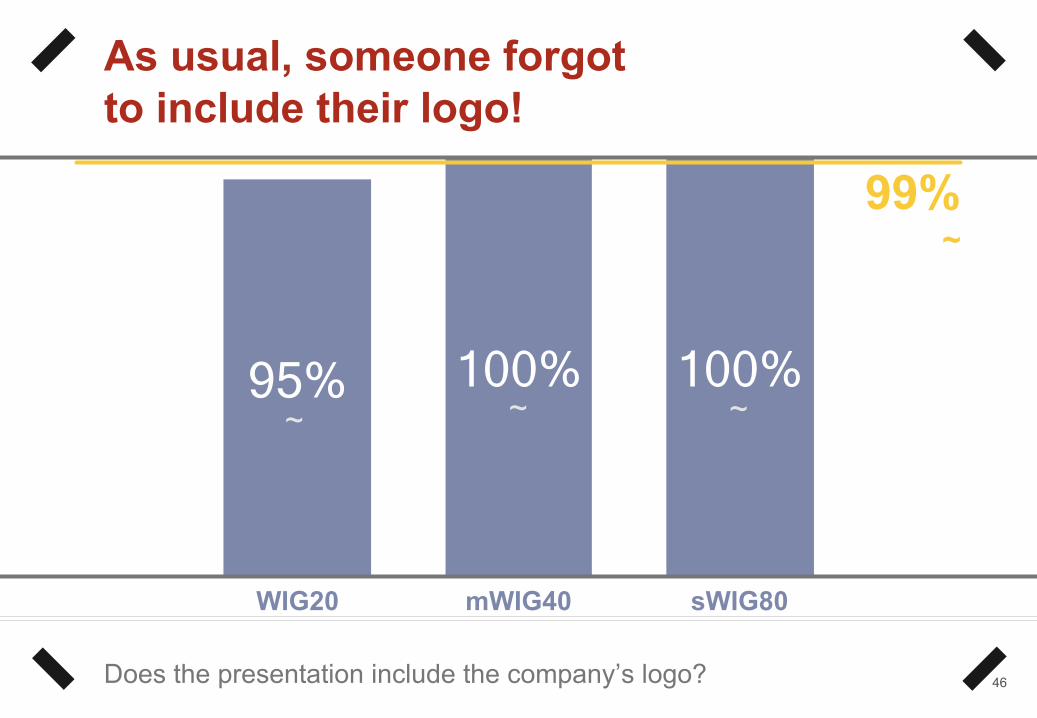
As usual, someone forgot to include their logo!
95% 100% 100%
WIG20 mWIG40 sWIG80
Does the presentation include the company’s logo?
99%~
~~~

47
Mid-caps tend to be less proud of their brands and products
32% 22% 43%
WIG20 mWIG40 sWIG80Does the presentation include any logos of child companies or the company’s product or service brands?
34%-10pp
~-28pp-2pp

48
Are we still ashamed of our employees?
11% 25% 14% WIG20 mWIG40 sWIG80
Does the presentation include any pictures of employees or representatives (other than stock photos)?
17%-2pp
-12pp+14pp
-6pp
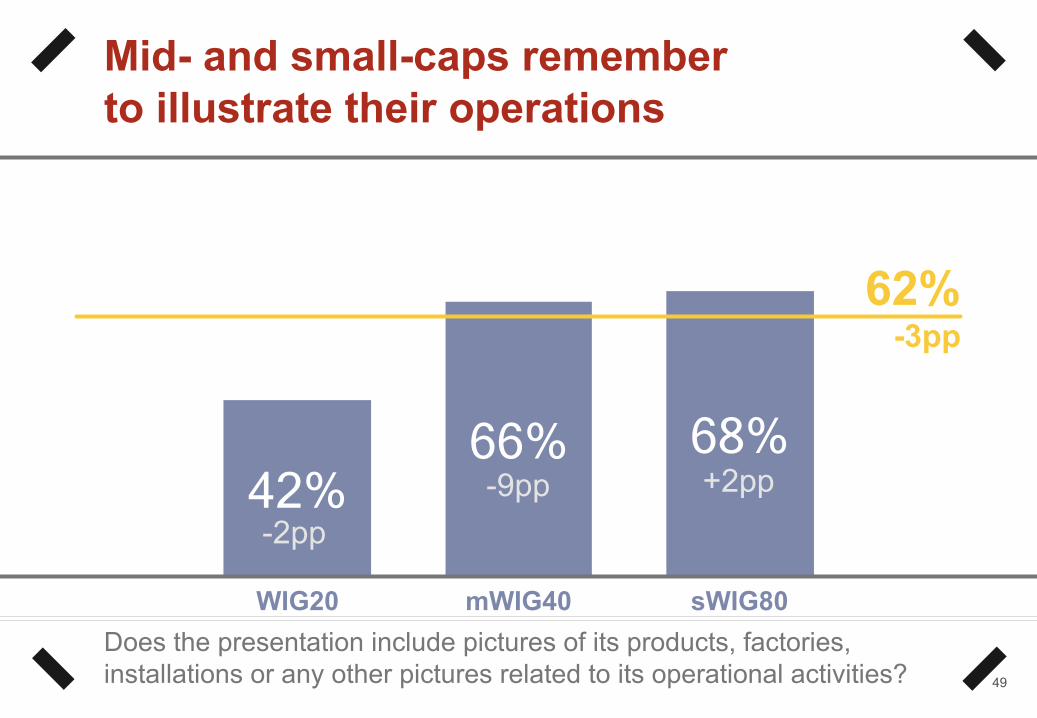
49
Mid- and small-caps remember to illustrate their operations
42% 66% 68%
WIG20 mWIG40 sWIG80Does the presentation include pictures of its products, factories, installations or any other pictures related to its operational activities?
62%-3pp
+2pp-9pp-2pp

50
Mid-caps are trying more and more to illustrate their presentations…
26% 59%
39%
WIG20 mWIG40 sWIG80Does the presentation include any other pictures (also stock photos not related to its operational activity)?
43%~
-10pp+17pp
-3pp
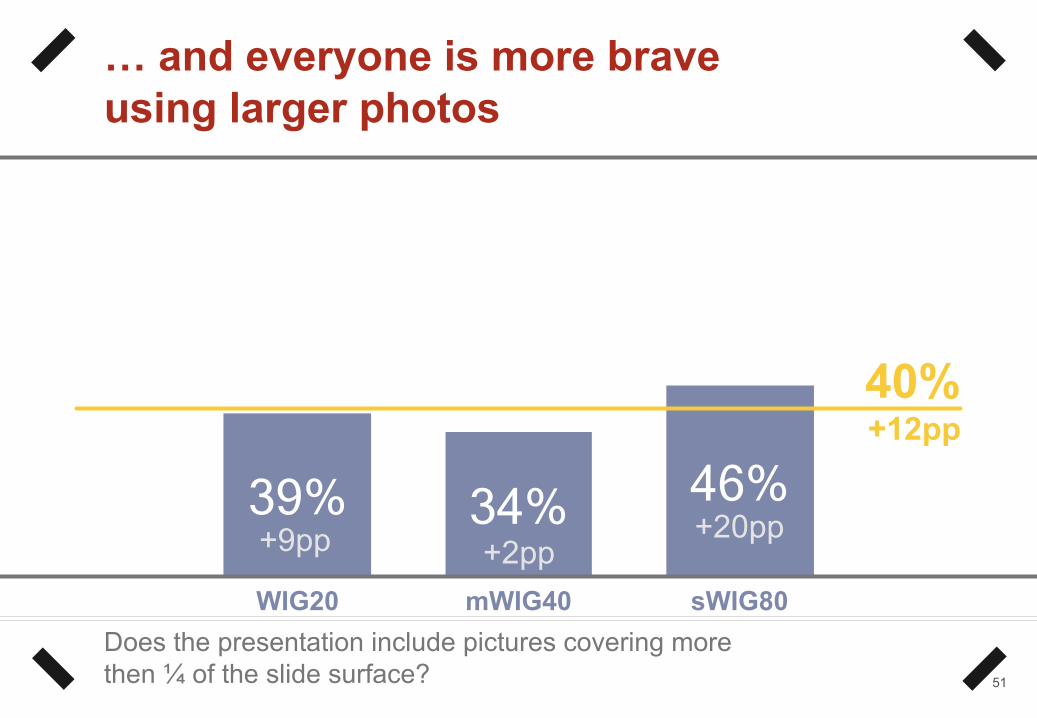
51
… and everyone is more brave using larger photos
39% 34% 46%
WIG20 mWIG40 sWIG80Does the presentation include pictures covering more then ¼ of the slide surface?
40%+12pp
+20pp+2pp+9pp

52
Almost everyone uses column and bar charts
95% 97% 96%
WIG20 mWIG40 sWIG80
Does the presentation include any column or bar charts?
96%-2pp
-4pp-3pp+6pp
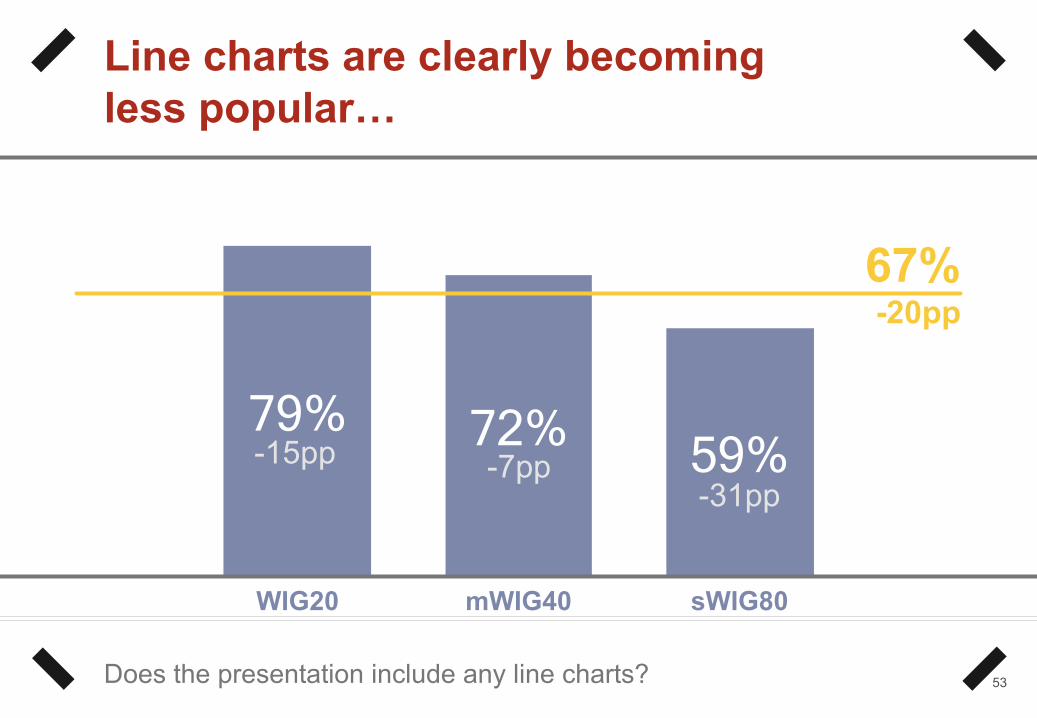
53
Line charts are clearly becoming less popular…
79% 72% 59%
WIG20 mWIG40 sWIG80
Does the presentation include any line charts?
67%-20pp
-31pp-7pp-15pp

54
… which is why pie charts got to place number two
78% 78% 66%
WIG20 mWIG40 sWIG80
Does the presentation include any pie charts?
72%+3pp
-1pp+10pp~

55
Almost every large-cap uses advanced chart types
84% 61% 46%
WIG20 mWIG40 sWIG80Does the presentation include any advanced charts (for example bridge or two-axis charts)?
59%+5pp
+4pp+1pp
+12pp

56
Half of companies use other infographic tools
58% 44% 55%
WIG20 mWIG40 sWIG80Does the presentation include any other infographic elements (for example diagrams)?
52%

3,1 3,0 3,3
WIG20 mWIG40 sWIG80
57
We slowly learn to stick to our corporate identity guidelines
General subjective evaluation of the presentation’s consistency with its CI system: (in a Polish school grade scale of 1 (lowest) to 5 (highest))
3,2
+24,8%+12,3%+8,4%
+17,0%
Number of maximum (5) grades attributed: 18

58
Our presentations aren’t interactive at all
21% 3% 5% WIG20 mWIG40 sWIG80
Does the presentation include active hyperlinks (directing to content in the internet or other slides inside the presentation)?(y/y changes incomparable due to change in methodology)
7%(-49pp)
-42pp-61pp(-46pp)
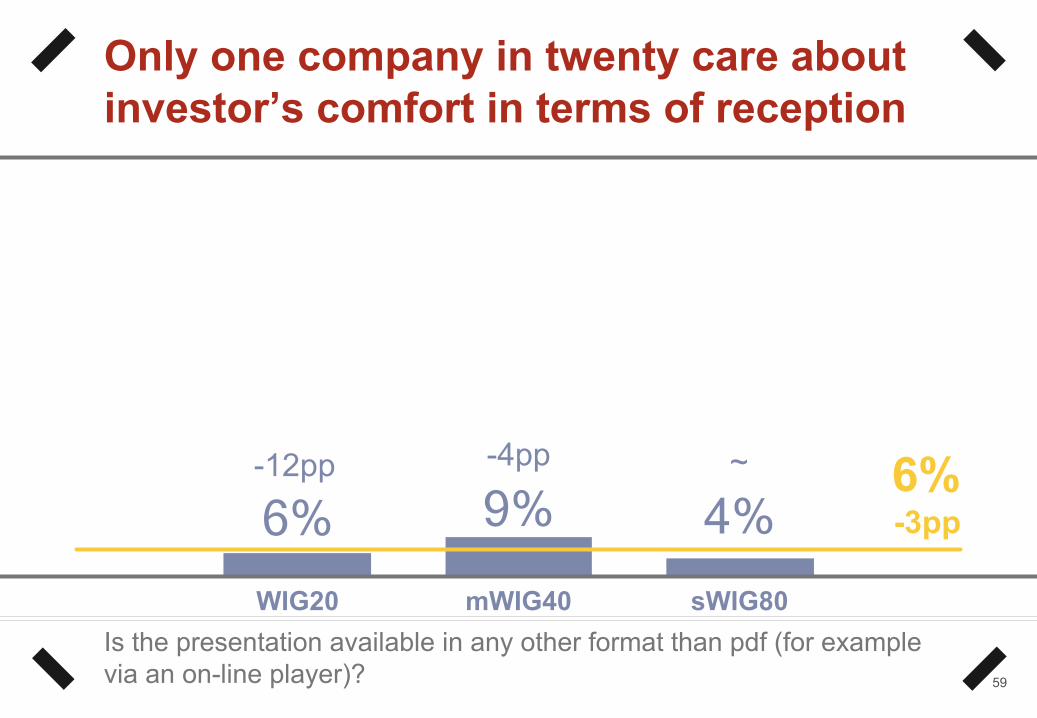
59
Only one company in twenty care about investor’s comfort in terms of reception
6% 9% 4% WIG20 mWIG40 sWIG80
Is the presentation available in any other format than pdf (for example via an on-line player)?
6%-3pp
~-4pp-12pp

3,2 3,3 2,8
WIG20 mWIG40 sWIG80
60
In a 1-5 school grade scale we get a (subjective) three (C)
General subjective evaluation of the presentation’s visual design: (in a Polish school grade scale of 1 (lowest) to 5 (highest))
3,0
+21,5%+27,7%+32,2%
+25,9%
Number of maximum (5) grades attributed: 8
www.theideacraft.com
Thank you!
© PIOTR BIERNACKI, JUSTYNA BIERNACKA, MARCIN PIECHOTA
Graphical content of several authors is used in this presentation.
No part of this presentation can be duplicated or used in any aim without the author’s consent, except for your own education.
You can use the results of the research only referring to the source.
In case of any questions regarding methodology of the research or any other issues, please feel free to contact us.
www.marcinpiechota.plwww.materiality.pl
If you are representative of a listed company and would like to learn what you could improve in your investor presentations, please contact us at [email protected] a free consultation.