investor presentation (h1 2020 results)
TRANSCRIPT

INVESTOR PRESENTATION(H1 2020 RESULTS)
September 2020
2
• GROUP OVERVIEW
• CORE ACTIVITIES
• SUSTAINABILITY
• KEY FINANCIALS H1 2020
• OUTLOOK
• APPENDIX
Agenda
DISCLAIMERThis document (the Document) was prepared by ORSERO S.p.A. (Company) only for the purposes of presenting the Company.
The information contained herein may not be complete and exhaustive and no guarantee can be given as to its accuracy.
This Document was drafted on the basis of data and information of the Company and/or in the public domain, and on parameters and assumptions determined in good faith by the Company. However, these parameters andassumptions are not the only ones that could have been selected for the purpose of preparing this Document, therefore the application of additional parameters and assumptions, or the existence of different market conditions,could lead, in good faith, to analyses and assessments that may differ, in whole or in part, from those contained herein.
The information and/or the assessments contained herein have not been subjected to verification by independent experts, and are subject to changes and/or updates. The Company undertakes no obligation to give prior orsubsequent communication in the event that any such changes and additions may become necessary or appropriate.
No information contained in this Document can or shall be considered a guarantee or an indication of future operating, financial and equity results of the Company.
To the extent permitted by applicable law, the Company and its corporate officers, managers, employees, and consultants do not make any declaration or guarantee and do not assume any obligation, either express or implied, orresponsibility as to the accuracy, sufficiency, completeness and update of any information contained in the Document nor in respect of any errors, omissions, inaccuracies or negligence herein.
This Document is provided merely for information and indicative purposes and does not constitute in any way a proposal to enter into any contract nor a public offering of financial products, nor advice or a recommendation to buyor sell any financial products.
You are the exclusive addressee of this Document which as such cannot be delivered nor disclosed to any third parties nor reproduced, in whole or in part, without the prior authorization of the Company.
Pag. 3
Pag. 7
Pag. 15
Pag. 19
Pag. 26
Pag. 30

GROUP OVERVIEW
4
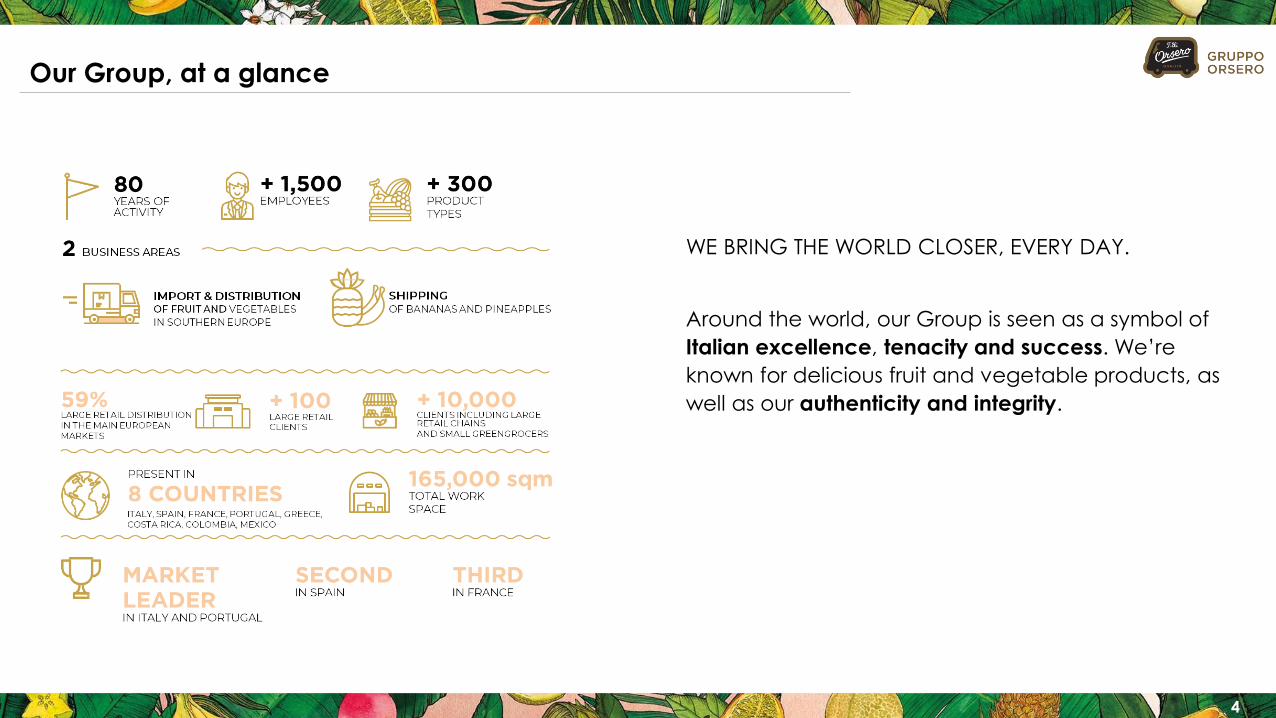
Our Group, at a glance
WE BRING THE WORLD CLOSER, EVERY DAY.
Around the world, our Group is seen as a symbol of
Italian excellence, tenacity and success. We’re
known for delicious fruit and vegetable products, as
well as our authenticity and integrity.
5
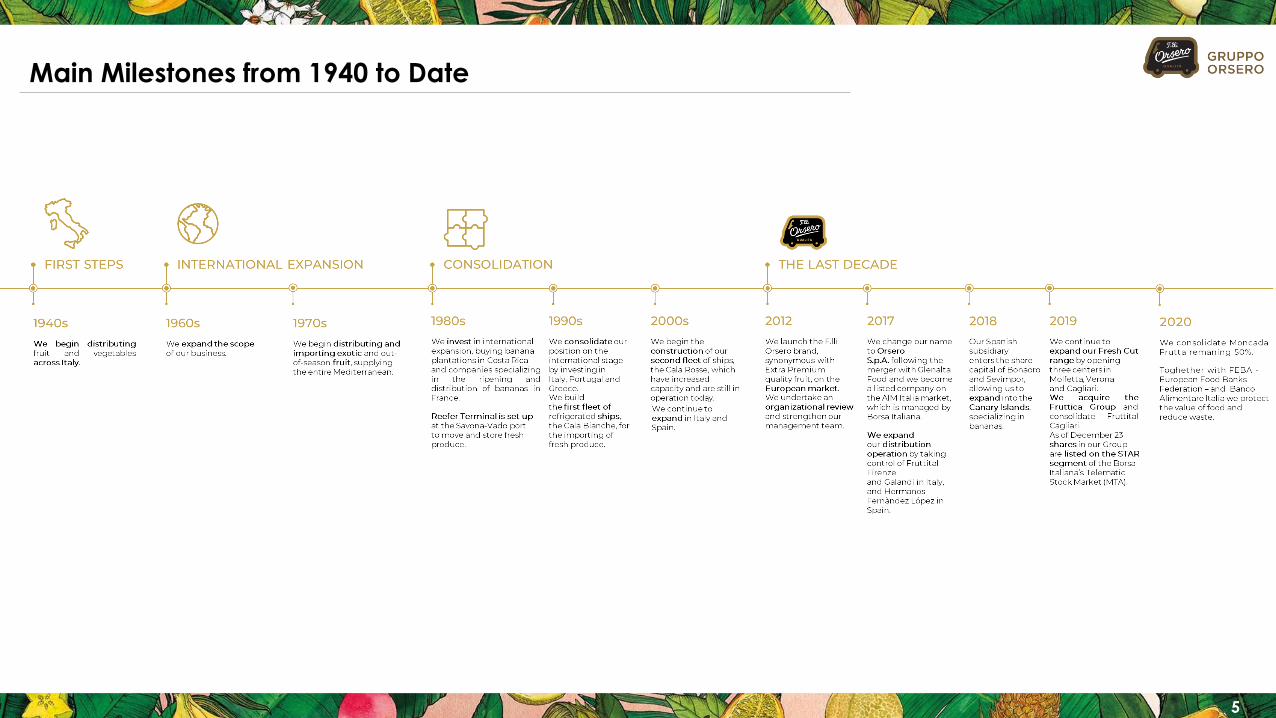
Main Milestones from 1940 to Date
6
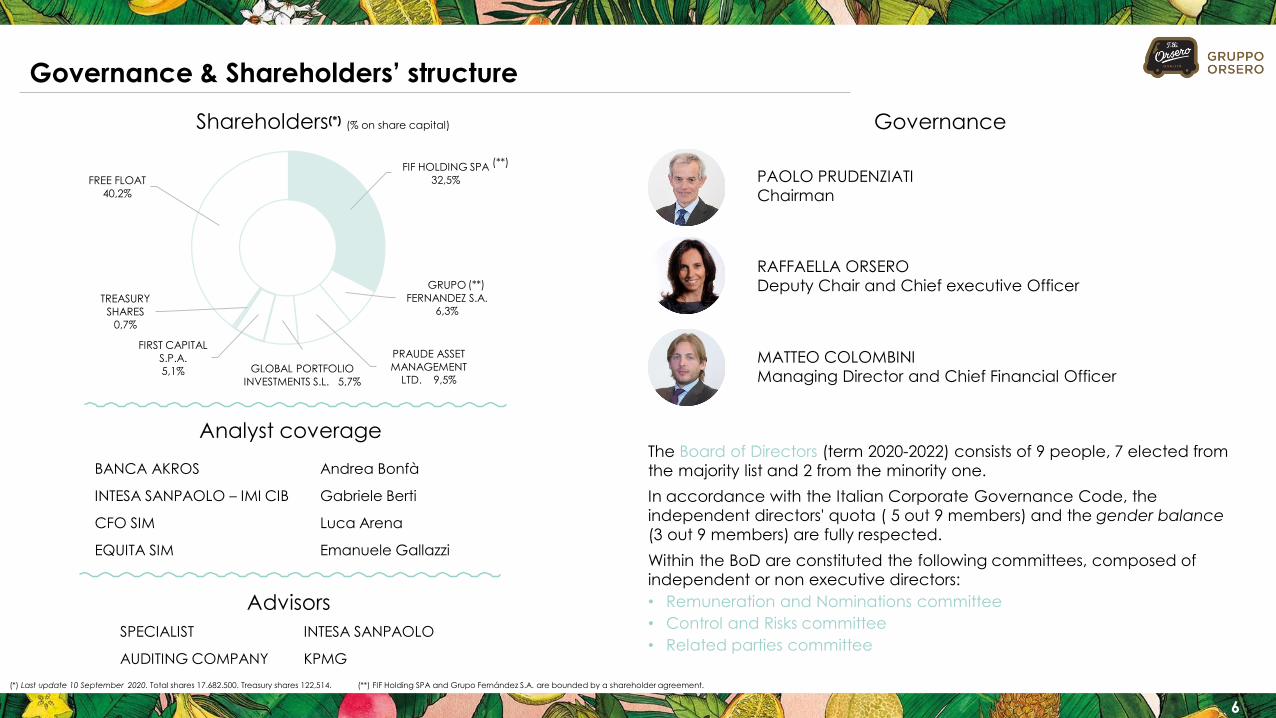
Governance & Shareholders’ structure
The Board of Directors (term 2020-2022) consists of 9 people, 7 elected from
the majority list and 2 from the minority one.
In accordance with the Italian Corporate Governance Code, the
independent directors' quota ( 5 out 9 members) and the gender balance
(3 out 9 members) are fully respected.
Within the BoD are constituted the following committees, composed of
independent or non executive directors:
• Remuneration and Nominations committee
• Control and Risks committee
• Related parties committee
PAOLO PRUDENZIATI
Chairman
RAFFAELLA ORSERO
Deputy Chair and Chief executive Officer
MATTEO COLOMBINI
Managing Director and Chief Financial Officer
Shareholders(*) (% on share capital) Governance
(*) Last update 10 September 2020. Total shares 17.682.500. Treasury shares 122,514. (**) FIF Holding SPA and Grupo Fernández S.A. are bounded by a shareholder agreement.
(**)FIF HOLDING SPA
32,5%
GRUPO
FERNANDEZ S.A.
6,3%
PRAUDE ASSET
MANAGEMENT
LTD. 9,5%GLOBAL PORTFOLIO
INVESTMENTS S.L. 5,7%
FIRST CAPITAL
S.P.A.
5,1%
TREASURY
SHARES
0,7%
FREE FLOAT
40,2%
(**)
BANCA AKROS Andrea Bonfà
INTESA SANPAOLO – IMI CIB Gabriele Berti
CFO SIM Luca Arena
EQUITA SIM Emanuele Gallazzi
SPECIALIST INTESA SANPAOLO
AUDITING COMPANY KPMG
Analyst coverage
Advisors

CORE ACTIVITIES
8
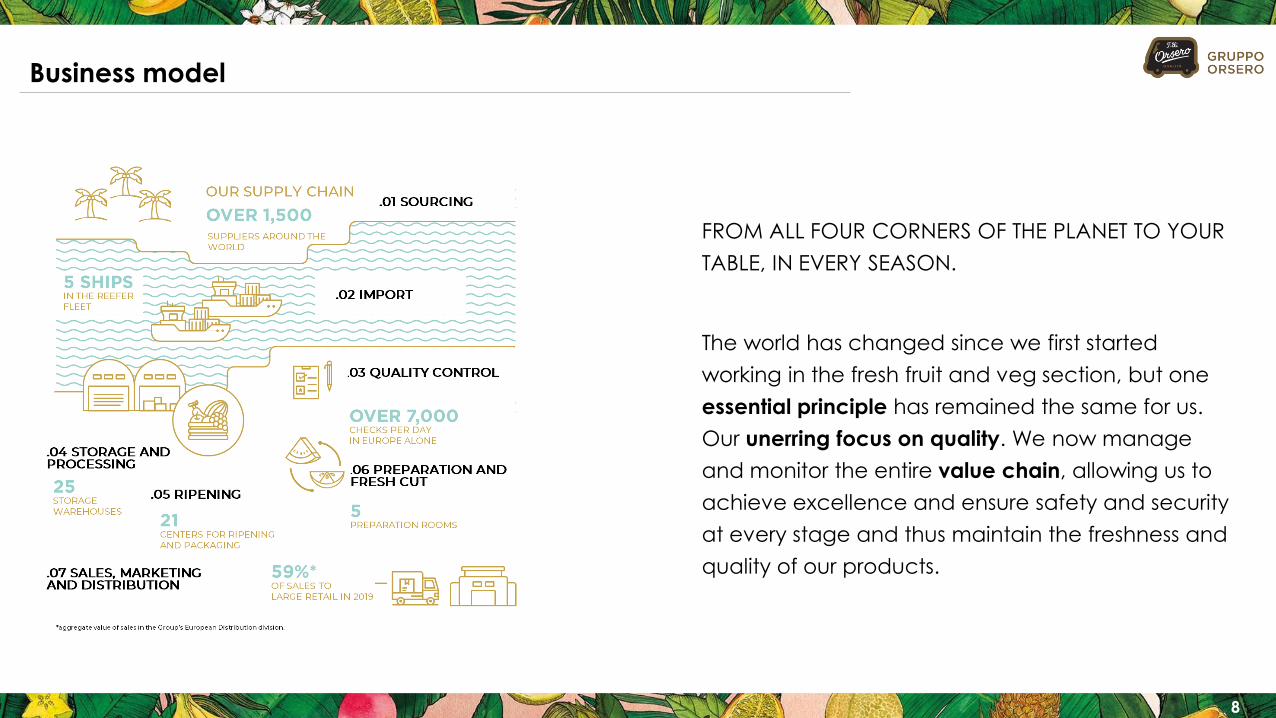
Business model
FROM ALL FOUR CORNERS OF THE PLANET TO YOUR
TABLE, IN EVERY SEASON.
The world has changed since we first started
working in the fresh fruit and veg section, but one
essential principle has remained the same for us.
Our unerring focus on quality. We now manage
and monitor the entire value chain, allowing us to
achieve excellence and ensure safety and security
at every stage and thus maintain the freshness and
quality of our products.
9
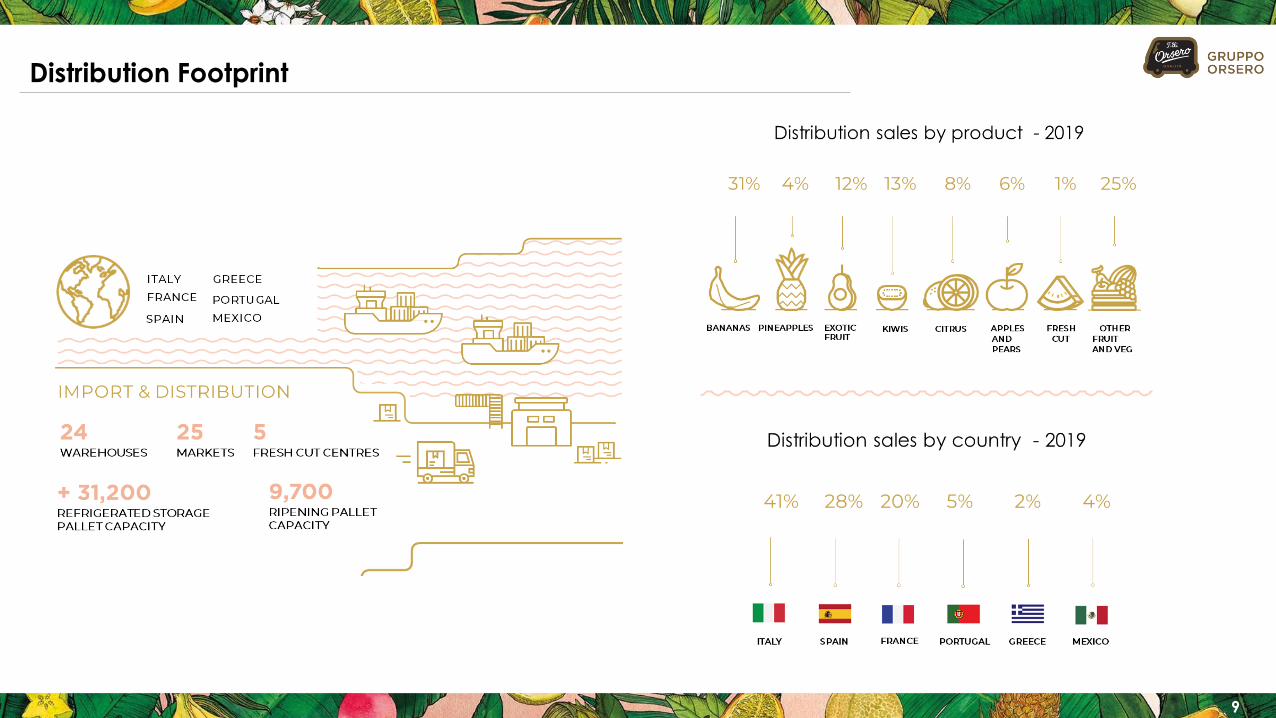
Distribution Footprint
10
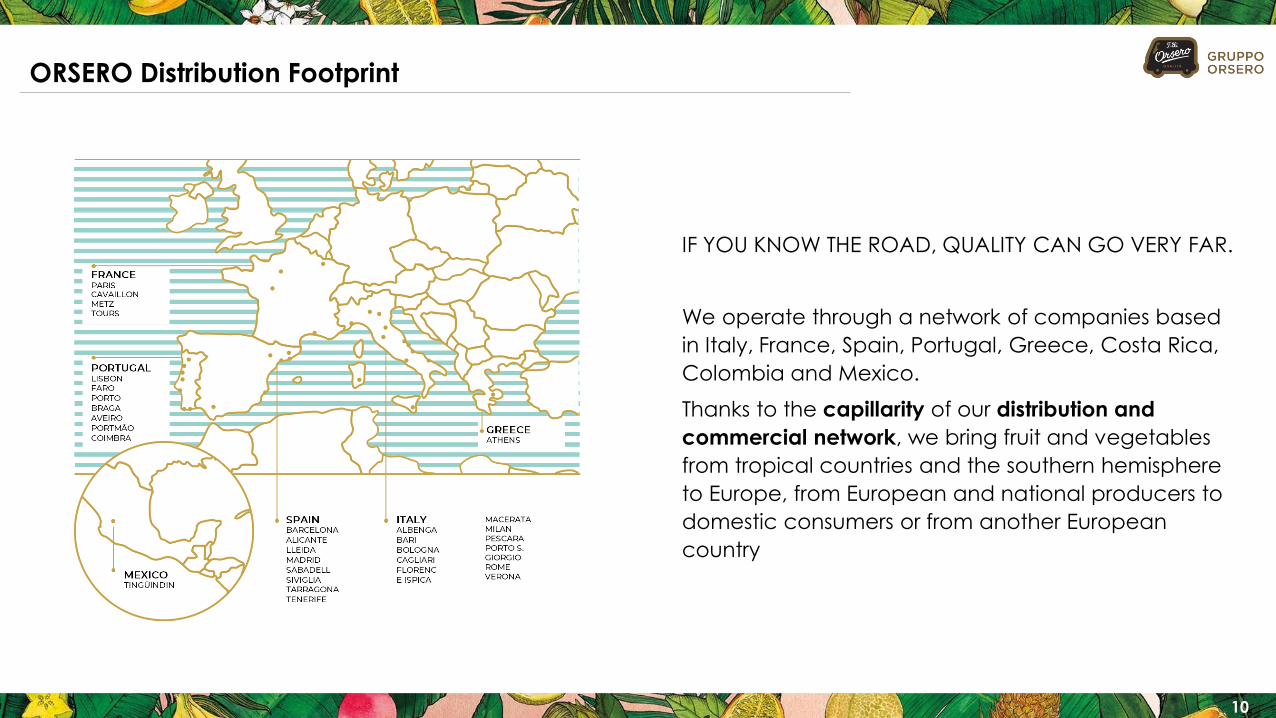
IF YOU KNOW THE ROAD, QUALITY CAN GO VERY FAR.
We operate through a network of companies based
in Italy, France, Spain, Portugal, Greece, Costa Rica,
Colombia and Mexico.
Thanks to the capillarity of our distribution and
commercial network, we bring fruit and vegetables
from tropical countries and the southern hemisphere
to Europe, from European and national producers to
domestic consumers or from another European
country
ORSERO Distribution Footprint

11
Distribution : serving all market channels
FROM OUR WAREHOUSES TO YOUR SHOPPING BAG,
ALL OVER MEDITERRANEAN EUROPE.
Once stringent quality controls have been
completed, our fruit and veg is ready to be
distributed to the biggest wholesalers and
supermarket chains.
OVER 10,000 clients in large retail and traditional
channels.
(*) Internal reporting statistics. Mix calculated on Aggregated Gross Sales.
57% 44%
82% 70%53%
43%56%
18% 30%47%
Italy Spain France Portugal Greece
SUPERMARKETS WHOLESALER/OTHERS
Distribution Channel Sales Mix 2019(*)
OF SALES TOLARGE RETAIL IN 2019
The main European Retailers that sell our
products in their stores

12
Distribution : fresh-cut project
FRUIT IS CHANGING, WE GAVE IT A NEW CUT.
Market background:
• Key drivers in food consumption are bio, ready-to-eat
and healthy products.
• Among the most promising trends in the market of
fresh fruit and vegetables, consumption outside home
and the demand for products with “service” content stand out
Orsero Group milestones:
• Orsero Group launched its fruit frech-cut product in
2014, strengthening its processing operations in 2019
• FY 2019 Group’s sales of Fresh-Cut products were over
9 M€, or 1% of Distribution’s sales.
13
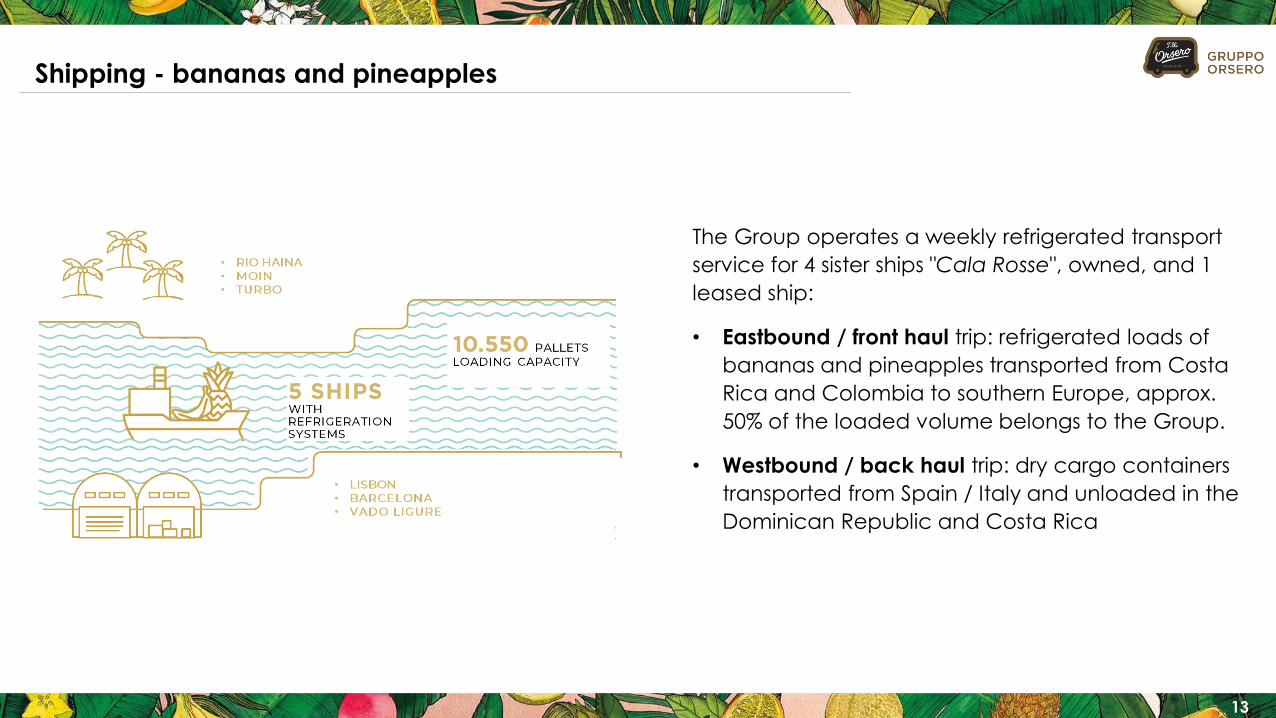
The Group operates a weekly refrigerated transport
service for 4 sister ships "Cala Rosse", owned, and 1
leased ship:
• Eastbound / front haul trip: refrigerated loads of
bananas and pineapples transported from Costa
Rica and Colombia to southern Europe, approx.
50% of the loaded volume belongs to the Group.
• Westbound / back haul trip: dry cargo containers
transported from Spain / Italy and unloaded in the
Dominican Republic and Costa Rica
Shipping - bananas and pineapples

14
Competitive landscape
During last years, some of major players have been involved in M&A/consolidation phase:
- 2015: Chiquita Brands International (US) was bought and delisted jointly by Cutrale Group and Safra Group (BR)
- 2017: Fyffes (IR) was bought-out and delisted by Sumitomo Group (JP)
- 2018: Total Produce (IR) acquired a 45% stake of Dole Food (US), with an option to buy 6% more.
Note: List to be intended for illustrative purpose and not exhaustive.
SUSTAINABILITY
16
Sustainability
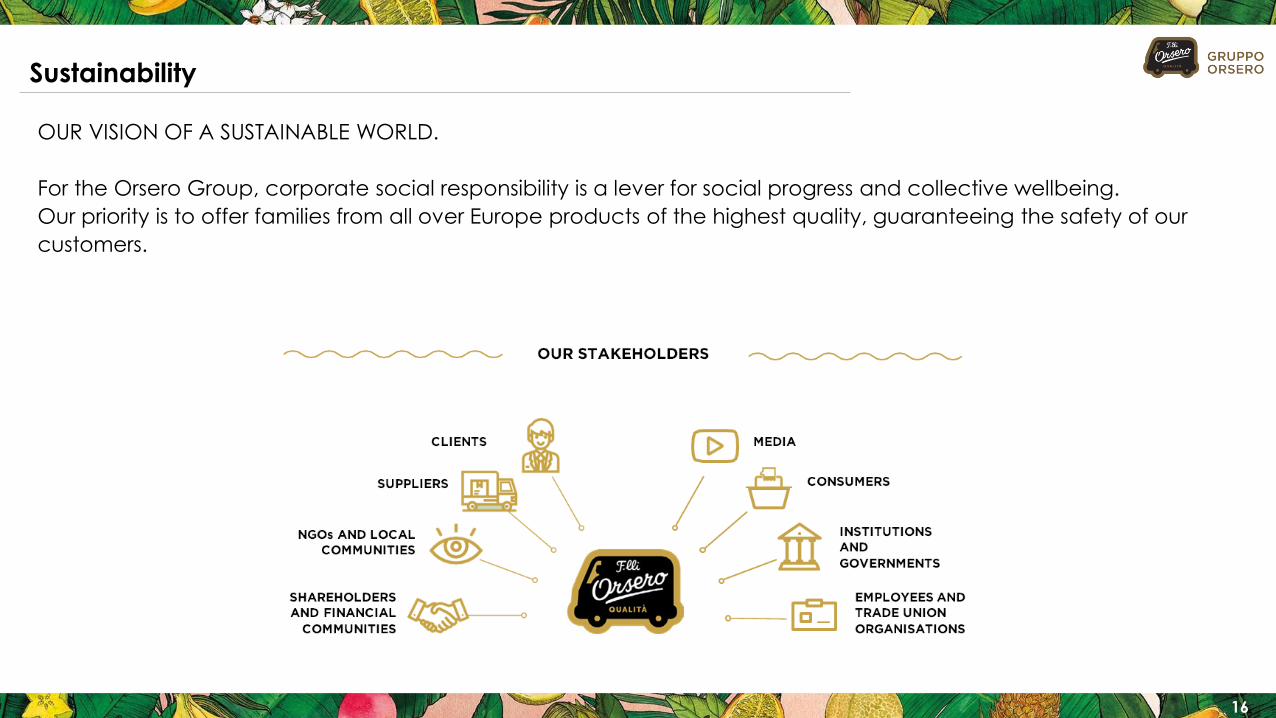
OUR VISION OF A SUSTAINABLE WORLD.
For the Orsero Group, corporate social responsibility is a lever for social progress and collective wellbeing.
Our priority is to offer families from all over Europe products of the highest quality, guaranteeing the safety of our
customers.

17
SUSTAINABILITY
PRODUCT SAFETY, TRACEABILITY AND QUALITY
We strive to bring you fruit of the highest quality, undertaking checks at every stage and ensuring freshness, flavor and safety. The majority of the Group’s suppliers certify the quality of their products and agricultural practices through the globally recognized Global GAP and Rainforest Alliance certifications, which demonstrate compliance with sustainability and responsibility principles.
SUSTAINABLE MANAGEMENT OF THE SUPPLY CHAIN
We select the best cultivation areas and local producers. Through constant dialog with our suppliers, we are able to ensure quality and maintain control over the entire supply chain.
ENERGY, EMISSIONS AND WASTE MANAGEMENT
We monitor the environmental impact of our products in order to improve and boost efficiency, and we strive to reduce energy usage and waste.
SUSTAINABLE PACKAGING
We are constantly committed to improving the sustainability of our packaging, to protect not only our fruit but also the environment.
ORGANIC ORSERO
We also sell organic products, allowing us to offer maximum flavor and quality while ensuring respect for the natural world.
18
SUSTAINABILITY
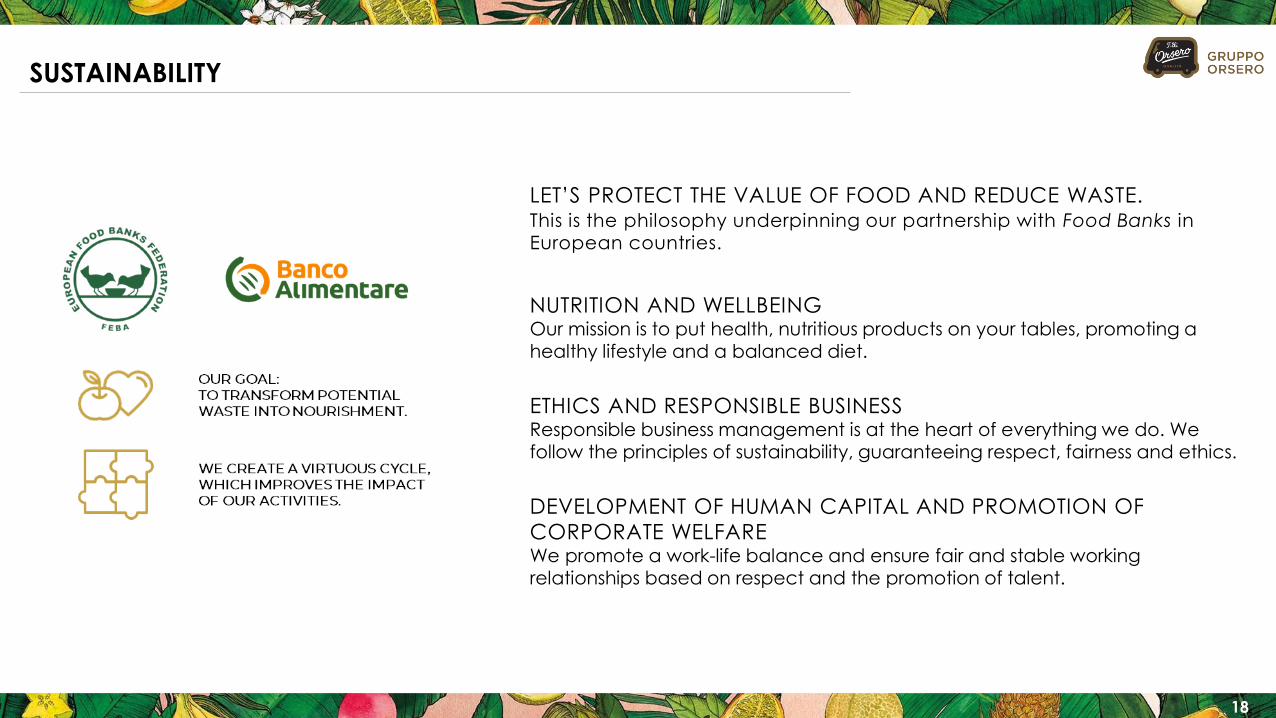
LET’S PROTECT THE VALUE OF FOOD AND REDUCE WASTE.This is the philosophy underpinning our partnership with Food Banks in European countries.
NUTRITION AND WELLBEINGOur mission is to put health, nutritious products on your tables, promoting a
healthy lifestyle and a balanced diet.
ETHICS AND RESPONSIBLE BUSINESSResponsible business management is at the heart of everything we do. We follow the principles of sustainability, guaranteeing respect, fairness and ethics.
DEVELOPMENT OF HUMAN CAPITAL AND PROMOTION OF
CORPORATE WELFAREWe promote a work-life balance and ensure fair and stable working relationships based on respect and the promotion of talent.
KEY FINANCIALSH1 2020*
(*) Semester ending 30 June 2020.
20
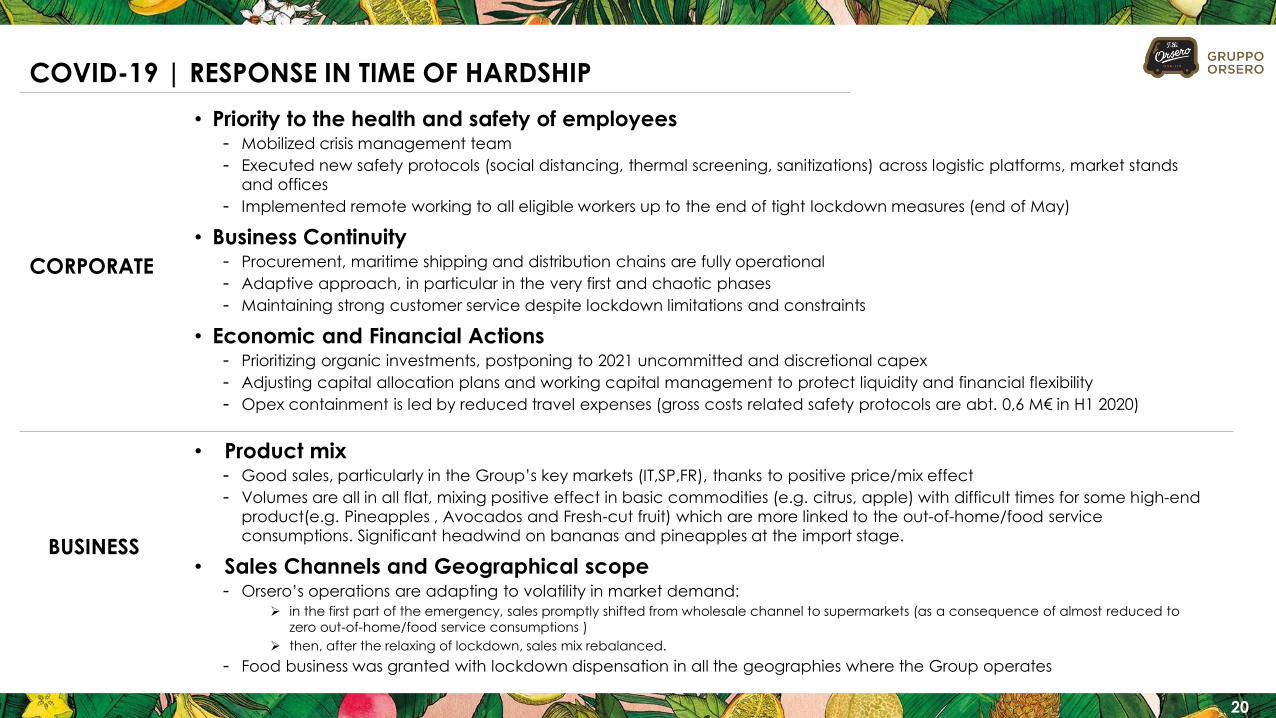
COVID-19 | RESPONSE IN TIME OF HARDSHIP
• Priority to the health and safety of employees- Mobilized crisis management team
- Executed new safety protocols (social distancing, thermal screening, sanitizations) across logistic platforms, market stands
and offices
- Implemented remote working to all eligible workers up to the end of tight lockdown measures (end of May)
• Business Continuity- Procurement, maritime shipping and distribution chains are fully operational
- Adaptive approach, in particular in the very first and chaotic phases
- Maintaining strong customer service despite lockdown limitations and constraints
• Economic and Financial Actions- Prioritizing organic investments, postponing to 2021 uncommitted and discretional capex
- Adjusting capital allocation plans and working capital management to protect liquidity and financial flexibility
- Opex containment is led by reduced travel expenses (gross costs related safety protocols are abt. 0,6 M€ in H1 2020)
CORPORATE
BUSINESS
• Product mix- Good sales, particularly in the Group’s key markets (IT,SP,FR), thanks to positive price/mix effect
- Volumes are all in all flat, mixing positive effect in basic commodities (e.g. citrus, apple) with difficult times for some high-end
product(e.g. Pineapples , Avocados and Fresh-cut fruit) which are more linked to the out-of-home/food service
consumptions. Significant headwind on bananas and pineapples at the import stage.
• Sales Channels and Geographical scope- Orsero’s operations are adapting to volatility in market demand:
➢ in the first part of the emergency, sales promptly shifted from wholesale channel to supermarkets (as a consequence of almost reduced to
zero out-of-home/food service consumptions )
➢ then, after the relaxing of lockdown, sales mix rebalanced.
- Food business was granted with lockdown dispensation in all the geographies where the Group operates
21
NEW BUSINESS SEGMENTS 2020
EFFECTIVE FROM 1/1/2020
• Ex Distribution: also the companies active in the import of bananas and pineapples (Simba)
join the BU, the sector is then renamed “Import & Distribution”
• Ex Import & Shipping: as a consequence of the above described reallocation, the BU is
renamed "Shipping", being now concentrated exclusively on ship owning, serving the Group
and third parties (approx. 50% -50%)
• Services: unchanged, except for the divestiture from a small company in the container
maintenance business (VCS).
This reorganization reflects the increasing interconnection between the banana and pineapple
import business and the distribution business: 85% of the revenues relating to this business are
developed through the Group's distribution network.
The new business segmentation will bring a simplification in the understanding of the BU data,
reducing the amount of intra-segment revenues originated in the past from Simba and, thus, the
elimination among Group’s different BU’s.
REMINDER

22
M€ H1 2020 H1 2019 Total Change
Amount %
Net Sales 520,8 492,9 27,9 5,7%
Adjusted EBITDA 23,5 19,3 4,2 22,0%
Adjusted EBITDA Margin 4,5% 3,9% +61 Bps.
Adjusted EBIT 10,9 7,7 3,2 42,3%
Adjusted Net Profit 7,5 4,0 3,5 86,6%
Non-recurring items (net of tax) ( 1,3) ( 2,9)ns ns
Net Profit 6,2 1,1 5,1 459,4%
Adjusted EBITDA excl. IFRS 16(*) 19,4 14,8 4,6 31,3%
M€ H1 2020 FY 2019 Total Change
Amount
Net Invested Capital 273,8 277,8
Total Equity 154,7 150,9
Net Financial Position 119,1 126,9
NFP/Adj.EBITDA Ratio 2,8 3,3
Net Financial Position excl. IFRS 16(*) 88,2 66,9
NFP/Adj.EBITDA Ratio excl. IFRS16 2,6 2,3
Executive summary
• Consolidated Net sales H1 2020 grow to approx. 521 M€,
+27,9 M€ or +5,7% vs H1 2019 (+4,1% at constant
perimeter)
• Adjusted EBITDA is up by 22% or +4,2 M€ , from 19,3 M€
to 23,5 M€ (excl. IFRS 16 is 19,4 M€, up by 4,6 M€/+31,3%)
• Adjusted EBITDA margin stands at 4,5%, (+61 bps. vs
previous year)
• Adjusted EBIT grows to abt. 10,9 M€, due to better
operating performances
• Adjusted Net profit stands at 7,5 M€ vs 4 M€ of LY
• Total Equity is equal to ~155 M€
• Net Financial Position Excl. IFRS 16(*) stands at 88,2 M€
(Net Debt) or 119,1 M€ including IFRS 16 liabilities
• All covenants on Structured Debts are fully respected.
(*) Data excluding the effect of IFRS 16 adoption, consisting chiefly in the recognition of incremental Adjusted Ebitda of 4,5 M€ in H1 2019 and 4,1 M€ in H1 2020 and incremental NFP of 30,8 M€ in H1 2020 and 60 M€ in FY 2019

23
Import &Distribution
Import & Shipping
Service/holding
Eliminations
2,72,5 -0,6
4,1
11,414,1
16,3
6,0
8,5
10,2
-2,6 -3,1 -3,0
25,17,6 -0,68 -4,2
462,8 488,0
45,152,7
6,3 5,6
-21,4 -25,6
Adjusted EBITDA H1 2020 stands at 23,5 M€, 4,5% on sales
- IFRS 16 net effect on Adj. Ebitda is 4,1 M€
Adjusted EBITDA H1 2020 Excl. IFRS 16 (**) is 19,4 M€, up by 4,6 M€ , with 3,7% on
sales vs 3% LY:
- Import & Distribution improves by 2,7 M€:
‣ Very good performance of distribution operations in Italy and partial recovery in
France but, contrariwise, banana/pineapples at import stage and Mexican
avocados achieved lower margin
- Shipping grows by 2,5 M€ :
‣ better freight rate and good load factor (~95%)
‣ Efficency due to the sailing schedule implemented in 2019 (5 vessels instead of 4,
35 days for the round trip instead of 28 days)
- Service/Holding is down 0,6 M€ due to lower intercompany rebilling
Net Sales and Adj. Ebitda H1 2020
ADJUSTED EBITDA EXCL IFRS 16 VARIANCE (M€)
14,8 23,5
Import & Distribution
Shipping Service/Holding
Adj. EBITDAH1 2020
Adj. EBITDAExcl. IFRS 16
H1 2019
NET SALES VARIANCE (M€)
Net sales H1 2020 are 520,8 M€, up by abt. 27,9 M€ or + 5,7%
including M&A(*)/+4,1% like for like
- Import & Distribution is up abt. 5,4%, including M&A(*) /+3,7% like-for like
‣ Good sales momentum in all key markets
‣ Declining sales in Mexican avocado and Banana/Pineapples
Import
- Shipping improves by 16,9%,
‣ The implementation of IMO 2020 regulations and the consequent
deployment of a more refined and costly bunker fuel (0.5%
sulphur content) drove the increase of freight rate until April
- Service/Holding sales decline slightly
- Inter-segment eliminations are 4,2 M€ lower than last year
492,9 520,8
+5,4% +16,9% ns
Net SalesH1 2019
Import & Distribution
Shipping i/s eliminations
Net SalesH1 2020
Service/Holding
IFRS 16Adj. EBITDAExcl. IFRS 16
H1 2020
19,4
Total change
+4,6 M€
+31,3%
Total change
+27,9 M€
+5,7%
(*) Pro-rata revenues of companies acquired in 2019, net of I/co eliminations.
Import & Distribution
Shipping
Service/holding
Shipping
(**) Data excluding the effect of IFRS 16 adoption, consisting chiefly in the recognition of incremental Adjusted Ebitda of 4,5 M€ in H1 2019 and 4,1 M€ in H1 2020 and incremental NFP of 30,8 M€ in H1 2020 and 60 M€ in FY 2019
ns

24
Consolidated NET PROFIT
• Adjusted Net Profit H1 2020, excluding the non recurring impact and their tax effect, stands at abt.
7,5 M€,
- +3,5 M€ more than last year, primary due to higher operating margin balanced by higher D&A and lower financials costs (mainly related to positive effect on exchange rate differences of 1,1 M€)
• Non-recurring adjustments H1 2020 equal to a loss of -1,3 M€, net of estimated tax (mainly due to
COVID-19, personnel costs / litigation and other mix)
• Net Profit H1 2020 is ~6,2 M€ versus 1,1 M€ in H1 2019
ADJUSTED NET PROFIT VARIANCE (M€)
4,6
-1,5 1,4 -1,1 0,01
-1,3
1,1
4,0
7,56,2
-2,9
Net Profit H1
2019
Non-recurring
H1 2019
Adj. Net Profit
H1 2019
Adj. Ebitda Ex.
IFRS 16
D&A / Provisions Financials /
Share of Profit
Tax IFRS 16 Adj. Net Profit
Q1 2020
Non-recurring
Q1 2020
Net Profit Q1
2020
Total change+3,5 M€
25
43,055,0
32,450,3
30,6
50,0 44,5
Dec. 2017
pro-forma
Jun. 2018 Dec. 2018 Jun.2019 Dec.2019 Mar.2020 Jun.2020
6,2 -2,46,2
150,9 154,7
17,7
-14,0 -7,1-17,8 -0,2 -30,8
66,988,2
119,1
(**) 2017 Pro forma data take into account all the effects of the acquisition carried on during the year 2017. Limited to this purpose, the acquired companies have been assumed fully controlled from Jan. 1,2017.
+12
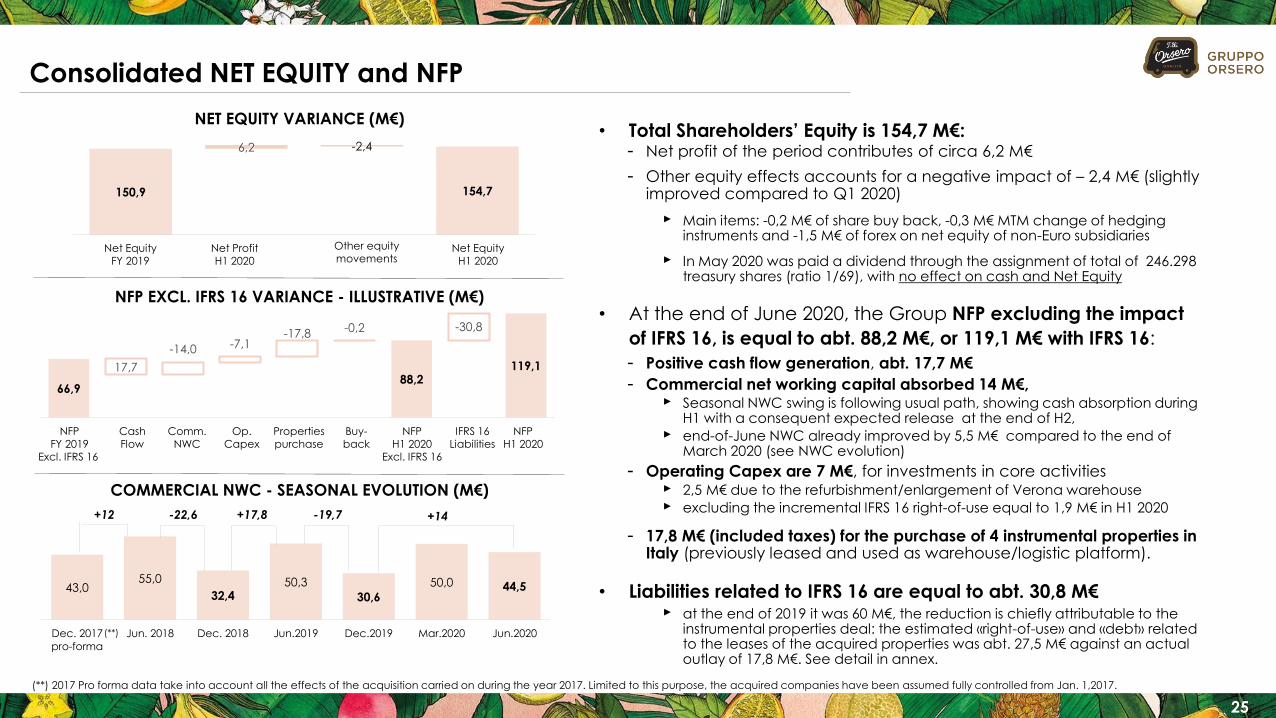
Consolidated NET EQUITY and NFP
• Total Shareholders’ Equity is 154,7 M€:- Net profit of the period contributes of circa 6,2 M€
- Other equity effects accounts for a negative impact of – 2,4 M€ (slightly improved compared to Q1 2020)
‣ Main items: -0,2 M€ of share buy back, -0,3 M€ MTM change of hedging instruments and -1,5 M€ of forex on net equity of non-Euro subsidiaries
‣ In May 2020 was paid a dividend through the assignment of total of 246.298 treasury shares (ratio 1/69), with no effect on cash and Net Equity
• At the end of June 2020, the Group NFP excluding the impact
of IFRS 16, is equal to abt. 88,2 M€, or 119,1 M€ with IFRS 16:
- Positive cash flow generation, abt. 17,7 M€
- Commercial net working capital absorbed 14 M€, ‣ Seasonal NWC swing is following usual path, showing cash absorption during
H1 with a consequent expected release at the end of H2,
‣ end-of-June NWC already improved by 5,5 M€ compared to the end of March 2020 (see NWC evolution)
- Operating Capex are 7 M€, for investments in core activities ‣ 2,5 M€ due to the refurbishment/enlargement of Verona warehouse
‣ excluding the incremental IFRS 16 right-of-use equal to 1,9 M€ in H1 2020
- 17,8 M€ (included taxes) for the purchase of 4 instrumental properties in Italy (previously leased and used as warehouse/logistic platform).
• Liabilities related to IFRS 16 are equal to abt. 30,8 M€ ‣ at the end of 2019 it was 60 M€, the reduction is chiefly attributable to the
instrumental properties deal: the estimated «right-of-use» and «debt» related to the leases of the acquired properties was abt. 27,5 M€ against an actual outlay of 17,8 M€. See detail in annex.
NET EQUITY VARIANCE (M€)
NFP EXCL. IFRS 16 VARIANCE - ILLUSTRATIVE (M€)
+14-22,6 +17,8
NFPFY 2019
Excl. IFRS 16
NFPH1 2020
IFRS 16Liabilities
NFPH1 2020
Excl. IFRS 16
Op. Capex
Comm.NWC
Cash Flow
Propertiespurchase
(**)
Net EquityFY 2019
Net EquityH1 2020
Other equity movements
Net ProfitH1 2020
-19,7
COMMERCIAL NWC - SEASONAL EVOLUTION (M€)
Buy-back

HISTORICAL TREND AND OUTLOOK
27
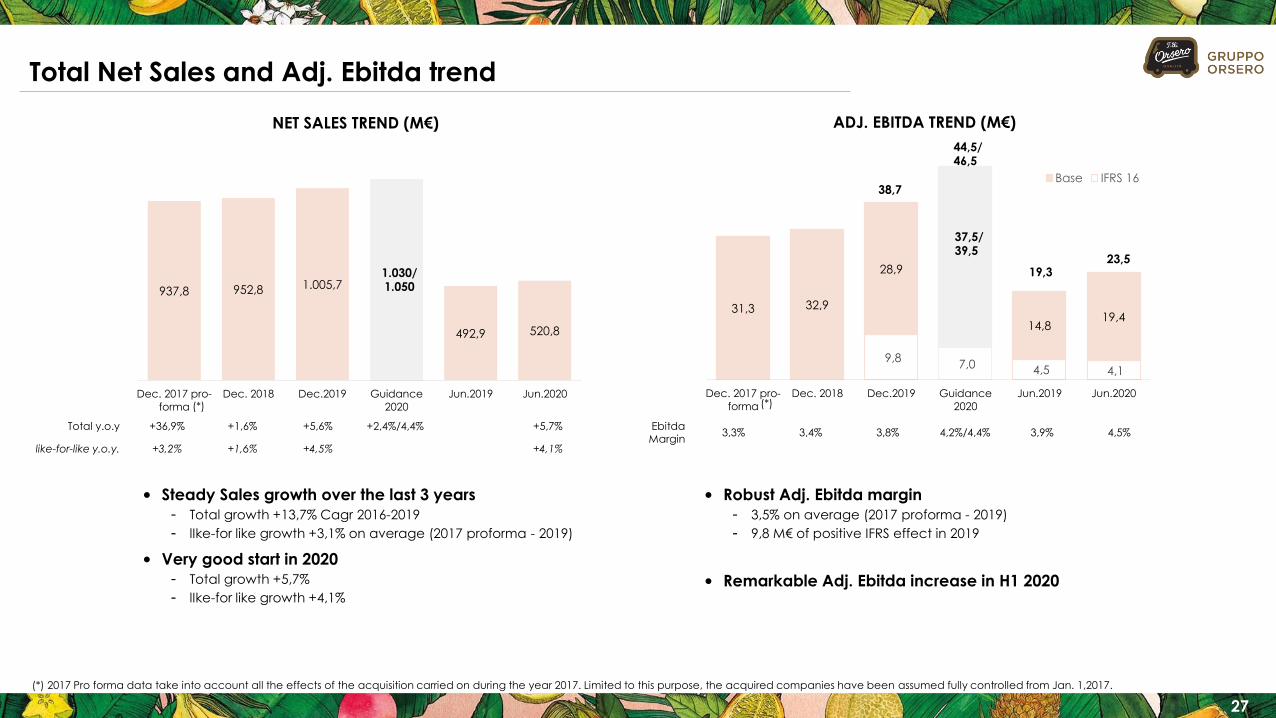
Total Net Sales and Adj. Ebitda trend
Total y.o.y +36,9% +1,6% +5,6% +2,4%/4,4% +5,7%
like-for-like y.o.y. +3,2% +1,6% +4,5% +4,1%
937,8 952,8 1.005,7
492,9 520,8
Dec. 2017 pro-
forma
Dec. 2018 Dec.2019 Guidance
2020
Jun.2019 Jun.2020
9,8 7,0 4,5 4,1
31,3 32,9
28,9
14,819,4
Dec. 2017 pro-
forma
Dec. 2018 Dec.2019 Guidance
2020
Jun.2019 Jun.2020
Base IFRS 16
37,5/39,5
38,7
Ebitda Margin
3,3% 3,4% 3,8% 4,2%/4,4% 3,9% 4,5%
NET SALES TREND (M€) ADJ. EBITDA TREND (M€)
• Steady Sales growth over the last 3 years
- Total growth +13,7% Cagr 2016-2019
- lIke-for like growth +3,1% on average (2017 proforma - 2019)
• Very good start in 2020
- Total growth +5,7%
- lIke-for like growth +4,1%
• Robust Adj. Ebitda margin
- 3,5% on average (2017 proforma - 2019)
- 9,8 M€ of positive IFRS effect in 2019
• Remarkable Adj. Ebitda increase in H1 2020
(*) 2017 Pro forma data take into account all the effects of the acquisition carried on during the year 2017. Limited to this purpose, the acquired companies have been assumed fully controlled from Jan. 1,2017.
(*) (*)
19,323,5
1.030/1.050
44,5/46,5
28
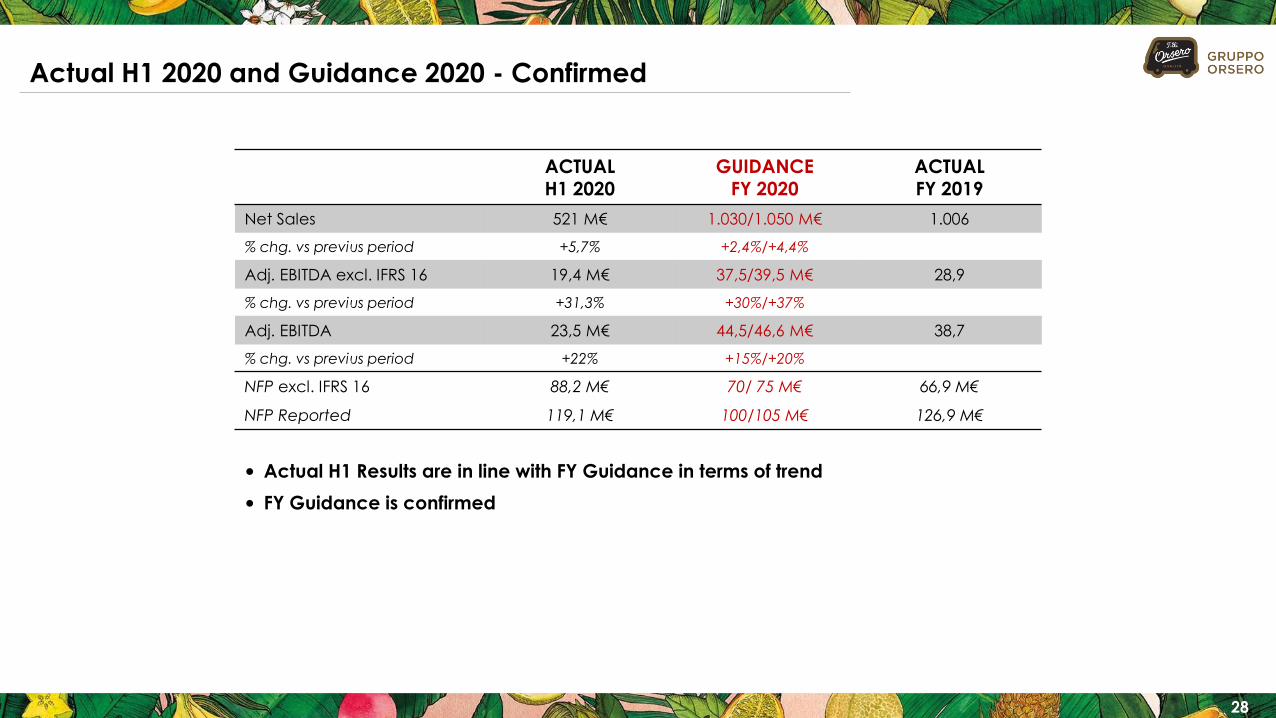
Actual H1 2020 and Guidance 2020 - Confirmed
ACTUAL H1 2020
GUIDANCE FY 2020
ACTUAL FY 2019
Net Sales 521 M€ 1.030/1.050 M€ 1.006
% chg. vs previus period +5,7% +2,4%/+4,4%
Adj. EBITDA excl. IFRS 16 19,4 M€ 37,5/39,5 M€ 28,9
% chg. vs previus period +31,3% +30%/+37%
Adj. EBITDA 23,5 M€ 44,5/46,6 M€ 38,7
% chg. vs previus period +22% +15%/+20%
NFP excl. IFRS 16 88,2 M€ 70/ 75 M€ 66,9 M€
NFP Reported 119,1 M€ 100/105 M€ 126,9 M€
• Actual H1 Results are in line with FY Guidance in terms of trend
• FY Guidance is confirmed
29
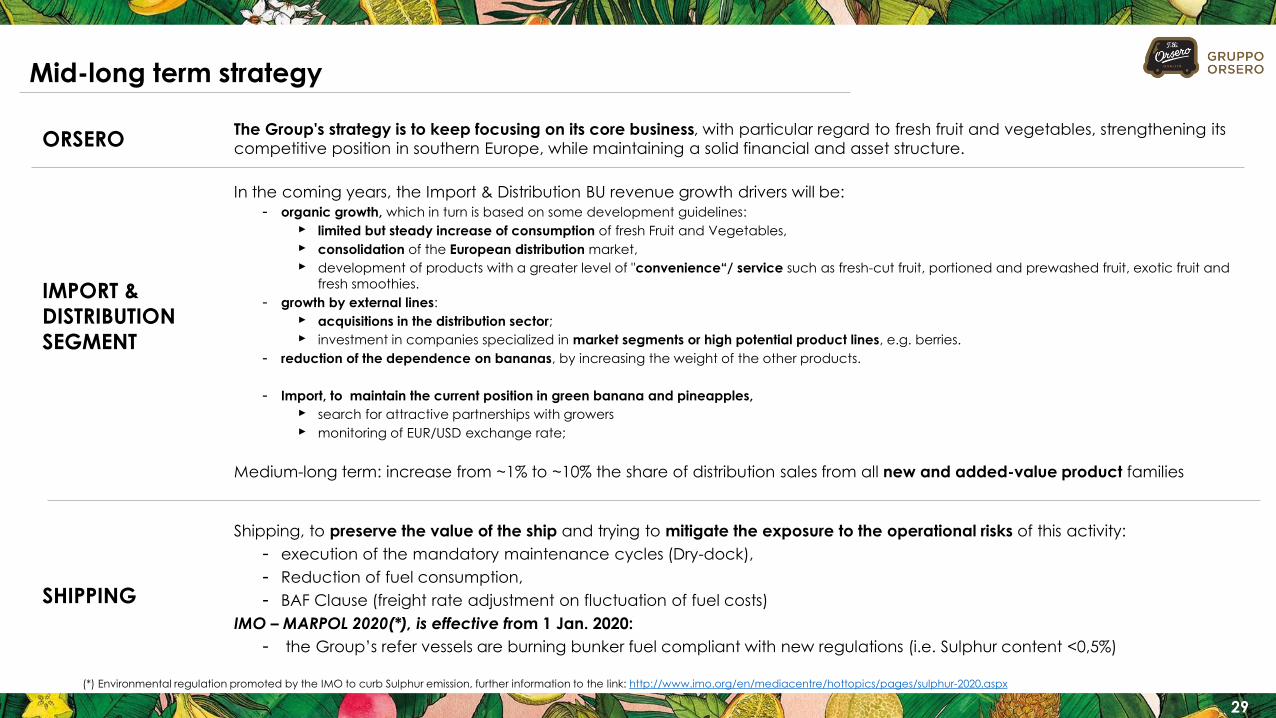
The Group's strategy is to keep focusing on its core business, with particular regard to fresh fruit and vegetables, strengthening its
competitive position in southern Europe, while maintaining a solid financial and asset structure.
In the coming years, the Import & Distribution BU revenue growth drivers will be:
- organic growth, which in turn is based on some development guidelines:
‣ limited but steady increase of consumption of fresh Fruit and Vegetables,
‣ consolidation of the European distribution market,
‣ development of products with a greater level of "convenience“/ service such as fresh-cut fruit, portioned and prewashed fruit, exotic fruit and
fresh smoothies.
- growth by external lines:
‣ acquisitions in the distribution sector;
‣ investment in companies specialized in market segments or high potential product lines, e.g. berries.
- reduction of the dependence on bananas, by increasing the weight of the other products.
- Import, to maintain the current position in green banana and pineapples,
‣ search for attractive partnerships with growers
‣ monitoring of EUR/USD exchange rate;
Medium-long term: increase from ~1% to ~10% the share of distribution sales from all new and added-value product families
Mid-long term strategy
Shipping, to preserve the value of the ship and trying to mitigate the exposure to the operational risks of this activity:
- execution of the mandatory maintenance cycles (Dry-dock),
- Reduction of fuel consumption,
- BAF Clause (freight rate adjustment on fluctuation of fuel costs)
IMO – MARPOL 2020(*), is effective from 1 Jan. 2020:
- the Group’s refer vessels are burning bunker fuel compliant with new regulations (i.e. Sulphur content <0,5%)
IMPORT &
DISTRIBUTION
SEGMENT
SHIPPING
ORSERO
(*) Environmental regulation promoted by the IMO to curb Sulphur emission, further information to the link: http://www.imo.org/en/mediacentre/hottopics/pages/sulphur-2020.aspx

APPENDIX
31
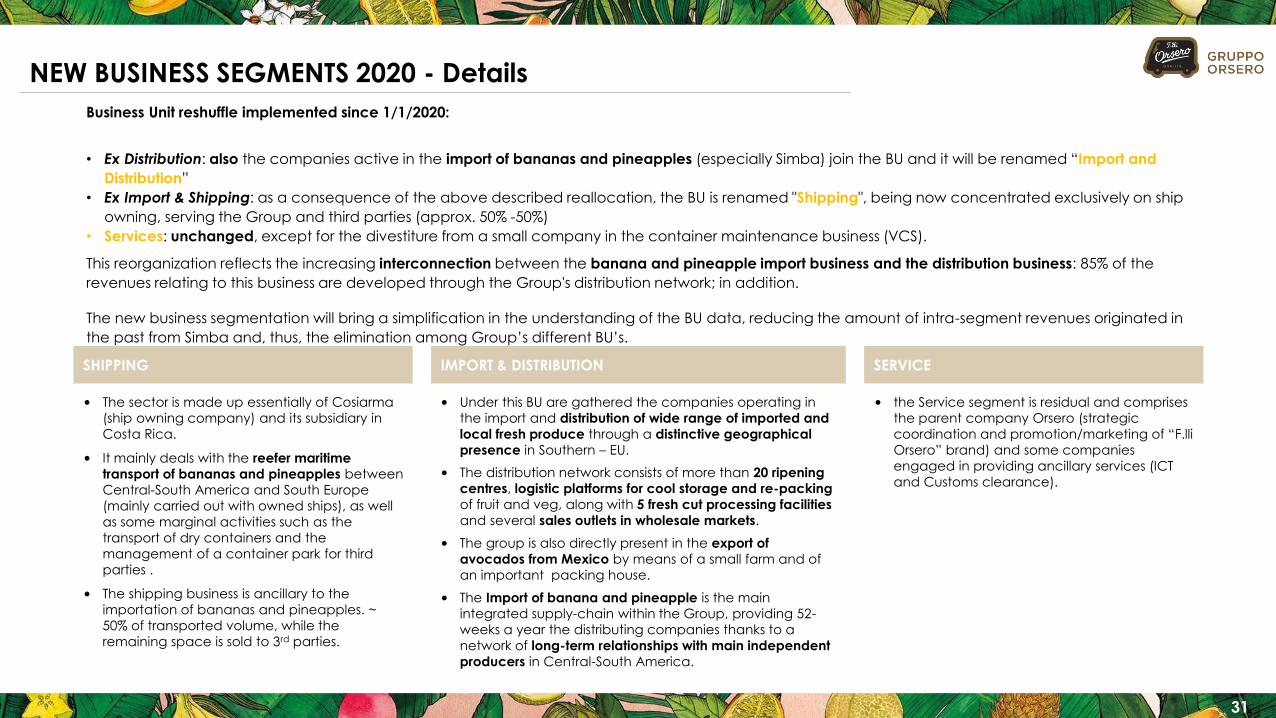
IMPORT & DISTRIBUTION SERVICESHIPPING
• the Service segment is residual and comprises
the parent company Orsero (strategic
coordination and promotion/marketing of “F.lli
Orsero” brand) and some companies
engaged in providing ancillary services (ICT
and Customs clearance).
NEW BUSINESS SEGMENTS 2020 - Details
• The sector is made up essentially of Cosiarma
(ship owning company) and its subsidiary in
Costa Rica.
• It mainly deals with the reefer maritime
transport of bananas and pineapples between
Central-South America and South Europe
(mainly carried out with owned ships), as well
as some marginal activities such as the
transport of dry containers and the
management of a container park for third
parties .
• The shipping business is ancillary to the
importation of bananas and pineapples. ~
50% of transported volume, while the
remaining space is sold to 3rd parties.
• Under this BU are gathered the companies operating in
the import and distribution of wide range of imported and
local fresh produce through a distinctive geographical
presence in Southern – EU.
• The distribution network consists of more than 20 ripening
centres, logistic platforms for cool storage and re-packing
of fruit and veg, along with 5 fresh cut processing facilities
and several sales outlets in wholesale markets.
• The group is also directly present in the export of
avocados from Mexico by means of a small farm and of
an important packing house.
• The Import of banana and pineapple is the main
integrated supply-chain within the Group, providing 52-
weeks a year the distributing companies thanks to a
network of long-term relationships with main independent
producers in Central-South America.
Business Unit reshuffle implemented since 1/1/2020:
• Ex Distribution: also the companies active in the import of bananas and pineapples (especially Simba) join the BU and it will be renamed “Import and
Distribution”
• Ex Import & Shipping: as a consequence of the above described reallocation, the BU is renamed "Shipping", being now concentrated exclusively on ship
owning, serving the Group and third parties (approx. 50% -50%)
• Services: unchanged, except for the divestiture from a small company in the container maintenance business (VCS).
This reorganization reflects the increasing interconnection between the banana and pineapple import business and the distribution business: 85% of the
revenues relating to this business are developed through the Group's distribution network; in addition.
The new business segmentation will bring a simplification in the understanding of the BU data, reducing the amount of intra-segment revenues originated in
the past from Simba and, thus, the elimination among Group’s different BU’s.

32
Condensed Company structure
Line by Line
Consolidation
Equity Method
Note: This slide is an illustrative and simplified company structure showing only the main operating subsidiaries/associates/joint ventures of Orsero Group. If not otherwise specified the companies are intended as wholly owned by the Group.
(1) Acquisition of 100% in Jan. 2019. Line-by-Line consolidation from 1 Jan 2019.
(2) Acquisition of 100% in Mar. 2019. Line-by-Line consolidation from 1 April 2019.
(3) Acquisition of 75% in Jul. 2019 (25% already owned by the Group). Line-by-Line consolidation from 1 July 2019.
ORSERO SERVIZI(Italy)
Fresco Forw. Agency (Italy)
FRUTTICA(France)
ORSERO SPA
IMPORT & DISTRIBUTIONSHIPPINGSERVICES &
HOLDING
FRUTTITAL(Italy)
AZ FRANCE(France)
EUROFRUTAS(Portugal)
BELLA FRUTTA(Greece)
H.NOS FERNÁNDEZLÓPEZ (Spain)
FRUTTITAL FIRENZE(Italy)
GALANDI(Italy)
MONCADA FRUTTA(Italy) (50%)
COSIARMA(Italy)
SIMBA(Italy)
SIMBACOL(Colombia)
ORSERO CR(Costa Rica)
COMM. DE FRUTAACAPULCO (Mexico)
FRUPORT(Spain) (49%)
HOLDING SERVICES(Orsero S.p.A.)
ORSERO SERVIZI(Italy)
Fresco Forw. Agency (Italy)
FRUTTICA2)
(France)
ORSERO SPA
DISTRIBUTIONIMPORT &
SHIPPING
SERVICES &
HOLDING
FRUTTITAL(Italy)
AZ FRANCE(France)
EUROFRUTAS(Portugal)
BELLA FRUTTA(Greece)
H.NOS FERNÁNDEZLÓPEZ (Spain)
FRUTTITAL FIRENZE(Italy)
GALANDI(Italy)
FRUTTITAL CAGLIARI3)
(Italy)
MONCADA FRUTTA(Italy) (50%)
COSIARMA(Italy)
SIMBA(Italy)
SIMBACOL(Colombia)
ORSERO CR(Costa Rica)
COMM. DE FRUTA
ACAPULCO (Mexico)
FRUPORT(Spain) (49%)
HOLDING SERVICES(Orsero S.p.A.)
SEVIMPOR1)
(Spain)
NEW BUSINESS SEGMENTS FROM 01.01.2020 OLD BUSINESS SEGMENTS UP 31.12.2019
• Semplification effective from 1 Jul. 2020 : Fruttial Cagliari merged into Fruttital;
Sevimpor merged into Hermanos Fernández López .
• The company structure will be further streamlined through the merger of
Fruttital Firenze into Fruttital (2021).
• Orsero announced on 29 July 2020 the acquisition of remaining 50% of
Moncada Frutta, the company enters the consolidation scope (line-by-line
consolidation) from July 2020 onwards.
33
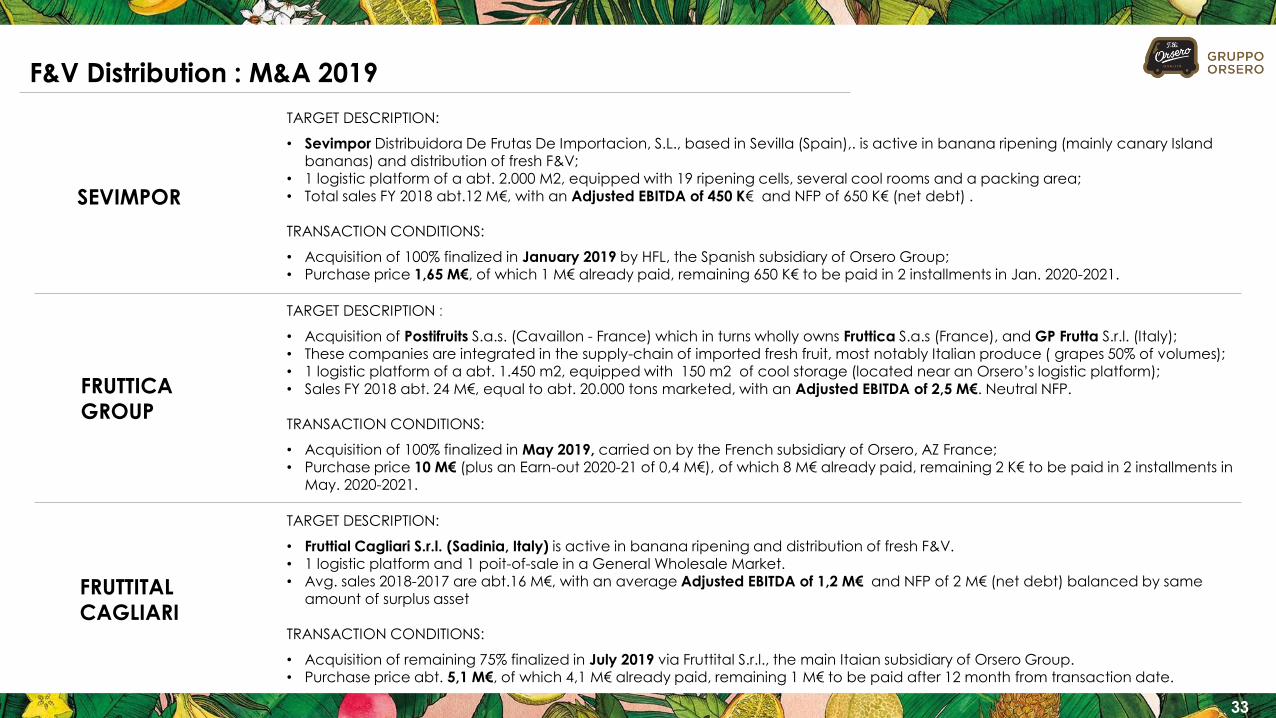
F&V Distribution : M&A 2019
TARGET DESCRIPTION:
• Sevimpor Distribuidora De Frutas De Importacion, S.L., based in Sevilla (Spain),. is active in banana ripening (mainly canary Island bananas) and distribution of fresh F&V;
• 1 logistic platform of a abt. 2.000 M2, equipped with 19 ripening cells, several cool rooms and a packing area;• Total sales FY 2018 abt.12 M€, with an Adjusted EBITDA of 450 K€ and NFP of 650 K€ (net debt) .
TRANSACTION CONDITIONS:
• Acquisition of 100% finalized in January 2019 by HFL, the Spanish subsidiary of Orsero Group;• Purchase price 1,65 M€, of which 1 M€ already paid, remaining 650 K€ to be paid in 2 installments in Jan. 2020-2021.
TARGET DESCRIPTION :
• Acquisition of Postifruits S.a.s. (Cavaillon - France) which in turns wholly owns Fruttica S.a.s (France), and GP Frutta S.r.l. (Italy);• These companies are integrated in the supply-chain of imported fresh fruit, most notably Italian produce ( grapes 50% of volumes);• 1 logistic platform of a abt. 1.450 m2, equipped with 150 m2 of cool storage (located near an Orsero’s logistic platform);• Sales FY 2018 abt. 24 M€, equal to abt. 20.000 tons marketed, with an Adjusted EBITDA of 2,5 M€. Neutral NFP.
TRANSACTION CONDITIONS:
• Acquisition of 100% finalized in May 2019, carried on by the French subsidiary of Orsero, AZ France;• Purchase price 10 M€ (plus an Earn-out 2020-21 of 0,4 M€), of which 8 M€ already paid, remaining 2 K€ to be paid in 2 installments in
May. 2020-2021.
FRUTTICA
GROUP
SEVIMPOR
TARGET DESCRIPTION:
• Fruttial Cagliari S.r.l. (Sadinia, Italy) is active in banana ripening and distribution of fresh F&V.• 1 logistic platform and 1 poit-of-sale in a General Wholesale Market.• Avg. sales 2018-2017 are abt.16 M€, with an average Adjusted EBITDA of 1,2 M€ and NFP of 2 M€ (net debt) balanced by same
amount of surplus asset
TRANSACTION CONDITIONS:
• Acquisition of remaining 75% finalized in July 2019 via Fruttital S.r.l., the main Itaian subsidiary of Orsero Group.• Purchase price abt. 5,1 M€, of which 4,1 M€ already paid, remaining 1 M€ to be paid after 12 month from transaction date.
FRUTTITAL
CAGLIARI
34
MAIN 2020 TRANSACTIONS
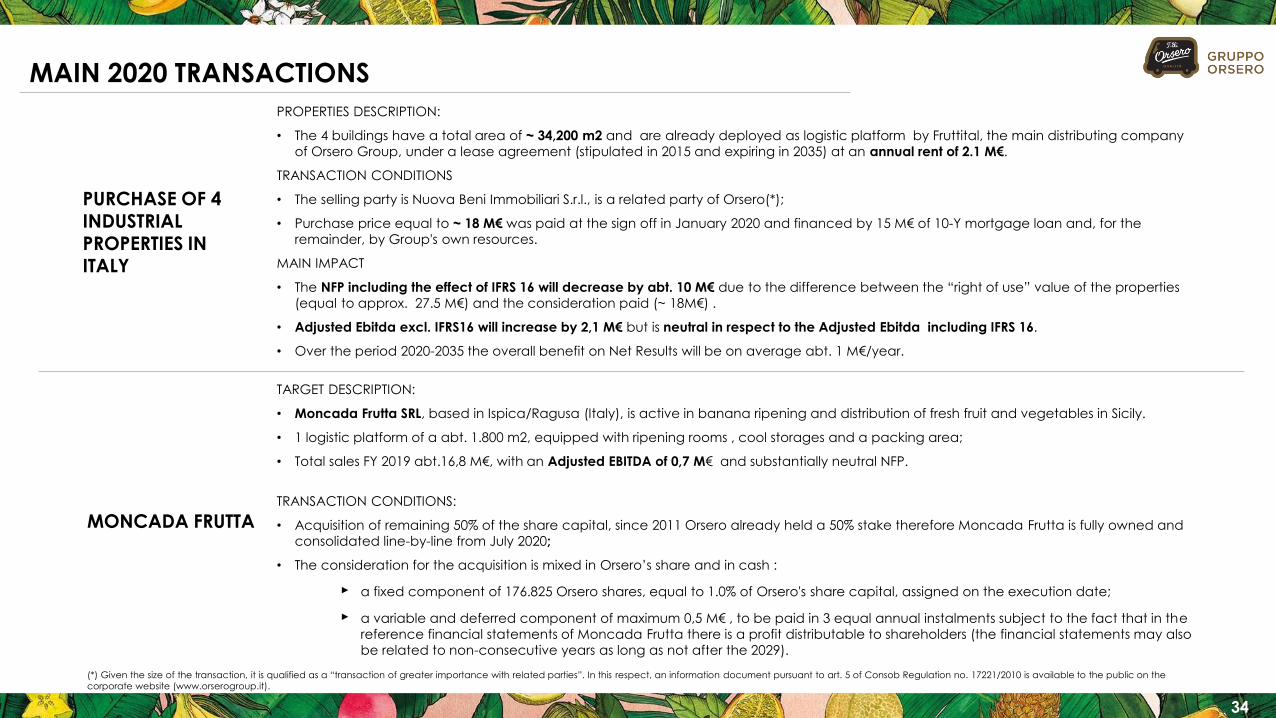
TARGET DESCRIPTION:
• Moncada Frutta SRL, based in Ispica/Ragusa (Italy), is active in banana ripening and distribution of fresh fruit and vegetables in Sicily.
• 1 logistic platform of a abt. 1.800 m2, equipped with ripening rooms , cool storages and a packing area;
• Total sales FY 2019 abt.16,8 M€, with an Adjusted EBITDA of 0,7 M€ and substantially neutral NFP.
TRANSACTION CONDITIONS:
• Acquisition of remaining 50% of the share capital, since 2011 Orsero already held a 50% stake therefore Moncada Frutta is fully owned and
consolidated line-by-line from July 2020;
• The consideration for the acquisition is mixed in Orsero’s share and in cash :
‣ a fixed component of 176.825 Orsero shares, equal to 1.0% of Orsero's share capital, assigned on the execution date;
‣ a variable and deferred component of maximum 0,5 M€ , to be paid in 3 equal annual instalments subject to the fact that in the
reference financial statements of Moncada Frutta there is a profit distributable to shareholders (the financial statements may also
be related to non-consecutive years as long as not after the 2029).
MONCADA FRUTTA
PURCHASE OF 4
INDUSTRIAL PROPERTIES IN ITALY
PROPERTIES DESCRIPTION:
• The 4 buildings have a total area of ~ 34,200 m2 and are already deployed as logistic platform by Fruttital, the main distributing company
of Orsero Group, under a lease agreement (stipulated in 2015 and expiring in 2035) at an annual rent of 2.1 M€.
TRANSACTION CONDITIONS
• The selling party is Nuova Beni Immobiliari S.r.l., is a related party of Orsero(*);
• Purchase price equal to ~ 18 M€ was paid at the sign off in January 2020 and financed by 15 M€ of 10-Y mortgage loan and, for the
remainder, by Group's own resources.
MAIN IMPACT
• The NFP including the effect of IFRS 16 will decrease by abt. 10 M€ due to the difference between the “right of use” value of the properties
(equal to approx. 27.5 M€) and the consideration paid (~ 18M€) .
• Adjusted Ebitda excl. IFRS16 will increase by 2,1 M€ but is neutral in respect to the Adjusted Ebitda including IFRS 16.
• Over the period 2020-2035 the overall benefit on Net Results will be on average abt. 1 M€/year.
(*) Given the size of the transaction, it is qualified as a “transaction of greater importance with related parties”. In this respect, an information document pursuant to art. 5 of Consob Regulation no. 17221/2010 is available to the public on the
corporate website (www.orserogroup.it).
35
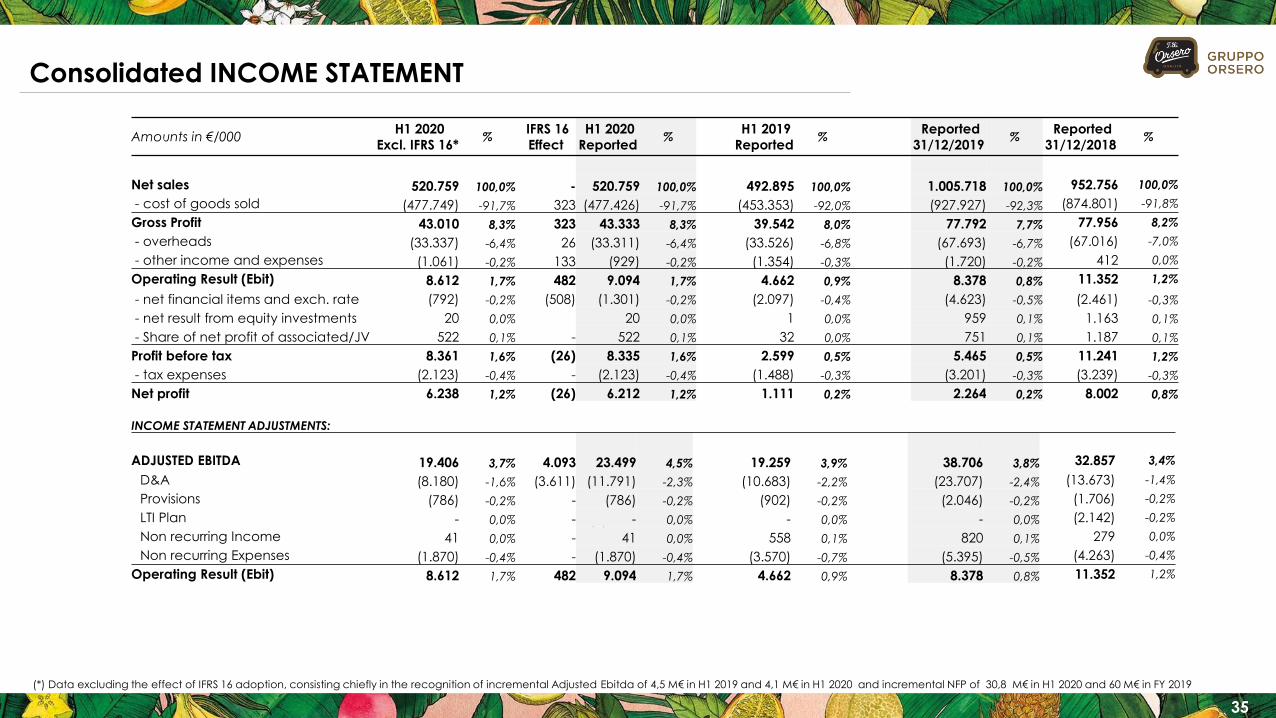
Consolidated INCOME STATEMENT
Amounts in €/000H1 2020
Excl. IFRS 16* %
IFRS 16
Effect
H1 2020
Reported%
H1 2019
Reported%
Reported
31/12/2019 %
Reported
31/12/2018 %
Net sales 520.759 100,0% - 520.759 100,0% 492.895 100,0% 1.005.718 100,0% 952.756 100,0%
- cost of goods sold (477.749) -91,7% 323 (477.426) -91,7% (453.353) -92,0% (927.927) -92,3% (874.801) -91,8%
Gross Profit 43.010 8,3% 323 43.333 8,3% 39.542 8,0% 77.792 7,7% 77.956 8,2%
- overheads (33.337) -6,4% 26 (33.311) -6,4% (33.526) -6,8% (67.693) -6,7% (67.016) -7,0%
- other income and expenses (1.061) -0,2% 133 (929) -0,2% (1.354) -0,3% (1.720) -0,2% 412 0,0%
Operating Result (Ebit) 8.612 1,7% 482 9.094 1,7% 4.662 0,9% 8.378 0,8% 11.352 1,2%
- net financial items and exch. rate (792) -0,2% (508) (1.301) -0,2% (2.097) -0,4% (4.623) -0,5% (2.461) -0,3%
- net result from equity investments 20 0,0% 20 0,0% 1 0,0% 959 0,1% 1.163 0,1%
- Share of net profit of associated/JV 522 0,1% - 522 0,1% 32 0,0% 751 0,1% 1.187 0,1%
Profit before tax 8.361 1,6% (26) 8.335 1,6% 2.599 0,5% 5.465 0,5% 11.241 1,2%
- tax expenses (2.123) -0,4% - (2.123) -0,4% (1.488) -0,3% (3.201) -0,3% (3.239) -0,3%
Net profit 6.238 1,2% (26) 6.212 1,2% 1.111 0,2% 2.264 0,2% 8.002 0,8%
(*)
INCOME STATEMENT ADJUSTMENTS:
ADJUSTED EBITDA 19.406 3,7% 4.093 23.499 4,5% 19.259 3,9% 38.706 3,8% 32.857 3,4%
D&A (8.180) -1,6% (3.611) (11.791) -2,3% (10.683) -2,2% (23.707) -2,4% (13.673) -1,4%
Provisions (786) -0,2% - (786) -0,2% (902) -0,2% (2.046) -0,2% (1.706) -0,2%
LTI Plan - 0,0% - - 0,0% - 0,0% - 0,0% (2.142) -0,2%
Non recurring Income 41 0,0% - 41 0,0% 558 0,1% 820 0,1% 279 0,0%
Non recurring Expenses (1.870) -0,4% - (1.870) -0,4% (3.570) -0,7% (5.395) -0,5% (4.263) -0,4%
Operating Result (Ebit) 8.612 1,7% 482 9.094 1,7% 4.662 0,9% 8.378 0,8% 11.352 1,2%
(*) Data excluding the effect of IFRS 16 adoption, consisting chiefly in the recognition of incremental Adjusted Ebitda of 4,5 M€ in H1 2019 and 4,1 M€ in H1 2020 and incremental NFP of 30,8 M€ in H1 2020 and 60 M€ in FY 2019
36
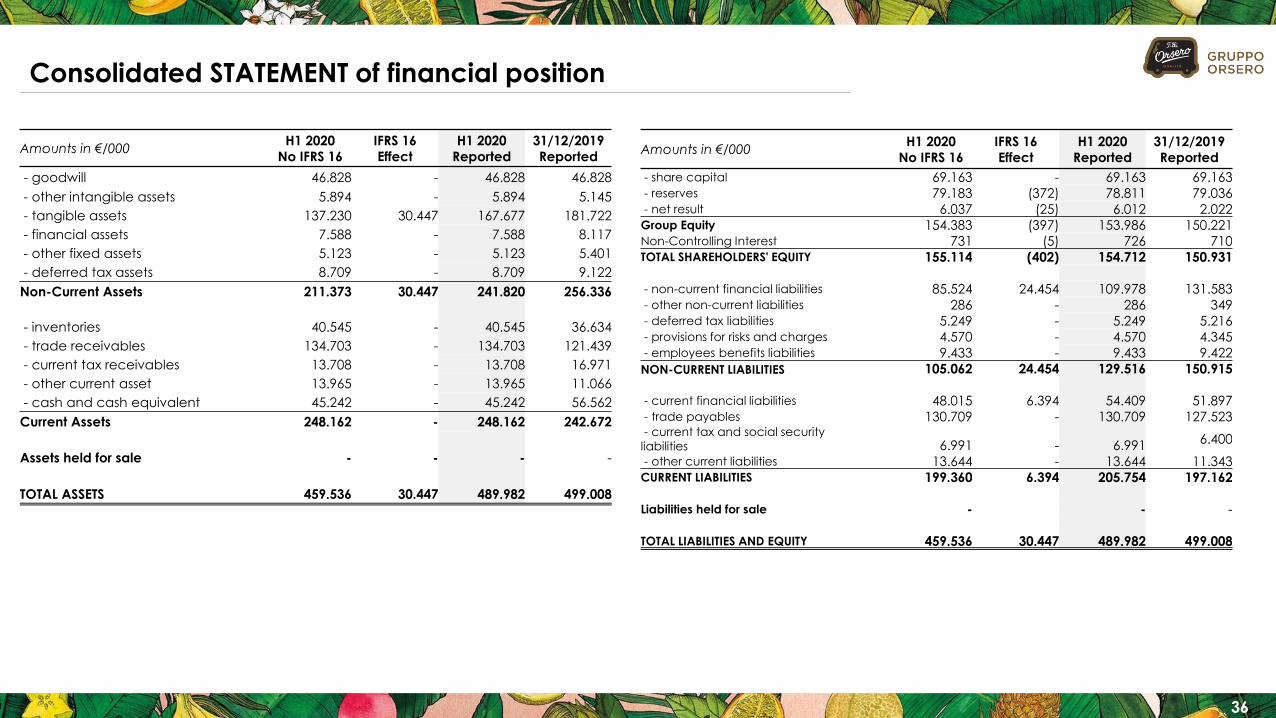
Consolidated STATEMENT of financial position
Amounts in €/000H1 2020
No IFRS 16
IFRS 16
Effect
H1 2020
Reported
31/12/2019
Reported
- goodwill 46.828 - 46.828 46.828
- other intangible assets 5.894 - 5.894 5.145
- tangible assets 137.230 30.447 167.677 181.722
- financial assets 7.588 - 7.588 8.117
- other fixed assets 5.123 - 5.123 5.401
- deferred tax assets 8.709 - 8.709 9.122
Non-Current Assets 211.373 30.447 241.820 256.336
- inventories 40.545 - 40.545 36.634
- trade receivables 134.703 - 134.703 121.439
- current tax receivables 13.708 - 13.708 16.971
- other current asset 13.965 - 13.965 11.066
- cash and cash equivalent 45.242 - 45.242 56.562
Current Assets 248.162 - 248.162 242.672
Assets held for sale - - - -
TOTAL ASSETS 459.536 30.447 489.982 499.008
Amounts in €/000H1 2020
No IFRS 16
IFRS 16
Effect
H1 2020
Reported
31/12/2019
Reported
- share capital 69.163 - 69.163 69.163 - reserves 79.183 (372) 78.811 79.036 - net result 6.037 (25) 6.012 2.022 Group Equity 154.383 (397) 153.986 150.221 Non-Controlling Interest 731 (5) 726 710 TOTAL SHAREHOLDERS' EQUITY 155.114 (402) 154.712 150.931
- non-current financial liabilities 85.524 24.454 109.978 131.583 - other non-current liabilities 286 - 286 349 - deferred tax liabilities 5.249 - 5.249 5.216 - provisions for risks and charges 4.570 - 4.570 4.345 - employees benefits liabilities 9.433 - 9.433 9.422
NON-CURRENT LIABILITIES 105.062 24.454 129.516 150.915
- current financial liabilities 48.015 6.394 54.409 51.897 - trade payables 130.709 - 130.709 127.523 - current tax and social security
liabilities 6.991 - 6.991 6.400
- other current liabilities 13.644 - 13.644 11.343 CURRENT LIABILITIES 199.360 6.394 205.754 197.162
Liabilities held for sale - - -
TOTAL LIABILITIES AND EQUITY 459.536 30.447 489.982 499.008

37
DEFINITIONS & Symbols
• Y.o.y. = year on year,
• Abt. = about
• Adjusted ebitda = Earning Before Interests Tax, Depreciation and
Amortization excluding non-recurring items and figurative costs related to
LT incentives
• AGM = Annual General Meeting
• Approx. = Approximatively
• BAF = Bunker Adjustment Factor
• BC = Business Combination
• BoD = Board of Directors
• Bps. = basis points
• BU = Business Unit
• D&A = Depreciations and Amortizations
• EBIT = Earnings Before Interests Tax
• EBITDA = Earnings Before Interests Tax Depreciations and Amortizations
• Excl.= exuding
• F&V = Fruit & Vegetables
• FTE = Full Time Equivalent
• FY = Full Year
• H1 = first half (i.e. period 1/1/2019 – 30/6/2019)
• H2= second half (i.e. period 1/7/2019-31/12/2019
• HFL = Hermanos Fernández López S.A.
• I/S = Inter Segment
• I/co = Intercompany
• LFL = Like for like
• LTI = Long- Term Incentive
• M&A = Merger and Acquisition
• MLT = Medium Long Term
• MTM = Mark to market
• NFP = Net Financial Position, if positive is meant debt
• NS = Not significant
• PBT = Profit Before tax
• Plt. = Pallet
• PY = previous year or prior year
• SPAC = Special Purpose Acquisition Company
• TTM = Trailing 12 months
• M = million
• K = thousands
• € = EURO
• , (comma) = separator of decimal digits
• . (full stop) = separator of thousands
ORSERO SPAwww.orserogroup.it