investor presentation h1 2017 results - rabobank · investor presentation h1 2017 results. 20...
TRANSCRIPT

Investor Presentation H1 2017 results
20 December 2017
Rabobank

Investor Relations
Disclaimer
This presentation (the “Presentation”) is prepared by Coöperatieve Rabobank U.A. (“Rabobank”) incorporated under the laws of the Netherlands. The liability of its members is excluded. Rabobank is among others regulated by De Nederlandsche Bank N.V. and by the Netherlands Authority for the Financial Markets, as well as the European Central Bank. This Presentation is solely for information purposes and on the basis of the acceptance of this disclaimer. Neither the Presentation nor any of its contents, in whole or in part, directly or indirectly, may be used for any other purpose without the prior written consent of Rabobank. This Presentation is only directed at Eligible Counterparties and Professional Clients, as defined in the Markets in Financial Instruments Directive 2004/39/EC (“MiFID”) (the “Recipient”). It is not directed at Retail Clients (as defined in MiFID).
The content of this Presentation reflects prevailing market conditions and Rabobank’s judgment as on the date of this Presentation, all of which may be subject to change. The information and opinions contained in this Presentation have been compiled or arrived at from sources believed to be reliable, but no representation or warranty, express or implied is made as to their accuracy, completeness or correctness. The information contained in this Presentation is published for the assistance of the Recipient, but is not to be relied upon as authoritative or taken in substitution for the exercise of judgment by any Recipient nor will any information in this Presentation (including, but not limited to, Statistical Information (as defined below) and forward- looking statements) be subject to updating. Rabobank has further relied upon and assumed, without independent verification, the accuracy and completeness of all information made available to it. To the extent permitted by law, Rabobank excludes any liability howsoever arising from the contents of this Presentation or for the consequences of any actions taken in reliance on this Presentation or the content herein. Each Recipient is advised to seek independent professional advice as to the suitability of any products and to their tax, accounting, legal or regulatory implications.
Members of the Rabobank Group trade on their own account and may from time to time hold or act as market makers in securities issued by a client, or may act as advisers, brokers or bankers to a client or any of its affiliates.
This Presentation contains certain tables and other statistical analyses (the "Statistical Information"). Numerous assumptions have been used in preparing the Statistical Information, which may or may not be reflected in this Presentation or be suitable for the circumstances of any particular Recipient. As such, no assurance can be given as to the Statistical Information's accuracy, appropriateness or completeness in any particular context, or as to whether the Statistical Information and/or the assumptions upon which they are based reflect present market conditions or future market performance. The Statistical Information should not be construed as either projections or predictions.
This Presentation may include "forward-looking statements". Such statements contain the words "anticipate", "believe", “could”, “intend", "estimate", "expect", "will", "may", "project", "plan“, the negative of such terms and words of similar meaning. All statements included in this Presentation other than statements of historical facts, are forward-looking statements. Such forward-looking statements involve known and unknown risks, uncertainties and other important factors that could cause actual results, performance or achievements to be materially different from future results, performance or achievements expressed or implied by such forward-looking statements. Such forward-looking statements are based on numerous assumptions regarding present and future business strategies and the relevant future business environment. The information and opinions contained in this Presentation are wholly indicative, for discussion purposes only and are subject to change without notice at any time. No rights may be derived from any potential offers, transactions, commercial ideas et cetera contained in this Presentation. This Presentation does not constitute an offer, commitment or invitation and does not constitute investment advice and is not intended for the use by persons as an offer of securities subject to the Netherlands Financial Supervision Act. This Presentation shall not form the basis of or be relied upon in connection with any contract or commitment whatsoever.
© Rabobank, Croeselaan 18, 3521 CB Utrecht, The Netherlands, www.rabobank.com/ir, Chamber of Commerce number 30046259.
InvestingRabobank and the other parts of Rabobank Group that are designated as investment institutions are registered as such with the Netherlands Authority for the Financial Markets. The aforementioned investment institutions are licensed by the Netherlands Authority for the Financial Markets under the Financial Supervision Act. If you invest funds you have borrowed, you run the risk of incurring a debt as well as losing the invested funds.
This Presentation does not constitute an offering document. The information herein is an advertisement and does not comprise a prospectus for the purpose of EU Directive 2003/71/EC (as amended from time to time). The information herein has not been reviewed or approved by any rating agency, government entity, regulatory body or listing authority and does not constitute listing particulars in compliance with the regulations or rules of any stock exchange.
Nothing in this Presentation should be construed as legal, tax, accounting, regulatory or investment advice and the Recipient is advised to consult its own independent professional advisers in relation to investment in one of the products mentioned. The information contained herein does not purport to be complete and your decision to invest in one of the products mentioned should solely be based on the applicable prospectus or information memorandum including the risk factors, costs, terms and conditions and underlying values. The applicable prospectus or information memorandum is available with Rabobank or on www.rabobank.com/ir.
The value of your investment can fluctuate. Past performance offers no guarantee for future results.
2

Investor Relations
Good progress made in realising strategic objectives
3
Transition progress tangible across the bank
The implementation of our strategy…
• Positive trend in Customer Satisfaction levels
• Our balance sheet optimisation is on track
• Total staff reduction target for the years 2016-2018 on schedule
…combined with the benign economic environment…
• Negative loan impairment charges
• NPLs further down
…led to significant improvement of results…
• Substantial increase in net profit: +52% to € 1.5bn
• Resilient income (despite adverse interest rate environment) underpinned by strong franchise
• Improved underlying performance on the back of improved asset quality
…and even stronger capital and liquidity ratios
• Capital targets for 2020 have already been met and are well above current regulatory requirements
• Liquidity ratios further improved
• Further growth and diversification of our capital and funding mix

Investor Relations
Topics
4
Update on strategy
H1 2017 results
Appendix:
• Rabobank: Dutch, cooperative and profitable
• Financial results
• Loan portfolio
• Capital, Funding & Liquidity
• Current & future developments
Investor Relations
A client centered cooperative bank with roots in F&A
5
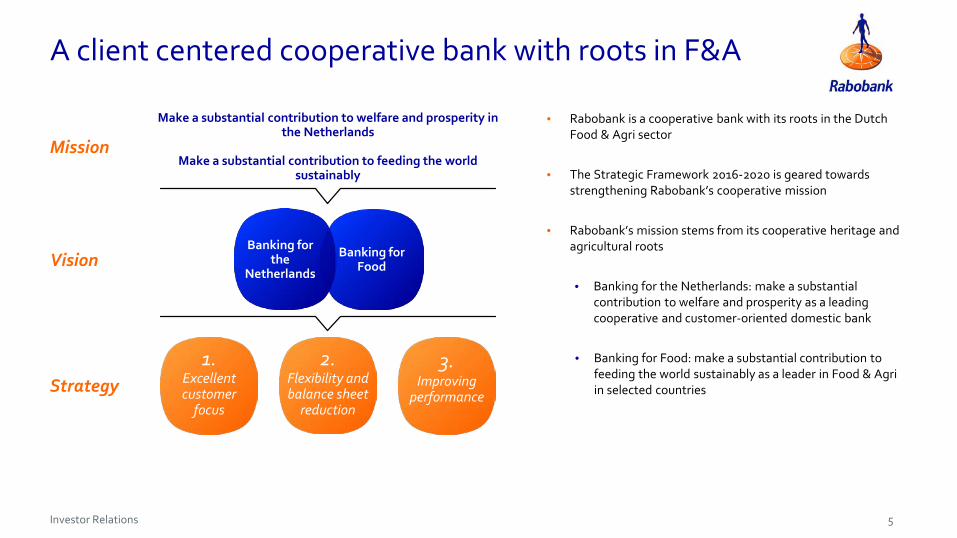
• Rabobank is a cooperative bank with its roots in the Dutch Food & Agri sector
• The Strategic Framework 2016-2020 is geared towards strengthening Rabobank’s cooperative mission
• Rabobank’s mission stems from its cooperative heritage and agricultural roots
• Banking for the Netherlands: make a substantial contribution to welfare and prosperity as a leading cooperative and customer-oriented domestic bank
• Banking for Food: make a substantial contribution to feeding the world sustainably as a leader in Food & Agriin selected countriesStrategy
Make a substantial contribution to welfare and prosperity in the Netherlands
Make a substantial contribution to feeding the world sustainably
Vision
Mission
Banking for Food
Banking for the
Netherlands
1. Excellent customer
focus
2. Flexibility and balance sheet
reduction
3.Improving
performance

Investor Relations
Rabobank at a glance
6
Organisational changes support our strategy
Sept. 2017
A+/Positive/A-1
Aa2/Negative/P-1
AA-/Stable/F1+
AA/Stable/R-1(high)
Ratings unchanged and at a high level in 2017
• Successful implementation of new governance structure
• New top management structure (as of 1 September 2017) tohave all key customer segments represented at the executive level and to accelerate the digital transition of the bank
• Central Portfolio Management unit
• Centralising middle and back-office functions, whilst increasing focus on servicing clients
8.6 million customers
The Netherlands Worldwide
Market sharesin the Netherlands
7.4 million Dutch customers 1.2 million International customers
383 foreign places of business103 local banksWith 450 branchesAnd 1.9 million members
Mortgages Savings Food and Agri
21% 34% 84%

Investor Relations
Positive trend in customer satisfaction
7
Close proximity and excelling at key moments
• ‘Mortgage within a week’. Due to increased efficiency in the application process Rabobank is able to deliver on this promise
• Almost 40% of SME financing applications (< € 1mn) requested online. A.o. due to ‘SME financing in a day’ initiative
Moving towards excellent basic services
• Complement ‘high touch’ service proposition by creating a digital relationship for basic services
• Faster and more efficient service proposition through improved processes and products
24
45
19
52
11
38
June 14 Dec 14 June 15 Dec 15 June 16 Dec 16 June 17
NPS private banking customers
NPS retail customers
NPS business customers
Domestic net promotor scores (NPS)
1. Excellent customer
focus

Investor Relations
Digital Transformation & Innovation @ Rabobank
8
• April 2017: Mortgage insights and service in the mobile banking app
• July 2017: Send payment requests from mobile banking app
• Q4 2017: Full mobile identification process in account opening journey
• May 2017: Digital Identity Service provider with partner Signicat
• June 2017: Tellow – Administration and taxes for the self-employed
• Q4 2017: IBAN-Name check – for safe and secure payments
• Q4 2017: Digital Trade Chain – simplify trade through blockchain
We develop innovative services for our customers
We digitalise our traditional products & services
We support our customers in their innovation challenge• Jan 2017: First demo day food value chain Start-up Accelerator Terra
• 2017: Supporting 70+ Startup Hubs across the Netherlands
• May 2017: full roll-out Rabo & Co for alternative financing solutions
IBAN-Name check Payment request in WhatsApp
Invoices in TellowSmart contracts Digital Trade Chain
219K (7.1%) increase in adoption of mobile banking in H1 2017
66% increase in digital sales of insurances, H1
2017 vs H1 2016
>2.4M logins mobile banking app processed
on all time peak day June 2017
>4000 F&A clients and advisors joined Global
Farmers Platform since launch summer 2016

Investor Relations
Our balance sheet optimisation is on track
9
• Decreasing and more diversified annual funding programme
• Establishment of Rabobank’s Covered Bond programmeand inaugural € 2.5bn issuance in May 2017
• Rabobank participated in TLTRO
• Rabobank added Green Bonds to its funding mix and issued its inaugural € 500mn Green Bond in 2016
• Continue servicing clients is core of our strategy and will not be impacted by distribution
• Portfolio management transactions are used as a balance sheet management tool based on economic considerations
• Strong focus on ‘Steering on Origination’
• Extent and timing of balance sheet reduction depending on capital ratio development and future regulatory developments
• Continuous reduction of our CRE portfolio, pursued at viable economic terms
• To diversify the credit portfolio and to diversify funding Rabobank has sold mortgages to investors
Balance sheet reduction
Balance sheet flexibility
Strengtheningcapital base
Balance sheet optimisation
2. Flexibility and balance sheet
reduction
• Strongly increased H1 2017 net profit boosted retained earnings
• Risk sharing transaction on a € 3bn underlying corporate loan portfolio in July 2017, reducing RWAs
• Issuance of € 1.5bn Rabobank Certificates in January 2017
Funding diversification

Investor Relations
Rabobank is continuing to rationalise its business
10
Number of staff (in FTEs, incl. external hires)
3. Improving
performance
869
1,255
5,191
45,567
AthlonRealisedDec 15
52,013
Dec 16 2018 Forecast
38,500
PlannedJune 17
44,698
Realised
Staff reduction on-track
• Targeted reduction of 12,000 FTEs (excluding impact of Athlon sale) for the 2016-2018 period
• Total staff reduction target for the years 2016-2018 on schedule
• Headcount reduction of ~900 FTEs in H1 2017 (excluding ~1,300 FTEs of redundancies still in the resignation process)
• The total reduction is dampened by a temporary increase of staff as a result of the handling of ‘legacy files’
• Full year target of around 3,000 FTEs
• In 2016 a reduction of ~5,200 FTEs was realised

Investor Relations
The financial targets are set in the context of a more flexible and reduced balance sheet; ultimate reduction will be dependent on the final outcome of Basel IV
Rabobank has met its 2020 capital targets; on track with profitability and funding ambitions
11
Actuals June2016
Actuals Dec 2016
ActualsJune2017
Ambition2020
Capital
CET1 ratio 13.4% 14.0% 15.0% > 14%
Total capitalratio
23.5% 25.0% 25.5% > 25%
Profitability
ROIC 5.4% 5.2% 7.8% > 8%
C/I incl. reg. levies
76.6% 70.9% 67.6% 53%-54%
Funding & Liquidity
Wholesale funding
€ 201bn € 189bn € 171bn < € 150bn
• CET1 ratio further improved as a result of
• adding net profit to retained earnings
• € 1.6bn issue proceeds Rabobank Certificates in January 2017
• Fully-loaded CET1 ratio improved to 14.7%
• ROIC improving; underlying ROIC (8.9%) above target
• C/I ratio improving on the back of stable income generation and ongoing restructuring programme
• Wholesale funding came down due to a lower balance sheet total
Financial targets and realisation Achievements in H1 2017

Investor Relations
Topics
12
Update on strategy
H1 2017 results
Appendix:
• Rabobank: Dutch, cooperative and profitable
• Financial results
• Loan portfolio
• Capital, Funding & Liquidity
• Current & future developments

Investor Relations
Substantial increase in net profit
13
Profit & Loss account Main developments
• Net profit +52% to € 1.5bn driven by lower operating expenses and extreme low loan impairment losses
• Net interest income +2% despite low interest rate environment and gradually declining loan portfolio
• Net fee & commission income overall more or less stable (+1%)
• Other results decreased due to the deconsolidation of Athlon
• Operating expenses -12% due to reduced headcount and lower additions to provisions for future expenditures
in € mn H1 2016 H2 2016 H1 2017
Net interest income 4,375 4,368 4,454
Net fee & commission income 982 936 988
Other results 543 1,601 496
Total income 5,900 6,905 5,938
Operating expenses -4,276 -4,318 -3,755
Regulatory levies -246 -237 -258
Impairment Achmea 0 -700 0
Loan impairment charges -148 -162 67
Operating profit before tax 1,230 1,488 1,992
Tax -233 -461 -476
Net profit 997 1,027 1,516
Net profit (in € mn)
The H1 2016 and H2 2016 figures are including Athlon. The H1 2016 figures have been restated due to the early adoption of IFRS 9 re. fair value changes of issued debt instruments due to changes in the own credit spread.
1,516
1,027997
H1 2017H2 2016H1 2016
+52%

Investor Relations
Improved underlying performance
14
Main developments
• Underlying operating profit before tax +12% due to extremely low loan impairment charges
• Improvement driven by higher underlying results posted by Domestic Retail Banking and WRR
Underlying profit before tax (in € mn)
* Results on the fair value of issued debt instruments (structured notes) and hedge accounting. The H1 2016 figure has been restated due to the early adoption of IFRS 9 re. fair value changes of issued debt instruments due to changes in the own credit spread.
Exceptional items included in operating profit before tax
In € mn H1 2016 H2 2016 H1 2017
Athlon 83 278
Fair Value items * -190 295 -186
Derivatives Framework -514
Restructuring costs -190 -325 -98
Impairment Achmea -700
Total effect -811 -452 -2841,230
1,488
811452
284
1,992
H2 2016 H1 2017
2,276
+12%
1,940
Operating profit before tax
H1 2016
2,041 Exceptional items
Investor Relations
Underlying performance by business segment (I)
15
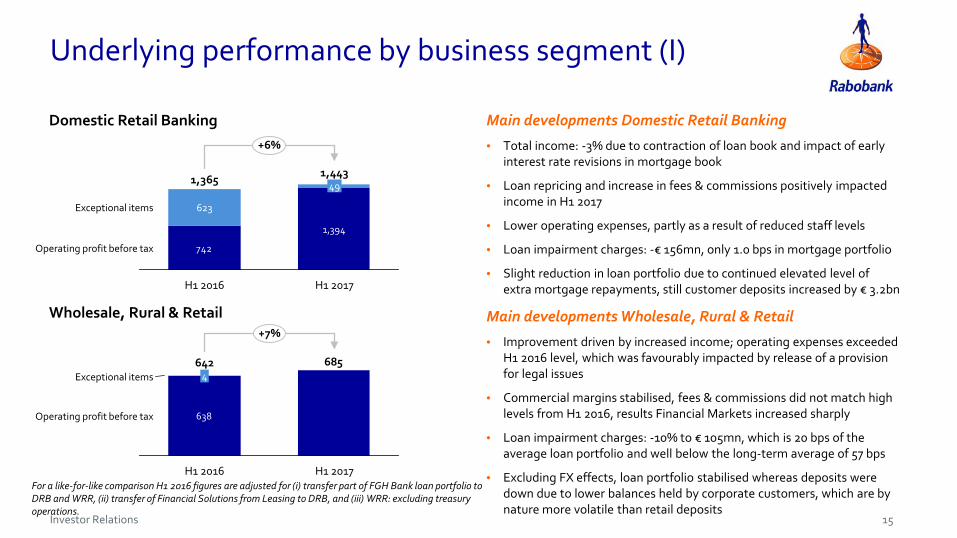
Domestic Retail Banking Main developments Domestic Retail Banking
• Total income: -3% due to contraction of loan book and impact of early interest rate revisions in mortgage book
• Loan repricing and increase in fees & commissions positively impacted income in H1 2017
• Lower operating expenses, partly as a result of reduced staff levels
• Loan impairment charges: -€ 156mn, only 1.0 bps in mortgage portfolio
• Slight reduction in loan portfolio due to continued elevated level of extra mortgage repayments, still customer deposits increased by € 3.2bn
Wholesale, Rural & Retail Main developments Wholesale, Rural & Retail
• Improvement driven by increased income; operating expenses exceeded H1 2016 level, which was favourably impacted by release of a provision for legal issues
• Commercial margins stabilised, fees & commissions did not match high levels from H1 2016, results Financial Markets increased sharply
• Loan impairment charges: -10% to € 105mn, which is 20 bps of the average loan portfolio and well below the long-term average of 57 bps
• Excluding FX effects, loan portfolio stabilised whereas deposits were down due to lower balances held by corporate customers, which are by nature more volatile than retail deposits
742
1,394
+6%
Operating profit before tax
H1 2017H1 2016
1,44349
623
1,365
Exceptional items
685
638
+7%
Operating profit before tax
Exceptional items
H1 2017H1 2016
6424
For a like-for-like comparison H1 2016 figures are adjusted for (i) transfer part of FGH Bank loan portfolio to DRB and WRR, (ii) transfer of Financial Solutions from Leasing to DRB, and (iii) WRR: excluding treasury operations.

Investor Relations
Underlying performance by business segment (II)
16
Leasing
Real Estate
Main developments Leasing
• Athlon was sold in Dec 2016, Financial Solutions transferred to Domestic Retail Banking in H1 2017, full focus now on vendor finance
• Underlying total income increased
• Higher operating expenses due to business growth, as well as finalisation of sale of Athlon and transfer of Financial Solutions to Rabobank
• Stable low loan impairment charges (26 bps), well below long-term average
• Excluding FX effects vendor lease portfolio increased by 4%
Main developments Real Estate
• Includes FGH Bank (non-core portfolio and core assets to be transferred to Rabo Real Estate Finance), area developer BPD and investment management subsidiary Bouwfonds IM, total loan portfolio € 5.8bn
• Lower average loan portfolio contributed to lower underlying profit
• BPD benefited from favourable development in Dutch housing market
• Loan impairment charges further decreased to -€ 43mn from -€ 11mn
342249
-86
256
-5%
Operating profit before tax
Exceptional items
H1 2017
244
-5
H1 2016
126 116
H1 2017
Operating profit before tax
Exceptional items4
120139
13
-14%
H1 2016For a like-for-like comparison H1 2016 figures are adjusted for (i) transfer part of FGH Bank loan portfolio to DRB and WRR, and (ii) transfer of Financial Solutions from Leasing to DRB.

Investor Relations
Resilient total income
17
Main developments
• Total income (as reported) stable at € 5.9bn (+1%) despite the deconsolidation of Athlon
• Underlying total income +3% to € 6.1bn
• Net interest income +2% to € 4.5bn despite low interest rate environment and gradually declining loan portfolio
• Net fee & commission income overall more or less stable (+1%):
• Domestic Retail Banking: higher fees on payment accounts
• WRR: could not match H1 2016, when their Financial Markets division benefited from a very high number of deals
• Real Estate: higher fees at Bouwfonds IM
• Other results (as reported) -9% due to deconsolidation of Athlon. Corrected for Athlon and Fair Value items, underlying other results increased by 24% due to:
• WRR: sharp increase in results of their Financial Markets division due to improved market conditions
• Higher results on our investment in Achmea
Total income (in € mn)
4,375
936982
4,454
550
355
4,368
951
988
682
295
183
-190 -186
H2 2016H1 2016
5,900 5,938
6,1246,255
6,905
5,907
Net interest income
Other results excl. FV items
Athlon
FV itemsH1 2017
Net fee and commission income
Investor Relations
Net interest income development
NIM 12m-rolling average
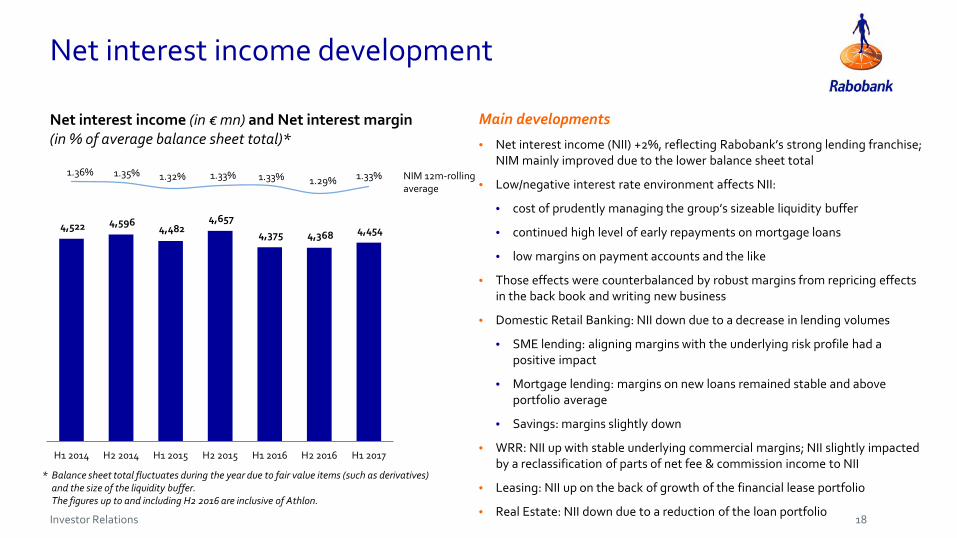
4,522 4,596 4,482
4,657
4,375 4,368 4,454
1.36% 1.35% 1.32% 1.33% 1.33% 1.29% 1.33%
H1 2014 H2 2014 H1 2015 H2 2015 H1 2016 H2 2016 H1 2017
Main developments
• Net interest income (NII) +2%, reflecting Rabobank’s strong lending franchise; NIM mainly improved due to the lower balance sheet total
• Low/negative interest rate environment affects NII:
• cost of prudently managing the group’s sizeable liquidity buffer
• continued high level of early repayments on mortgage loans
• low margins on payment accounts and the like
• Those effects were counterbalanced by robust margins from repricing effects in the back book and writing new business
• Domestic Retail Banking: NII down due to a decrease in lending volumes
• SME lending: aligning margins with the underlying risk profile had a positive impact
• Mortgage lending: margins on new loans remained stable and above portfolio average
• Savings: margins slightly down
• WRR: NII up with stable underlying commercial margins; NII slightly impacted by a reclassification of parts of net fee & commission income to NII
• Leasing: NII up on the back of growth of the financial lease portfolio
• Real Estate: NII down due to a reduction of the loan portfolio
* Balance sheet total fluctuates during the year due to fair value items (such as derivatives) and the size of the liquidity buffer. The figures up to and including H2 2016 are inclusive of Athlon.
Net interest income (in € mn) and Net interest margin(in % of average balance sheet total)*
NIM 12m-rolling average
18

Investor Relations
Staff costs trending down as a result of restructuringprogramme
19
Operating expenses (in € mn) Development of (underlying) operating expenses
• Operating expenses (as reported) declined by € 521mn or 12%
• Staff costs on a downward trend in line with headcount reduction
• Underlying total operating expenses were higher than in H1 2016 due to:
• Total operating expenses in H1 2016 were positively impacted by:
• release of a provision for employee benefits
• release of a provision for legal issues at WRR
• Higher costs re. pension guarantee in H1 2017
• Corrected for these non-recurring items, underlying total operating expenses decreased by 2% compared to H1 2016
Development cost/income ratio incl. regulatory levies
H1 2016 H2 2016 H1 2017
C/I ratio 76.6% 66.0% 67.6%
Underlying C/I ratio 63.0% 66.4% 63.9%
2,264 2,257 2,136
1,2251,659
1,521
325
190
5143,755
3,6573,916
4,318
83
77
H1 2016
4,276
3,489
Staff costs
Other Opex
Athlon
Restructuring
H1 2017
98
H2 2016
DerivativesFramework

Investor Relations
Asset quality further improved: extremely low loan impairment charges
20
All segments benefit from benign economic environment
• LIC turned negative as the release of previously taken provisions exceeded new additions to the loan impairment allowance
• LIC stood at -€ 67mn or -3 bps of average lending• 10-year average LIC: 36 bps of average lending• Limited or even negative LIC in all business segments• Domestic residential mortgage portfolio continues to perform well with
LIC at 1.0 bps• Third consecutive half year of negative LIC in Real Estate confirming
Rabobank’s prudent provisioning policy
Loan impairment charges (LIC)(in € mn and in bps of average lending)
148 162
H2 2016
-67
-145%
H1 2017H1 2016
-3 bps7 bps 7 bps
In € mn H1 2016 H2 2016 H1 2017
Allowance (opening balance) 8,478 8,085 7,542
Write-off -706 -842 -614
Net increase 224 243 -10
Other 91 54 -16
Allowance (closing balance) 8,085 7,542 6,902
Received after write-off -76 -81 -57
LIC 148 162 -67
117105
4141
-43
12
-156
WRR
Domestic Retail
Leasing
-15 Other
Real Estate
-11-11
Investor Relations
Non performing loans on a downward trend
21
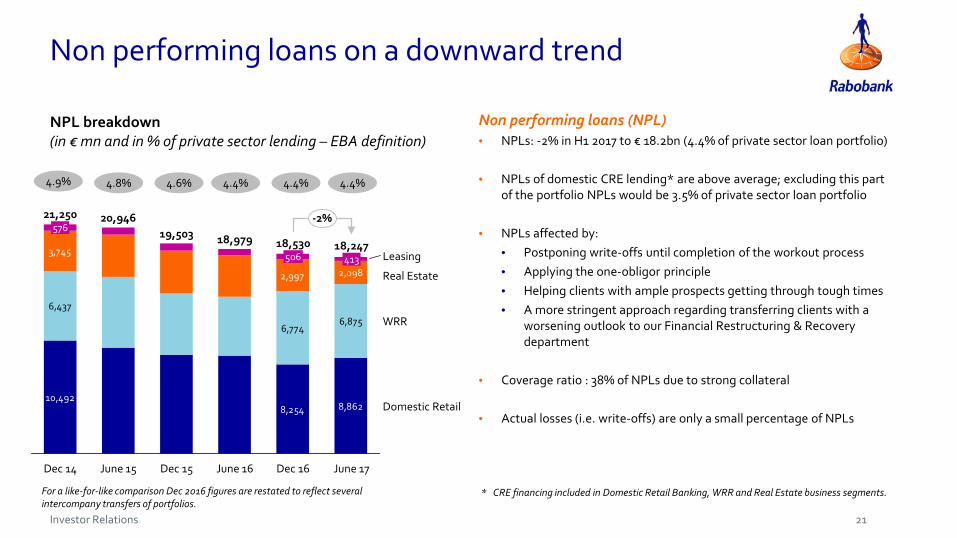
NPL breakdown(in € mn and in % of private sector lending – EBA definition)
10,4928,254 8,862
6,437
6,7746,875
3,745
2,997 2,098
-2%
Domestic Retail
WRR
21,250576
506
June 16
18,979
Dec 15
19,503
June 15
20,946
Dec 14
Real Estate
Leasing
June 17
18,247413
Dec 16
18,530
4.4%4.4% 4.4%4.6%4.8%4.9%
* CRE financing included in Domestic Retail Banking, WRR and Real Estate business segments.
Non performing loans (NPL)• NPLs: -2% in H1 2017 to € 18.2bn (4.4% of private sector loan portfolio)
• NPLs of domestic CRE lending* are above average; excluding this part of the portfolio NPLs would be 3.5% of private sector loan portfolio
• NPLs affected by: • Postponing write-offs until completion of the workout process• Applying the one-obligor principle• Helping clients with ample prospects getting through tough times• A more stringent approach regarding transferring clients with a
worsening outlook to our Financial Restructuring & Recovery department
• Coverage ratio : 38% of NPLs due to strong collateral
• Actual losses (i.e. write-offs) are only a small percentage of NPLs
For a like-for-like comparison Dec 2016 figures are restated to reflect several intercompany transfers of portfolios.

Investor Relations
Stable loan portfolio with focus on the Netherlands
22
196 194
24 23
28 28
41 40
108 104
28 28
Dec 16
425
Dec 15
426
Dec 14
429
-2%
Domestic Retail mortgages
Domestic commercial real estate *
Domestic Retail F&A
Other Domestic Retail SMEs
WRR
Leasing
June 17
418
Loan portfolio composition
• Loan portfolio decreased by € 6.8bn, largely due to FX effects (~€ 5bn):
• Domestic residential mortgages portfolio slightly down to € 194.5bn due to high early repayments
• Domestic Retail F&A lending almost stable at € 27.8bn
• Domestic Retail SME lending slightly down to € 40.3bn
• WRR portfolio down, but stable excluding FX effects:
• Wholesale: € 65.7bn
• Rural & Retail: € 38.6bn
• Leasing: stable loan portfolio of € 27.5bn
• Domestic CRE lending* further down in line with strategy
• 72% of private sector loan portfolio outstanding in the Netherlands
• 48% of loan exposure to private individuals, 28% to trade, industry & services and 24% to F&A
Development of the loan portfolio (in € bn)
For a like-for-like comparison Dec 2016 figures are restated to reflect several intercompany transfers of portfolios..
* CRE financing included in Domestic Retail Banking, WRR and Real Estate business segments.

Investor Relations
Deposits from customers and LtD ratio
23
Deposits from customers and private sector lending (in € bn)
1.32 1.25 LtD ratio1.22
425426429418
227223
3131
8593
3431
3481
Lending
Domestic Retail
Rabo Direct
WRR
Other346
327
Dec 14 Dec 15 Dec 16 June 17
1.22
Main developments
• Deposits from customers decreased by € 4.5bn:
• Domestic Retail Banking: +€ 3.2bn as the balance of holiday pay being credited to clients’ accounts and despite high early repayments on mortgage loans
• WRR: -€ 7.6bn as a result of FX effects (~ -€ 2.5bn) and lower balances held by corporate customers, which are by nature more volatile than retail deposits
• Loan-to-deposit ratio stable at 1.22
• Due to the narrowing of the funding gap and a lower balance sheet total, wholesale funding needs declined by € 18bn to € 171bn

Investor Relations
Solid growth of common equity tier 1 ratio
24
• Transitional CET1 ratio: 15.0%
• Fully loaded CET1 ratio: 14.7%
• CRD IV impact 1 January 2017: -0.3%-points
• Impact of new Rabobank Certificates issuance (January 2017) +0.8%-point
Main developments
• Rabobank 2017 CET1 requirement is 9%. In 2019 the fully loaded CET1 requirement and MDA trigger is expected to increase to 11.75% due to the phasing in of the CCB and SRB
• Rabobank continues to be committed to a (fully loaded) CET1 ratio of >14% and a total capital ratio of >25% by 2020, subject to changing regulatory requirements
• The 30 June 2017 buffer to 2017 requirements is 6%-points and to the fully phased in requirements (2019) 3.25%-points (€ 6.7bn)
• Rabobank’s distributable items amounted to € 25.5bn as at 30 June 2017
Targets and regulatory requirements
Transitional CET1 development
Fully loaded CET1 development
14.0%15.0%0.8% 0.4% 0.1%
0.3%
2016 CRD IV phase in2017
RabobankCertificates
Issuance
Profit minusdistributions
Other H1 2017
>14%0.8% 0.5%
2014 2015 2016 RabobankCertificates
issuance
Profit, RWAchange and
other
H1 2017 Target 2020
11.8% 12.0%13.5% 14.7%

Investor Relations
13.6% 13.5% 14.0% 15.0%
2.4% 2.9%3.6% 3.1%
2.0%
5.3%6.8%
7.4% 7.4%
0.0%2014 2015 2016 H1 2017 Target 2020
23.2%25.0%
>14%
25.5%
21.3%
>25.0%
Rabobank already meets the > 25% total capital target
25
• Since 2012, high capital ratios are targeted to protect senior bond holders against the (unlikely) event of a bail-in
• Rabobank adjusted its target Additional Tier 1 layer to roughly 2% (from 3.5%) with the issuance of Rabobank Certificates. This will further optimise the capital stack
• More guidance on MREL is expected end of 2017 / early 2018. Once the EC creditor hierarchy proposal is adopted and implemented in the Netherlands, Rabobank could opt to issue non-preferred senior debt to meet MREL requirements
• Transitional ratios as at 30 June 2017:
• Tier 1 ratio 18.1%
• Total capital ratio 25.5%
• Leverage ratio 5.8%
Capital structure(in % of RWA)
Highlights
CET1
AT1
Tier 2

Investor Relations
Funding strategy: diversification in combination with lower needs
• Rabobank funding target for 2017 has been set at € 15bn, subject to balance sheet developments
• A total amount of ~€ 10bn has been raised in H1 2017, including TLTRO participation and the Covered Bond issuance
• In the coming years, Rabobank will focus on further optimising its wholesale funding base
Funding target• Diversified wholesale funding mix achieved by using different markets,
maturities, currencies and products
• Strategic considerations are key in Rabobank’s global funding markets’ activity
• Rabobank successfully issued its inaugural Covered Bond in 2017
• Continued commitment towards (unsecured) strategic and liquid benchmark curve
Funding strategy: global market approach
Investor base further diversified (in € bn)
26
Rabobank from net positive to net negative issuer (in € bn)
0
10
20
30
2012 2013 2014 2015 2016 2017 (Aug)
Senior Green Covered TLTRO
-20
-10
0
10
20
302009 2010 2011 2012 2013 2014 2015 2016 2017*
* Assuming € 15bn target funding programme in 2017

Investor Relations
Rabobank successfully issued its first Covered Bond
27
• Fully compliant with EBA ‘best practices’
• The programme is registered with the Dutch Central Bank (DNB)
• Strong Dutch legal framework and favourable regulatory treatment
Characteristics• Diversification of funding sources and access to a broader
investor base
• Covered Bonds provide economically attractive funding
• Opportunity to attract funding that matches long duration assets
• Increased capital buffers and low asset encumberance give sufficient comfort to senior unsecured bondholders
Rationale
• In May 2017, Rabobank issued its inaugural Covered Bond under the Covered Bond Programme
• After an extensive roadshow, Rabobank successfully priced a € 2.5bn dual tranche note split over € 1.5bn 7y at 0.250% and € 1bn 15y at 1.250%
• Rabobank plans to issue 1 to 2 Covered Bonds benchmarks per annum, next to private placement opportunities
Inaugural Covered Bond issuance
Rabobank Covered Bond Programme Overview
Issuer Coöperatieve Rabobank U.A. (Rabobank)
Programme Size € 25bn
Format Soft Bullet
Extension Period 12 months
Rating Aaa (Moody’s)
Currency Multi currency
Guarantor Rabo Covered Bond Company B.V.
Collateral Prime Dutch residential mortgage loans
Asset Percentage 100%
Indexed LTV Cut Off 80%
Governing Law Dutch law
Regulatory OC 5%

Investor Relations
Topics
Update on strategy
H1 2017 results
Appendix:
• Rabobank: Dutch and cooperative
• Financial results
• Loan portfolio
• Capital, Funding & Liquidity
• Current & future developments
28

Investor Relations
Dutch economy shows continued strong recovery
Key figures Dutch economy (Dec. 2017) Key figures Dutch economy
• Population 17mn
• GDP € 703bn
• GDP per capita 3rd in the EU, 13th in the world
• Household savings deposits € 414bn
• Pension funds assets € 1,409bn
• Household gross mortgage debt € 664bn
Economic Outlook
• The Netherlands is currently experiencing a strong economic recovery
• Rapidly declining unemployment rate
• Private consumption rises because of higher disposable income and high consumer confidence
• Record growth of the housing market
• Inflation will increase in 2017
• Trump and Brexit remain a risk
Year-on-year change (%) Actual 2016 Forecast 2017 Forecast 2018
Gross Domestic Product 2.1 3.2 2.8
Private consumption 1.5 2.3 2.5
Government spending 1.0 0.4 3.8
Private investment 6.5 8.0 4.7
Exports 4.1 5.7 4.6
Imports 3.9 5.3 5.2
Inflation 0.1 1.3 1.8
Unemployment 6.0 4.9 4.2
Government budget (% GDP) 0.4 0.6 0.4
Government debt (% GDP) 61.8 57.2 53.8
29

Investor Relations
NL Rest of Europe Rest of world
Ratings unchanged and at a high level in H1 2017
AA/Aa2
BB/Ba2
A-/A3
* Source: Rabobank analysisGraph based on the average rating score assigned by Fitch, Moody’s and S&P (July 2017) of the world’s 60 largest commercial banks (source: the Banker, July 2017), plus major Dutch banks.
June 2016 Dec 2016 Sept. 2017
A+/Stable/A-1 A+/Stable/A-1 A+/Positive/A-1
Aa2/Stable/P-1 Aa2/Negative/P-1 Aa2/Negative/P-1
AA-/Stable/F1+ AA-/Stable/F1+ AA-/Stable/F1+
AA/Stable/R-1(high) AA/Stable/R-1(high) AA/Stable/R-1(high)
30

Investor Relations
Dutch housing market benefits from favourable market conditions
Housing price index and number of transactions • Housing Price Index: 99.6 (June 2017) compared to 105.5 (June 2008) (2010=100)
• Sales grew by 23% in H1 2017 compared to H1 2016, leading to a record number of transactions
• Prices are expected to rise by 7.6% in 2017 (5.0% in 2016)
• Owner occupation 59%, comparable to surrounding EU countries
• Although house prices increase and lending criteria are strict, houses remain affordable, due to the low interest rates. Nevertheless the affordability is worsening for first-time buyers
• Strong underlying fundamentals Dutch housing and mortgage market:
• Increasing number of households
• Housing shortage, especially in the non-regulated rental segment where rent levels are rising quickly
• Limited land available for housing and limited new production
• Favourable tax regime: interest paid on mortgage loans, taken out for owner-occupied houses, is income tax deductible. This has induced borrowers to take out high mortgage loans
• Strict mandatory underwriting criteria and strong legal system mitigate credit risks
• Interest rates are very low
31
40
60
80
100
120
50
100
150
200
250
2003 2005 2007 2009 2011 2013 2015 2017
Sales, 12-month total (l) Housing price index (r)
x 1,000index (2010=100)

Investor Relations
National Mortgage Guarantee contributes to the strength of the Dutch mortgage market
32
About the fund• Offers protection to both lender and borrower in the event the borrower is left with residual debt
• Benefits from a back-stop government guarantee
• Triple A rated by Fitch and Moody’s
• Underwriting criteria:
• Maximum house price € 245.000 and maximum LTV 101% (as from 2018: 100%)
• Affordability criteria (max. ratio of loan expenses-to-income) are comparable to the criteria for non-NHG loans (as defined in Dutch law)
Specifically for borrowers• Residual debt will in principle be forgiven
• Lower interest rate
• Borrowers pay a one-off guarantee fee of 1% of the mortgage loan
Specifically for mortgage lenders• Due to the credit cover by the fund, capital requirements are lower
• Extensive cover: not only residual debt, but also interest arrears and disposal costs
• For mortgage loans originated after 1 Jan 2014 the lender will participate for 10% in any loss claims made under the NHG Guarantee
• 20.5% of Rabobank’s mortgage portfolio benefits from National Mortgage Guarantee (NHG)

Investor Relations
Sustainability is incorporated in Rabobank’s DNAWHY we do it
• To put the common interest of individuals and society first
• To be a driving, innovative force that contributes to sustainable growth in wealth and well-being
• To accommodate the current and future ambitions of individuals and society
33
HOW we do it
• Active dialogues with clients about making their business processes and living and working environment more sustainable
• Achieving sustainable development: financial support, advice, connecting clients (helping them to make a positive impact on society)
• Integrate sustainability into our day-to-day work and communicate transparently on our views and activities
WHAT we do - some examples
• Total sustainable financing: € 18.8bn (Dec 2016)
• Total sustainable assets under management and assets in custody: € 3.8bn (Dec 2016)
• First successful issuance of € 500mn Green Bond to institutional investors (Oct 2016)
• Rabobank has committed itself to 100 circular action plans with entrepreneurs in 2017
Sustainability ratings - Rankings
91 points (7th position in 2016)
85 pointsIndustry Leader
The majority of the subjects has a “sufficient” – “good”score (2016)

Investor Relations
Topics
Update on strategy
H1 2017 results
Appendix:
• Rabobank: Dutch, cooperative and profitable
• Financial results
• Loan portfolio
• Capital, Funding & Liquidity
• Current & future developments
34
Investor Relations
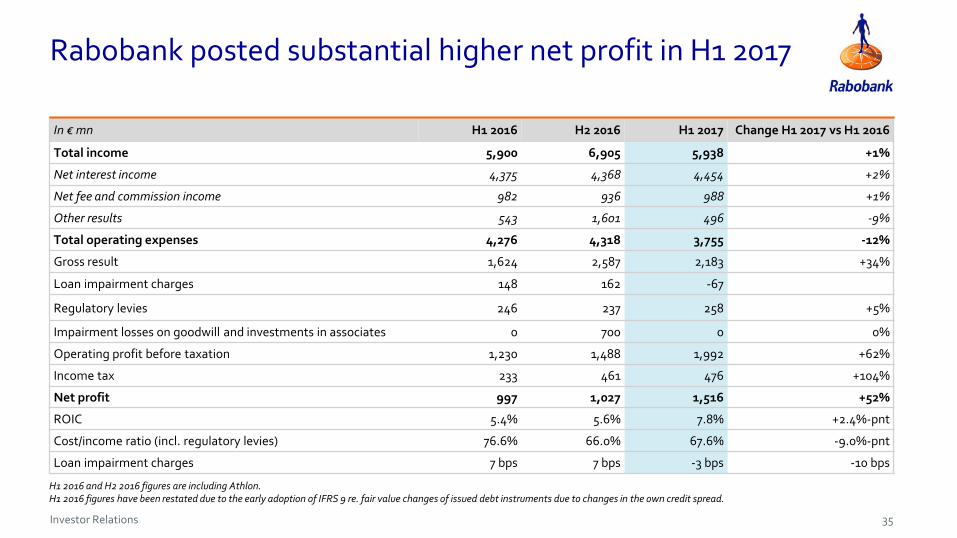
Rabobank posted substantial higher net profit in H1 2017
In € mn H1 2016 H2 2016 H1 2017 Change H1 2017 vs H1 2016
Total income 5,900 6,905 5,938 +1%
Net interest income 4,375 4,368 4,454 +2%
Net fee and commission income 982 936 988 +1%
Other results 543 1,601 496 -9%
Total operating expenses 4,276 4,318 3,755 -12%
Gross result 1,624 2,587 2,183 +34%
Loan impairment charges 148 162 -67
Regulatory levies 246 237 258 +5%
Impairment losses on goodwill and investments in associates 0 700 0 0%
Operating profit before taxation 1,230 1,488 1,992 +62%
Income tax 233 461 476 +104%
Net profit 997 1,027 1,516 +52%
ROIC 5.4% 5.6% 7.8% +2.4%-pnt
Cost/income ratio (incl. regulatory levies) 76.6% 66.0% 67.6% -9.0%-pnt
Loan impairment charges 7 bps 7 bps -3 bps -10 bps
35
H1 2016 and H2 2016 figures are including Athlon. H1 2016 figures have been restated due to the early adoption of IFRS 9 re. fair value changes of issued debt instruments due to changes in the own credit spread.

Investor Relations
Topics
Update on strategy
H1 2017 results
Appendix:
• Rabobank: Dutch, cooperative and profitable
• Financial results
• Loan portfolio
• Capital, Funding & Liquidity
• Current & future developments
36

Investor Relations
Balance sheet total trending down
In € mn Dec 2016 June 2017
Assets Loans (incl. public sector) 452,807 440,971
Cash 84,405 71,809
Banks 25,444 26,184
Securities 38,486 33,978
Derivatives 42,372 29,856
Other 19,079 20,399
Total Assets 662,593 623,197
Equity & liabilities Equity 40,524 40,314
Deposits from customers 347,712 343,180
Long-term issued debt 145,092 137,185
Short-term issued debt 45,795 38,403
Banks 22,006 20,793
Derivatives 48,024 32,911
Other 13,440 10,411
Total equity & liabilities 662,593 623,197
Encumbered assets According to EBA guidelines 9% 11%
37

Investor Relations
Group private sector loan portfolio € 417.8bn
Diversified loan portfolio with focus on the Netherlands
Group private sector loan portfolio by business segments
** Includes Domestic Retail Banking, WRR and the Real Estate segments’ exposure to CRE.
In € bn Dec 2016 June 2017 change
Group total 424.6 417.8 -2%
• Domestic Retail Banking 282.4 279.7 -1%
• WRR 108.1 104.3 -4%
- Domestic Wholesale 17.2 17.2 0%
- International Wholesale 51.3 48.5 -6%
- International Rural & Retail 39.6 38.6 -3%
• Leasing 27.6 27.5 -0%
- Domestic 1.0 1.0 0%
- International 26.6 26.5 -0.4%
• Real Estate 6.0 5.8 -3%
• Other 0.5 0.5 0%
Dec 2016 figures restated to reflect several intercompany transfers of portfolios.
38
Domestic commercial real estate **
5%
Domestic retail mortgages
47%Domestic retail F&A
7%
Other domestic retail SMEs
10%
WRR25%
Leasing6%

Investor Relations
Rabobank largest financier of the Dutch economy
Domestic private sector portfolio € 304.2bn(72% of Group loan portfolio)In € bn Dec 2016 June 2017 change
Total Domestic lending 307.1 304.2 -1%
• Mortgages 195.9 194.5 -1%
• Food & agri retail 27.8 27.5 -1%
• Commercial real estate* 23.8 23.2 -2%
• Other SMEs 40.9 40.3 -1%
• Wholesale 17.2 17.2 0%
• Leasing 1.0 1.0 0%
• Other 0.5 0.5 0%
Domestic lending by client category
Dec 2016 figures restated to reflect several intercompany transfers of portfolios.
39
Mortgages64%
Food & agri retail9%
CRE *8%
Other SMEs13%
Wholesale6%
Leasing0.3%
* CRE financing included in Domestic Retail Banking, WRR and Real Estate business segments.
Investor Relations
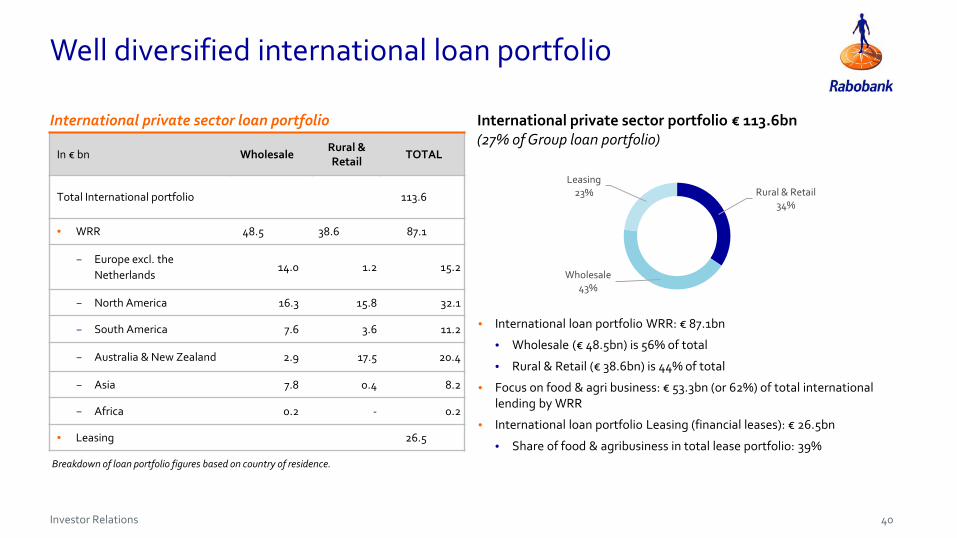
Well diversified international loan portfolio
International private sector loan portfolio
• International loan portfolio WRR: € 87.1bn
• Wholesale (€ 48.5bn) is 56% of total
• Rural & Retail (€ 38.6bn) is 44% of total
• Focus on food & agri business: € 53.3bn (or 62%) of total international lending by WRR
• International loan portfolio Leasing (financial leases): € 26.5bn
• Share of food & agribusiness in total lease portfolio: 39%Breakdown of loan portfolio figures based on country of residence.
In € bn WholesaleRural & Retail
TOTAL
Total International portfolio 113.6
• WRR 48.5 38.6 87.1
− Europe excl. the Netherlands
14.0 1.2 15.2
− North America 16.3 15.8 32.1
− South America 7.6 3.6 11.2
− Australia & New Zealand 2.9 17.5 20.4
− Asia 7.8 0.4 8.2
− Africa 0.2 - 0.2
• Leasing 26.5
International private sector portfolio € 113.6bn (27% of Group loan portfolio)
40
Rural & Retail34%
Wholesale43%
Leasing23%

Investor Relations
Loan quality further improved
41
Loans, NPLs and allowances
Real Estate
Domestic SMEs 19%
48%
1%
Leasing 6%
WRR 25%
9%
1%
36%
2%
7%
22%
61%
33%
34%
45%
Lending in % of total private sector loan portfolio
Non-performing loans in % of loans
Total Rabobank: 4.4%
Allowance in % of NPLs
Total Rabobank: 38%
Domestic private individuals
In € mn Dec 2016 % of loans June 2017 % of loansNon-performing loans (NPLs)
Domestic Retail Banking 8,254 2.9% 8,862 3.2%
WRR 6,744 6.2% 6,875 6.6%
Leasing 506 1.8% 413 1.5%
Real Estate 2,997 29.6% 2,098 35.6%
Total Rabobank 18,530 4.4% 18,247 4.4%
% of NPL % of NPL
AllowancesDomestic Retail Banking & Other 3,261 40% 2,843 32%
WRR 3,089 46% 3,120 45%
Leasing 318 63% 252 61%
Real Estate 874 29% 686 33%
Total Rabobank 7,542 41% 6,902 38%
H1 2016 H1 2017
LICDomestic Retail Banking & Other 1 1 bps -171 -11 bps
WRR 117 23 bps 105 20 bps
Leasing 41 27 bps 41 26 bps
Real Estate -11 -25 bps -43 -97 bps
Total Rabobank 148 7 bps -67 -3 bps
NPLs, allowances and Loan impairment charges (LIC)

Investor Relations
Consistently strong performing domestic residential mortgage portfolio (I)
In € mn June 2016 Dec 2016 June 2017 Change Dec 16 – Jun 17
Loans 199,420 195,909 194,483 -1%
Non-performing loans 1,930 1,526 1,293 -15%
− in % of loans 0.97% 0.78% 0.67% -0.11%-pnt
Allowance 275 227 196 -14%
− in % of non-performing loans 14% 15% 15% +0%-pnt
H1 2016 H2 2016 H1 2017 Change H1 2016 – H1 2017
Loan impairment charges 13 -4 10 -23%
In basis points 1.3 bps -0.8 bps 1.0 bps -0.3 bps
42

Investor Relations
100% 0.36% 0.16% 0.01%Number of
mortgage clients1.1 million
>90 days past due in recovery procedure auction sales
Consistently strong performing domestic residential mortgage portfolio (II)
• Low loan impairment charges: 1.0 bps
• Average loan-to-value ratio: 71%
• National Mortgage Guarantee (NHG): 20.5% of mortgage portfolio
• 95% of portfolio has (predominantly long-term) fixed interest rates
• Number of delinquencies and foreclosures remains very low
• Banks are in a preferential position to enforce the liquidation of collateral
• Bank has full recourse to the borrower
Delinquencies, recovery procedure and auction sales H1 2017 in % of total number of domestic mortgages
Contractual fixed interest rate period Rabobank mortgages
43
>10 years30%
6-10 years49%
4-5 years10%
2-3 years2%
fixed <1yr4%
variable5%

Investor Relations
Loan-to-value mortgage portfolio
LTV domestic residential mortgage portfolio • Average LTV portfolio June 2017: 71%
• Prudent underwriting standards, including a Loan expenses-to-income ratio, and active risk monitoring are the most important factors determining the risks in Rabobank’s mortgage portfolio
• LTV figures do not take into account:
• free savings accounts of the borrower
• securities and other assets of the borrower
• To cover premature death risk, the majority of clients have taken out a life insurance, pledged to the bank
• Some clients have taken out an insurance to cover unemployment risk
• An LTV>100% does not mean that the loan in question is non-performing. As long as the borrower is able to meet debt service, the collateral value is less of an issue
Loan-to-value* NHG Guaranteed Other Total
0%-50% 2.1% 22.4% 24.5%
50%-60% 1.3% 9.3% 10.6%
60%-70% 1.9% 9.9% 11.8%
70%-80% 2.7% 9.3% 12.0%
80%-90% 4.0% 9.7% 13.7%
90%-100% 4.4% 7.8% 12.2%
100%-110% 2.6% 5.0% 7.6%
110%-120% 0.9% 2.5% 3.4%
>120% 0.6% 3.6% 4.2%
20.5% 79.5% 100.0%
Loan-to-value (LTV) is not the sole determinant of loan quality
44
Valuation of collateral based on price data provided by Calcasa, which are more granular than the data previously provided by the Central Statistical Office.

Investor Relations
Well diversified business lending
Well diversified business lending• Subsectors
• Geography
• Links in the food supply chain
F&A portfolio• € 100.2bn (-2%), 24% of total Group loan portfolio, of which:
• Domestic retail SMEs: € 27.5bn
• WRR: € 63.0bn
• Leasing: € 9.8bn
• Domestic primary F&A market share around 84%
Non-F&A portfolio• € 117.9bn (-3%), 28% of total Group loan portfolio, of which:
• Domestic retail SMEs: € 55.2bn
• WRR: € 39.1bn
• Leasing: € 17.2bn
• Mainly SME lending
Group F&A portfolio € 100.2bn
Group non-F&A portfolio € 117.9bn
45
Animal protein16%
Grains & oilseeds20%
Dairy22%
Fruit & veg10%
Farm inputs10%
Food retail & foodservice
5%
Beverages3%
Sugar3%
Flowers1%
Various crops1%
Other9%
Lessors of real estate
15%Finance &
insurance (except banks)
10%Trade
9%Professional, scientific and
technical services8%
Manufacturing8%
Activities related to real estate
6%
Transport and warehousing
6%
Health care5%
Construction4%
Retail non-food4%
Other25%
Investor Relations
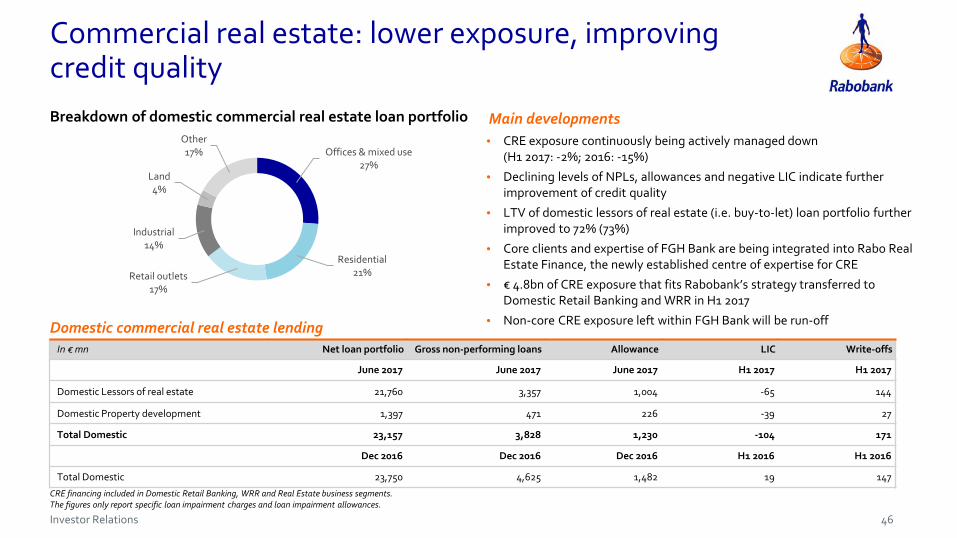
Commercial real estate: lower exposure, improving credit quality
• CRE exposure continuously being actively managed down (H1 2017: -2%; 2016: -15%)
• Declining levels of NPLs, allowances and negative LIC indicate further improvement of credit quality
• LTV of domestic lessors of real estate (i.e. buy-to-let) loan portfolio further improved to 72% (73%)
• Core clients and expertise of FGH Bank are being integrated into Rabo Real Estate Finance, the newly established centre of expertise for CRE
• € 4.8bn of CRE exposure that fits Rabobank’s strategy transferred to Domestic Retail Banking and WRR in H1 2017
• Non-core CRE exposure left within FGH Bank will be run-off
Breakdown of domestic commercial real estate loan portfolio
In € mn Net loan portfolio Gross non-performing loans Allowance LIC Write-offs
June 2017 June 2017 June 2017 H1 2017 H1 2017
Domestic Lessors of real estate 21,760 3,357 1,004 -65 144
Domestic Property development 1,397 471 226 -39 27
Total Domestic 23,157 3,828 1,230 -104 171
Dec 2016 Dec 2016 Dec 2016 H1 2016 H1 2016
Total Domestic 23,750 4,625 1,482 19 147
Domestic commercial real estate lending
CRE financing included in Domestic Retail Banking, WRR and Real Estate business segments.The figures only report specific loan impairment charges and loan impairment allowances.
46
Offices & mixed use27%
Residential21%Retail outlets
17%
Industrial14%
Land4%
Other 17%
Main developments

Investor Relations
Topics
Update on strategy
H1 2017 results
Appendix:
• Rabobank: Dutch, cooperative and profitable
• Financial results
• Loan portfolio
• Capital, Funding & Liquidity
• Current & future developments
47

Investor Relations
Phasing in of CCB and split of Pillar 2 lowered CET1 requirement in 2017
• Rabobank 2017 CET1 requirement is built up as follows:
• 4.5% Pillar 1 (P1)
• 1.75% Pillar 2 Requirement (P2R)
• 1.25% Capital Conservation Buffer (CCB)
• 1.5% Systemic Risk Buffer (SRB)
• In 2019 the fully loaded CET1 requirement and MDA trigger is expected to be at 11.75% due to the phasing in of the CCB and SRB
• The undisclosed Pillar 2 Guidance (P2G) is not directly binding and not relevant for the MDA trigger
2017 SREP requirement (in %) 9% CET1 requirement in 2017
• Rabobank remains committed to its >14% CET1 target (on a fully loaded basis)
• Current transitional CET1 ratio of 15.0% implies a buffer of 6%-points (€ 12.4bn) over 2017 minimum CET1 requirements
Targets
48
4.5% 4.5%
15.0%
2017requirement
Expected fullyphased in
requirement2019
Rabobank CET1ratio H1 2017(transitional)
Rabobanktarget 2020
11.75%
9%
1.5%
3%
2.5%1.25%
1.75%1.75%
>14%
P1
CCB
SRB
P2R

Investor Relations
Solid growth of common equity tier 1 ratio
49
• Transitional CET1 ratio: 15.0%
• Fully loaded CET1 ratio: 14.7%
• CRD IV impact 1 January 2017: -0.3%-points
• Impact of new Rabobank Certificates issuance (January 2017) +0.8%-point
Main developments
• Rabobank 2017 CET1 requirement is 9%. In 2019 the fully loaded CET1 requirement and MDA trigger is expected to increase to 11.75% due to the phasing in of the CCB and SRB
• Rabobank continues to be committed to a (fully loaded) CET1 ratio of >14% and a total capital ratio of >25% by 2020, subject to changing regulatory requirements
• The 30 June 2017 buffer to 2017 requirements is 6%-points and to the fully phased in requirements (2019) 3.25%-points (€ 6.7bn)
• Rabobank’s distributable items amounted to € 25.5bn as at 30 June 2017
Targets and regulatory requirements
Transitional CET1 development
Fully loaded CET1 development
14.0%15.0%0.8% 0.4% 0.1%
0.3%
2016 CRD IV phase in2017
RabobankCertificates
Issuance
Profit minusdistributions
Other H1 2017
>14%0.8% 0.5%
2014 2015 2016 RabobankCertificates
issuance
Profit, RWAchange and
other
H1 2017 Target 2020
11.8% 12.0%13.5% 14.7%

Investor Relations
13.6% 13.5% 14.0% 15.0%
2.4% 2.9%3.6% 3.1%
2.0%
5.3%6.8%
7.4% 7.4%
0.0%2014 2015 2016 H1 2017 Target 2020
23.2%25.0%
>14%
25.5%
21.3%
>25.0%
Rabobank already meets the > 25% total capital target
50
• Since 2012, high capital ratios are targeted to protect senior bond holders against the (unlikely) event of a bail-in
• Rabobank adjusted its target Additional Tier 1 layer to roughly 2% (from 3.5%) with the issuance of Rabobank Certificates. This will further optimise the capital stack
• More guidance on MREL is expected end of 2017 / early 2018. Once the EC creditor hierarchy proposal is adopted and implemented in the Netherlands, Rabobank could opt to issue non-preferred senior debt to meet MREL requirements
• Transitional ratios as at 30 June 2017:
• Tier 1 ratio 18.1%
• Total capital ratio 25.5%
• Leverage ratio 5.8%
Capital structure(in % of RWA)
Highlights
CET1
AT1
Tier 2

Investor Relations
Large bail-in buffer protecting senior debt holders
• The bail-in buffer consists of (subordinated) balance sheet items protecting senior unsecured debt against the unlikely event of bail-in
• All buffer items have a residual maturity of over 1 year, in line with the proposed MREL requirements
• Rabobank has a strong buffer in place totaling € 57.4bn i.e. 28% of RWA
Stress testing bail-in buffer (June 2017) Bail-in buffer as proxy for MREL
• Senior unsecured is not affected until losses exceed 9.2% of Rabobank’s balance sheet total
• If losses were to amount 10% of the balance sheet total, senior unsecured would only be bailed in up to 4% of its nominal outstanding
Bail-in buffer stress test
Capital figures based on gross numbers, i.e. excluding CET1 deductions, including the notional amount of grandfathered Tier 1 and Tier 2 instruments. Minority interests are disregarded.
51
0
50
100
150
200
June2017
1% 2% 3% 4% 5% 6% 7% 8% 9% 10%
T2 AT1 CET1 Loss SCNs Loss T2 Loss AT1 Loss CET1
Loss in % of balance sheet total (€ 623bn)
€ bn

Investor Relations
Funding strategy: diversification in combination with lower needs
• Rabobank funding target for 2017 has been set at € 15bn, subject to balance sheet developments
• A total amount of ~€ 10bn has been raised in H1 2017, including TLTRO participation and the Covered Bond issuance
• In the coming years, Rabobank will focus on further optimising its wholesale funding base
Funding target• Diversified wholesale funding mix achieved by using different markets,
maturities, currencies and products
• Strategic considerations are key in Rabobank’s global funding markets’ activity
• Rabobank successfully issued its inaugural Covered Bond in 2017
• Continued commitment towards (unsecured) strategic and liquid benchmark curve
Funding strategy: global market approach
Investor base further diversified (in € bn)
52
Rabobank from net positive to net negative issuer (in € bn)
0
10
20
30
2012 2013 2014 2015 2016 2017 (Aug)
Senior Green Covered TLTRO
-20
-10
0
10
20
302009 2010 2011 2012 2013 2014 2015 2016 2017*
* Assuming € 15bn target funding programme in 2017

Investor Relations
Rabobank successfully issued its first Covered Bond
53
• Fully compliant with EBA ‘best practices’
• The programme is registered with the Dutch Central Bank (DNB)
• Strong Dutch legal framework and favourable regulatory treatment
Characteristics• Diversification of funding sources and access to a broader
investor base
• Covered Bonds provide economically attractive funding
• Opportunity to attract funding that matches long duration assets
• Increased capital buffers and low asset encumberance give sufficient comfort to senior unsecured bondholders
Rationale
• In May 2017, Rabobank issued its inaugural Covered Bond under the Covered Bond Programme
• After an extensive roadshow, Rabobank successfully priced a € 2.5bn dual tranche note split over € 1.5bn 7y at 0.250% and € 1bn 15y at 1.250%
• Rabobank plans to issue 1 to 2 Covered Bonds benchmarks per annum, next to private placement opportunities
Inaugural Covered Bond issuance
Rabobank Covered Bond Programme Overview
Issuer Coöperatieve Rabobank U.A. (Rabobank)
Programme Size € 25bn
Format Soft Bullet
Extension Period 12 months
Rating Aaa (Moody’s)
Currency Multi currency
Guarantor Rabo Covered Bond Company B.V.
Collateral Prime Dutch residential mortgage loans
Asset Percentage 100%
Indexed LTV Cut Off 80%
Governing Law Dutch law
Regulatory OC 5%

Investor Relations
Rabobank actively manages liquidity buffer
• HQLA was reduced to € 91bn from € 103bn on the back of lower short term funding and prudently terming out its maturity profile
• Amounts of cash held at central banks reduced
• Rabobank amply meets current (and future) liquidity requirements:
• LCR: 132% (Dec 2016: 130%)
• NSFR: 121% (Dec 2016: 119%)
• Rabobank aims to be a best-in-class issuer with a prudential approach to meet (regulatory) ratios and strong inflow due to high creditworthiness
• The liquidity strategy is driven by diversifying sources of funding, by using a range of (cash) products and instruments
• Total short-term debt outstanding: € 38.4bn• Issuance profile smoothened throughout the year• Notes are liquid and characterised by active trading in
secondary markets• Rabobank has an unparalleled track-record with respect to
providing liquidity in our own paper
Liquidity strategy
54
116% NSFR
LCR132%
119% 121%
130%127%
98 103 91
46 3831 Internal RMBS
122
June 17
HQLA
141
Dec 16
144
June 16
LCR, NSFR (%) and liquidity buffer (in € bn)
0
5
10
15
<5 5-30 31-90 91-180 181-365 >365
In € bn
days
Maturity profile short term debt (June 2017)

Investor Relations
CRD IV qualifying capital
On a transitional basis (amounts in € bn) 31 Dec 2016 1 Jan 2017 30 June 2017
Common Equity Tier 1 capital 29.6 29.0 31.1
Tier 1 capital 37.1 35.9 37.5
Total capital 52.9 51.8 52.9
Risk-weighted assets 211.2 211.2 207.6
Common Equity Tier 1-ratio 14.0% 13.7% 15.0%
Tier 1-ratio 17.6% 17.0% 18.1%
Total capital-ratio 25.0% 24.5% 25.5%
Leverage ratio 5.5% 5.3% 5.8%
On a fully loaded basis (amounts in € bn) 31 Dec 2016 1 Jan 2017 30 June 2017
Common Equity Tier 1 capital 28.4 28.4 30.5
Risk-weighted assets 211.2 211.2 207.6
Common Equity Tier 1-ratio 13.5% 13.5% 14.7%
Leverage ratio 4.6% 4.6% 5.1%
55

Investor Relations
CET1 capital: Rabobank Certificates
In € mn 31 Dec 2016 1 Jan 2017 30 June 2017
Retained earnings 25,709 25,709 26,275
Expected distributions -60 -60 -36
Rabobank Certificates 5,948 5,948 7,446
Non-controlling interests 25 25 26
Reserves 112 112 -732
Deductions -3,302 -3,302 -2,474
Transitional Guidance 1,186 605 574
Common Equity Tier 1 Capital 29,618 29,037 31,080
• Rabobank Certificates are the most deeply subordinated capital of Rabobank and qualify as CET1 capital
• In January 2017 Rabobank issued 60mn new Rabobank Certificates with a nominal value of € 25.00 each
• The total outstanding number of Rabobank Certificates is 297.9mn, representing € 7.4bn of CET1 capital
• Rabobank Certificates are listed on Euronext Amsterdam
Distributions• Distributions on Rabobank Certificates are fully
discretionary• As per the current payment policy, Rabobank intends to
pay a quarterly distribution which is the higher of: • € 0.40625 (6.5% on annual basis)• the 3-monthly average on an annual basis of the
effective return on the most recent 10 year Dutch state loan +150bps calculated based on a nominal value of € 25.00 divided by 4
Breakdown CET1 capital Rabobank Certificates
56

Investor Relations
Overview of Additional Tier 1 instruments
Nominal Coupon Issue date 1st call date
CRD IV Compliant AT1
Capital Securities EUR 1.5bn 5.50% Jan 2015 June 2020
Capital Securities EUR 1.25bn 6.63% April 2016 June 2021
Grandfathered AT1 (public)
Capital Securities NZD 900mn applicable 1-yr swap rate + 0.76% Oct 2007 Oct 2017^
Capital Securities CHF 350mn 5.50% June 2008 June 2018
Capital Securities ILS 323mn 5.50% July 2008 July 2018
Capital Securities NZD 280mn applicable 5-yr swap rate + 3.75% May 2009 June 2019
Capital Securities USD 2.9bn 11% June 2009 June 2019
TPS IV GBP 350mn 5.56% Oct 2004 Dec 2019
Capital Securities GBP 250mn 6.91% June 2008 June 2038
• As at 30 June 2017 € 2.7bn of CRD IV compliant instruments were outstanding
• The temporary write down capital securities have a dual trigger of 7% CET1 on Rabobank Group and 5.125% CET1 on Issuer level* respectively
Grandfathered instruments• As at 30 June 2017, all grandfathered instruments
(EUR 4.1bn) qualified as Additional Tier 1 capital• In June 2017 Rabobank redeemed the US$ 2bn 8.4% capital
securities at its first call date. In August 2017 Rabobank announced that it will early redeem NZD 900mn of capital securities at its first call date in October
Additional Tier 1 Capital CRD IV compliant instruments
* H1 2017: actual CET1 on Issuer level = 15.6%^ Will be early redeemed in October 2017
57

Investor Relations
Tier 2 instruments totaling € 16.5bn
Tier 2 issues Coupon Issue date Maturity Call date
EUR 1bn 5.88% May 2009 May 2019
EUR 1bn 3.75% Nov 2010 Nov 2020
EUR 1bn 4.13% Sept 2012 Sept 2022
GBP 500mn 5.25% Sept 2012 Sept 2027
USD 1.5bn 3.95% Nov 2012 Nov 2022
EUR 1bn 3.88% July 2013 July 2023
USD 1.75bn 4.63% Nov 2013 Dec 2023
USD 1.25bn 5.75% Nov 2013 Dec 2043
EUR 2bn 2.50% May 2014 May 2026 May 2021
GBP 1bn 4.63% May 2014 May 2029
JPY 50.8bn 1.42% Dec 2014 Dec 2024
AUD 475mn 3m BBSW* + 2.5% July 2015 July 2025 July 2020
AUD 225mn 5.0% July 2015 July 2025 July 2020
USD 1.5bn 4.38% Aug 2015 Aug 2025
USD 1.25bn 5.25% Aug 2015 Aug 2045
USD 1.5bn 3.75% July 2016 July 2026
USD 500mn 4.00% March 2017 April 2029 April 2024
• Qualifying Tier 2 represents 7.4%-point of the total capital ratio (including transitional adjustments)
• All Tier 2 instruments are CRD IV compliant• In addition to its main currencies, Rabobank will
remain focused on a diversified Tier 2 investor base• In March 2017 Rabobank issued US$ 500mn of Tier 2
in 12NC7 format
* Bank Bill Swap Benchmark Rate (Australian Financial Markets Association).
Tier 2
58

Investor Relations
Globally diversified wholesale funding portfolio
• Rabobank is committed to a liquid EUR benchmark curve and has excellent access to short term as well as long term funding
• Issuance is done in over 20 different currencies enabling investors to diversify their portfolios
• Rabobank continues to explore new funding markets and is open for any attractive trade idea
Public market
• Active in all local markets• Possibility of different trade formats• Rabobank is a prominent issuer in structured MTNs, issuing
about 10% of funding in this format• Ability to issue in the most innovative products
Private Placements
59

Investor Relations
Topics
Update on strategy
H1 2017 results
Appendix:
• Rabobank: Dutch, cooperative and profitable
• Financial results
• Loan portfolio
• Capital, Funding & Liquidity
• Current & future developments
60

Investor Relations
Limited UK exposure and low direct impact of Brexit
• Rabobank’s direct exposure to clients in the UK is limited
• Total exposure UK (June 2017): € 5.5bn (excluding deposits at the BoE and sovereign exposure)
• Rabobank London’s franchise in the UK includes products and services for international clients in the field of corporate banking, commercial financing and operations related to global financial markets.
• The bank is considering the (potential) impact of Brexit by means of scenario analyses and will consider contingency plans on this basis. As at their request to all banks with a presence in the UK, Rabobank will confirm the consideration of these plans to the UK regulator PRA.
• We do not expect a significant adverse impact on our portfolio
• Indirect effect of Brexit could be negative for the Dutch economy
• The UK is an important trade partner of the Netherlands. Around 8% of Dutch exports go to the UK, and they contribute 2% to Dutch GDP. In addition, around 11% of total Dutch imports come from the UK
61
Investor Relations
Rabobank prepares itself for an increase in RWAs due to the possible ‘Basel IV’ regulation
62
Basel IV
• January 2017 announcement by GHOS delayed
• Proposals include the following key elements:
• Revised Standardised Approaches to credit risk and operational risk, the latter replacing the Advanced Measurement Approach
• Constraints on the use of internal model approaches for credit risk, in particular through the use of input floors
• An output floor preventing aggregate RWAs falling below a threshold calibrated on the basis of the revised StandardisedApproaches.In many cases the output floor would affect especially low risk portfolios such as residential mortgages as well as lending to SME and corporates and Trade & Commodity Finance exposures
Rabobank position
• Rabobank endorses the broad direction of the Basel Committee for Banking Supervision to strengthen banks’ capital buffers, but is not supportive of the Basel IV proposals to constrain the use of internal model approaches.
• Anchoring of proposed output floors to a revised StandardisedApproach implies limited reflection of the underlying risk in the solvency requirement
• ‘One-size fits all’ approach gives the wrong risk management incentives
• To mitigate the adverse effects of Basel IV, banks will consider balance sheet reductions, re-pricing of products due to higher risk costs, and a shift in business models

Investor Relations
Rabobank prepares for the implementation of IFRS 9
• IFRS 9 replaces IAS 39 and becomes effective as from 1 January 2018. Rabobank is in the final stage of preparation for the implementation of the new accounting standard
• Compared to IAS 39 main areas of change are: classification & measurement, impairments and hedge accounting In particular the impairment requirements will lead to significant changes in the accounting of financial instruments IFRS 9 is based on an expected loss model, whereas IAS 39 is based on an incurred loss model
• Rabobank will utilise its regulatory A-IRB credit models as the basis for the Expected Credit Loss (ECL) assessment under IFRS 9
• We will make use of an IFRS 9 overlay to our regulatory A-IRB models to remove prudential regulatory elements (such as PD and LGD floors and downturn LGDs) and include point-in-time estimates, lifetime parameters and multiple macro-economic scenarios. These scenarios (baseline, baseline minus and baseline plus) will be probability weighted. A framework of qualitative and quantitative factors will determine the allocation between Stages
63
No significant deterioration Significant deterioration Credit impaired
Stage 1 Stage 2 Stage 3TransferIf credit risk has increased significantly since origination
Move backIf transfer conditions above
are no longer being met
Change in credit quality since origination
12-months ECL Lifetime ECL Lifetime ECL

Investor Relations
Expected impact of the implementation of IFRS 9
64
• New IFRS 9 impairment calculations will lead to higher loan loss allowance as from January 1, 2018
• Instead of incurred loss, expected loss has to be recognised
• Rabobank is still in the preparation phase to determine the exact addition to the loan loss allowances
• Within the regulatory capital calculations the higher loan loss allowance will be partly compensated by the shortfall
• Based on our preliminary estimation and taking into account the current economic environment, we do not expect that the negative impact on the fully loaded CET1 ratio will be more than 15 basis points

Investor Relations
Updates and changes to this presentation
65Investor Relations
The latest version of this presentation is always available online on:
https://www.rabobank.com/en/investors/presentations/index.html
Please note that a FAQ section addressing additional topics that might be of interest is available on the IR website of Rabobank.
Date Slide Content / change
14-09-2017 29 Updated key figures Duch economy based on latest RaboResearch Economic Quarterly report
15-09-2017 6 + 30 Changed Outlook S&P to ‘Positive’ from ‘Stable’
20-12-2017 29 Updated key figures Duch economy based on RaboResearch ‘Outlook 2018’ report

Investor Relations – Rabobank Group
Telephone +31 30 712 2401 P.O. Box 17100, UC 044E-mail [email protected] 3500 HG UtrechtWebsite www.rabobank.com/IR The NetherlandsBloomberg RABO NA
Download the Rabo IR App on the Apple App Store or on Google Play
More information
Rabo IR
20171220