lseg h1 2021 - investor presentation
TRANSCRIPT

|HIGHLY RESTRICTED|
LSEG - H1 2021 results
6 AUGUST 2021

|HIGHLY RESTRICTED|
2
Welcome– Introduction
David Schwimmer, CEO
– Financial Performance H1 2021
Anna Manz, CFO
– Strategic and Operational Progress
David Schwimmer, CEO
– Q&A

|HIGHLY RESTRICTED|
3
Financial
☐ Delivered a good H1 financial performance
☐ All divisions reported strong revenue growth – benefits of our business
combination becoming visible
☐ Cost synergy programme ahead of plan – full year 2021 target raised
Operational
☐ Completed disposal of Borsa Italiana Group
☐ Excellent progress on integration as we execute across multiple workstreams
☐ Senior management team in place and focused on delivering our strategy
A good H1
performance

|HIGHLY RESTRICTED|
4
Delivering a faster-growing, more scalable business
– Creating a disciplined culture
focused on performance and
delivery
– Improving sales execution and
partnership with customers
– Capturing the synergies that exist
across our businesses
– Significant but targeted
investment creating a more
scalable business centred on
a cloud-based, open platform
– Management focused on
sustainable long-term financial
performance
– Focusing on our customers’
needs across asset classes,
throughout their workflow, on a
global basis.
– Leveraging our leading position
across financial data and capital
markets to create innovative
solutions for customers
Integrating our
world-class
businesses1 Driving growth2
Building an efficient and scalable platform3

Financial Performance H1 2021Anna Manz, CFO

|HIGHLY RESTRICTED|
☐ Strong H1 progress
☐ All divisions demonstrating good revenue growth
☐ Cost synergy programme progressing ahead of target and Revenue
synergy programme on target
☐ On track for cost and capex guidance
☐ Confident in delivery of all acquisition financial targets
☐ Good progress on embedding a performance-management culture
Driving
long-term
sustainable
financial
performance
6

|HIGHLY RESTRICTED|
Good financial performance in H1 generating sustainable growth
Note:
• All variances, except for Adjusted EBITDA Margin variance, are constant currency excluding the impact of the deferred revenue accounting adjustment
• All figures and prior year comparative performance are based on pro-forma performance assuming Refinitiv has been part of LSEG for the full-period with financial performance from Borsa Italiana excluded
(1) Adjusted EBITDA Margin is calculated as Adjusted EBITDA / Total Income (excl. recoveries)
Total Income (excl. recoveries)
£3,356m4.6%
Adjusted EBITDA
£1,657m9.4%
Adjusted EPS
146.1p
Adjusted operating expenses
£1,432m1.1%
Interim Dividend
25p7%
Run rate
Cost synergies achieved
£77m
Adjusted EBITDA Margin(1)
49.4%2.9%
Leverage
Net Debt / Adjusted EBITDA
2.2x
+5.5% growth in Q2
7

|HIGHLY RESTRICTED|
H1 2020 pro-forma TotalIncome (exrecoveries)
Net FX effects Recurringrevenue growth
Transactionalrevenue growth
Net TreasuryIncome
Deferredrevenue haircut
H1 2021 pro-forma TotalIncome (exrecoveries)
Good growth in both recurring and transactional revenues
£3,420m
(£201m)
£104m (£23m)
£3,356m
Recurring revenue growth
Driven by improving
performance in Data and
Analytics
Net Treasury Income
– Cash collateral balances
and investment returns at
more normalised levels
after exceptional prior year
period
£93m
(£37m) Transactional revenue
growth
– Strong Tradeweb volume
growth
– Strong growth in
RepoClear volumes
One-off impact:
will not repeat
Note:
(1) Growth is on a constant currency basis excluding the impact of the deferred revenue accounting adjustment
+4.6% growth(1)
8

|HIGHLY RESTRICTED|
Data & Analytics Capital Markets Post Trade
High quality recurring income with broad-based growth
+4.8%
+9.6%-2.1%
£2
,27
2m
£342m£6
19
m
66%
26%
3% 5%
Recurring Transactional
NTI Recoveries
Note:
• All growth rates are stated on a constant currency basis excluding recoveries and the impact of the deferred revenue accounting adjustment
• RHS pie chart based on constant currency segmentation of revenues, including recoveries
£108m
+8.4% Post Trade Revenue
-25.3% NTI
9

|HIGHLY RESTRICTED|
Customer and Third-Party Risk
Wealth
Investment Solutions
Enterprise Data
Trading and Banking
Data & Analytics revenue – broad-based improvement in performance
£744m
-0.1%
£557m
+2.4%
£558m
+8.4%
£238m
+0.8%
£175m
+37.5%
Trading Banking
Real-Time
DataPRS
Index
SubscriptionAsset
BasedOther
Wealth
DataBETA
– Trading (-0.6%): Slowing decline in Eikon premium desktop partly
offset by good growth in Fixed Income, FX and Commodities
– Continued growth in Banking (+1.9%)
– Double digit growth in Asset Based revenue (+18.2%)
– Strong growth in Index Subscriptions (+7.9%)
– Continued strong growth in Pricing & Reference Services (+6.1%)
– Stabilising growth and improving outlook in Real-Time Data
(+0.8%)
– Strong growth in Wealth data & analytics driven by digital
solutions (+5.7%)
– Offset by decline in Beta revenues given extraordinary prior year
comparator (-5.3%)
– Strong growth, ahead of market across all businesses
Note:
All growth rates are stated on a constant currency basis excluding the impact of the deferred revenue accounting adjustment
Subscription revenue Asset based revenueBeta transaction
revenueOther transaction revenue
10

|HIGHLY RESTRICTED|
Data & Analytics – New KPIs give insight into drivers of performance
Linked to Asset-
based revenues
55%
Subscription
Revenue(1), (2)
Growth
+3.1%ASV Growth(1)
+3.9%
– ASV growth > Subscription
Revenue growth at H1, showing
positive momentum in the
business
– ASV growth shows good new
business and retention
performance
ETF AUM
$1.04trnESG AUM(3)
$132bn
187%
BETA Transaction Volumes
285m
(3%)
Links to Subscription revenues (2)
(c.87% of D&A revenues)
Growth reflects
momentum in ESG
index franchise
– Strong resurgence in ETF AUM
resulting from market inflows back
into equity markets
– Growth in ESG AUM reflecting
estimated c.7% share of the
market
Linked to BETA revenues
– Lower volumes due to Covid-
related volatility in the prior year
Note:
(1) ASV = Annual Subscription Value - reflects the year-on-year growth in current minimum annualised value of subscription contracts as at period-end date
(2) Subscription revenues are recurring revenues within the D&A business excluding asset-based revenues
(3) Passive AUM benchmarked to FTSE Russell Sustainable Investment indices. Date of metric is as at 31 December 2020 11

|HIGHLY RESTRICTED|
Fixed Income, Derivatives & Other
FX
Equities
– Strongest IPO market since 2014 driving primary markets
revenues
– Secondary markets revenues down reflecting lower equity
market activity
£120m
+2.5%
£110m
-0.8%
£389m
+15.4%
Note:
All growth rates are stated on a constant currency basis excluding the impact of the deferred revenue accounting adjustment
Capital Markets revenue – strong H1 growth driven by primary markets activity
and Tradeweb
– Good growth in FXall business driven by client growth and
volumes
– Offset by decline in Matching, notably in the higher yield spot
business
– Strong growth driven by Tradeweb cash credit volumes
which attracts significantly higher fees per $ million and rates
derivatives
12

|HIGHLY RESTRICTED|
Capital Markets KPIs – good growth in FX volumes and strong growth in
Tradeweb; UK Equities affected by strong prior year comparator
Note:
(1) ADV = Average Daily Volume / Value
Linked to secondary markets
revenues (c.35% of equities
revenue)
Linked to transactional FX revenues
(c.78% of total FX revenues)
Linked to Tradeweb revenues (c.92% of Total Fixed
Income, Derivatives & Other revenue)
4%
FX ADV(1)
$455bn
Tradeweb ADV(1)
Rates - Derivatives
$272bn
Tradeweb ADV(1)
Credit - Cash
$10bn
19% 32%16%
UK Equity ADV(1)
£4.7bn
– UK Equity ADV down
significantly on prior year
reflecting more normalised
equity market activity
– Prior year benefited from
Covid related volatility
– Resilient FX volumes
despite strong prior year
comparator
– Continued volume growth in
FXall
– >50% of Tradeweb revenue derived from
Rates business
– Credit cash business largest contribution to
revenue growth
– Continued strong growth in rates derivatives
and credit cash business, reflecting
increasing electronification and higher
market share
13

|HIGHLY RESTRICTED|
Net Treasury Income
Non-Cash Collateral
Securities & Reporting
OTC Derivatives
Resilient Post Trade H1 revenue performance despite strong prior year comparator
£169m
+2.4%
£127m
+15.3%
£46m
+17.5%
£108m
-25.3%
Note:
All growth rates are stated on a constant currency basis
– Good growth driven by increased client activity and new
client wins despite strong prior year comparator
– Strong growth and market outperformance in RepoClear
driven by European debt issuance and customers benefitting
from a consolidated liquidity pool and service expansion
– Commercial policy changes combined with an overall
preference for non-cash collateral
– Balance returned to more normalised levels after elevated
prior-year and reduced levels of investment return
14

|HIGHLY RESTRICTED|
Post Trade KPIs – strong growth in RepoClear volumes
Linked to SwapClear revenues
(c.85% of total OTC revenues)
Linked to Securities & Reporting
revenues
10%
SwapClear client average 10
year notional equivalent
$4.4trn
10%
Non-OTC
RepoClear nominal value
€113.4trn
– Notional quantity of 10-year
USD interest rate swaps
required to hedge the
SwapClear client portfolio
risk. Correlates well with
SwapClear revenues
– Increase in the period
reflects higher proportion of
longer-tenor swaps in
comparison to prior year
Linked to Non-Cash Collateral Linked to Net Treasury Income
3%
Average Non-Cash Collateral
€161.5bn
9%
Average Cash Collateral
€106.4bn
– Shift towards non-cash
collateral vs cash in a lower
volatility environment
– Strong market volumes
reflecting new members
onboarded, European debt
issuance and service
expansion
– Balances and rate of return
remain at more normalised
levels, compared with
exceptional prior-year period
15

|HIGHLY RESTRICTED|
Update on costs, investment and margin
Note:
All cost growth rates are on a constant currency basis and refer to year-on-year growth
(1) Refer to slide 37 on further information on Cost to Achieve synergies which forms the majority of integration and separation capex
Investment benefits will drive further margin improvement, beyond 50% medium-term guidance
☐ Synergies
– Cost synergies delivery ahead of plan in 2021
– Total benefits and costs unchanged; 2021 integration and separation capex in line with guidance at £150m(1)
☐ Adjusted operating expenses
– Targeting 5% cost growth for 2021, in line with guidance
– Targeting low-single digit cost growth for 2022 and 2023, as previously stated
– Medium-term guidance of 50% EBITDA margin
☐ Ongoing Capex
– Guidance unchanged - maintained at £650m-£700m p.a. until end of 2023, driving growth, scalability and resilience – tapering
thereafter
16

|HIGHLY RESTRICTED|
Cost synergies ahead of plan – increasing 2021 outlook on run-rate synergies to £125m
Cost synergy activity in H1
– 2 data centres removed
– 19 properties exited
– 10 strategic supplier contracts renegotiated
– c.£50m net employee cost reduced(1)
Expected total for end 2021
– 4 data centres removed
– 25 properties exited
– 25 strategic supplier contracts renegotiated
– c.£70m net employee cost reduced(1)
Technology and IT
Property and Other
Corporate and
headcount
reduction
Cost synergy
run-rate delivered£77m c.£125m
£27m in-period benefit(2) c.£65m in-period benefit(2)
Note:
(1) On a run-rate basis
(2) On a constant currency basis
17

|HIGHLY RESTRICTED|
2021 2022 2023
Investment will drive growth and further margin improvements, beyond the 50%
EBITDA margin guidance in the medium-term
5% cost
growth
Low-single
digit cost
growth
Low-single
digit cost
growth
Note:
• All cost-growth references are on a constant currency basis and refer to a year-on-year basis
• Please refer to slide 40 for further detail on the cost drivers in H1
As per previous
2021 guidance
Acquisition annualisation
(Red Flag, GIACT)
Technology, efficiency and
dual-running costs
Ongoing costs
(e.g. inflation, Tradeweb)
In-year cost savings
and beyond…
>50% EBITDA Margin
Cost drivers
Revenue synergy operating
costs
18

|HIGHLY RESTRICTED|
Capex guidance unchanged: investments in 2021 driving revenue growth,
scalability and resilience
Ongoing Capex
£650m-£700m
p.a.
Expected to
continue until end
of 2023; tapering
thereafter
H1 spend: £273m
Data platform
and cloud
Workspace
Network
infrastructure
Content
transformation
Tradeweb
A consistent experience, making it easier for
customers and partners to access, distribute, and
develop with LSEG or in the cloud
Revenue growth and cost
efficiency following roll-out to full
benefit from 2023 onwards
Next-generation user interface, cloud-based, that
uses open platform technologies
Revenue benefits follow roll-out to
end 2024
Software defined – better agility, higher capacity
and increased resilienceCost benefits from 2023 onwards
Improved speed and efficiency of ingestion of new
data sets to support rapidly evolving customer
demand for enriched data and new products
Driving ongoing revenue growth
and cost efficiency over the next
three years.
Continued product and developmentUnderpin double-digit growth
trajectory
2021 Integration and separation capex(1) of c.£150mLargely Capex element of announced Cost to Achieve synergies
H1 spend: £45m
Initiative
Note:
(1) Refer to slide 37 in the appendix
regarding Cost to Achieve synergies which
forms the majority of integration and
separation capex
Improving
agility and
resilience
across the
group
Delivering
high growth
19
Benefit to LSEG and its customers Financial benefits

|HIGHLY RESTRICTED|
Strong cash generation and continued investment
20
£1,490m
£606m
(£122m)
(£90m)
(£325m)
(£347m)
H1 Operating cashflow
Net interest & royaltiespaid
Tax paid Capex & otherinvestment
Dividends H1 Free cash flow(1) (2)
Operating cash flow:
– Strong cash generation driven by high
quality subscription revenues
– Stated after Cost to Achieve synergies
incurred as non-underlying operating
expenses (£83m) and transaction related
fees
Free cash flow:
– Continue to generate strong free cash
which should continue to increase as non-
underlying expenses and integration and
separation capex falls away with time
– Generating free cash flow per share of
173.4 pence(3)
Capex & Other investment:
– Includes £318m of capex of which c.£273m
of ongoing capex and c.£45m of integration
and separation capex
Note:
(1) Dividends comprises of £358m of LSEG dividend offset by £11m dividend income received from EuroClear
(2) Free cash flow represents the underlying cash flow generated by the Group
(3) Based on a weighted average share count of 555.8m shares

|HIGHLY RESTRICTED|
Refinancing complete at attractive rates
Net Debt / EBITDA
2.2x
Post completion - quickly lowered blended cost of funds
and increased average maturity
Pre-completion Post completion Pre-completion Post completion
Blended cost of debt Weighted average maturity
(years)4.6%
1.7%
6.5
4.2
– Full Bridge refinancing
complete
– Borsa Italiana disposal
proceeds reduce debt
– Credit ratings affirmed at pre-
Refinitiv announcement levels
Moody’s
A3S&P
A
Debt Mix
Term Loans
Commercial Paper
LSEG Bonds
2021 new bond
issuance
£1.6bn
£0.1bn
£1.8bn
£5.0bn
21

|HIGHLY RESTRICTED|
Outlook unchanged for 2021 – higher run-rate cost synergies expected
Total Income (excluding recoveries)
Underlying operating expenses
Cost synergies
Depreciation and Amortisation
Net Finance Expense
Tax
– Good performance in H1; on track for c.4-5% growth for 2021
– On track to meet 5% rise in operating expenses(1)
– Expect to achieve c.£125m run-rate cost synergies by the end of 2021
– c.£790m reflecting accounting allocation changes(2)
– c.£205m for 2021 on a pro-forma basis
– Effective Tax Rate of 21.5% - expect a tax rate of 22-24% for 2022 and 2023
On track to achieve acquisition financial targets(4)
Capex – Total capex of c.£850m including c.£650m-£700m of ongoing capex and c.£150m integration and
separation capex(3)
Note:
All guidance is on a constant currency basis and does not factor in any movements in currencies, notably USD and EUR versus GBP as well as other FX adjustments
(1) Because of the mix in FX and FX related adjustments, on a reported basis we expect the cost growth for 2021 will be around a c.1-2% step down from the new 2020 pro-forma level of £3,023m
(2) Please refer to slide 41 and 42 for further detail on accounting changes
(3) Refer to slide 37 for additional information on Cost to Achieve synergies
(4) Please refer to slide 35 in the appendix for a full list of acquisition financial targets
22

|HIGHLY RESTRICTED|
☐ Strong H1 progress
☐ All divisions demonstrating good revenue growth
☐ Cost synergy programme progressing ahead of target and Revenue
synergy programme on target
☐ On track for cost and capex guidance
☐ Confident in delivery of all acquisition financial targets
☐ Good progress on embedding a performance-management culture
Driving
long-term
sustainable
financial
performance
23

Strategic and Operational ProgressDavid Schwimmer, CEO

|HIGHLY RESTRICTED|
☐ We are well positioned in large and growing markets
☐ We have a diverse set of world-class assets, providing:
– Global scale
– Multi-asset class capabilities across the trade lifecycle
– A leading role in the sustainable transition
☐ Track record of partnering with our customers to drive innovation
– Trusted operator of large-scale critical market infrastructure
A leading
global financial
markets
infrastructure
and data
provider
25

|HIGHLY RESTRICTED|
Creating an ecosystem of connected
businesses driven by customer demand
Strong momentum with early wins – £4m run
rate revenue synergies achieved in H1
– 27 new or enhanced products launched
– FTSE Russell customers buying PRS data
– Refinitiv ESG data through Yield-book add-in
– Post Trade SMART data enhancements
Multiple development opportunities identified
– Front to back analytics (Fixed Income, FX and Digital
Assets)
– Post trade data & analytics
– Sustainable Finance & Investment
Meaningful revenue synergy impact expected
end of 2022
Post
Trade Trading information and
workflow integration
Capital
Markets
Data &
AnalyticsData
Analytics
Distribution
26

|HIGHLY RESTRICTED|
Trading &
Banking
Solutions
H1 operational achievements and immediate priorities
Enterprise
Data Solutions
Investment
Solutions
– Greater customer focus and improving retention
– Workspace roll out for banking customers
– Cross-selling of pricing and reference services to
FTSE Russell customers progressing well
– Became a certified data vendor for Swiss stamp
duty compliance
– ETF’s indexed against FTSE Russell benchmarks
exceeded $1 trillion of assets for the first time
– Launched Workspace for Research and Portfolio
management, 4th community to go live
Priorities for H2
– Accelerate PRS / FTSE Russell
initiative
– Early access programme for
Workspace into our FX community
– Yield Book analytics to be incorporated
into Refinitiv distribution channels,
including Workspace
– Introduction of further sustainable index
and benchmark products, leveraging
Refinitiv data
Wealth
Solutions
– Workspace product selected for global adoption by
Nomura’s International Wealth Management
business
Customer &
Third Party
Risk Solutions
– Integration of acquisitions, GIACT and Red Flag,
providing a combined offering
Data & Analytics
27

|HIGHLY RESTRICTED|
Equities
Capital Markets
H1 operational achievements and immediate priorities
FX
Fixed Income
– Strong IPO market highlighting London’s
attractiveness as a capital raising venue – third
most active IPO market globally
– Turquoise growing share of European equity
trading post Brexit
– New connectivity (API) launched for FX Forwards
on our Matching platform
– Trade Performance Reporting launched for FXall
liquidity providers
– 22% increase in daily volumes on Tradeweb – to
more than $1.0trn a day
– Tradeweb completed acquisition of Nasdaq’s US
Fixed Income electronic trading platform
Priorities for H2
– Regulatory engagement to further
strengthen competitiveness of UK
capital markets
– Expanded Issuer Services offering
– ForexClear / FXall connectivity
– FX Matching re-platforming onto LSEG
Technology
28

|HIGHLY RESTRICTED|
OTC
Securities &
Reporting
– SwapClear registered trades from 47 new clients
across a diverse range of geographies in H1
– SwapAgent continues to see growing activity - with
cross-currency trades growing more than five-fold
– RepoClear registered 25% more trades in H1
– Actively clearing French, German and Italian
Green bonds and the European SURE and Next
Generation EU issuance
Priorities for H2
– Supporting seamless transition to
LIBOR - replacement benchmarks
– ForexClear - customer engagement
ahead of the next phase of the uncleared
margin rules in September
– Sponsored clearing customer adoption in
RepoClear SA
– Expansion of non-cash collateral
acceptance at LCH SA to non-Euro
instruments
– Rolling out a value at risk (VaR)
framework for the Euro debt pool
Post Trade
H1 operational achievements and immediate priorities
29

|HIGHLY RESTRICTED|
30
LSEG: supporting the global drive to a net zero carbon economy
Data and disclosureCatalysing consistent, comparable
and reliable global climate data
– Largest set of sustainable data available today with back history spanning 20+ years
– 500+ ESG metrics captured; 10,500+ companies covered across 200 countries
globally
– Green crime screening
Growth of the green
economyLeading sustainable capital raising
venue
Benchmarking tools Leading provider of sustainable
benchmarks
– Helping customers identify green equity and fixed income opportunities
– 103 equity issuers now hold the Green Economy Mark
– 300 bonds listed on Sustainable Bond Segment
– 205 sustainable ETFs listed
– Launch of Transition Bond Segment
– $132bn passive AUM benchmarked to FTSE Russell indices
– Broad suite of climate-themed equity and fixed income indices e.g. FTSE TPI Climate
Transition Index

|HIGHLY RESTRICTED|
31
– Consistently ranked towards the top of leading ESG ratings within our peer group
– First global exchange group to commit to net zero - signed the business ambition for 1.5⁰C
and joined the UN race to zero campaign - 100% renewable electricity used in 2020
– Supporter of the Task Force for Climate-related Financial Disclosures (TCFD) since launch
- encourage issuers to report against TCFD through our reporting guidance and we embed these
standards into our own financial reporting
– Environmental Management Group established to ensure delivery of our associated targets and
drive continued performance improvement.
– 50% of 2020 external hires at senior manager level were female - 44% female representation
at Board level as of year end
– Public commitments on race and disability equality - e.g. Race at Work Charter and Valuable
500 initiative
– Adhere to the UN Guiding Principles on Business and Human Rights, together with the
International Labour Organization Conventions and Recommendations within our global locations
Sustainability embedded in our strategy
Note:
(1) Leadership band. Significantly higher than the European average of C and higher than the specialised services sector average of D
(2) Top performer within peer group due to strong corporate governance and ethics
(3) Identified low risk of experiencing material financial impacts from ESG factors. LSEG classified as lowest risk within Diversified Financials. LSEG particularly noted
for its strong corporate governance framework. Score is out of 100, where 0 is best
(4) LSEG identified in the top 3% best performer in its supersector
(5) Top performer in peer group due strong corporate governance and ethics policies, ranked in the 89 th percentile
A-CDP Rating (1)
AAMSCI ESG Rating (2)
16.9Sustainalytics ESG Risk Rating (3)
61Dow Jones / SAM Corporate
Sustainability Assessment (5)
4.6FTSE Russell ESG Rating (4)

|HIGHLY RESTRICTED|
32
In summary ☐ Good H1 performance
☐ Delivering a faster-growing, more scalable business
– Integrating our world-class businesses
– Accelerating growth through targeted investment
– Building an efficient and scalable platform
☐ Strong and experienced management team in place
☐ Building on our strengths to create an integrated business that is
much more than the sum of the parts
☐ Acquisition financial targets
☐ Modelling information
☐ H1 Pro-forma revenues and KPIs
Appendix

Acquisition financial targets

|HIGHLY RESTRICTED|
35
On track to achieve all acquisition financial targets
☐ 5 – 7% Total Income (excluding recoveries) CAGR over the first three years (2020PF – 2023) (1)
☐ >£225m of annual run-rate revenue synergies phased over five years (2020PF – 2025) (2)
Phasing 60% by 2023 and 100% by 2025
☐ >£350m of annual run-rate cost synergies phased over five years (2020PF – 2025) (2), (3)
Phasing 70% by 2023 and 100% by 2025
☐ 50% Adjusted EBITDA margin (excluding recoveries) over the medium-term
☐ Leverage to reduce to 1-2x target range within 24 months of completion (4)
☐ >30% EPS accretion in the first year from completion and increasing in years two and three (4)
Note:
All guidance is on a constant currency basis and does not factor in any movements in currencies, notably USD and EUR versus GBP
(1) Total income growth target to be measured off the 2020 pro-forma Total Income (excluding recoveries) of £6,767m and runs until 31 December 2023
(2) Revenue and cost synergy targets run to 31 December 2025
(3) Year 1 cost synergy phasing refers to the full 12 months to 31 December 2021
(4) From the date of Completion of the Refinitiv transaction: 29 January 2021

Modelling Information
|HIGHLY RESTRICTED|
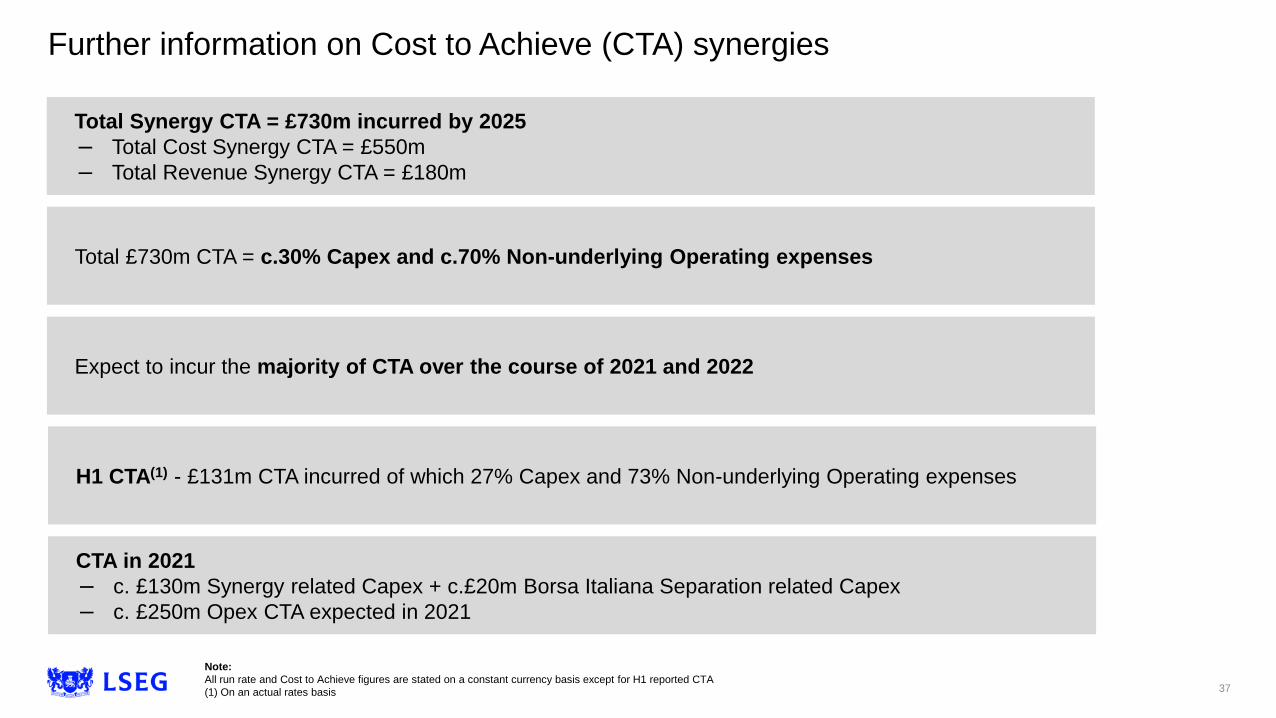
Further information on Cost to Achieve (CTA) synergies
Note:
All run rate and Cost to Achieve figures are stated on a constant currency basis except for H1 reported CTA
(1) On an actual rates basis
Total Synergy CTA = £730m incurred by 2025
– Total Cost Synergy CTA = £550m
– Total Revenue Synergy CTA = £180m
Total £730m CTA = c.30% Capex and c.70% Non-underlying Operating expenses
Expect to incur the majority of CTA over the course of 2021 and 2022
H1 CTA(1) - £131m CTA incurred of which 27% Capex and 73% Non-underlying Operating expenses
CTA in 2021
– c. £130m Synergy related Capex + c.£20m Borsa Italiana Separation related Capex
– c. £250m Opex CTA expected in 2021
37
|HIGHLY RESTRICTED|
Deferred revenue accounting adjustment
As a result of the acquisition of Refinitiv and the associated purchase price accounting rules, Refinitiv’s
deferred revenue balances are subject to a one-time haircut at the time of acquisition.
This is a non-cash adjustment. The negative revenue impact is mostly in Q1 2021 at approximately £22
million, with an additional £1 million in Q2; the remaining impact will be immaterial over subsequent quarters
in 2021.
The impact will be mostly in the Group’s Data & Analytics division, with a much smaller impact on the Group’s
FX venues business sitting within Capital Markets.
An adjusted variance, excluding the deferred revenue adjustment, has been presented to show true
underlying business growth on the prior year.
38

|HIGHLY RESTRICTED|
H1 pro-forma currency splits
Note:
(1) Total costs includes cost of sales, adjusted operating expenses and underlying depreciation and amortisation
15%EUR
18%GBP
8%Other
59%USD
11%EUR
23%GBP
14%Other
52%USD
Total Income (including recoveries) Total Costs(1)
39

|HIGHLY RESTRICTED|
£1,507m
£1,432m
(£92m)
£17m£27m
£33m£15m
£11m
(£71m)
H1 2020 pro-forma adjusted
operatingexpenses
Net FX effects Acquisitionannualisation
Technology Investment forgrowth
Tradeweb Ongoing costs Synergies andcost savings
H1 2021 pro-forma adjusted
operatingexpenses
Acquisition annualisation:
– Annualisation and growth of costs associated with
2020 acquisitions – no impact beyond 2021
Growth-related expenses:
– Technology - Includes dual-running costs as
infrastructure is modernised, including cloud
migrations, delivering scalable platforms for the
future
– BAU investment for growth including staff hiring to
generate growth and operating expenses associated
with achieving revenue synergies
– Tradeweb operating expense growth to deliver
further top-line growth
Ongoing costs:
– Inflation related to technology and staff costs
– Offset by covid-related underspend (£20m), likely to
unwind in H2
Synergies and cost savings:
– In-year benefits associated with £77m run rate
achieved at H1
– Annualisation of Refinitiv cost saving programme
prior to completion; $650m run rate savings
achieved at the end of 2020 (will not continue post
2021)
Note:
Please refer to slide 18 for direction of cost growth for these cost categories over the medium-term
+1.1%Constant
Currency
Growth
H1 adjusted operating expenses
40
Growth-related operating expenses

|HIGHLY RESTRICTED|
Note:
(1) Excludes income associated with the Borsa Italiana Group divestment, all numbers are on an underlying basis
FY2020 pro-forma P&L
£m FY 2020 (1)
Data & Analytics 4,653
Capital Markets 1,170
Post Trade Services 915
Other 29
Total income (excl. recoveries) 6,767
Recoveries 338
Total income (incl. recoveries) 7,105
Cost of sales (946)
Gross profit 6,159
Adjusted operating expenses (3,023)
Income from equity investments -
Share of profit / (loss) after tax of associates (4)
Adjusted EBITDA 3,132
Underlying depreciation and amortisation (747)
Adjusted operating profit 2,385
Changes to the 2020 pro-forma
As stated in the Financial Review within our FY 2020 Preliminary results, the presented pro-forma
financial information was unaudited and did not include adjustments for intercompany transactions,
reallocations of costs, any fair value adjustments arising out of the purchase price allocation exercise,
any future changes to accounting estimates or judgements, and were therefore subject to change, albeit
not expected to be material.
At LSEG’s Q1 results, an updated pro-forma 2020 was provided for revenue and cost of sales on a
quarterly basis. The revenue was rebased to use a constant FX approach and included the recognition
of sub-lease revenues and elimination of inter-company revenues. For H1, further changes have been
made to our 2020 pro-forma through the application of accounting treatments.
These changes are:
– The application of IFRS 16 leasing treatment which adjusts the costs between depreciation, rental
expenses and financing expense. This increases adjusted operating expenses by £49 million in 2020
and reduces underlying depreciation, amortisation and impairment by £34 million
– For transaction related indemnified costs and incentive plans which are considered as non-underlying
under the Group’s policies. This increases adjusted operating expenses by £11 million
The combined impact of these changes is a £26 million reduction to Adjusted Operating Profit in 2020.
These changes do not impact on our 5-7% revenue target from 2020 pro-forma to 2023, or our mid-
single digit cost growth in 2021 (both on a constant currency basis). The £34 million reduction of
underlying depreciation, amortisation and impairment in 2020, does however impact on our stated
guidance of ~£830m in 2021 as the base is £34m lower in 2020. The Group now expects c.£790 million
for the 2021 full year on a constant currency basis.
41

|HIGHLY RESTRICTED|
Reconciliation of 2020 pro-forma
Pro-forma changes made
at 2021 Q1
Pro-forma changes made at
2021 H1 PRO-FORMA
£m 2020
31-Dec-20Sub-lease
impact(1)Intercompany
impact(2)IFRS16 Leasing
treatment(3)Transaction
related costs(3) Total 31-Dec-20
Data and Analytics 4,675 – (22) – – (22) 4,653
Capital Markets 1,170 – – – – – 1,170
Post Trade 915 – – – – – 915
Other 3 26 – – – 26 29
Total income (excluding recoveries) 6,763 26 (22) – – 4 6,767
Recoveries 340 – (2) – – (2) 338
Total income (including recoveries) 7,103 26 (24) – – 2 7,105
Cost of sales (970) – 24 – – 24 (946)
Gross profit 6,133 26 – – – 26 6,159
Adjusted operating expenses (2,937) (26) – (49) (11) (86) (3,023)
Income from equity Investments - – – – – – –
Share of loss after tax of associates (4) – – – – – (4)
Adjusted EBITDA 3,192 – – (49) (11) (60) 3,132
Underlying depreciation and amortisation (781) – – 34 – 34 (747)
Adjusted operating profit 2,411 – – (15) (11) (26) 2,385
Note:
(1) Income for sub-leases were treated as a positive cost within Refinitiv’s accounts prior to completion. Under LSEG’s policies these are now treated as “Other” income. The effect on this for the FY2020 pro-forma is to add a further £26 million of revenue to this line.
This is offset by an equal increase to underlying operating expenses.
(2) Intercompany revenues and costs between heritage LSEG and Refinitiv businesses, are eliminated in the results post acquisition. The pro-forma results reflect this elimination in all periods. The effect on the FY2020 pro-forma is to reduce total income by £24
million, mainly impacting Data & Analytics and Recoveries revenues but improves Cost of Sales by the same amount. The data agreement between Tradeweb and Refinitiv is eliminated in all periods, in line with previous disclosures.
(3) Refer to slide 41 for further information
42
H1 pro-forma Revenues and KPIs

|HIGHLY RESTRICTED|
H1 pro-forma revenue and KPIs – Data & Analytics(1)
H1 2021 H1 2020
Reported
Variance
%
Annual Subscription Value growth (ASV) (%) (5) 3.9% - -
Subscription Revenue growth (%) (5) 3.1% - -
Index – ETF AUM ($bn) 1,040 669 55%
Index – ESG Passive AUM ($bn)(6) 132 46 187%
Beta Transaction Volumes (m) 285 293 (3%)
Continuing operationsH1 2021
£m
H1 2020
£m
Reported
Variance(2)
%
Constant
Currency
Variance(
3)
%
Constant
Currency
Variance
(excl.
DRAA)(3),(4)
%
Trading & Banking Solutions 744 806 (7.7%) (1.3%) (0.1%)
Trading 599 653 (8.3%) (1.7%) (0.6%)
Banking 145 153 (5.2%) 0.6% 1.9%
Enterprise Data Solutions 557 582 (4.3%) 1.2% 2.4%
Real Time Data 359 384 (6.5%) (0.5%) 0.8%
PRS 198 198 - 5.1% 6.1%
Investment Solutions 558 554 0.7% 7.7% 8.4%
Index - Subscription 247 244 1.2% 7.4% 7.9%
Index - AUM 122 112 8.9% 18.2% 18.2%
Investment solutions data & analytics 189 198 (4.5%) 1.5% 3.6%
Wealth Solutions 238 257 (7.4%) 0.4% 0.8%
Wealth data & analytics 139 138 0.7% 5.0% 5.7%
Beta 99 119 (16.8%) (5.3%) (5.3%)
Customer & Third-Party Risk Solutions 175 136 28.7% 36.0% 37.5%
Total Revenue (excl. recoveries) 2,272 2,335 (2.7%) 3.9% 4.8%
Recoveries 178 164 8.5% (1.1%) (0.6%)
Total Revenue (incl. recoveries) 2,450 2,499 (2.0%) 3.5% 4.5%
Cost of sales (382) (400) (4.5%) 3.6% 3.6%
Gross Profit 2,068 2,099 (1.5%) 3.6% 4.7%
Adjusted operating expenses (988) (1,060) (6.8%) (0.8%) (0.8%)
Adjusted EBITDA 1,080 1,039 3.9% 7.9% 10.1%
Depreciation, amortisation and impairment (280) (264) 6.1% 8.2% 8.2%
Adjusted operating profit 800 775 3.2% 7.8% 10.7%
Adjusted EBITDA Margin 47.5% 44.5%
Note:
(1) Pro-forma assumes that the acquisition of Refinitiv took place on 1 January 2021
for the current financial year and 1 January 2020 for the prior financial year
comparator figure. Both figures exclude the financial contribution from the businesses contained within the Borsa Italiana divestment
(2) Reported variance is the difference between current and prior year periods on a
pro-forma underlying basis, using year-to-date FX rates prevalent at each time,
therefore any changes in the FX rates are also reflected in the variance
percentage alongside business performance
(3) Constant currency variance shows underlying financial performance, excluding
currency impacts, by comparing the current and prior period at consistent exchange rates
(4) The deferred revenue accounting adjustment (DRAA) is explained on slide 38
(5) Growth rates are on a constant currency basis excluding the impact of the deferred
revenue accounting adjustment. There is no prior year comparator
(6) ESG Passive AUM is as at 31 Dec 2020 and prior period comparator is as at 31
December 2019. The metric is updated bi-annually with June 2021 available in
early Q4
44
|HIGHLY RESTRICTED|
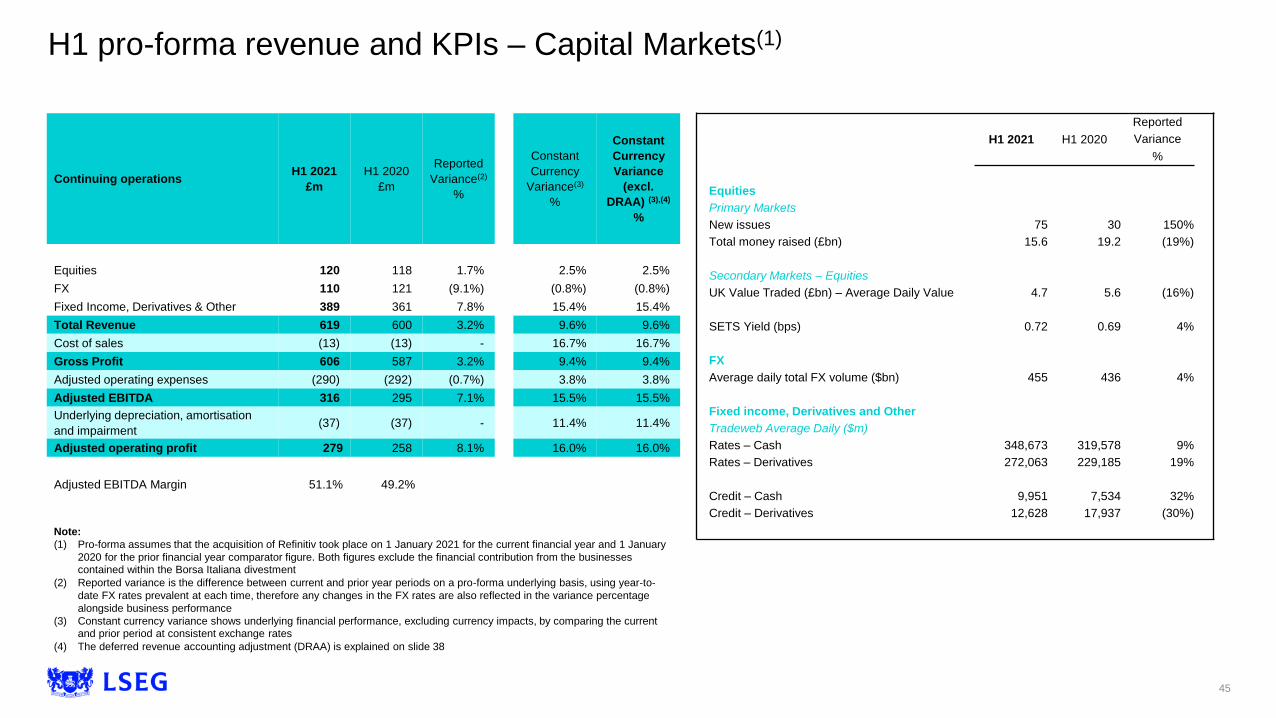
H1 pro-forma revenue and KPIs – Capital Markets(1)
H1 2021 H1 2020
Reported
Variance
%
Equities
Primary Markets
New issues 75 30 150%
Total money raised (£bn) 15.6 19.2 (19%)
Secondary Markets – Equities
UK Value Traded (£bn) – Average Daily Value 4.7 5.6 (16%)
SETS Yield (bps) 0.72 0.69 4%
FX
Average daily total FX volume ($bn) 455 436 4%
Fixed income, Derivatives and Other
Tradeweb Average Daily ($m)
Rates – Cash 348,673 319,578 9%
Rates – Derivatives 272,063 229,185 19%
Credit – Cash 9,951 7,534 32%
Credit – Derivatives 12,628 17,937 (30%)
Continuing operationsH1 2021
£m
H1 2020
£m
Reported
Variance(2)
%
Constant
Currency
Variance(3)
%
Constant
Currency
Variance
(excl.
DRAA) (3),(4)
%
Equities 120 118 1.7% 2.5% 2.5%
FX 110 121 (9.1%) (0.8%) (0.8%)
Fixed Income, Derivatives & Other 389 361 7.8% 15.4% 15.4%
Total Revenue 619 600 3.2% 9.6% 9.6%
Cost of sales (13) (13) - 16.7% 16.7%
Gross Profit 606 587 3.2% 9.4% 9.4%
Adjusted operating expenses (290) (292) (0.7%) 3.8% 3.8%
Adjusted EBITDA 316 295 7.1% 15.5% 15.5%
Underlying depreciation, amortisation
and impairment(37) (37) - 11.4% 11.4%
Adjusted operating profit 279 258 8.1% 16.0% 16.0%
Adjusted EBITDA Margin 51.1% 49.2%
Note:
(1) Pro-forma assumes that the acquisition of Refinitiv took place on 1 January 2021 for the current financial year and 1 January
2020 for the prior financial year comparator figure. Both figures exclude the financial contribution from the businesses contained within the Borsa Italiana divestment
(2) Reported variance is the difference between current and prior year periods on a pro-forma underlying basis, using year-to-
date FX rates prevalent at each time, therefore any changes in the FX rates are also reflected in the variance percentage
alongside business performance
(3) Constant currency variance shows underlying financial performance, excluding currency impacts, by comparing the current and prior period at consistent exchange rates
(4) The deferred revenue accounting adjustment (DRAA) is explained on slide 38
45

|HIGHLY RESTRICTED|
H1 pro-forma revenue and KPIs - Post Trade(1)
H1 2021 H1 2020Reported
Variance
%
OTC
SwapClear
IRS notional cleared ($trn) 468 643 (27%)
SwapClear members 122 122 -
Client trades (‘000) 1,066 997 7%
Client average 10-year notional
equivalent ($trn)4.4 4.0 10%
ForexClear
Notional value cleared ($bn) 10,776 9,844 9%
ForexClear members 35 35 -
CDSClear
Notional cleared (€bn) 1,038 1,398 (26%)
CDSClear members 25 26 (4%)
Securities & Reporting
EquityClear trades (m)(5) 976 1,047 (7%)
Listed derivatives contracts (m) 150.3 191.5 (22%)
RepoClear – nominal value (€trn) 113.4 102.7 10%
Non-Cash Collateral
Average non-cash collateral (€bn) 161.5 156.5 3%
NTI
Average cash collateral (€bn) 106.4 116.3 (9%)
Continuing operations
Reported
H1 2021
£m
Reported
H1 2020
£m
Reported
Variance(3)
%
CCY
Variance(4)
%
OTC Derivatives 169 169 - 2.4%
Securities & Reporting 127 110 15.5% 15.3%
Non-Cash Collateral 46 40 15.0% 17.5%
Net Treasury Income 108 149 (27.5%) (25.3%)
Total Income 450 468 (3.8%) (2.1%)
Cost of sales (2) (58) (73) (20.5%) (20.0%)
Gross Profit 392 395 (0.8%) 1.5%
Adjusted operating expenses(2) (146) (139) 5.0% 4.2%
Adjusted EBITDA 246 256 (3.9%) -
Underlying depreciation, amortisation and
impairment(47) (44) 6.8% 6.7%
Adjusted operating profit 199 212 (6.1%) (1.4%)
Adjusted EBITDA Margin 54.7% 54.7%
Note:
(1) Pro-forma assumes that the acquisition of Refinitiv took place on 1 January 2021 for the current financial year and 1 January
2020 for the prior financial year comparator figure. Both figures exclude the financial contribution from the businesses
contained within the Borsa Italiana divestment
(2) Cost of sales incorporates the elimination of intercompany transactions in the Post Trade division as part of the pro forma
financial disclosure and adjusted operating expenses include centralised group charges allocated to the Post Trade division
as part of the pro forma cost allocation
(3) Reported variance is the difference between current and prior year periods on a pro-forma underlying basis, using year-to-
date FX rates prevalent at each time, therefore any changes in the FX rates are also reflected in the variance percentage
alongside business performance
(4) Constant currency variance shows underlying financial performance, excluding currency impacts, by comparing the current and prior period at consistent exchange rates
(5) EquityClear trades exclude interoperability trades, these will differ to the volumes published on the LCH website which includes these trades
46

|HIGHLY RESTRICTED|
Quarterly pro-forma revenue progression
2020 2021
£m Q1 Q2 Q3 Q4 2020 Q1 Q2
Trading & Banking Solutions 396 410 399 391 1,596 372 372
Trading 321 332 322 316 1,291 300 299Banking 75 78 77 75 305 72 73
Enterprise Data Solutions 285 297 290 291 1,163 277 280
Real-Time Data 187 197 191 191 766 177 182PRS 98 100 99 100 397 100 98
Investment Solutions 272 282 278 279 1,111 272 286
Index - Subscription 118 127 125 125 495 121 126Index - Asset Based 58 54 56 57 225 58 64Investment solutions data & analytics 96 101 97 97 391 93 96
Wealth Solutions 126 131 123 120 500 122 116Wealth data & analytics 66 72 71 69 278 69 70Beta 60 59 52 51 222 53 46
Customer & Third-Party Risk Solutions 67 69 69 78 283 85 90
Data & Analytics 1,146 1,189 1,159 1,159 4,653 1,128 1,144
Equities 62 56 52 57 227 61 59
FX 64 57 56 57 234 57 53
Fixed Income, Derivatives & Other 186 175 170 178 709 201 188
Capital Markets 312 288 278 292 1,170 319 300
OTC Derivatives 87 82 80 85 334 87 82
Securities & Reporting 59 51 58 62 230 65 62
Non-Cash Collateral 19 21 21 21 82 22 24
Net Treasury Income 67 82 63 57 269 55 53
Post Trade 232 236 222 225 915 229 221
Other 11 6 6 6 29 5 10
Total Income (excl. recoveries) 1,701 1,719 1,665 1,682 6,767 1,681 1,675
Recoveries 87 77 82 92 338 88 90
Total Income (incl. recoveries) 1,788 1,796 1,747 1,774 7,105 1,769 1,765
Cost of sales (242) (244) (228) (232) (946) (231) (223)
Gross Profit 1,546 1,552 1,519 1,542 6,159 1,538 1,542
47

London Stock Exchange Group plc
10 Paternoster Square
London
EC4M 7LS
Paul Froud
Group Head of Investor Relations
Tel: +44 (0)20 7797 1186
email: [email protected]
Chris Turner
Investor Relations Director
Tel: +44 (0)77 6993 1614
email: [email protected]
Gaurav Patel
Investor Relations Senior Manager
Tel: +44 (0)20 7797 1154
email: [email protected]
Ian Hughes
Investor Relations Manager
Tel: +44 (0)20 7797 3334
email: [email protected]
Contacts and further information
For investor relations information:
www.lseg.com/investor-relations
For Corporate Sustainability information:
www.lseg.com/investor-relations/sustainability