results presentation & investor discussion pack...results presentation and investor discussion...
TRANSCRIPT

Results Presentation and Investor Discussion PackFor the full year ended 30 June 2019

Results Presentation 3
Group Overview 32
Good Business Practice 45
Financial Overview 55
Home & Consumer Lending 81
Business & Corporate Lending 94
Deposits, Funding & Liquidity 105
Capital 111
Economic Overview 122
Sources, Glossary & Notes 131
2Commonwealth Bank of Australia | ACN 123 123 124 |
1
2
3
4
5
6
7
8
9
Contents
10

3
Results Presentation1
Commonwealth Bank of Australia | ACN 123 123 124 | 7 August 2019
Matt Comyn Chief Executive Officer
Alan Docherty Chief Financial Officer
Commonwealth Bank, South Eveleigh building, NSW

4
Commonwealth Bank of Australia | ACN 123 123 124 | 7 August 2019
Results Presentation
Matt Comyn, Chief Executive Officer

► Responding to a challenging operating context
Cash NPAT - 4.7%
Impacted by - remediation, fee removals, risk & compliance
5
► Disciplined execution
Simpler - progress on divestments
Better - cultural change, better customer outcomes
Best in digital - leadership position further strengthened
Overview
► Delivering strong core outcomes
Highlighted by - balance sheet, surplus capital, franchise strength

A simpler bank
6
Core
~95%
Group NPAT FY19
GAM completion
CMLA progress
10.7%
Jun 19 Pro-forma1
10.5%unquestionably
strong
Strong pro-forma
CET1 of 11.8%
CET1
11.8%
Includes
divestments
~130bpts
1. Pro-forma includes divestments and the impact of regulatory changes. Completion of divestments subject to regulatory approvals and conditions. 2. Operating expenses to total operating income.
< 40%
FY19 Future
46.2% More to do on costs -
targeting sub 40%
cost-to-income
Elevated risk and
compliance spend
$1.3bn$1.4bn
FY18 FY19
50%
50%
64%
36%
Risk & Compliance
Better
Customer Outcomes
FY19 Annualised
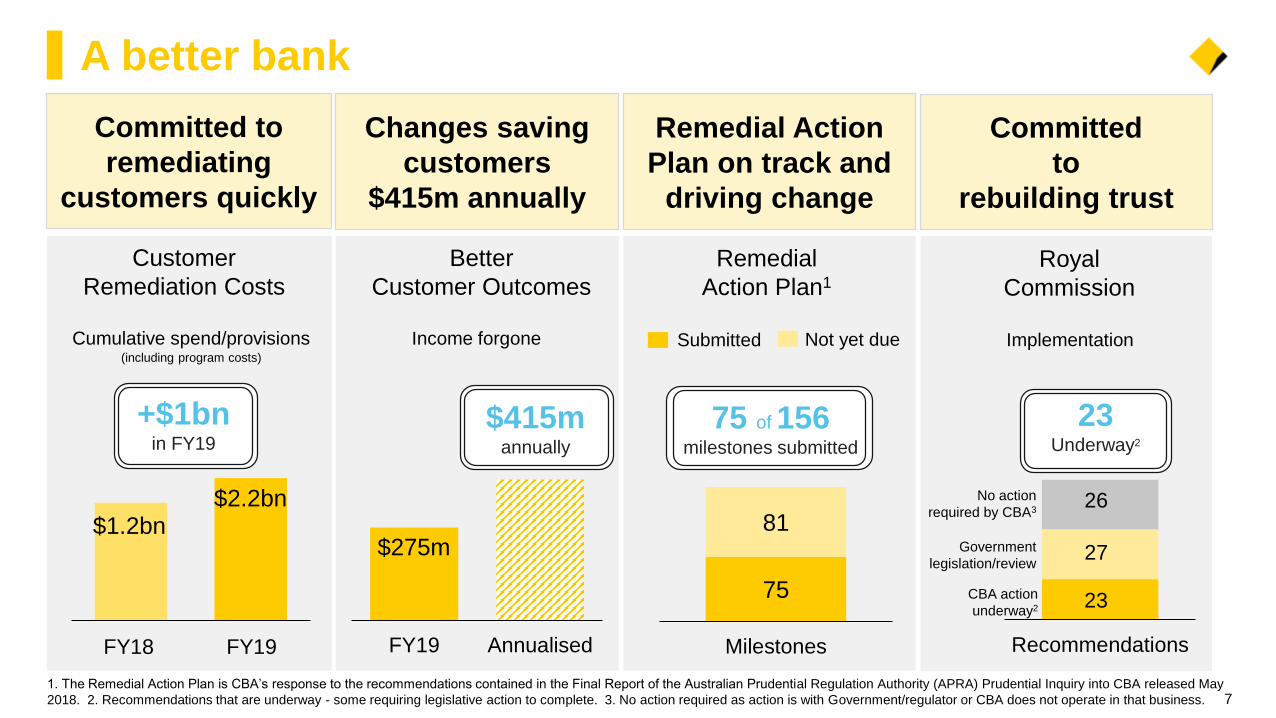
A better bank
7
Customer
Remediation Costs
Cumulative spend/provisions(including program costs)
FY19FY18
$2.2bn$1.2bn
$275m
Income forgone
Remedial
Action Plan1
75
81
Milestones
Submitted Not yet due
Royal
Commission
Committed to
remediating
customers quickly
Changes saving
customers
$415m annually
Committed
to
rebuilding trust
$415m annually
75 of 156 milestones submitted
23 Underway2
Recommendations
+$1bnin FY19
Government
legislation/review
CBA action
underway2
No action
required by CBA3
23
26
1. The Remedial Action Plan is CBA’s response to the recommendations contained in the Final Report of the Australian Prudential Regulation Authority (APRA) Prudential Inquiry into CBA released May
2018. 2. Recommendations that are underway - some requiring legislative action to complete. 3. No action required as action is with Government/regulator or CBA does not operate in that business.
27
Implementation
Remedial Action
Plan on track and
driving change

8
“Better for you”
Business
Financial
Assistance
team
Smart
Alerts
Book home loan
appointments
digitally
24/7 fraud
monitoring
Emergency
savings
tool
Alipay
Business
Smart
Alerts 100%
security
guarantee
App
relaunch
Regional
support
in hard times
World’s largest
financial
education
programBenefits
finder
Apple
Pay
2019
Green
mortgage
Calendar year

9
Leading in innovation
CommSec Pocket Tax Refunds
Invest with as little as $50,
with very low brokerage
from $2 per trade
Notifies when refund is
received and provides
suggestions on how to use it
Pay with your CommBank
card and receive personalised
cashback rewards
CommBank Rewards

10
Best in digital
Relaunched –
personalised experiences,
customisable features
CommBank app
Protecting customers
from unauthorised
transactions, 24/7
100% security guarantee
Finding unclaimed
rebates and benefits for
our customers
Benefits finder

11
Best in digital
1, 2, 3, 4, 5, 6, 7. Refer to notes at the back of this presentation for further source information.
#1
Active digital
customers27.0m
in Australia (Forrester)6
#1
#1
Digital transactions% of total transactions
- by value1
63%
#1
Online banking (Canstar - 10yrs in a row)3
Mobile banking (Canstar - 4yrs in a row)4
Most Innovative
Major Bank(DBM Aust. Financial Awards)554%
59%
Jun 17 Jun 18 Jun 19
Customer’s likelihood to recommend main financial
institution based on use of internet banking services
via mobile app7
Net Promoter Score#1
+10
+20
+30
+40
Dec17
Jun 18 Dec18
Jun 19
Peers
CBA
+37.2
Dec 17 Jun 18 Dec 18 Jun 19

This result1
12
Statutory profit ($m)
Cash NPAT ($m)
ROE (cash, %)
CET1 (%)
EPS (cash, cents)
Dividend per share ($)
FY19 vs
FY18
1. Statutory profit, CET1 and Dividend per share include discontinued operations. Cash NPAT, ROE and EPS are on a continuing operations basis.
FY19
8,571
8,492
12.5%
10.7%
481c
4.31
(8.1%)
(4.7%)
(110)bpts
+60bpts
(29c)
Flat

24,91424,407
FY18 FY19
10,995 11,269
FY18 FY19
1516
FY18 FY19
8,9158,492
FY18 FY19
13
Key outcomes1
13
Operating
Income
Operating
ExpensesLoan Impairment
Expense $m
1. Presented on a continuing operations basis.
Cash
NPAT
-2.0% +2.5% -4.7%+1 bpt
• Core volume growth
• NIM –5bpts (2H flat)
• Fee changes
• Weather events
• Remediation costs
• Elevated risk/compliance
• Investment spend +9%
• Simplification savings
• Generally benign
• Pockets of stress
• TIA higher
• Elevated PL arrears
bpts of GLAA$m$m

155,147
162,767
169,648
Jun 18 Dec 18 Jun 19
+9%
68% 69%
69%
Jun 18 Dec 18 Jun 19
621 635
Jun 18 Jun 19
+2%
+4% +4% (12%)
HomeLending
BusinessLending
Insto.Lending
Franchise strength
14
Group Lending
Group Deposits5 Deposit Funding
Lending Growth2 Home Lending GrowthCBA growth as a multiple of system growth4
Transaction Balances5
1. Spot balances. 2. Jun 19 vs Jun 18. 3. Includes NZ. 4. Growth over 6 month period. System source: RBA Lending and Credit Aggregates, adjusted for new market entrants. CBA includes
Bankwest and subsidiaries. 5. Includes non-interest bearing deposits.
3
$m
0.6x
0.9x
1.3x
Jun 18 Dec 18 Jun 19
$bn
$bn
747 760
Jun 18 Jun 19
+2%

1,170 1,071
FY18 FY19
1,072 1,122
FY18 FY19
2,845 2,658
FY18 FY19
Business Units1
151. Presented on a continuing operations basis. 2. Includes Bankwest and Commonwealth Financial Planning, excludes General Insurance and Mortgage Broking consolidation.
$m
(7%) (8%)
Cash NPAT
+5%(10%)
RBS BPB IB&M NZ (NZD)
4,703
4,234
FY18 FY19
2
Jun 18 Jun 19 Jun 19Pro-forma
3
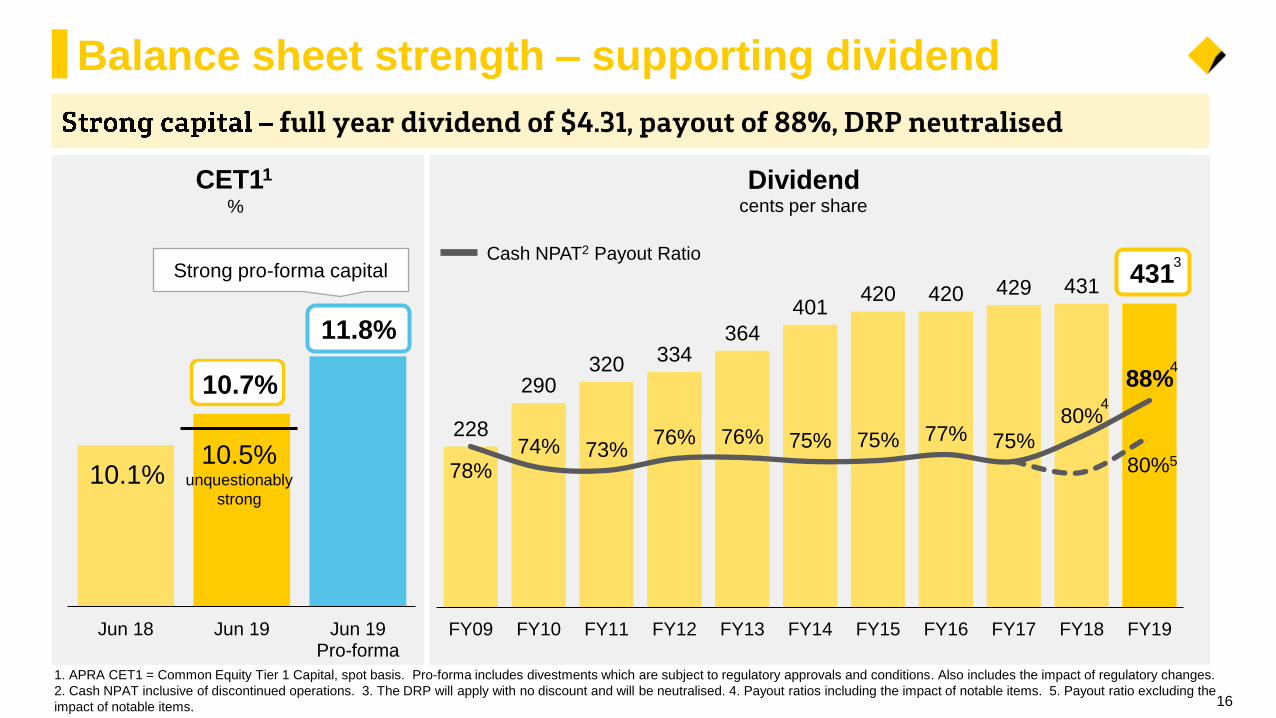
Balance sheet strength – supporting dividend
16
cents per share
Cash NPAT2 Payout Ratio
DividendCET11
%
10.5% unquestionably
strong
10.7%
Strong pro-forma capital
1. APRA CET1 = Common Equity Tier 1 Capital, spot basis. Pro-forma includes divestments which are subject to regulatory approvals and conditions. Also includes the impact of regulatory changes.
2. Cash NPAT inclusive of discontinued operations. 3. The DRP will apply with no discount and will be neutralised. 4. Payout ratios including the impact of notable items. 5. Payout ratio excluding the
impact of notable items.
11.8%
4
228
290320 334
364
401420 420 429 431
431
80%578%
74% 73%76% 76% 75% 75% 77% 75%
80%
88%
FY09 FY10 FY11 FY12 FY13 FY14 FY15 FY16 FY17 FY18 FY19
4
4
10.1%

17
Commonwealth Bank of Australia | ACN 123 123 124 | 7 August 2019
Results Presentation
Alan Docherty, Chief Financial Officer

18
Summary
Disciplined
execution
Delivering
strong core outcomes
► Customer focus
► Appropriate risk appetite
► Balance sheet settings
► Risk-adjusted returns
► Home loans +4%
► Transaction deposits +9%
► Deposit funding 69%
► Surplus capital, stable dividend
Responding
to challenges
► Customer remediation
► Lower interest rates
► Softer housing market
► Business simplification
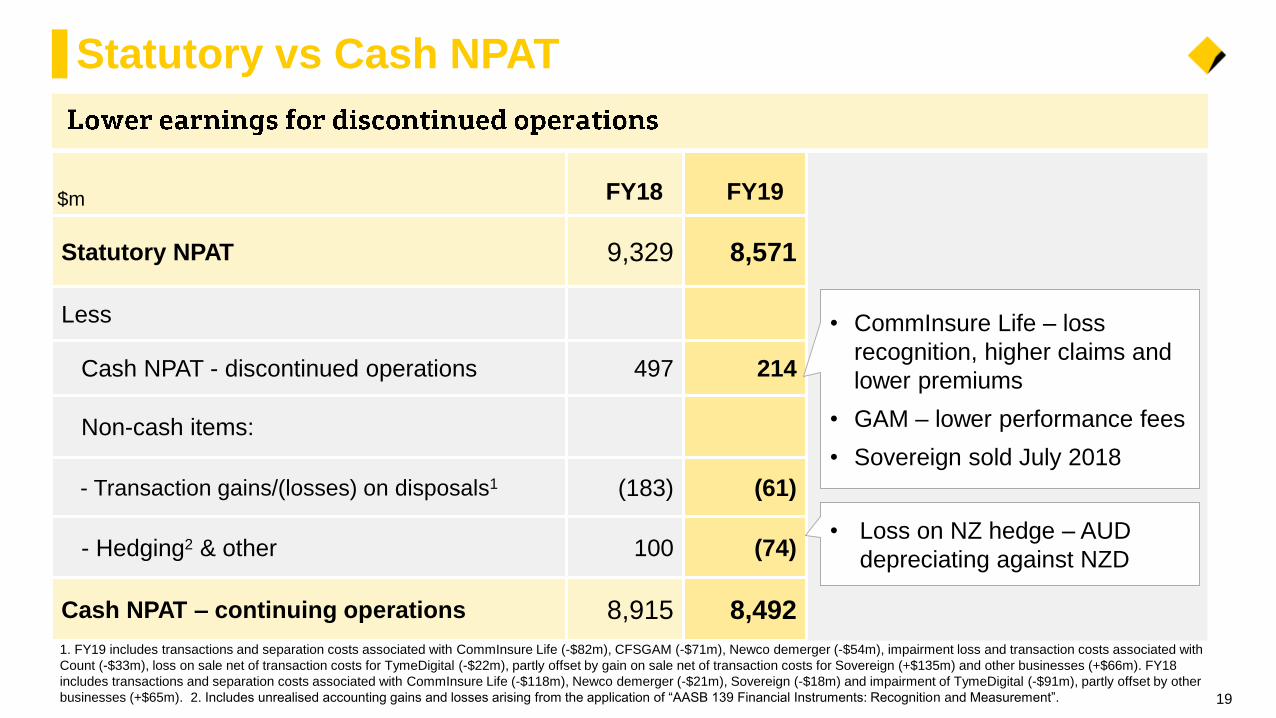
Statutory vs Cash NPAT
19
$m
Statutory NPAT 9,329 8,571
Less
Cash NPAT - discontinued operations 497 214
Non-cash items:
- Transaction gains/(losses) on disposals1 (183) (61)
- Hedging2 & other 100 (74)
Cash NPAT – continuing operations 8,915 8,492
FY18 FY19
• Loss on NZ hedge – AUD
depreciating against NZD
• CommInsure Life – loss
recognition, higher claims and
lower premiums
• GAM – lower performance fees
• Sovereign sold July 2018
1. FY19 includes transactions and separation costs associated with CommInsure Life (-$82m), CFSGAM (-$71m), Newco demerger (-$54m), impairment loss and transaction costs associated with
Count (-$33m), loss on sale net of transaction costs for TymeDigital (-$22m), partly offset by gain on sale net of transaction costs for Sovereign (+$135m) and other businesses (+$66m). FY18
includes transactions and separation costs associated with CommInsure Life (-$118m), Newco demerger (-$21m), Sovereign (-$18m) and impairment of TymeDigital (-$91m), partly offset by other
businesses (+$65m). 2. Includes unrealised accounting gains and losses arising from the application of “AASB 139 Financial Instruments: Recognition and Measurement”.

FY19 result1
20
–
1. Presented on a continuing operations basis.
FY19
$m
FY19 vs
FY18
Operating Income 24,407 (2.0%)
Operating Expense 11,269 2.5%
Operating Performance 13,138 (5.6%)
Loan Impairment Expense 1,201 11.3%
Cash NPAT 8,492 (4.7%)

24,914
24,407 47
(222)
(194)
(138)
FY18 NetInterestIncome
OtherBankingIncome
Funds &Insurance
MortgageBroking
Consolidation
FY19
-1.2%
-3.9%
-10.2%-2.0%
Operating income down 2.0%1
21
$m
1. Presented on a continuing operations basis. 2. Average balances. 3. Excludes Mortgage Broking consolidation. 4. Includes impact of AHL consolidation and implementation of AASB 15.
3 3 4
• Core volume growth
• Margin -5bpts (flat 2H19)
• NSW/Vic storms, Qld floods
• Lower advice fees
• FUA growth +6.0%
3%
7%
4%
-8%
Home Loans
Transactions
Business Loans
Insto. Loans
Volume Growth2
• Better Customer Outcomes - fee removals (118)
• Institutional lending fees - AASB 15 (73)
67185 1953
90220
FY18 FY19 Annualised
OBI
NII & FMI275
70
Better Customer Outcomes$m
415

210 210
1 1(1) (1)
1H19 AssetPricing
DepositPricing
PortfolioMix
Capitaland
Other
2H19
Group margin1
22
1. Presented on a continuing operations basis. Comparative information has been restated to conform to presentation in the current period. 2. Estimated impact of the RBA’s cash rate cuts in June
and July 2019 on Group NIM, including the deposits impact, lower expected replicating portfolio and equity hedge benefits, and flow through of announced home loan repricing. Excludes impact of
any future cash rate movements.
bpts
This half
Flat
Higher
deposit
funding
Lower
earnings
on free
equity
Home Loans:
Switching (2)
Discounting (2)
SVR +4
Lending Mix +1
bpts
AASB 16 (1)
Cash Rate2 (4)
210
216 214
210 210
2H17 1H18 2H18 1H19 2H19
bpts
Last 5 halves
FY20 Headwinds

977
158 259
(930)
(190)
10,99511,269
6,000
7,000
8,000
9,000
10,000
11,000
12,000
FY18 Prior period one-offs/
Other
CustomerRemediation, Risk
& Complianceprograms
Enhanced risk capability
Staff, IT, andOther excl.
notable items
BusinessSimplification
FY19
Operating expenses up +2.5%1
2
3
$m
+2.5%
23
Notable
items
• Business simplification
• Optimising distribution footprint
• Operating model & cost discipline
Wage inflation and IT increases
4
+600 FTE
+2.4%(ex notable items)
Strategic Targets
• Absolute cost reduction
• Sub 40% Cost:Income
1. Presented on a continuing operations basis. 2. Prior period = FY18. 3. Represents FY19 total customer remediation costs of $996m ($918m recognised in continuing operations operating
expenses), less FY18 total customer remediation costs of $131m ($52m recognised in continuing operations operating expenses). Also includes movement in risk and compliance programs of
$111m. 4. Excludes staff, IT and other costs related to notable items, enhanced risk and resiliency capability and simplification.
Remediation +$866m
+450 FTE
($700m) AUSTRAC penalty
($155m) Regulatory Costs
($145m) AUSTRAC insurance
$70m Mortgage Broking Consolidation
prior period

1. Total provisions divided by credit risk weighted assets. 2. Source: APRA Monthly Banking Statistics. Total deposits (excluding CDs). CBA includes Bankwest. 3. Quarter average.
Balance sheet resilience
24
$bn
Household
Other
Total Provision
Coverage1
Deposit Balances2 LCR3 CET1
Credit Risk Funding Liquidity Capital
• Disciplined approach
• Higher AASB 9 provisioning
• Peer leading deposits
• Stable NSFR 112%• Sound liquidity position
• LCR well above minimum
• Unquestionably strong
• Neutralisation of DRP
10.1%
10.7%
Jun 18 Jun 19
133%
132%
Jun 18 Jun 19
0.98%
1.29%
Jun 18 Jun 19
264
215 132 118
235
211
211 155
CBA Peer 3 Peer 2 Peer 1
273
343
426
499

73
41
2521 20
16 1619
15 15 16
25
Credit risk
1. Cash Loan Impairment Expense as a percentage of average Gross Loans and Acceptances (GLAA) (bpts). 2. FY09 includes Bankwest on a pro-forma basis. 3. Includes Other.
Loan Loss Rate1 - Group
FY18 FY19
RBS 16 17
BPB 14 21
IB&M 7 2
ASB 10 13
Group3 15 16
Loan Loss Rate1 – Divisions
bpts
TIA
$bn
% of
TCE
• Single name exposures
• Emerging signs of weakness -
discretionary spending, agriculture
and construction
BPB – Small number of larger impairments
IB&M – Ongoing portfolio optimisation
Consumer 17
Corporate 14
Group 16
0.60% 0.62% 0.72%
3.3 3.14.2
3.2 3.63.6
6.5 6.7
7.8
Jun 18 Dec 18 Jun 19
Gross
impaired
Corporate
troublesome
2

Arrears1
Credit risk – consumer credit quality & provisions
261. Group consumer arrears including New Zealand. 2. Excludes Reverse Mortgage, Commonwealth Portfolio Loan and Residential Mortgage Group loans. 3. Collective provisions divided by
credit risk weighted assets.
%
90+ days
Collective ProvisionsProvision Coverage3
$m
0.75% 1.05%
Consumer
Corporate1,235 1,488
1,528
2,416
2,763
3,904
Jun 18AASB 139
Jun 19AASB 9
vv
1.41%
1.21%
1.44%
1.44%
1.56%
1.03%0.88%
1.03%
0.94%1.02%
0.60% 0.59%0.70% 0.67% 0.68%
Jun 17 Dec 17 Jun 18 Dec 18 Jun 19
Personal Loans
Home Loans2
Credit Cards

v
0.5%
1.0%
1.5%
2.0%
2.5%
3.0%
Indicative Funding Costs2
Jun 18 Dec 18 Jun 19
Wholesale funding
1. Long term wholesale funding (>12 months). 2. Indicative funding costs across major currencies. Represents the spread in BBSW equivalent terms on a swapped basis.
Long Term FundingWeighted Average Maturity (WAM), Years1
27
5.0
66% Long
Term
5.1
67% Long
Term
5.1
New issuance (FY19)
Portfolio
6.5
66% Long
Term
Jun 10 Jun 19
10yr market
funding cost
5yr market
funding cost
Dec 18

87
1(18)
(80)
10.1%
10.8%
Jun 18 Dec 18 1H19Dividend
CashNPAT
RiskWeighted
Assets
Other Jun 19
Capital
28
CET1, bpts
Credit Risk (8)
IRRBB 9
Market Risk (12)
Op Risk (7)
10.5% unquestionably
strong
-10bpts in 2H19
1. Organic capital generation is Cash NPAT less dividends (net of DRP) and underlying RWA (excluding major regulatory treatments). 2. Historical average since implementation of Basel III in 2013.
3. Cash NPAT includes -$855m (pre-tax) in notable items, comprised of customer remediation costs (-$639m), risk and compliance uplifts (-$216m).
3
notable items3
neutralisation
10.7%
35 39
24 16
59 55
Historical Average FY19
Organic Capital Generation1 (bpts)
2
DRP
(absorbing -18 bpts of notable items & -13 bpts interim dividend DRP neutralisation)

~130
(18)
Jun 19 Divestments RegulatoryChanges
Pro-forma
Capital
29
CET1 bpts
CFSGAM
CommInsure Life
BoCommLife
PTCL
10.5% unquestionably
strong
Capital Management
• Strong capital position due to
divestments
• FY19 dividend maintained and
DRP neutralised
• Creates flexibility for the Board
in its consideration of capital
management initiatives
timing
1. Estimated CET1 increases from previously announced divestments. Divestments not yet completed are subject to regulatory approvals. The sale of BoCommLife is a condition precedent for the
sale of CommInsure Life. 2. APS 180: Standardised approach for measuring counterparty credit risk exposures (SA-CCR) and AASB 16: Leasing. 3. APRA proposal for a simpler method for
calculating capital requirements for residential mortgages. Whilst proposed changes are expected to have a minimal impact on CET1, this remains subject to consultation and calibration. 4. RBNZ
capital proposals subject to finalisation – not expected to change reported Level 2 CET1 and manageable at Level 1 CET1 (within APS222 capacity limits). 5. APRA requirement for an additional 3%
in Total Capital by 1 January 2024 – expected to be largely satisfied by Tier 2 issuance.
1
10.7% SA-CCR2
AASB 162
HL RWA3 -
RBNZ4 -
LAC5 -
11.8%
timing
bpts
bpts
* Expected completion - financial years
(7) Jul-19
(11) Jul-19
Jan-22
TBD
Jan-24
68 Aug-19
~38 1H20*
18 1H20*
7 1H20*

► Lower growth environment
► Housing market improving
► Unemployment likely to remain low
► Pipeline of stimulus: tax cuts and infrastructure
► Support from population growth and commodity prices
► Household income growth is key
30
Economic outlook
31
► Sustainable outcomes in a challenging environment
► Strong foundations: franchise, digital, balance sheet
► Build deeper, more trusted relationships
► Simpler bank – lower risk and lower cost
► Drive strong capital generation
► Invest for the long term; return excess to shareholders
Summary

Group Overview2
We are Australia’s leading bank, with over 48,000
employees serving over 17 million customers“
”

33
Largestbanking franchise
Bestin digital
Leadingmarket shares
Strongbalance sheet
• Customers1 >17m • Mobile app NPS8 #1• MFI share4 #1
• Digital customers2 7m • Internet banking NPS9 #1• Home loans5 #1
• Branches 1,172
• Collaborative innovation
• Household deposits6 #1
• ATMs 3,963 • Credit cards6 #1
• Staff3 48.2k • Business customers7 #1
• Real-time core
• CET1 10.7%
• Deposit Funded 69%
• Total assets $977bn
• NSFR 112%
• Credit ratings11 AA-/Aa3/AA-
• Digital logons per day10 7.4m
Who we are
1, 2, 3, 4, 5, 6, 7, 8, 9, 10, 11. Refer to notes at the back of this presentation for further source information.

34
Supported by stronger capabilities
Execution priorities
Our strategy
Operational risk
and complianceData and analytics
Innovation
Simplify our business
Lead in retail and commercial banking
Best in digital
Cost reduction
To deliver balanced and
sustainable outcomes
Become a simpler, better bank for our customers
People
Energised,
accountable
Community
Trusted and
reputable
Shareholders
Long-term
sustainable
returns
Customers
Better
outcomes

35
Delivering long-term sustainable returns
● Leading franchise
● Largest customer base
● Broadest distribution network
● Technology leader
● Strong balance sheet
● Unquestionably strong capital
● 69% deposit funded
● Conservative business settings
● Divesting non-core
● Reduced business complexity
● Better risk outcomes
● Surplus capital
● Focus on core
● Innovation and simplification
● Absolute cost reduction
● Better customer outcomes
● Strong growth
● Seek opportunities to invest in core
● Target sub 40% cost-to-income
● Organic capital generation
● Sustainable returns
● Efficient management of surplus capital
● Sustainable dividend per share
● Long term payout ratio 70-80%

Sovereign Completed Jul 18
TymeDigital Completed Nov 18
CFSGAM Completed Aug 19
BoCommLife Expected Completion 1H20
CommInsure Life Expected Completion 1H20
PTCL Expected Completion 1H20
Aligned Advice:
- Count Financial Expected Completion 1H20
- Financial Wisdom Assisted Closure
- CFP-Pathways Cessation
General Insurance Strategic Review
VIB Strategic Review
CFS & Mortgage Broking3 Intention to exit
A simpler bank – divestments/reviews
36
Core
~95%
Group NPAT FY19
1. Completion of divestments subject to regulatory approvals. The sale of BoCommLife is a condition precedent for the sale of CommInsure Life. Expected completion dates in financial
years. 2. Pro-forma includes divestments of CFSGAM, BoCommLife, CommInsure Life, PTCL and the impact of regulatory changes. 3. Includes Colonial First State, Aussie Home Loans
(AHL) and CBA’s minority shareholding in ASX-listed Mortgage Choice.
10.7%
Jun 19 Pro-forma2
10.5%Unquestionably
strong
CET1
11.8%
Includes
divestments1
~130bpts

A simpler bank – cost reduction
371. Operating expenses to total operating income. 2. FY18 headline operating expenses excluding AUSTRAC penalty of $700m.
FY18Cost Base
FutureCost Base
Future
Cost Base
Core Reduction Reinvestment
Growth &
Inflation
Elevated
compliance/
remediation
Non-core
46.2%
< 40%
FY19 Future
Cost-to-Income
Future Cost Base
Starting
Cost Base
1
Focus Approach
Embed better
cost discipline
Tighten discretionary spend and
realise cost benefits of portfolio
changes
Simplify
technology
Simplify IT architecture and reduce
the unit costs of technology
Make it simpler
for customers to
bank with us
Ongoing digitisation benefits
Make it simpler
for our people Simpler operating model
2

38
Our contribution in FY19
of new lending for
Australian home buyers
of new lending for
Australian businesses
salaries and
superannuation paid
women in
leadership roles
of training hours
per employee
of our people
working flexibly
students provided with
financial education
CommBank Foundation
community grants
low carbon financing
employee pro-bono
and volunteering hours
dividend per avg
retail shareholder
return on equity
(cash basis)
paid in dividends
Total Shareholder
Return (1 year)
$92bn
$36bn 39.1%
25.2
73.9%
$5.9bn 427k
236
18k
$5.1bn
$3,702
12.5%
21%
$7.6bn
new transaction accounts
opened for customers
of forgone revenue
benefiting customers
1.2m
$275m

-30
-10
10
30
50
70
Jun 19Jun 18Jun 17-20
-15
-10
-5
0
5
10
15
20
34.4%
35.6%
Jun 18 Jun 19
21% 31% 35%
1yr 3yr 5yr
CBA Pulse Score
Average of peer companies
39
Delivering for all our stakeholdersCustomers
People
1, 2, 3, 4, 5, 6, 7. Refer to notes slide at back of this presentation for source information.
Customers
Community
Customers
Shareholders
Customers
Shareholders
+34.4
72%67%
68%
CBAMar 18
CBAOct 18
CBACurrent
Employee engagement5 Reputation score6
2008 2015 20182012 2019
60.6
431 431
FY18 FY19
DPS (cents)
Dividend
maintained
Dividend Total Shareholder Return7
MFI Share2
-10.0
Consumer NPS1
Jun 19Jun 17Jun 15
CBAPeers
-35
-30
-25
-20
-15
-10
-5
0
Jun 19Jun 18Jun 17Jun 16
Business NPS3
-22.4
CBAPeers CBAPeers
Institutional NPS4
(Turnover $300m+ pa)CBA Jun 19 CBA Jun 19 CBA Jun 19
CBA Jun 19

40
35.6%
17.6% 12.7% 11.2%
CBA Peer 1 Peer 2 Peer 3
1. MFI Share measures the proportion of Banking and Finance MFI Customers that nominated each bank as their Main Financial Institution. Main Financial Institution (MFI) definition: In the Roy
Morgan Single Source Survey MFI is a customer determined response where one institution is nominated as the primary financial institution they deal with (when considering all financial products
they hold). Peers includes ANZ Group, NAB Group and Westpac Group (including St George Group). CBA Group includes Bankwest. Source: Roy Morgan’s Single Source survey conducted by Roy
Morgan, Australian population 14+ (12 month average to June 2014, 12 month average to June 2018 & 12 month average to June 2019).
Aged 14-17 Aged 25-34 Aged 35-49 Aged 50-64 Aged 65+Aged 18-24
CBA MFIShare
Starting out Spending
or saving
Paying
off debt
Wealth
accumulatorsPre-retirees RetireesYouthCustomer
Lifecycle
Jun 14
Jun 18
Jun 19
MFI share1CBA MFI share1
33.1% 34.4% 35.6%
Jun 14 Jun 18 Jun 19
Lead in retail banking
42.5%
48.9% 48.1%
32.1%27.8%
27.7%

41
BizExpress Daily IQ
Same day lending decisions
for unsecured loans up to
$250,000 and secured loans
up to $1 million1
Simpler, faster loansof new lending for Australian
businesses2$36bnof new lending to Small
Businesses3$8bn
Unique business insights
Optimise your cash flow, compare
key performance metrics to your
industry, identify business risks,
and compare consumer spending
Business Bankers and
Specialists4>2,300
>2401. BizExpress is available to eligible existing CBA customers. 2. Includes Commercial Lending, Asset Finance and Institutional Lending (excluding other interest earning lending assets, primarily
Cash Management Pooling Facilities, Leasing, Trade Finance, and Debt Markets). 3. A subset of total new lending for Australian businesses. 4. Business and Private Banking (BPB), excludes
Bankwest and Institutional Banking.
Lead in commercial banking
Locations supporting Business
Banking customers4
Better Service

Best in digital
42
1, 2, 3, 4, 5, 6, 7, 8, 9. Refer to notes slide at back of this presentation for source information. 1. The Forrester Banking Wave™ is copyrighted by Forrester Research, Inc. Forrester and Forrester
Wave™ are trademarks of Forrester Research, Inc. The Forrester Banking Wave™ is a graphical representation of Forrester's call on a market. Forrester does not endorse any company, product, or
service depicted in the Forrester Banking Wave™. Information is based on best available resources. Opinions reflect judgment at the time and are subject to change.
Forrester Banking WaveTM: Global Mobile Apps
Asia Pacific 20181
A global mobile banking leader
3.0 3.4 3.7 4.1 4.4 4.8 5.0 5.3
Jun15
Dec15
Jun16
Dec16
Jun17
Dec17
Jun18
Dec18
Jun19
CommBank app users
Monthly unique customers (m)8
51 52 52 53 54 56 59 60
Jun15
Dec15
Jun16
Dec16
Jun17
Dec17
Jun18
Dec18
Jun19
Digital transactions
% of total transactions - by value9
Recognition and engagement
Mobile app
Net Promoter Score2#1
Online banking (Canstar - 10 years in a row)3#1
Mobile banking (Canstar - 4 years in a row)4#1
Ranked in Australia(Forrester)5#1
Most Innovative Major Bank(DBM Australian Financial Awards)6#1
Best Major Digital Retail Bank(DBM Australian Financial Awards)7#1
5.6m
63%

Best in digital
43
•Relaunched app – personalising the app
and simplifying feature discovery
•Siri shortcuts – using voice to speed up
everyday banking activities
•Apple Pay – providing a fast, easy and
secure way to make tap and pay payments
•CommBiz eTokens – enabling quicker and
more convenient CommBiz authentication
•Benefits finder – connecting customers with
unclaimed rebates and benefits
•Money management – empowering customers
via Cash Flow View and Goal Tracker
•Proactive alerts – reminding customers with
notifications to avoid unnecessary fees
•Supporting communities – raising $4m via
the app to help drought affected farmers
•Location security – enhancing fraud
detection when customers log into the app
•Customer control – simplifying security
management into one place
•Trusted banking – protecting customers
with the latest in cyber technology
•Education initiatives – helping customers
to stay safe online

Best in digital
44
NetBank • Full functionality 24-hour online
banking service
• #1 online banking 10 years in a
row since 2010 (Canstar)1
Ceba• AI-powered chatbot to assist
with 380 banking tasks
• Innovation award winner
(Gartner)4
1. CBA awarded #1 in Online Banking by Canstar 10 years in a row since 2010. 2. CBA awarded #1 in Mobile Banking by Canstar 4 years in a row since 2016. 3. The Forrester Banking WaveTM:
Australian Mobile Apps, Q2 2019. Commonwealth Bank of Australia received the highest industry WaveTM overall score among mobile apps in Australia in Forrester's proprietary Industry WaveTM
evaluation. Forrester Research does not endorse any company included in any Industry WaveTM report and does not advise any person or organization to select the products or services of any
particular company based on the ratings included in such reports. 4. CBA recognised as a Gartner Eye on Innovation award winner for Ceba. Awarded October 2018. 5. CBA awarded the Pega
Global Innovation Award in June 2019 and June 2017.
Relaunched CommBank app• Personalised look and feel
• Customisable home screen and
notifications
Blockchain• CBA platform enables global first
blockchain bond by World Bank
• CBA and Data61 proof of concept
on programmable payments for
the NDIS
CommSee• Proprietary customer
relationship system
• Single view of customer
across all channels
Core banking • Real-time banking and settlement
• Standardisation and system simplification
• Greater reliability
• Enables real-time digital functionality
Customer Engagement Engine• >200 machine built adaptive models
• Learning from >600m customers interactions
• Enabling Next Best Conversations
• Utilising 157 billion data points
• More accurate and tailored communications
• Pega Global Innovation Award5
CommBank app • #1 mobile banking 4
years in a row since
2016 (Canstar)2
• #1 mobile banking app
in Australia (Forrester)3
1997 2005 2009 2013 2014 2018 2019

Good business practice3We are committed to earning trust and changing the way
we do things, to become a better bank for our customers
and communities
“”

Good business practice
46
Doing the right thing
• Customer remediation
• Better Customer Outcomes
Regulatory engagement
• Royal Commission - Progress
• Remedial Action Plan (APRA)
Doing business openly, responsibly, sustainably
• Banking Code of Practice
• Comprehensive Credit Reporting (CCR)
• Open Banking
• Sustainability

969
1,712
209
462
FY14 FY15 FY16 FY17 FY18 FY19
47
Remediation and Program CostsCumulative spend and provisions
Wealth customers
Banking customers
$1,178m
$2,174m$m 1H19 2H19 FY19
Total
to-
date
Aligned Advice remediation1 200 334 534 534
Wealth customer refunds• Includes an estimate of refunds and
interest to customers relating to
advice quality, fees where no service
was provided in the Commonwealth
Financial Planning Business, Credit
Card Plus, CommInsure Life
Insurance and Loan Protection
Insurance.
46 72 118 459
Banking customer refunds• Business Banking remediation
• Package fees
• Interest and fee remediation
30 152 182 375
Other program costs2 6 156 162 806
Total 282 714 996 2,174
1. Total Aligned Advice remediation of $534m includes $374m in customer refunds (including $123m of interest) and $160m of program costs. Customer refunds assume a refund rate of 24%
(excluding interest). This compares with a 22% refund rate for salaried adviser remediation. 2. Other program costs recognised in 2H19 includes regulatory response costs including the
implementation of Royal Commission recommendations.
Customer remediation

48
Examples
80 80
60 60
70 85
65
190
FY19 Annualised
1H18
2H18
1H19
2H19
415
275
Income forgone by date of initiative
• Overdrawn account alerts
• Transaction account waivers
• Credit Card, PL Protection insurance removed
• Everyday banking fee and pricing changes
• Overdrawn approval fee change
• Credit card – low fee card fee waiver
• IMT fee reductions
• Streamline account transaction fee changes
• ATM fee removal
• Calculation of interest on credit cards
• Wealth Management – Protecting Your SuperDate of pricing
change
$m
RBS BPB WM
• CFP – removal of ongoing service fees
• Wealth Management – CFS repricing
Better customer outcomes initiatives Regulatory response
RBS BPB WM
NII 45 5 -
OBI 170 15 -
FMI 25 - 15
Total 240 20 15
RBS BPB WM
NII 70 10 -
OBI 180 15 -
FMI 55 - 85
Total 305 25 85
Better customer outcomes

• Royal Commission – addressing recommendations and implementing the necessary changes
• APRA – delivering all 156 milestones of the Remedial Action Plan, with updates to APRA by the Independent reviewer every 3 months.
Delivering on APRA requirements and recommendations as part of meeting their ongoing prudential supervision.
• ASIC – dealing with Enforceable Undertakings and addressing a number of matters in relation to the Group
• Financial Crime – continued strengthening of financial crime capabilities and responding to ongoing requests from domestic and
offshore regulators
• Risk uplift – engaging with regulators on large improvement programs for data management and privacy
• Remediation and Compliance programs – promptly refunding customers and fixing business processes and systems
• Banking Code of Practice – ensuring compliance with the new code from 1 July 2019
• New legislation – ensuring we deliver on key government policies on comprehensive credit reporting and open banking
• New regulatory obligations – ensuring compliance with new requirements, including data security, large credit exposures and
compliance with RBNZ BS11 requirements for our New Zealand subsidiary ASB
• Class Actions – managing ongoing shareholder and superannuation class actions
• Employee matters – working with applicable regulators / stakeholders to resolve identified discrepancies in employee arrangements
and entitlements.
Responding to heightened regulatory requirements
49
The Bank and its operations are subject to heightened regulatory scrutiny and requirements. Regulatory actions (including potential
enforcement actions) or policy changes may negatively impact the Bank’s financial position or standing. There are a range of matters where
the outcome and any associated costs cannot be reliably estimated, therefore these matters would be treated as contingent liabilities.
Further disclosure regarding the Group’s contingent liabilities is provided in the 30 June 2019 year end Financial Statements.

12 134
104 7
169
8 6
4
6
68
27
16
BoardGovernance
ManagementGovernance
OperatingModel
Risk Appetite,Taxonomy
and controls
Accountabilityand controls
CustomerOutcomes
Culture,capability andconsequences
ProgramExecution
50
Regulatory engagement
Jun 19 Jun 19
► CBA welcomed all recommendations
► Implementation Taskforce chaired by Deputy CEO
23underway3
1. The Remedial Action Plan is CBA’s response to the recommendations contained in the Final Report of the Australia Prudential Regulation Authority (APRA) Prudential Inquiry into CBA released in
May 18. 2. To Independent Reviewer. 3. Recommendations that are underway - some requiring legislative action to complete. 4. No action required as action is with Government/ regulator or CBA
does not operate in that business.
► 48% of milestones submitted2
► All milestones to be submitted by June 2021
Submitted Not yet Due
75 submitted2
Recommendations
Government
legislation/review
CBA action
underway3
No action
required by CBA4
23
26
27
No action required as action is with
government/regulator or CBA does not
operate in that business
Actively participating in consultation
processes and preparing to implement
Taking proactive action, with some
requiring legislative action to complete

51
Open Banking
Product data published via public API
Open Banking
Consumer data sharing phase 2
Comprehensive Credit Reporting (CCR)
Supply of all CBA retail credit accounts
Doing business openly, responsibly and sustainably
► New Code approved by ASIC,
commenced 1 July 2019.
► Provides strong, enforceable and more
customer focused standards for banks
to deliver.
► Aligns with CBA’s commitment to
improve the financial wellbeing of our
customers and communities.
Banking Code of Practice
New code from 1 July 19
► Enhancing customers financial security
and enabling better risk based decisions
for credit applications.
► CBA has implemented the supply of 50%
of retail credit accounts, increasing to
100% by Sep 2019.
► Use of CCR data for decisions on home
lending and unsecured credit applications
commenced Oct 2018.
Open Banking
Consumer data sharing phase 1
Jul
19
Sep
19Feb
20
Jul
20
► Enabling customers to take control of
their data, with the right to direct data to
accredited third parties. Information
protected by new privacy obligations.
► From 1 July, CBA began publishing
product data via a public Application
Programming Interface (API).
► Consumers will be able to share their
data, with different products
progressively enabled from Feb 2020.

52
Doing business openly, responsibly and sustainably
8177 78
7268
FY15 FY16 FY17 FY18 FY19
Employee engagementCBA Employee Engagement Index (%)2
Operations emissions intensityEmissions per FTE, Scope 1+2, Australia
(CO2-e/FTE)
1. Community investment includes cash, forgone revenue, time and management costs. 2. People and Culture survey measures satisfaction, retention, advocacy and pride, showing the proportion
of employees replying with a score of 4 or 5. 3. Includes lending and banking services. 4. Start Smart sessions cover different topics and the same student may be booked to attend a number of
sessions. 5. The Start Smart Pathways program for vocational students ceased in FY19. 6. Excludes ASB.
FY20 Target = 40%
299
557 574 569427
FY15 FY16 FY17 FY18 FY19
Start SmartStudents booked for Start Smart classes
(‘000)4
5
243
263 266
290
281
FY15 FY16 FY17 FY18 FY19
Community investmentTotal community investment ($m)1
1.4
2.22.8
3.7
3.6
FY15 FY16 FY17 FY18 FY19
Renewable energyExposure ($bn)3
33.9 35.236.7 37.6
39.1
FY15 FY16 FY17 FY18 FY19
Women in managementRepresentation in Executive Manager and
above roles (%)6
3.02.9
2.6
2.32.1
FY15 FY16 FY17 FY18 FY19
FY20 Target = 2.0
53
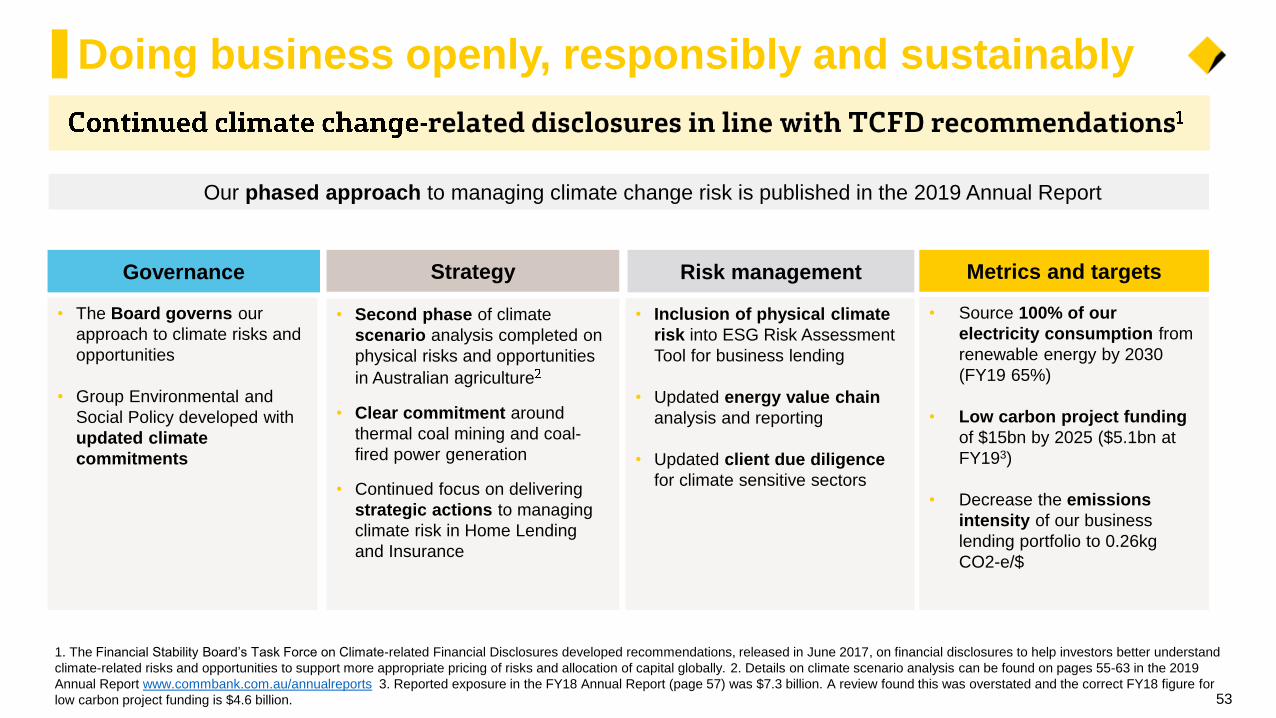
Governance Metrics and targetsRisk managementStrategy
• The Board governs our
approach to climate risks and
opportunities
• Group Environmental and
Social Policy developed with
updated climate
commitments
• Source 100% of our
electricity consumption from
renewable energy by 2030
(FY19 65%)
• Low carbon project funding
of $15bn by 2025 ($5.1bn at
FY193)
• Decrease the emissions
intensity of our business
lending portfolio to 0.26kg
CO2-e/$
• Inclusion of physical climate
risk into ESG Risk Assessment
Tool for business lending
• Updated energy value chain
analysis and reporting
• Updated client due diligence
for climate sensitive sectors
• Second phase of climate
scenario analysis completed on
physical risks and opportunities
in Australian agriculture
• Clear commitment around
thermal coal mining and coal-
fired power generation
• Continued focus on delivering
strategic actions to managing
climate risk in Home Lending
and Insurance
Our phased approach to managing climate change risk is published in the 2019 Annual Report
1. The Financial Stability Board’s Task Force on Climate-related Financial Disclosures developed recommendations, released in June 2017, on financial disclosures to help investors better understand
climate-related risks and opportunities to support more appropriate pricing of risks and allocation of capital globally. 2. Details on climate scenario analysis can be found on pages 55-63 in the 2019
Annual Report www.commbank.com.au/annualreports 3. Reported exposure in the FY18 Annual Report (page 57) was $7.3 billion. A review found this was overstated and the correct FY18 figure for
low carbon project funding is $4.6 billion.
Doing business openly, responsibly and sustainably

54
Energy value chain1
1. All figures are Total Committed Exposures (TCE) as at 30 June 2019. Figures represented have been specifically derived based on material client exposures. Not included are 'Other energy-related'
exposures ($0.8bn) which comprise smaller loans and energy trading entities. 2. Thermal coal exposure within each diversified miner is calculated as the Group’s exposure to the miner, excluding
exposure to coal subsidiaries, multiplied by the percentage EBITA contribution of thermal coal in its latest annual financial statements. Exposure to coal subsidiaries of diversified miners are allocated to
thermal coal.
Key: (+%) (-%)
Change since FY18
Natural resources Network and retailersElectricity generationInfrastructure
Gas
$1.2bn(-29%)
Thermal coal
$0.37bn(-29%)
Thermal coal
within diversified
miners2
$0.21bn(-25%)
Uranium
$0.0bn
Oil
$2.3bn(-18%)
LNG terminals
$2.8bn(-14%)
Coal terminals
$0.9bn(-9%)
Oil distribution
and refining
$0.8bn(-17%)
Electricity and gas
transmission,
distribution and
retailing
$5.0bn(-18%)
Renewables
$3.6bn(-2%)
Gas
$0.8bn(+24%)
Coal
$0.005bn(-97%)
Nuclear
$0.0bn

Financial Overview4
We have maintained sound business fundamentals
and momentum in a challenging operating context“
”

56
Our profits
1. Presented on a continuing operations basis. 2. PAYG represents tax collected for the ATO in respect of payments made to employees of the Group.
ReinvestedRetained for lending, investment
& growth
Tax ExpenseOne of Australia’s largest taxpayers
DividendsReturned to ~830,000 shareholders
(+ millions more via Super)
Profit before tax
FY19
64%
7%
29%
$11.9bn
3.4
0.9
7.6
1
approximates+
PAYG of
$1.3bn2

FY19 – result overview1
Financial Balance Sheet, Capital & Funding
57
Capital – CET12,4(Int’l) 16.2% 70 bpts
Capital – CET12 (APRA) 10.7% 60 bpts
Total assets ($bn) 977 0.1%
Total liabilities ($bn) 907 Flat
Average FUA3 ($bn) 163 6.0%
Deposit funding 69% 1.0%
LT wholesale funding WAM 5.1 yrs Flat
Liquidity coverage ratio5 132% -1.0%
Leverage ratio (APRA) 5.6% 10 bpts
Net stable funding ratio 112% Flat
Credit Ratings6 AA-/Aa3/AA- Refer footnote 6
Statutory NPAT2 ($m) 8,571 (8.1%)
Cash NPAT3 ($m) 8,492 (4.7%)
ROE3 % (cash) 12.5 (110)bpts
EPS3 cents (cash) 481 (29c)
DPS2 $ 4.31 Flat
Cost-to-income3 (%) 46.2 210bpts
NIM3 (%) 2.10 (5)bpts
Op income3 ($m) 24,407 (2.0%)
Op expenses3 ($m) 11,269 2.5%
LIE to GLAA (bpts) 16 1bpt
1. All movements on prior comparative period unless otherwise stated. 2. Includes discontinued operations. 3. Presented on a continuing operations basis. 4. Internationally comparable capital - refer
glossary for definition. 5. Quarter average. 6. S&P, Moody’s and Fitch. S&P revised Australian Major Banks outlook to “Stable” from “Negative” on 9 July 2019. Moody’s lowered the rating on 19 June
2017, outlook “Stable”. Fitch updated outlook on CBA to negative on 7 May 2018.

431 431
FY18 FY19
10.1%
10.7%
FY18 FY19
15.5%16.2%
FY18 FY19
8,9158,492
FY18 FY19
13.6%12.5%
FY18 FY19
215
210
FY18 FY19
44.1%46.2%
FY18 FY19
510
481
FY18 FY19
58
FY19 – result overview
1. Presented on a continuing operations basis. 2. Internationally comparable capital - refer to glossary for definition.
DPS (cents) CET1 (APRA) CET1 (International)2
Flat +60 bpts +70 bpts
Cash NPAT1 ($m) NIM1 Cost-to-income1 Cash ROE1
(110) bpts(4.7%) (5) bpts +210 bpts
Cash EPS1 (cents)
(29c)

Incl. discontinued operations Continuing operations
Financial year ended (“cash basis”) FY19 FY19 vs FY18 FY19 FY19 vs FY18
Cash net profit after tax $8,706m (7.5%) $8,492m (4.7%)
Cost-to-income1 47.8% 230 bpts 46.2% 210 bpts
Effective tax rate 28.7% (150)bpts 28.8% (170)bpts
Profit after capital charge (PACC)2 $4,333m (25.1%) $4,364m (21.1%)
Earnings per share (basic) 493c (46c) 481c (29c)
Return on equity 12.8% (160)bpts 12.5% (110)bpts
Key comparative financial metrics
59
1. Operating expenses to operating income. 2. The Group uses PACC as a key measure of risk adjusted profitability. It takes into account the profit achieved, the risk to capital that was taken to
achieve it, and other adjustments. The decrease on the prior year includes the impact of increasing capital levels in order to meet APRA’s “unquestionably strong” capital requirements by 1 January
2020 and the one-off impact of additional operational risk capital (and RWAs) from the Enforceable Undertaking with APRA.

Other Banking Income
Net Interest Income
18,342 18,120
5,215 5,068
1,357 1,219
FY18 FY19
Total income drivers1
60
$m
1. Presented on a cash continuing operations basis. 2. Totals shown include investment experience of $8m in FY18 and $4m in FY19. 3. Excludes Mortgage Broking consolidation.
Average FUA 6.0%
Insurance income (38.2%)
Derivative Valuation Adjustment (XVA) ($42m)
Lending fees3 (10.6%)
Trading (excl. XVA) (0.9%)
Commissions3 (3.2%)
Volume +1.2%
Margin (5)bpts
Funds & Insurance
24,41124,922
(2.8%)
(1.2%)
(10.2%)
22
(2.1%)

(4.5%)
0.5%
(8.5%)
2.5%
4.8%
RBS BPB IB&M WM ASB (NZD)
Operating income by line of business1
61
Jun 19 vs Jun 18
1. Presented on a continuing operations basis. 2. Movement in average interest earning assets. 3. Movement in average funds under administration. 4. To present an underlying view of the
RBS result, the impact of General Insurance and Mortgage Broking consolidation has been excluded.
%
(2.0%)
Assets: +3%
Margin: (17)bpts
OBI: (8%)
Assets: Flat
Margin: +1 bpt
IB: (6%)
Markets: (15%)
Assets: +6%
Margin: (3)bpts
FMI: +13%
2
2
2
FUA: +5%
Margin: (2)bpts
3
4
Group

18,342
18,120
208 172
86
(258)(344)
(86)
FY18 Volume AssetPricing
Deposit Pricing& Funding
PortfolioMix
ReplicatingPortfolio
and Basis Risk
Treasuryand Markets
FY19
62
$mMargin: (5) bpts
1. Presented on a continuing operations basis. 2. Average interest earning assets.
2
Volume: +1.2%
(1.2%)
(3) bpts (1) bpt+1 bpt (4) bpts
Net Interest Income1
+2 bpts
Impact of home loan
discounting and
customer switching,
partly offset by home
loan repricing
Lower Global
Markets net
interest income
Deposit
repricing
Strong growth
in transaction
deposits
Balance sheet
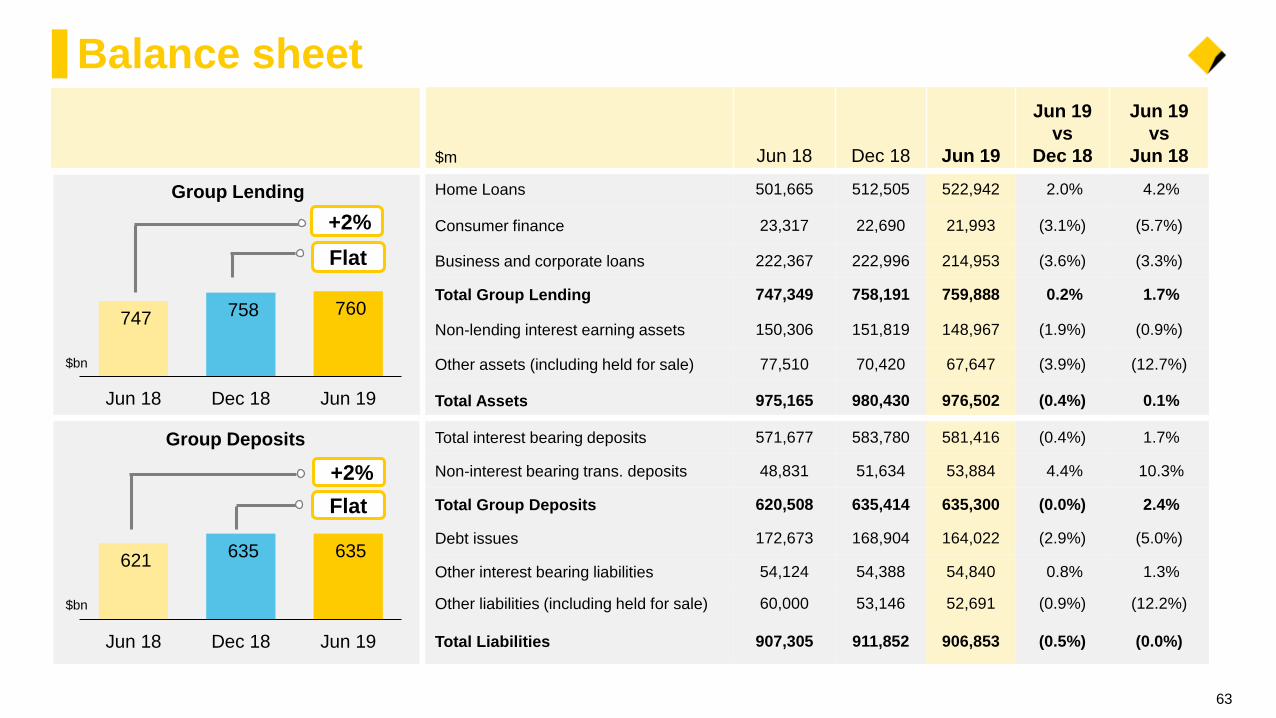
63
Group Lending
Group Deposits
$bn
$bn
$m Jun 18 Dec 18 Jun 19
Jun 19
vs
Dec 18
Jun 19
vs
Jun 18
Home Loans 501,665 512,505 522,942 2.0% 4.2%
Consumer finance 23,317 22,690 21,993 (3.1%) (5.7%)
Business and corporate loans 222,367 222,996 214,953 (3.6%) (3.3%)
Total Group Lending 747,349 758,191 759,888 0.2% 1.7%
Non-lending interest earning assets 150,306 151,819 148,967 (1.9%) (0.9%)
Other assets (including held for sale) 77,510 70,420 67,647 (3.9%) (12.7%)
Total Assets 975,165 980,430 976,502 (0.4%) 0.1%
Total interest bearing deposits 571,677 583,780 581,416 (0.4%) 1.7%
Non-interest bearing trans. deposits 48,831 51,634 53,884 4.4% 10.3%
Total Group Deposits 620,508 635,414 635,300 (0.0%) 2.4%
Debt issues 172,673 168,904 164,022 (2.9%) (5.0%)
Other interest bearing liabilities 54,124 54,388 54,840 0.8% 1.3%
Other liabilities (including held for sale) 60,000 53,146 52,691 (0.9%) (12.2%)
Total Liabilities 907,305 911,852 906,853 (0.5%) (0.0%)
747 758 760
Jun 18 Dec 18 Jun 19
+2%
Flat
621 635 635
Jun 18 Dec 18 Jun 19
+2%
Flat

0%
4%
8%
12%
16%
20%
24%
28%
32%
10%
14%
18%
22%
26%
30%
34%
3.4% 3.7% 3.1%3.9%
10%
14%
18%
22%
26%
30%
34%
24.4%
1. Sources: RBA Lending and Credit Aggregates and APRA Monthly Banking Statistics. CBA includes Bankwest and subsidiaries. Comparatives have been updated to reflect market restatements.
Business lending excludes CMPF. 2. System adjusted for new market entrants.
Volume growth and market share1
64
Home Lending2 Business Lending
Jun 07 Jun 19
PeersCBA
22.8%
14.4%
Jun 07
Volume growth
CBA
Market share
28.1%
Household Deposits2
Volume growth
PeersCBA
Jun 19Jun 07
23.0%
14.1%
12.6%
Volume growth
Market share Market share
14.0%
12 Months
Jun 196 Months
Jun 19
12 Months
Jun 19
6 Months
Jun 19
12 Months
Jun 19
6 Months
Jun 19
System CBAannualised annualised annualised
(peers unavailable)
System CBA System CBA
5.0%4.1%
2.5% 1.3%4.0%
-3.6%
2.5%
-4.0%
14.4%
Jun 19
Includes IB&M

65
% Jun 19 Dec 18 Jun 18
Home loans (2) 24.4 24.3 24.4
Credit cards (2) 26.9 26.6 27.2
Other household lending(2,3) 28.6 28.2 28.0
Household deposits (2) 28.1 28.3 28.4
Business lending – RBA 14.4 15.0 15.8
Business lending - APRA 16.6 17.0 17.8
Business deposits – APRA 19.5 19.7 20.2
Equities trading 3.7 3.7 4.1
Australian Retail - administrator view(4) 15.3 15.3 15.3
FirstChoice Platform(4) 10.7 10.7 10.7
Australia life insurance (total risk)(5) 7.4 7.8 8.0
Australia life insurance (individual risk)(5) 9.0 9.2 9.5
NZ home loans 21.7 21.6 21.7
NZ customer deposits 17.7 17.9 17.8
NZ business lending 15.4 15.3 15.0
NZ retail AUM(6) 15.4 15.3 15.0
NZ annual inforce premiums(7) - - 27.3
Market share1
1. Current period and comparatives have been updated to reflect market restatements. 2. Sources: RBA Lending and Credit Aggregates and APRA Monthly Banking Statistics. CBA includes BWA
and subsidiaries. 3. Other Household Lending market share includes personal loans, margin loans and other forms of lending to individuals. 4. Source: Strategic Insights, as at 31 March 2019. 5.
Source: Strategic Insights as at March 2019 - Metrics relate to discontinued operations. 6. Presented on a continuing operations basis. 7. Metric relates to discontinued operations.
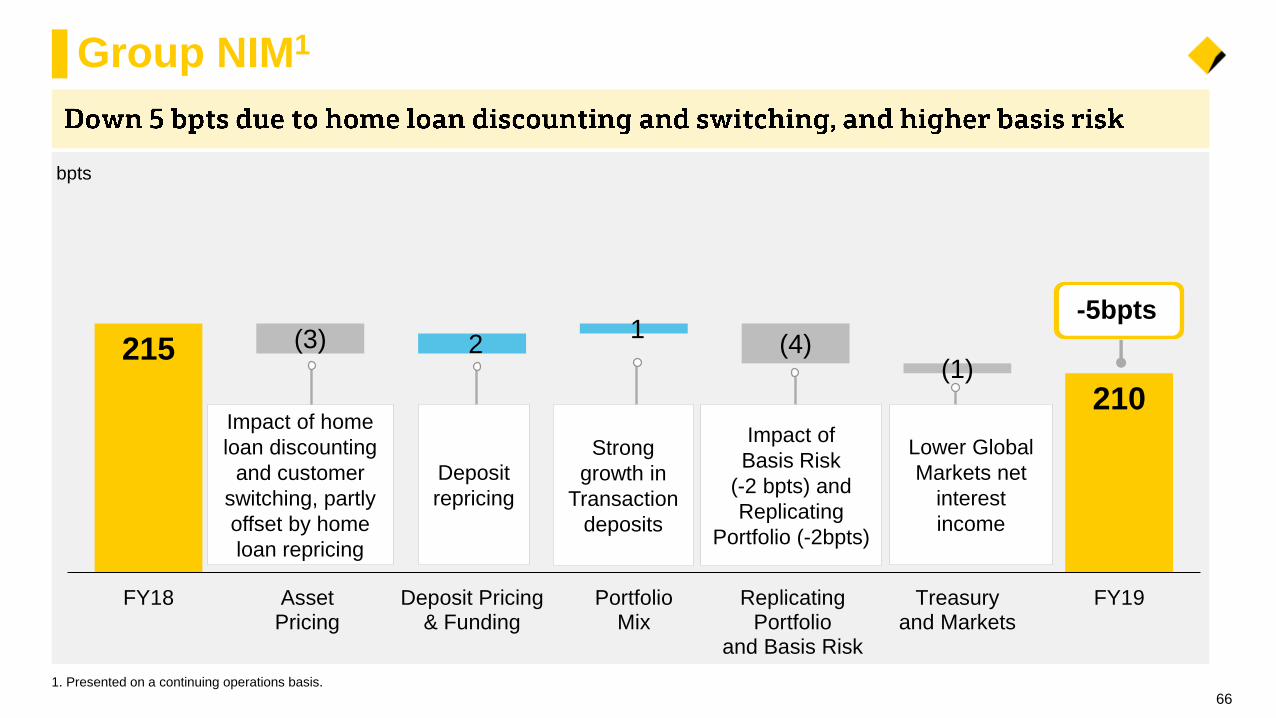
2 1 (3) (4)
(1)215
210
FY18 AssetPricing
Deposit Pricing& Funding
PortfolioMix
ReplicatingPortfolio
and Basis Risk
Treasuryand Markets
FY19
Group NIM1
66
bpts
1. Presented on a continuing operations basis.
-5bpts
Deposit
repricing
Impact of
Basis Risk
(-2 bpts) and
Replicating
Portfolio (-2bpts)
Impact of home
loan discounting
and customer
switching, partly
offset by home
loan repricing
Lower Global
Markets net
interest
income
Strong
growth in
Transaction
deposits

0.0%
0.5%
1.0%
Avg 28bpts
0.0%
4.0%
8.0%
Jul 07 Jul 19
3M BBSW
RBA Official
Cash Rate
RP Hedge
Rate
Replicating Portfolio (RP) & Equity Hedge
Group margin
67
Basis Risk
Jun 07 Jun 19 Jun 07 Jun 19
Cash Rate Forecast
(Market Implied)
Equity and Deposit Hedge
Jun 19
Balance
$bn
2H19
Avg.
Tractor2
Exit
Tractor2
Rate
Average
investment
term
Equity Hedge 46 2.17% 2.06% 3 yrs
Deposit Hedge 67 2.26% 2.22% 5 yrs
1. Includes the impact of basis risk on replicating portfolio. 2. Tractor is the moving average hedge rate on equity and rate insensitive deposits.
Every 5 bpts = 1 bpt of NIM1
FY19
FY19

103 105
Margins by division
68
BPB
bpts
Higher business lending and
home loan margins in the half,
offset by lower deposit margins
RBS
Driven by home loan competition
(discounting), and customer
switching
IB&M
bpts
Lower yields on bond
inventories this half
bpts
NZ (ASB)
bpts
Margin remained stable over
the half
317 317317271
260255
108103105
221 222227
274257
FY18 FY19
316 317
FY18 FY19 FY18 FY19
224221
FY18 FY19
2H192H18 1H19 2H192H18 1H19 2H192H18 1H19 2H192H18 1H19
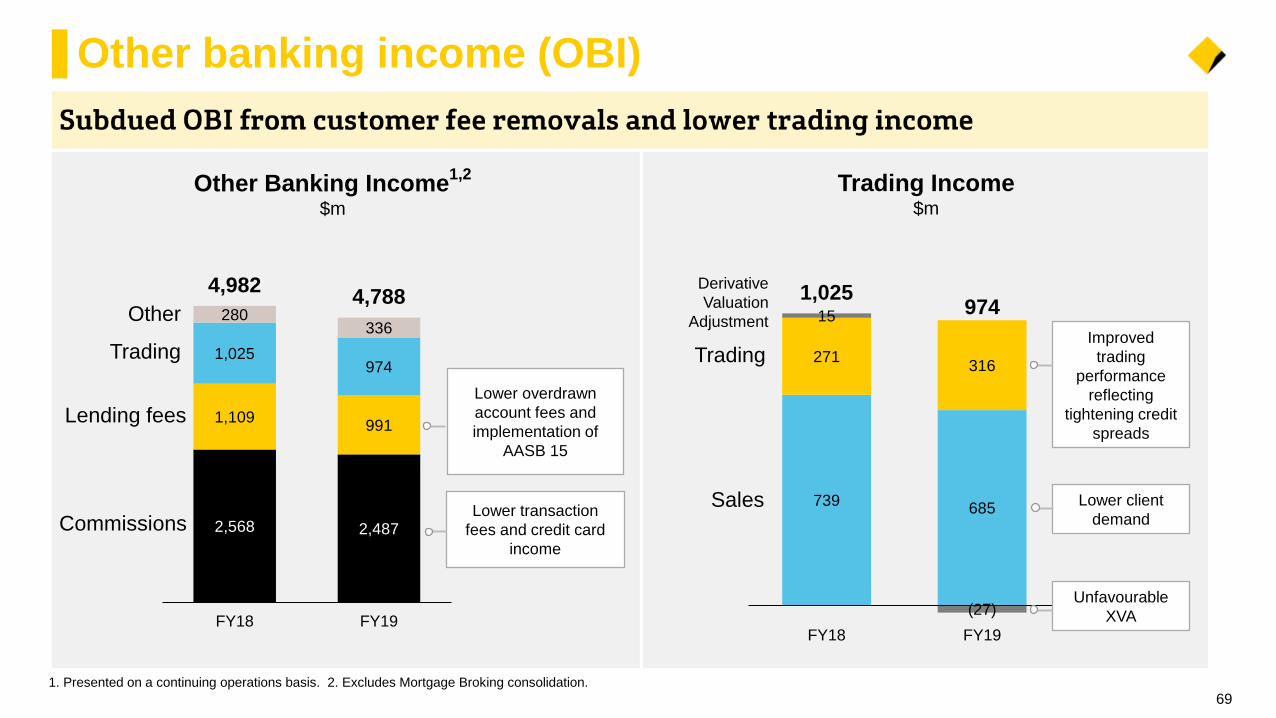
2,568 2,487
1,109 991
1,025 974
280 336
4,982 4,788
FY18 FY19
739 685
271 316
15
(27)
1,025 974
FY18 FY19
Other Banking Income1,2
$m
Other banking income (OBI)
69
Trading Income$m
Commissions
Lending fees
Trading
Other
Sales
Trading
Derivative
Valuation
Adjustment
1. Presented on a continuing operations basis. 2. Excludes Mortgage Broking consolidation.
Lower overdrawn
account fees and
implementation of
AASB 15
Lower transaction
fees and credit card
income
Lower client
demand
Improved
trading
performance
reflecting
tightening credit
spreads
Unfavourable
XVA

12,408
11,999
( 149 )
( 188 )
( 57 ) ( 15 )
1H19 NetInterestIncome
OtherBankingIncome
Funds &Insurance
MortgageBroking
Consolidation
2H19
-1.6%
-7.6%
-8.9% -3.3%
Sequential operating income down 3.3%1
70
$m
1. Presented on a continuing operations basis. 2. Average balances. 3. Excludes Mortgage Broking consolidation.
• 3 fewer days (149)
• Margin: Flat
• Unfavourable XVA (73)
• Lower profits from minority investments (33)
• NZ hedge (29)
• Institutional lending fees from lower volumes (13)
• Customer fee removals (9)
Lower ongoing service and
initial Advice fees
3 3
2%
2%
-5%
Home Loans
Business Loans
Insto. Loans
Volume Growth2

Sequential operating expenses up 13.1%1
71
136 434
46 105 (30)
5,289
5,980
3,000
4,000
5,000
6,000
7,000
1H19 Prior periodone-offs/
Other
Customerremediation, Risk
& CompliancePrograms
Enhancedrisk capability
Staff, IT, andOther excl.
notable items
BusinessSimplification
2H19
$m
Redundancy and IT increases
3
• $134m Aligned Advice remediation
• Business Banking remediation
• Other Wealth remediation • Business rationalisation
• Optimising distribution footprint
• Operating model & cost discipline
4
+13.1%
1H19 2H19
Notable items +2.5% (ex. notable items)
• $145m AUSTRAC insurance
• ($9m) Mortgage Broking Consolidation
2
• +310 FTE (spot)
1. Presented on a continuing operations basis. 2. Prior period = FY18. 3. Represents 2H19 total customer remediation costs of $714m ($639m recognised in continuing operations operating
expenses), less 1H19 total customer remediation costs of $282m ($279m recognised in continuing operations operating expenses). Also includes movement in risk and compliance programs of
$74m. 4. Excludes staff, IT and other costs related to notable items, enhanced risk and resiliency capability and simplification.

72
Investment spend1
1. Comparative information has been restated to conform to presentation in the current period.
Investment spend
% of total
Investment spendInvestment spend$m $m
Capitalised software balance
1st Half
2nd Half
FY19 vs
FY18:
$bn
50% 64%
38% 27%
12% 9%
FY18 FY19
Branches & Other
Productivity & Growth
Risk & Compliance
685 723
597 676
1,282 1,399
FY18 FY19
+13%
+6%
+9%
FY19 vs
FY18:
2.09
2.23
1.93 1.82
1.71
FY15 FY16 FY17 FY18 FY19
Average amortisation
period 5.0 years
Average amortisation
period 3.9 years
671 796
611 603
1,282 1,399
FY18 FY19
(1%)
+19%
Capitalised
Expensed
Total+9%

Provisions
73
2,763
3,821 3,814 3,904
870
870 920 8953,633
4,691 4,734 4,799
30 Jun 18AASB 139
1 Jul 18AASB 9
31 Dec 18AASB 9
30 Jun 19AASB 9
Individual
Collective
Total Provisions$m
• AASB 9 adopted from 1 July 2018, increasing impairment
provisions by $1,058 million due to recognition of impairment
losses on a forward looking basis.
• Collective Provisions include the impact of four probability-
weighted economic scenarios1 and adjustments for
emerging risk at an industry, geography or segment level.
• Currently holding $1.2 billion in impairment provisions over
and above the Central (base case) economic scenario.
• Adequately provisioned for a Downside economic scenario.
Alternate Economic Scenarios
Recognised
Impairment ProvisionsCentral
Scenario
3,6394,802 4,799
2
1. Central, Upside, Downside and Severe Downside. Central: Considers the Group’s base case assumptions. Upside and Downside: Reflect the lowest/highest impairment losses over an approximate 10 year cycle.
Severe Downside: Extremely adverse conditions. 2. Assuming 100% weighting and holding all other assumptions including forward looking adjustments constant.
$m 2
Downside
Scenario

Divisional contributions1
74
FY19 vs FY18
1. Presented on a continuing operations basis. 2. Excludes Corporate Centre and Other, and therefore does not add to 100%. 3. RBS result excluding General Insurance and Mortgage Broking
consolidation. 4. ASB result in NZD except for “% of Group NPAT”, which is in AUD.
Business Unit
% of Group
NPAT
FY19
Operating
Income
Operating
Expenses
Operating
Performance
Loan
Impairment
Expense
Cash
NPAT
Cost-to-
Income
FY19
RBS 49.9% (4.5%) 2.7% (8.4%) 6.3% (10.0%) 38.4%
BPB 31.3% 0.5% 8.0% (3.4%) 46.6% (6.6%) 36.6%
IB&M 12.6% (8.5%) (2.2%) (12.7%) (78.8%) (8.5%) 42.7%
WM 1.9% 2.5% 31.6% (38.2%) n/a (37.3%) 74.8%
ASB 13.2% 4.8% 3.7% 5.5% 35.0% 4.2% 35.6%
IFS 2.7% (4.1%) (28.4%) 18.2% (58.5%) 49.3% 35.6%
2
3
4

4,234
2,658
1,071 1,191 227 (941) 160 240 33 (26)
RBS BPB IB&M ASB(NZD)
IFS Other WM CFSGAM MortgageBroking &General
Insurance
Other
Business Units
75
(10%)
(7%)
$m
2
Large
Life 13
IFS Discontinued (15)
Sovereign -
Eliminations (24)
(8%)
1. Calculation based on the sum of the BU NPAT figures presented above divided by FY19 cash NPAT (incl. discontinued operations). 2. Includes Bankwest and Commonwealth Financial Planning,
excludes General Insurance and Mortgage Broking.
49%
~ 95% of Group NPAT1
(18%) (73%)
Movements are FY19 vs FY18
Divestments/
Strategic Reviews
4% (37%)(28%)

3.7%4.1%
Retail Banking Services (RBS)1
76
% of Group NPAT2
50%
Volume growth3,4
Balancing growth and returns - managing
regulatory requirements
1. Includes Bankwest and Commonwealth Financial Planning, excludes General Insurance and Mortgage Broking consolidation. 2. Group Cash NPAT excludes Corporate Centre and Other.
3. Source: RBA Lending and Credit Aggregates and APRA Monthly Banking Statistics. Includes home loan balances included in the Business and Private Banking (BPB) division 4. System
adjusted for new market entrants.
RBS provides simple, convenient
and affordable banking products
and services to personal and
business customers, through
Australia’s largest branch and
ATM network, and market leading
digital channels
Margin
Driven by home loan competition
(discounting) and customer switching
System
271260 255
bpts
12 months to Jun 19
$m Jun 18 Jun 19 %
Income 11,470 10,959 (4)
Expense (4,102) (4,213) 3
LIE (652) (693) 6
NPAT 4,703 4,234 (10)
2H192H18 1H19
Income - lower NIM partly offset by asset growth.
Expenses – inflation, risk and compliance spend.
LIE - higher personal loan collective provisions.
Home
LoansHousehold
Deposits
5.0%3.4%

Business & Private Banking (B&PB)
77
% of Group NPAT1
31%
$m Jun 18 Jun 19 %
Income 6,540 6,573 1
Expense (2,230) (2,409) 8
LIE (247) (362) 47
NPAT 2,845 2,658 (7)
Business
LendingDeposits
We are continuing to invest in our
business digital and analytics
platforms, including extension of the
Customer Engagement Engine (CEE).
We have hired more corporate bankers
and created a new team of relationship
managers to support our small
business customers. We have launched
Apple Pay for Business and BizExpress
to provide same day decisions on small
business loans2.
Margin
Home
Loans
Volume growthJun 19 vs Jun 18
2H192H18 1H19
317 317 317
Higher business lending and home loan
margins in the half, offset by lower
deposit margins
Income – Business growth offset by Retail Products.
Expenses - Higher remediation costs.
LIE – Small number of large individual exposures.
-0.7%
2.9%
1.7%
1. Group Cash NPAT excludes Corporate Centre and Other. 2. BizExpress is being rolled out to eligible existing customers for simple business loans up to $250K unsecured and $1m secured.
Transport & Storage +10%
Business Services +10%
Property Investor +3%
Property Developer -12%
bpts

88 81 76 73 67
13 16 20 17 18
Institutional Banking and Markets (IB&M)
78
% of Group NPAT1
13%
$m Jun 18 Jun 19 %
Income 2,671 2,444 (8)
Expense (1,067) (1,043) (2)
LIE (80) (17) (79)
NPAT 1,170 1,071 (8)
Volume growth
Dec 17Jun 17 Jun 18 Dec 18
Credit
Other
9710196 90
Front book discipline, back book optimisation
RWA $bn
Institutional Banking and Markets
serves the commercial and
wholesale banking needs of large
Corporate, Institutional and
Government clients across a full
range of financial services solutions,
including access to debt capital
markets, transaction banking,
working capital and risk
management
Margin
bpts
85
Jun 19
105 108 103
Lower yields on bond inventories this
half
Income - lower lending volumes and Markets income.
Expenses – one-offs in FY18, higher risk/compliance.
LIE - lower collective and individual provisions. 2H192H18 1H19
1. Group Cash NPAT excludes Corporate Centre and Other.

ASB
79
% of Group NPAT1
13%
NZD $m Jun 18 Jun 19 %
Income 2,600 2,726 5
Expense (935) (970) 4
LIE (80) (108) 35
NPAT 1,143 1,191 4
Volume growth
Deposits Lending
6%6%
12 months to Jun 19
Solid volume growth in lending and deposits
ASB conducts its business through
four business units: Retail Banking;
Business Banking; Corporate Banking;
and Private Banking, Wealth and
Insurance. ASB provides products and
services across multiple channels
including the branch network, digital
platforms and mobile relationship
managers.
Margin
227 221 222
Margin remained stable over the half
Income – Solid balance sheet growth.
Expenses – Technology investment, risk/compliance.
LIE – Increased rural and business provisioning. 2H192H18 1H19
1. Group Cash NPAT excludes Corporate Centre and Other.
bpts

Wealth
80
Life
(Discontinued)
Avg. FUA Avg. AUM Rev Avg. IFP Rev
149 214 1,242
5.0%
441 887
174
(0.9%) (16.0%)
(9.0%)2.5%
$bn $m $bn $m $m
FUA growth from market
momentum partially offset
by net outflows
Higher net outflows partially offset
by higher investment markets
Loss recognition, higher claims
experience and lower Inforce
Premiums from loss of schemes
Movements FY19 vs FY18
CFSGAM
(Discontinued)
Wealth1
(Continuing)
1. Incorporates the results of Colonial First State and Aligned Advice businesses of Financial Wisdom, Count Financial and CFP-Pathways.
645
160
Rev Exp NPAT
862
2.9%
Ex. remediation
1.5%
31.6%
(37.3%) (59.8%)

Home and Consumer Lending
5
We are Australia’s largest home lender, providing
$92 billion of new lending this year for Australian
home buyers
“”

0
5
10
15
20
25
Jun 98 Jun 01 Jun 04 Jun 07 Jun 10 Jun 13 Jun 16 Jun 19
Housing Credit1
(annual % change)
82
Home lending – system overview
1. Source: RBA Lending and Credit Aggregates. 2. Source: CoreLogic Hedonic Home Value Index. 3. Source: ABS.
0
2
4
6
8
10
12
Jun 10 Jun 12 Jun 14 Jun 16 Jun 18
Credit Growth1
(% change)
0
100
200
300
0
50
100
150
2003/04 2007/08 2011/12 2015/16
Period movements to
Jun 19 (%) 10yrs 3yrs 1yr 6mths
Sydney 64 (1) (10) (4)
Melbourne 59 5 (9) (4)
Brisbane 11 - (3) (3)
Adelaide 22 5 - (1)
Perth (6) (13) (9) (5)
Capital Cities (Combined) 42 - (8) (4)
%
Investor CreditCredit ex investors
Population growth3
(annual change)‘000
Sydney
(LHS)
Melbourne
(LHS)
Rest of
Australia
(RHS)
‘000
%
p.a
The recent modest slowdown in housing credit
growth is expected to extend into calendar year 2020
The slowdown has been driven by a combination of
regulatory/other factors, largely in investment lending
Despite recent house price softening, most capital
cities remain well up over the long term2
Housing credit demand continues to be supported by
population growth
3.5
7.3 6.7 6.6
2015 2016 2017 2018 2019 2020
5.63½-5½
CBA Economics
Forecast Range

451 467
92
36(112)
Jun 18 New Fundings Redraw& Interest
Repayments/External Refinance
/ Other
Jun 19
Jun 16 Dec 16 Jun 17 Dec 17 Jun 18 Dec 18 Jun 19
(5)(6)
(5)(4)
(2)
(1)
(3) (2)(3)
(6)
(4)(5)
(2)(3)
(7)
1 1 0
(2)
(1)(0)
1
3 4 2
36%
28%
19%
11%6%
NSW/ACT
VIC/TAS
QLD
WA
SA/NT
Flow % FY19
59%41%
41%59%
CBA System
67 66
27 26
FY18 FY19
Balance growth:
Jun 19 vs Jun 18 (%)4,5
Home lending - CBA1
83
CBA adopted regulatory changes early and avoided
riskier segments at the peak of the market
Whilst some market share was ceded as a result, more
recent growth has been at or above system
FY19 funding levels were modestly lower than FY18,
reflecting the market slowdown
The Bank’s focus remains on the core markets of
owner-occupied and proprietary lending
Balance growth2 Book %4,7
Broker
Proprietary
4 6
Fundings3
Investment
$bn
12 month rolling growth (%)
• APRA 30% cap on
new IO loans (Mar 17)
• APRA 10% cap on
IHL growth (Dec 15)
CBA Investment Loans
CBA Total
Market share
CBA Owner Occupied Loans
CBA growth vs system (6mthly)
94 92
Owner-Occupied
0.6x0.9x 1.3x
Jun 18 Dec 18 Jun 19
15.4%
6.1% 3.6% 3.9% 0.8%
(22.2%)
Principal &Interest
OwnerOccupier
Proprietary Broker Investor Interest only
0.8%
3.7%
5.1%
1, 2, 3, 4, 5, 6, 7. Refer to notes slide at back of this presentation for source information.
Jun 17 Dec 17 Jun 18 Dec 18 Jun 19
Monthly Movement (bpts)

0.7
0.8
0.9
1.0
1.1
$200
$250
$300
$350
$400
0.0
0.5
1.0
Borrowing capacity relatively stable1
84
A number of strengthened servicing policies and
practices have been implemented since June 2015
Despite tightening, maximum borrowing capacity has
remained relatively stable over the last 12-18 months
Few borrowers are currently utilising their full
borrowing capacity3
…with minimal change in average loan size and
approval rates
1. CBA excluding Bankwest. 2. Scenarios based on differing assumptions with respect to family types, number of dependents, loan size, income sources and existing liabilities/commitments.
3. Applications that have passed system serviceability test; borrowed at capacity reflects applicants with minimal net income surplus.
Change in maximum borrowing capacity2
Indexed December 2016
Change in approval rate and average funding size
Average funding size [RHS]
Approval rate (Indexed to June 2018)
CBA applicants with additional capacity to borrow
CBA applicants who borrowed at capacity
Jun 19Dec 18Jun 18
Increased serviceability buffers on income and debt in line with regulatory guidance
Income and household-scaled living expense models used in serviceability test
Limits on lending in high risk areas, non-residents
LVR limits on interest only and investment lending
Removed Low Doc loans from sale
Introduced limits on high Debt-to-Income ratios
Serviceability assessments prior to in-life IO switching
Data-driven liability verification tools, including Comprehensive Credit Reporting
Single Owner Occupier
Single Investor
Joint Investors
Joint Owner Occupiers
000’s
2016 2017 2018 2019
88%
12%
87%
13%
Dec 18 Jun 19
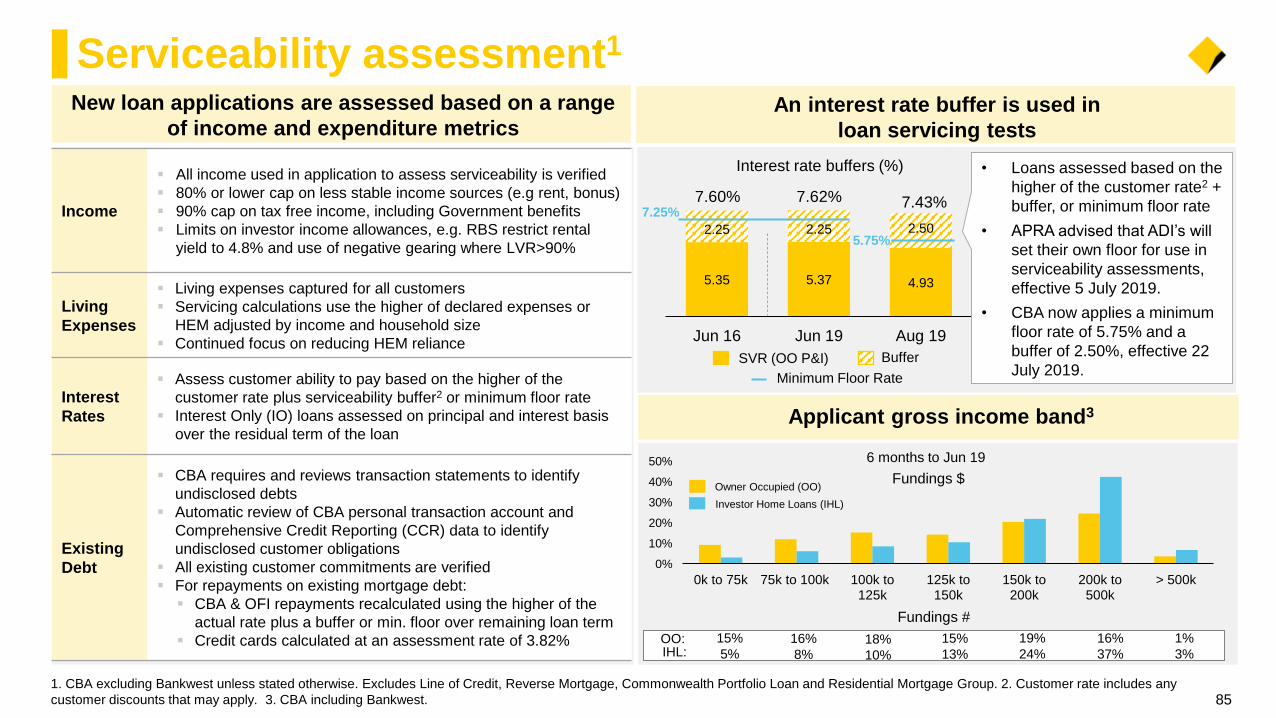
0%
10%
20%
30%
40%
50%
0k to 75k 75k to 100k 100k to125k
125k to150k
150k to200k
200k to500k
> 500k
85
Serviceability assessment1
1. CBA excluding Bankwest unless stated otherwise. Excludes Line of Credit, Reverse Mortgage, Commonwealth Portfolio Loan and Residential Mortgage Group. 2. Customer rate includes any
customer discounts that may apply. 3. CBA including Bankwest.
New loan applications are assessed based on a range
of income and expenditure metrics
Income
All income used in application to assess serviceability is verified
80% or lower cap on less stable income sources (e.g rent, bonus)
90% cap on tax free income, including Government benefits
Limits on investor income allowances, e.g. RBS restrict rental
yield to 4.8% and use of negative gearing where LVR>90%
Living
Expenses
Living expenses captured for all customers
Servicing calculations use the higher of declared expenses or
HEM adjusted by income and household size
Continued focus on reducing HEM reliance
Interest
Rates
Assess customer ability to pay based on the higher of the
customer rate plus serviceability buffer2 or minimum floor rate
Interest Only (IO) loans assessed on principal and interest basis
over the residual term of the loan
Existing
Debt
CBA requires and reviews transaction statements to identify
undisclosed debts
Automatic review of CBA personal transaction account and
Comprehensive Credit Reporting (CCR) data to identify
undisclosed customer obligations
All existing customer commitments are verified
For repayments on existing mortgage debt:
CBA & OFI repayments recalculated using the higher of the
actual rate plus a buffer or min. floor over remaining loan term
Credit cards calculated at an assessment rate of 3.82%
5.35 5.37 4.93
2.25 2.25 2.50
Jun 16 Jun 19 Aug 19
• Loans assessed based on the
higher of the customer rate2 +
buffer, or minimum floor rate
• APRA advised that ADI’s will
set their own floor for use in
serviceability assessments,
effective 5 July 2019.
• CBA now applies a minimum
floor rate of 5.75% and a
buffer of 2.50%, effective 22
July 2019.
Interest rate buffers (%)
SVR (OO P&I) Buffer
An interest rate buffer is used in
loan servicing tests
7.60% 7.62% 7.43%
Minimum Floor Rate
5.75%
Applicant gross income band3
7.25%
Fundings $
Investor Home Loans (IHL)
Owner Occupied (OO)
15%
5%
16%
8%18%
10%
15%
13%
19%
24%
16%
37%
1%
3%OO:IHL:
Fundings #
6 months to Jun 19
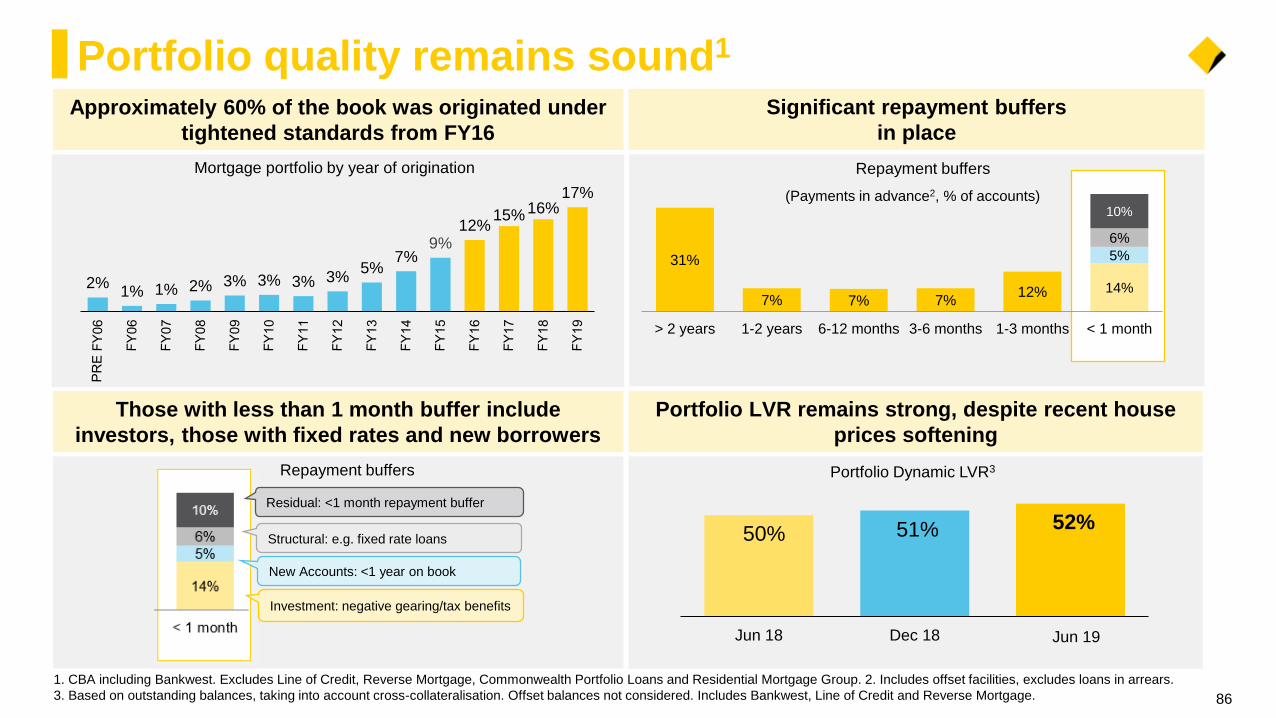
31%
7% 7% 7%12% 14%
5%
6%
10%
> 2 years 1-2 years 6-12 months 3-6 months 1-3 months < 1 month
Portfolio quality remains sound1
86
Approximately 60% of the book was originated under
tightened standards from FY16
Significant repayment buffers
in place
Those with less than 1 month buffer include
investors, those with fixed rates and new borrowers
Portfolio LVR remains strong, despite recent house
prices softening
Repayment buffers
1. CBA including Bankwest. Excludes Line of Credit, Reverse Mortgage, Commonwealth Portfolio Loans and Residential Mortgage Group. 2. Includes offset facilities, excludes loans in arrears.
3. Based on outstanding balances, taking into account cross-collateralisation. Offset balances not considered. Includes Bankwest, Line of Credit and Reverse Mortgage.
50% 51% 52%
Jun 18 Dec 18 May 19
Repayment buffers
(Payments in advance2, % of accounts)
Mortgage portfolio by year of origination
Portfolio Dynamic LVR3
Jun 19
2%1% 1% 2% 3% 3% 3% 3%
5%7%
9%12%
15%16%17%
New Accounts: <1 year on book
Structural: e.g. fixed rate loans
Residual: <1 month repayment buffer
Investment: negative gearing/tax benefits

0%
10%
20%
30%
40%
50%
60%
87
Portfolio LVRs1
3.3% 3.7%4.5%
1.5% 1.6%2.1%
Jun 18 Dec 18 Jun 19
Proportion of Balances in Negative Equity3
Negative Equity Negative Equity > $50k
Approximately 3.5% of accounts and 4.5% of balances
are in a negative equity3 position
• CBA updates house values on a monthly basis using internal and external
valuation data
• Negative equity arises when the outstanding loan (less offset balances)
exceeds the updated house value
• 4.5% of balances are in negative equity
• 72% of negative equity is from WA and QLD
• Over 50% of home loans in negative equity have Lenders Mortgage
Insurance
• 66% of customers ahead of repayments
1. CBA including Bankwest. Excludes Line of Credit, Reverse Mortgage, Commonwealth Portfolio Loans and Residential Mortgage Group. 2. Taking into account cross-collateralisation. Offset
balances not considered. 3. Based on outstanding balances, taking into account cross-collateralisation and offset balances. 4. Based on Jun 19 valuations.
2.8% of
accounts
3.0% of
accounts
3.5% of
accounts
Portfolio LVRs remain strong, with a modest uptick in
higher LVR bands given market softening
LVR
<60%
LVR
60%-
70%
LVR
70%-
80%
LVR
80%-
90%
LVR
90%-
95%
LVR
95%-
100%
LVR
>100%
Jun 18
Dec 18
Jun 19
Dynamic LVR Bands2
% of total Portfolio Balances
% of total Portfolio Accounts
Dynamic LVR Bands2 Jun 18
Dec 18
Jun 19
0%
10%
20%
30%
40%
50%
60%
LVR
<60%
LVR
60%-
70%
LVR
70%-
80%
LVR
80%-
90%
LVR
90%-
95%
LVR
95%-
100%
LVR
>100%
4

88
Home loan portfolio – CBA
1. CBA including Bankwest. All portfolio and new business metrics are based on balances and fundings respectively,
unless stated otherwise. All new business metrics are based on 6 months to Jun18, Dec18, Jun19. Excludes ASB.
2. Excludes Line of Credit (Viridian LOC/Equity Line).
3. Negative equity arises when the outstanding loan balance (less offset balances) exceeds updated house value.
Based on outstanding balances, taking into account both cross-collateralisation and offset balances. Excludes Line
of Credit, Reverse Mortgage, Commonwealth Portfolio Loans and Residential Mortgage Group.
4. Dynamic LVR defined as current balance/current valuation.
5. Any amount ahead of monthly minimum repayment; includes offset facilities.
6. Average number of monthly payments ahead of scheduled repayments.
7. Average Funding Size defined as funded amount / number of funded accounts.
8. Serviceability test based on the higher of the customer rate plus an interest rate buffer or min floor rate.
9. Total Debt Amount / Gross Income; excludes Bridging Loans.
New Business1 Jun 18 Dec 18 Jun 19
Total Funding ($bn) 45 49 43
Average Funding Size ($’000)7 319 326 320
Serviceability Buffer (%)8 2.25 2.25 2.25
Variable Rate (%) 86 82 80
Owner Occupied (%) 70 70 71
Investment (%) 29 29 28
Line of Credit (%) 1 1 1
Proprietary (%) 59 55 52
Broker (%) 41 45 48
Interest Only (%) 23 23 22
Lenders’ Mortgage Insurance (%)2 16 16 18
Debt-to-Income9 (DTI) > 6 (%) 12 12 11
Portfolio1 Jun 18 Dec 18 Jun 19
Total Balances - Spot ($bn) 451 458 467
Total Balances - Average ($bn) 443 455 462
Total Accounts (m) 1.8 1.8 1.8
Variable Rate (%) 81 80 80
Owner Occupied (%) 65 66 66
Investment (%) 32 31 31
Line of Credit (%) 3 3 3
Proprietary (%) 55 55 54
Broker (%) 45 45 46
Interest Only (%)2 30 26 22
Lenders’ Mortgage Insurance (%)2 21 21 21
Mortgagee In Possession (bpts) 5 5 6
Negative Equity (%)3 3.3 3.7 4.5
Annualised Loss Rate (bpts) 3 3 3
Portfolio Dynamic LVR (%)4 50 51 52
Customers in Advance (%)5 78 78 78
Payments in Advance incl. offset6 32 35 33
Offset Balances – Spot ($bn) 42 46 45

Home loan portfolio – CBA ex Bankwest
89
1. CBA excluding Bankwest. All portfolio and new business metrics are based on balances and fundings respectively,
unless stated otherwise. All new business metrics are based on 6 months to Jun18, Dec18, and Jun19. Excludes ASB.
2. Excludes Line of Credit (Viridian LOC).
3. Dynamic LVR defined as current balance/current valuation.
4. Any amount ahead of monthly minimum repayment; includes offset facilities.
5. Average number of monthly payments ahead of scheduled repayments.
6. Average Funding Size defined as funded amount / number of funded accounts.
7. Serviceability test based on the higher of the customer rate plus an interest rate buffer or min floor rate.
Portfolio1 Jun 18 Dec 18 Jun 19
Total Balances - Spot ($bn) 381 388 395
Total Balances - Average ($bn) 374 384 391
Total Accounts (m) 1.5 1.5 1.5
Variable Rate (%) 81 80 79
Owner Occupied (%) 64 64 65
Investment (%) 33 33 32
Line of Credit (%) 3 3 3
Proprietary (%) 59 59 59
Broker (%) 41 41 41
Interest Only (%)2 30 26 22
Lenders’ Mortgage Insurance (%)2 19 19 19
Mortgagee In Possession (bpts) 4 4 5
Annualised Loss Rate (bpts) 3 3 3
Portfolio Dynamic LVR (%)3 49 50 51
Customers in Advance (%)4 76 77 77
Payments in Advance incl. offset5 34 37 35
Offset Balances – Spot ($bn) 36 40 39
New Business1 Jun 18 Dec 18 Jun 19
Total Funding ($bn) 39 42 36
Average Funding Size ($’000)6 317 325 317
Serviceability Buffer (%)7 2.25 2.25 2.25
Variable Rate (%) 86 81 80
Owner Occupied (%) 70 70 70
Investment (%) 29 29 29
Line of Credit (%) 1 1 1
Proprietary (%) 63 60 59
Broker (%) 37 40 41
Interest Only (%) 23 23 22
Lenders’ Mortgage Insurance (%)2 15 15 18

23% 23% 22%
2H18 1H19 2H19
9% 7% 6% 5% 5% 6% 5% 3% 2% 2%
19% 16% 13% 12% 13% 12% 10% 6% 4% 4%
41%49%
50% 51% 48%49%
48% 54% 62% 65%
30%
29%
31% 32% 34%
33%
37% 36%32%
30%
6 mths toDec 19
6 mths toJun 20
6 mths toDec 20
6 mths toJun 21
6 mths toDec 21
6 mths toJun 22
6 mths toDec 22
6 mths toJun 23
6 mths toDec 23
6 mths toJun 24
90
Interest only (IO) home loans1
IO loans account for a reducing proportion of total
portfolio balances…
1. CBA including Bankwest unless stated otherwise. Excludes Line of Credit, Reverse Mortgage, Commonwealth Portfolio Loan and Residential Mortgage Group. 2. Excludes Bankwest.
3. Payments in Advance defined as the number of monthly payments ahead of scheduled repayments by 6 or more months.
The IO portfolio is dominated by investor loans and
those well in advance of repayments
Switching from IO to Principal and Interest (P&I)
peaked in the Dec 17 half
…and a reducing proportion of
total new business flow
Scheduled IO term expiry ($bn)2
11.2
13.5
11.2 11.3 10.8
8.4
4.12.7
4.63.7
30%26%
22%
2H18 1H19 2H19
IO % of total home loans
Total portfolio balance New business flow
5.8 6.68.2 9.1 8.2 8.9
1.4
4.4
8.13.7 4.0 2.6
Dec 16 Jun 17 Dec 17 Jun 18 Dec 18 Jun 19
Customer
Initiated
Reached end
of I/O period
Balance Movement ($bn)2
IO % of total home loans
11.512.2
16.3
12.8
11.0
7.2
Payments in advance > 6 mths3
Investment Loans: tax benefit in
keeping interest payments high
Residual
Dynamic LVR <80% Chart totals do not add to 100% due to rounding

0.0%
0.2%
0.4%
0.6%
0.8%
1.0%
Jun 17 Dec 17 Jun 18 Dec 18 Jun 19
0.0%
0.6%
1.2%
1.8%
Jun 17 Dec 17 Jun 18 Dec 18 Jun 19
0.0%
0.5%
1.0%
Jul Aug Sep Oct Nov Dec Jan Feb Mar Apr May Jun
Home loan arrears
91
Group portfolio arrears broadly stable
this halfTrends are broadly consistent across
loan types….
….with interest only arrears steady over
the last 12 months
Overall arrears are down on 2018, though
marginally elevated vs prior years…….reflecting pockets of stress in
particular geographies
Vintage performance since 2007-2010
continues to be relatively steady
Investment Loans
Owner Occupied
90+ days1
Arrears by ProductArrears by Portfolio
Group 90+ days
Arrears by Year
Group 90+ days 90+ days1,2
Principal & Interest
Interest Only
90+ days1
NT
WA
QLD
SA
AUS
TAS
VIC
NSW
ACT
90+ days1
Arrears by VintageArrears by State
Arrears by Repayment Type
1. CBA including Bankwest. Excludes Line of Credit, Reverse Mortgage, Commonwealth Portfolio Loan and Residential Mortgage Group. 2. Bankwest included from FY08.
20162015
201920182017
FY07-FY10
FY11FY12
FY16
FY17FY18
FY19
FY13-FY15
0.0%
0.4%
0.8%
1.2%
1.6%
0 6 12 18 24 30 36 42 48 54 60 66 72
Months on Book0.0%
0.5%
1.0%
1.5%
2.0%
Jun 17 Dec 17 Jun 18 Dec 18 Jun 19
0.0%
0.2%
0.4%
0.6%
0.8%
1.0%
Jun 17 Dec 17 Jun 18 Dec 18 Jun 19
Group
CBA
ASB
Bankwest

92
Portfolio losses, insurance and stress testing1
1. CBA including Bankwest. 2. Bankwest included from FY09. 3. Excludes Line of Credit, Reverse Mortgage, Commonwealth Portfolio Loan and Residential Mortgage Group. 4. Increase in gross
stressed losses from last half reflects slow down in housing market. Net losses reflect stressed macroeconomic and LMI assumptions (50%). Results based on December 2018 data.
Portfolio Insurance Profile3
% of Home Loan portfolio
Losses to average gross loans2
Stress testing
21%
5%
70%
4%Excess of loss re-
insurance
Insurance not required
- Lower risk profile e.g.
low LVR
Insurance with Genworth
or QBE for higher risk
loans above 80% LVR
Low deposit
premium segment
• A severe stress test scenario is modelled on an ongoing basis.
• Scenario includes stresses to house prices (31% decline),
unemployment (11%), cash rates (reduced to 0.5%).
• Losses4 are estimated over three years: Gross 3-year losses of
$4.09b, or $3.17b net of insurance.0.0%
0.5%
1.0%
1.5%
2.0%
2.5%
1983 1989 1995 2001 2007 2013 2019
CBA Home Loans
Group Total Loans
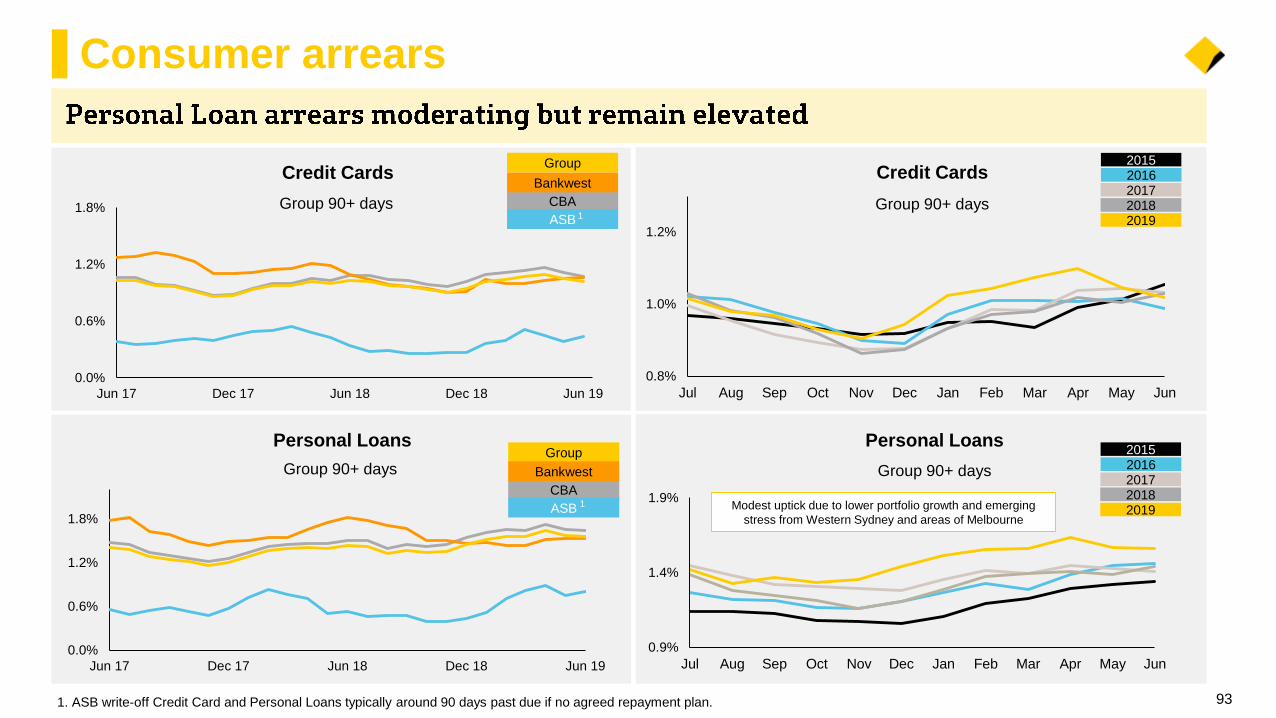
Personal Loans
0.0%
0.6%
1.2%
1.8%
Jun 17 Dec 17 Jun 18 Dec 18 Jun 19
0.0%
0.6%
1.2%
1.8%
Jun 17 Dec 17 Jun 18 Dec 18 Jun 19
0.9%
1.4%
1.9%
Jul Aug Sep Oct Nov Dec Jan Feb Mar Apr May Jun
Consumer arrears
93
Group 90+ days
Credit Cards
Group
CBA
ASB
Bankwest
1
Group 90+ days
Personal Loans
Group 90+ days
1. ASB write-off Credit Card and Personal Loans typically around 90 days past due if no agreed repayment plan.
Credit Cards
Group 90+ days
Group
CBA
ASB
Bankwest
1
0.8%
1.0%
1.2%
Jul Aug Sep Oct Nov Dec Jan Feb Mar Apr May Jun
Modest uptick due to lower portfolio growth and emerging
stress from Western Sydney and areas of Melbourne
20162015
201920182017
20162015
201920182017

Business and Corporate Lending
6
Supporting Australian businesses with
$36 billion of new business lending this year“
”

105 102 92
Jun 18 Dec 18 Jun 19
Transport &Storage
BusinessServices
Agriculture Property
184 198 221 226 222 223 215
Jun 14 Jun 15 Jun 16 Jun 17 Jun 18 Dec 18 Jun 19
95
Business and Corporate Lending
Business and Corporate Lending, IB&M
(includes Bills)2
1. Source: APRA Monthly Banking Statistics (excludes Bills). CBA includes Bankwest. 2. Source: RBA Lending and Credit Aggregates.
Market Shares1 Business Credit Growth2
System, Year-to-June %
Total lending balances down 3%
over FY19…
…driven by front book discipline and
back book optimisation in IB&M
CBA remains relatively underweight in
business lending…
…representing a source of opportunity
in a growing market
$bn
Business and Corporate Lending - BPB
BPB growth in diversified industries,
with slowdown in property
-37%
Credit RWA – IB&M $bn
IB&M Credit RWA’s have reduced
significantly over recent years
Jun 2019
Business and
Corporate Lending
$bn
106 101 88 81 76 73 67
Jun 16 Dec 16 Jun 17 Dec 17 Jun 18 Dec 18 Jun 19
Growth FY19 v FY18
APRA NFC RBA System
• Disciplined pricing - focus on relationship returns
• Actively reducing capital intensity of earnings
• RWA modelling improvements/enhanced data quality
• Focused management of TIA loans
BPB +2%
NZ/Other +10%
Sub-total +4%
IB&M -12%
Total -3%
10.1% 10.0%
1.7% 1.4%
-12%
Property Investor +3%
Property Developer -12%CBA
Economist
Forecast
Range3.4
4.5
6.6
4.2
3.2
4.0
4-6
2014 2015 2016 2017 2018 2019 2020
21.0%18.2% 16.6%
14.4% 14.4%
Peer 2 Peer 3 CBA Peer 1 CBA

96
Corporate lending
Corporate Loan Impairment Expense
Basis Points of GLAAbpts
Corporate
Total Credit Exposures $bn
307 300
332361
382 393
445465 477
453 437
FY09 FY10 FY11 FY12 FY13 FY14 FY15 FY16 FY17 FY18 FY19
142
76
43
24 2313 11
20
8 1014
FY09 FY10 FY11 FY12 FY13 FY14 FY15 FY16 FY17 FY18 FY19

Portfolio quality1
971. CBA grades in S&P equivalents.
Corporate Portfolio Quality
Investment Grade
Exposures by Industry Group TCE by Geography
Top 10 Commercial Exposures
TCE $m
Troublesome and Impaired Assets
67.9% 67.9% 67.4%
Jun 18 Dec 18 Jun 19
TCE $bn
AAA
to
AA-
A+
to
A-
BBB+
to
BBB-
OtherJun
19
Sovereign 95.8 9.1 0.5 - 105.4
Property 3.1 6.2 14.7 44.2 68.2
Banks 23.1 22.0 3.2 0.1 48.4
Finance - Other 23.9 22.6 4.0 2.2 52.7
Retail &
Wholesale Trade0.1 1.2 4.0 14.8 20.1
Agriculture - 0.1 2.7 19.7 22.5
Manufacturing - 2.3 4.4 8.1 14.8
Transport - 1.4 7.4 6.3 15.1
Mining - 3.2 5.1 3.1 11.4
Energy 0.3 2.2 5.9 1.8 10.2
All other ex
Consumer1.7 5.9 18.3 42.3 68.2
Total 148.0 76.2 70.3 142.6 437.1
Jun 18 Dec 18 Jun 19
Australia 77.6% 77.9% 78.4%
New Zealand 10.0% 10.4% 10.6%
Europe 4.7% 3.9% 3.5%
Other 7.7% 7.8% 7.5%
Gross
Impaired
Corporate
Troublesome
% of TCE
$bn3.3 3.1
4.2
3.2 3.6
3.6
6.5 6.7
7.8
Jun 18 Dec 18 Jun 19
0.60% 0.62%0.72%
- 500 1,000 1,500 2,000
BBB+AAA
A-BBB+
A-A+
BBB+AA-A+
A

Group TCE TIA $m TIA % of TCE
Dec 18 Jun 19 Dec 18 Jun 19 Dec 18 Jun 19
Consumer 57.8% 58.6% 1,832 2,101 0.29% 0.33%
Sovereign 10.0% 9.7% - - - -
Property 6.2% 6.3% 652 775 0.97% 1.14%
Banks 4.6% 4.5% 9 9 0.02% 0.02%
Finance – Other 4.9% 4.9% 78 35 0.15% 0.07%
Retail & Wholesale Trade 2.0% 1.9% 478 636 2.15% 3.16%
Agriculture 2.1% 2.1% 1,042 989 4.65% 4.40%
Manufacturing 1.4% 1.4% 375 403 2.46% 2.71%
Transport 1.5% 1.4% 225 259 1.41% 1.72%
Mining 1.3% 1.1% 314 199 2.30% 1.74%
Business Services 1.3% 1.1% 278 333 1.97% 2.72%
Energy 0.9% 0.9% 2 86 0.02% 0.84%
Construction 0.8% 0.8% 419 579 5.08% 7.10%
Health & Community 0.8% 0.8% 222 224 2.49% 2.47%
Culture & Recreation 0.6% 0.6% 62 101 0.93% 1.64%
Other 3.8% 3.9% 761 1,070 1.82% 2.51%
Total 100.0% 100.0% 6,749 7,799 0.62% 0.72%
Credit exposure summary
98
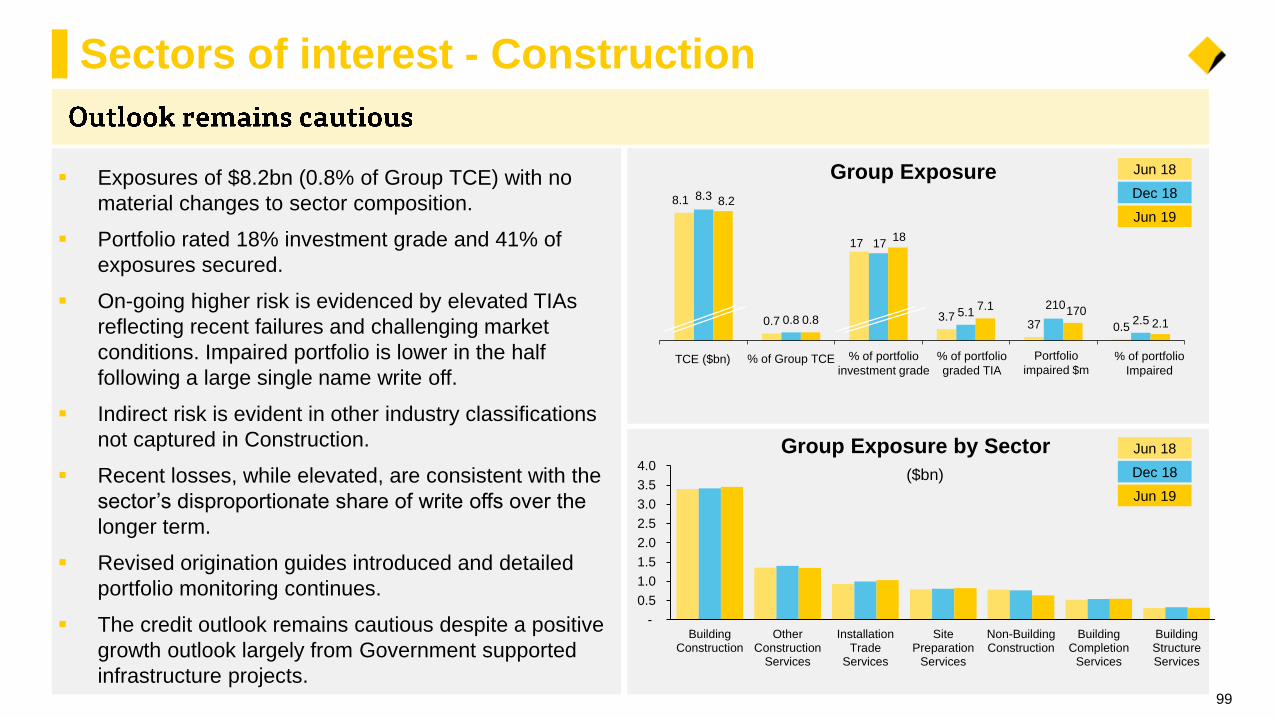
Sectors of interest - Construction
99
8.1
0.7
17
3.737 0.5
8.3
0.8
17
5.1210
2.5
8.2
0.8
18
7.1 1702.1
-
0.5
1.0
1.5
2.0
2.5
3.0
3.5
4.0
BuildingConstruction
OtherConstruction
Services
InstallationTrade
Services
SitePreparation
Services
Non-BuildingConstruction
BuildingCompletion
Services
BuildingStructureServices
Group Exposure
Group Exposure by Sector
% of Group TCE Portfolio
impaired $m% of portfolio
investment gradeTCE ($bn) % of portfolio
graded TIA
% of portfolio
Impaired
($bn)
Jun 19
Dec 18
Jun 18
Jun 19
Dec 18
Jun 18
Exposures of $8.2bn (0.8% of Group TCE) with no
material changes to sector composition.
Portfolio rated 18% investment grade and 41% of
exposures secured.
On-going higher risk is evidenced by elevated TIAs
reflecting recent failures and challenging market
conditions. Impaired portfolio is lower in the half
following a large single name write off.
Indirect risk is evident in other industry classifications
not captured in Construction.
Recent losses, while elevated, are consistent with the
sector’s disproportionate share of write offs over the
longer term.
Revised origination guides introduced and detailed
portfolio monitoring continues.
The credit outlook remains cautious despite a positive
growth outlook largely from Government supported
infrastructure projects.

100
Sectors of interest – Commercial Property
Profile1Sector
Increase in investment exposures driving moderate
increase exposure for the half year (+1.4%).
Diversified across sectors and by counterparty.
Lower apartment development exposures.
Top 20 counterparties primarily investment grade
(weighted average rating of BBB equivalent) and
account for 16.6% of Commercial Property exposure.
35% of the portfolio investment grade, majority of sub-
investment grade exposures secured (91%).
Impaired exposures remain low (0.10% of the portfolio).
Geographical weighting remained steady this half.
Ongoing comprehensive market, exposure monitoring
of the portfolio.
Group Exposure
% of Group
TCEPortfolio impaired
$m
% of portfolio
investment gradeTCE ($bn) % of portfolio
graded TIA% of portfolio
Impaired
1. Sector profile is Group wide Commercial Property. Geographic profile is domestic Commercial Property.
Geography
Jun 19
Dec 18
Jun 18
67.2
6.2
34
0.9 83 0.12
67.2
6.2
34
1.0 78 0.12
68.2
6.3
35
1.170 0.10
Retail27%
Office21%REIT
15%
Residential14%
Industrial10%
Other13%
NSW52%
VIC20%
WA14%
QLD7%
SA5%
Other2%

Brisbane
$0.06bn
101
Apartment Development1 exposure reduced by $2.9bn
(56%) since Dec 16.
Facilities being repaid on time from pre-sale
settlements.
Weighting to Sydney - Sydney developments are
diversified across the metropolitan area.
Portfolio LVR and Qualifying Pre-sales (QPS)2 broadly
stable at 55.3% and 107.7% respectively.
Ongoing comprehensive market, exposure and
settlement monitoring on the portfolio.
1. Apartment Developments > $20m. Brisbane, Melbourne and Perth defined as all postcodes within a 15km radius of the capital city and Sydney is all metropolitan Sydney based on location of
the development. Other is all other locations. 2. QPS cover is the ratio of Qualifying Pre Sales to loan exposures.
0.9 0.9
0.5
2019 2020 2021
Profile
Apartment
development1
24%
($2.3bn)Other
development
33%
($3.1bn)
Investment
43%
($4.1bn)
Total Residential
$9.5bn (14% of CP)
($bn)
Exposure Maturity Profile1
Melbourne
$0.4bn
Perth
$0.07bn
Other
$0.3bn
Apartment Development1
$2.3bn (0.2% of TCE)
Sydney
64%
($1.5bn)
Residential Apartment Development Total Exposure ($bn)
5.24.5
4.1 3.7
2.6 2.3
Dec 16 Jun 17 Dec 17 Jun 18 Dec 18 Jun 19
Sectors of interest – Residential Apartments
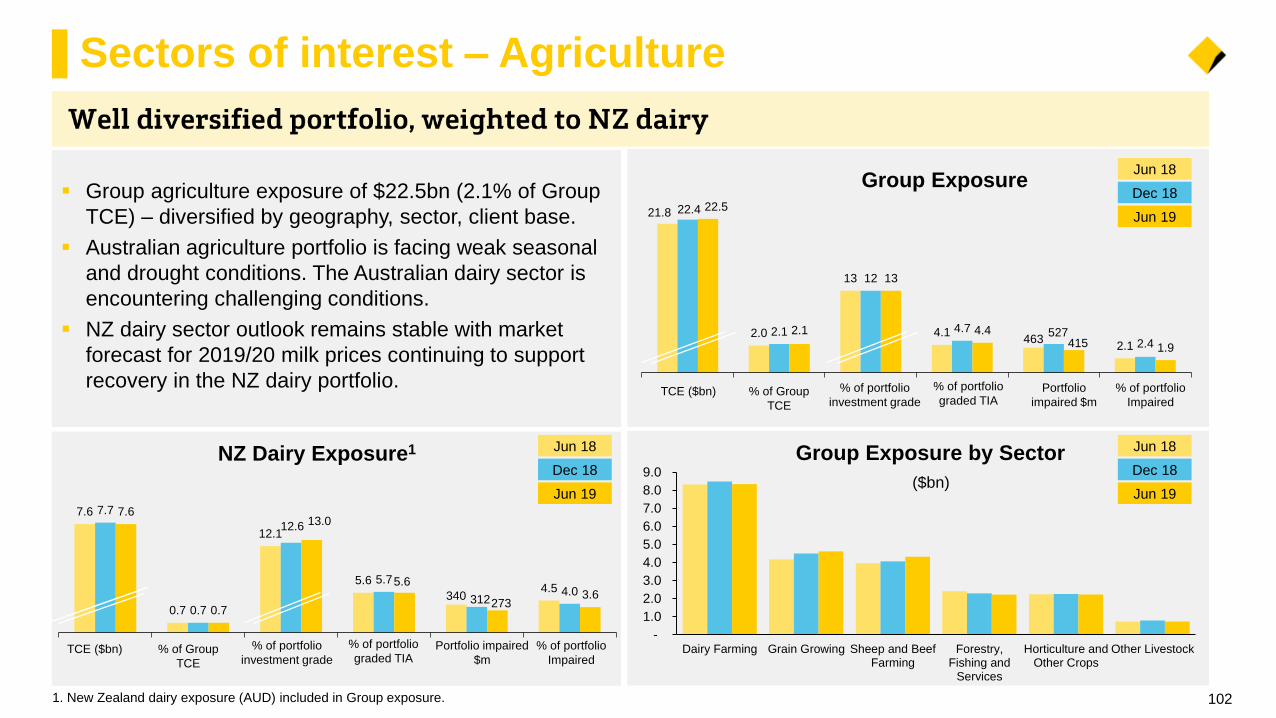
21.8
2.0
13
4.1463
2.1
22.4
2.1
12
4.7 5272.4
22.5
2.1
13
4.4415 1.9
-
1.0
2.0
3.0
4.0
5.0
6.0
7.0
8.0
9.0
Dairy Farming Grain Growing Sheep and BeefFarming
Forestry,Fishing and
Services
Horticulture andOther Crops
Other Livestock
Group Exposure
% of Group
TCE
Portfolio
impaired $m
% of portfolio
investment gradeTCE ($bn) % of portfolio
graded TIA% of portfolio
Impaired
Group agriculture exposure of $22.5bn (2.1% of Group
TCE) – diversified by geography, sector, client base.
Australian agriculture portfolio is facing weak seasonal
and drought conditions. The Australian dairy sector is
encountering challenging conditions.
NZ dairy sector outlook remains stable with market
forecast for 2019/20 milk prices continuing to support
recovery in the NZ dairy portfolio.
1. New Zealand dairy exposure (AUD) included in Group exposure.
7.6
0.7
12.1
5.6
3404.5
7.7
0.7
12.6
5.7
3124.0
7.6
0.7
13.0
5.6
2733.6
NZ Dairy Exposure1
% of Group
TCE
Portfolio impaired
$m
% of portfolio
investment gradeTCE ($bn) % of portfolio
graded TIA% of portfolio
Impaired
Group Exposure by Sector
($bn)
Sectors of interest – Agriculture
102
Jun 19
Dec 18
Jun 18
Jun 19
Dec 18
Jun 18
Jun 19
Dec 18
Jun 18

CBA enacted its emergency assistance package in June 2018 for
drought impacted clients.
Drought more pronounced in NSW and Victoria, with conditions
drier than long term averages.
Past droughts have not materially impacted the portfolio’s
performance due to diversification by geography, industry and
exposure size.
The impact on clients is being closely monitored, with the drought’s
severity expected to become more evident over the next 12 to 18
months. 2017 was a good crop year and commodity prices have
been favourable, which assisted clients leading into the drought.
Sectors of interest – drought affected areas
103
Australian Agriculture Exposure
Jun 18 Dec 18 Jun 19
Exposure (TCE) $11.0bn $11.2bn $11.2bn
% of Group TCE 1.02% 1.03% 1.03%
% of portfolio investment grade 12% 10% 11%
% of portfolio graded TIA 3.6% 4.6% 4.2%
% of portfolio impaired 0.7% 1.6% 0.8%
Horticulture/Other39%
Forestry, Fishing, Services
20%
Sheep/Beef Farming17%
Grain Growing14%
Dairy Farming6%
Other Livestock4%
Profile
NSW48%
VIC19%
WA15%
SA8%
QLD6%
Other4%

5.9
3.6
2.2
5.9
3.3
2.5
5.7
3.2
2.4
Personal and Household GoodRetailing
Food Retailing Motor Vehicle Retailing andServices
11.7
1.1
27
3.1
37
0.3
11.7
1.1
23
2.7
290.3
11.3
1.0
24
3.3 61
0.5
Sectors of interest – Retail Trade
104
The retail trade sector remains weak, challenged by low
wage growth, falling house prices, continued subdued
consumer sentiment, and online disrupters.
Retail trading conditions, particularly in the discretionary
retail sectors, are expected to continue to be challenged by
higher competition and downward pressure on prices and
profitability, notwithstanding recent fiscal and monetary
stimulus.
Impairment increase due mainly to a single name exposure.
5.9
0.5
274.1
27 0.5
5.9
0.5
27
3.6
210.4
5.7
0.5
30
3.9
51 0.9
Group Exposure by Sector
($bn)
104
Personal and Household Good Retailing
% of Group
TCE
Portfolio
impaired $m
% of portfolio
investment gradeTCE ($bn) % of portfolio
graded TIA% of portfolio
Impaired
Group Exposure
% of Group TCE Portfolio
impaired $m% of portfolio
investment gradeTCE ($bn) % of portfolio
graded TIA
% of portfolio
Impaired
Jun 19
Dec 18
Jun 18
Jun 19
Dec 18
Jun 18
Jun 19
Dec 18
Jun 18

Deposits, Funding and Liquidity
7
We have maintained our strong funding position
with the highest share of stable household deposits
in Australia
“”

52%58% 60%
67% 66%
Jun 15 Jun 16 Jun 17 Jun 18 Jun 19
Funding overview
106
Resilient balance sheet with ongoing
customer deposit growth
...with a >5.0yrs WAM to reduce
refinancing risk
Stable wholesale funding composition
weighted to longer term funding…
1. Quarter Average. 2. Reported at historical FX rates. 3. Includes $5.3bn FX revaluation. 4. Numbers do not sum to zero due to rounding.
12 months to Jun 194
2
3
63%66%
67% 68% 69%
Jun 15 Jun 16 Jun 17 Jun 18 Jun 19
Efficient balance sheet mix
supporting a strong NSFR…
…allowing for a reduction in wholesale
funding in FY19
…and a sound liquidity position with a
stable LCR at 132%...
Sources and Uses of Funds
107%
112% 112%
Jun 17 Jun 18 Jun 19
121%124%
135%133% 132%
Jun 15 Jun 16 Jun 17 Jun 18 Jun 19
Regulatory
requirement
from 1 Jan 18
NSFR LCR1
Deposit Funding
3.84.1 4.1
5.1 5.1
Jun 15 Jun 16 Jun 17 Jun 18 Jun 19
Long Term Funding WAMLong Term Funding
% of total wholesale funding Tenor, years
Funding Gap
$11bn
reduction
2
22
9
3
8
(33)
(12)
Equity Long TermIssuances
Long TermMaturities
CustomerDeposits
Lending LiquidAssets
Other

Deposits vs Peers1
264 215 132 118
235 211
211 155
CBA Peer 3 Peer 2 Peer 1
Deposit funding
107
Deposit Funding
Group Transaction Balances2
$m
CBA
overweight
more stable
deposits
Deposits in NSFR5
$m
Household
deposits
Other
deposits
New Transaction Accounts3
Retail Deposit Mix4
$bn
$bn
63%
66%
67%68% 69%
Jun 15 Jun 16 Jun 17 Jun 18 Jun 19
0
50
100
150
200
250
Stable Deposits Less Stable Deposits
CBA
Peer 1
Peer 2
Peer 3
As at 30 June 2019 ($bn)
Peers as at 31 March 20196499
604 575 589
2H18 1H19 2H19
# ‘000
1. Source: APRA Monthly Banking Statistics. Total deposits (excluding CD’s). CBA includes Bankwest. 2. Includes non-interest bearing deposits. 3. Number of new personal transaction accounts,
excluding offset accounts, includes CBA and Bankwest. 4. Transactions includes non-interest bearing deposits and transaction offsets. Excludes business deposits. Online includes NetBank Saver,
Goal Saver, Business Online Saver, Bankwest Hero Saver, Smart eSaver and Telenet Saver. Savings and Investment includes savings offset accounts. 5. Stable and less stable deposits in NSFR
calculation. Excludes operational deposits, other deposits and wholesale funding. 6. Source: 31 March 2019 Pillar 3 Regulatory Disclosures; CBA reported as at 30 June 2019.
Transactions57.5
Online65.4
Savings & Investments
121.2
155,147
162,767
169,648
Jun 18 Dec 18 Jun 19
9.3%
4.2%
273343
426

Wholesale funding
108
1. Includes the categories ‘central bank deposits’ and ‘due to other financial institutions’. 2. Includes IFRS MTM and derivative FX revaluation, and includes debt with an original maturity or call date
of greater than 12 months (including loan capital). 3. Represents the weighted average maturity of outstanding long term wholesale debt with a residual maturity greater than 12 months at 30 June 19
4. Additional Tier 1 and Tier 2 Capital.
Long Term funding by product2Long Term funding by currency2
7%
7%
14%
20%
52%
Structured MTN
Securitisation
AT1/T2
Covered Bonds
Senior Bonds
0% 50% 100%
Jun 15
Jun 16
Jun 17
Jun 18
Jun 19AUD
USD
EUR
OTH
67%
33%
66% 66%
34% 34%
Jun 18 Dec 18 Jun 19
Long term
Funding2
Short term
funding¹
Portfolio Mix Short Term funding by product¹
3%
5%
22%
24%
46%
Other
MTN
FI Deposits
Commercial Paper
Certificate of Deposits
5.1
WAM35.0
WAM
5.1
WAM
4

3831
3844
33
2232
20
35
17
54
Jun 14 Jun 15 Jun 16 Jun 17 Jun 18 Jun 19 Jun 20 Jun 21 Jun 22 Jun 23 > Jun 23
Long Term Debt² Covered Bond Securitisation AT1 / T2³
Long term funding
109
Date Entity TypeTenor
(yr)
Volume
(m)
Spread at Issue
(bpts)
Jul 18 CBA GBP Senior 3 GBP 250 3m GBP Libor +45
Jul 18 CBA USD Covered 5 USD 1,250 MS +40
Aug 18 CBA AUD Senior 3, 5 AUD 3,500 3m BBSW +73 / 93
Sep 18 ASB NZD Senior 5 NZD 450 BKBM +102
Sep 18 CBA AUD RMBS 6.8 AUD 1,630 1m BBSW +132
Oct 18 ASB EUR Covered 7 EUR 500 MS +16
Dec 18 CBA AUD Tier 1 5.4 AUD 1,500 3m BBSW +370
Jan 19 CBA AUD Senior 5 AUD 2,500 3m BBSW +113
Jan 19 ASB CHF Senior 6 CHF 200 MS +58
Feb 19 CBA EUR Covered 10 EUR 1,000 MS +29
Feb 19 ASB NZD Senior 3 NZD 500 BKBM +83
Feb 19 CBA USD Senior 5.25 USD 1,250 T +88, 3m USDL +82
Mar 19 ASB EUR Senior 5 EUR 500 MS +70
May 19 ASB USD Senior 5 USD 500 T +100
Group FY19 benchmark issuance
Issuance Maturity
Weighted average maturity 5.1 years1
New term issuance
by currencyNew term issuance
by tenor
Chart totals do not add to 100% due to rounding.
13% 13% 10% 10%
11% 15% 23% 23%
33%35%
41%
24%
44% 38%25%
42%
FY16 FY17 FY18 FY19
AUD
USD
EUR
Other
3%3%3%
1% 3%
30%13%
10% 12%
12%
16%
12%
32%43%
27% 40%
23% 21%
50% 45%
FY16 FY17 FY18 FY19
>5 years
5 years
4 years
3 years
2 years
1 years
$bn
1. Represents the weighted average maturity of outstanding long term wholesale debt with a residual maturity greater than 12 months at 30 June 2019. 2. Includes Senior Bonds and Structured
MTN. 3. Additional Tier 1 and Tier 2 Capital.
40
65
89 100 102 111
56
90 108 112 115
126
25
63
82 92 95
112
0
40
80
120
160
1 year 2 year 3 year 4 year 5 year 10 year
Jun 18 Dec 18 Jun 19
Margin to BBSW (bpts)
Indicative funding cost curves

0.12.3
2.2 0.2 (1.6)
(2.8)112% 112%
Jun 18 Capital Retail/SMEDeposits
WholesaleFunding& Other
Residential Mortgages
≤35%risk weight
OtherLoans
Liquids &OtherAssets
Jun 19
Residential Mortgages ≤ 35%
risk weight
Other Loans
Liquids and Other Assets
Capital
Retail/SME Deposits
Wholesale Funding & Other
Required Stable Funding Available Stable Funding
Customer deposits
Wholesale Funding
Other
Internal RMBS
Repo-eligible
Cash, Gov, Semis
Liquid assets Net cash outflows
NSFR
Funding and liquidity metrics1
110
NSFR (%)
LCR4 LCR (%)6
104137
641572
Jun 19
Jun 19
1. All figures shown on a Level 2 basis. 2. ‘Other assets’ includes non-performing loans, off-balance sheet items, net derivatives and other assets. 3. This represents residential mortgages with
risk weighting ≤35% under APRA standard APS112 Capital Adequacy: Standardised Approach to Credit Risk. 4. Quarter average. 5. The Group’s CLF for calendar year 2019 is $50.7bn. 6.
Calculation reflects movements in both the numerator and denominator.
2
2
CLF
$bn
$bn
132%
112%
3
3
2.2 0.4 (1.9)
(1.5) (0.8)133%
132%
Jun 18 High QualityLiquid Assets
(HQLA)
CommittedLiquidityFacility
CustomerDeposits
WholesaleFunding
Other net cashoutflows
Jun 18
5
Jun 18 Jun 19
Jun 18 Jun 19

Capital8
We have maintained a strong capital position,
ahead of APRA’s unquestionably strong target “
”

16.9 16.3 16.2 16.214.8 14.8 14.6 14.6 14.5 14.3 13.9 13.8 13.7 13.7 13.4 12.8 12.6 12.4 12.3 12.2 12.2 12.2 12.0 12.0 11.9 11.9 11.8 11.8 11.7 11.6 11.4 11.4 11.4 11.3 11.2 11.1
10.3
8.2
Toro
nto
Dom
inio
n
Cre
dit A
gri
co
leS
A2
2007 2009 2011 2013 2015 2017 2019
112
Capital overview
10.1% 10.8% 10.7%
Jun 18 Dec 18 Jun 19
15.5%16.5% 16.2%
Jun 18 Dec 18 Jun 19
CET1
APRA
CET1
International433%
122%
Assets
CET1
Source: Morgan Stanley and CBA. Based on last reported CET1 ratios up to 1 August 2019 assuming Basel III capital reforms fully implemented. Peer group comprises listed commercial banks
with total assets in excess of A$800 billion and which have disclosed fully implemented Basel III ratios or provided sufficient disclosure for a Morgan Stanley estimate.
1. Domestic peer figures as at 31 March 2019. 2. Deduction for accrued expected future dividends added back for comparability.
International CET1 ratios
G-SIBs in dark grey
Nord
ea
CB
A
HS
BC
Llo
yd
s2
ING
2AN
Z1
WB
C1
NA
B1
RB
S2
Deu
tsch
e
UB
S2
ICB
C
Cre
dit S
uis
se
2
Mitsu
bis
hi U
FJ
Citi
JP
Mo
rga
n
Su
mito
mo
Mitsu
i
Inte
sa
Sa
np
ao
lo2
So
cG
en
2
BN
P P
ari
ba
s2
Ba
rcla
ys
2
Ba
nk o
f C
hin
a
Ba
nk o
f C
om
m.
Miz
uh
o
RB
C
Wells
Fa
rgo
Sco
tia
ba
nk
UniC
red
it2
Sa
nta
nd
er2
BB
VA
2
Sta
nd
ard
Cha
rte
red
2
Chin
a C
on
str
uct.
Ba
nk
Chin
a M
erc
ha
nts
Ba
nk
Ba
nk o
f A
me
rica
Ag
ric. B
an
k o
f C
hin
a
Ba
nk o
f M
on
tre
al

113
Dividends
113120
132 137
164
183198 198 199 200 200
115
170
188197 200
218 222 222230 231 231
FY09 FY10 FY11 FY12 FY13 FY14 FY15 FY16 FY17 FY18 FY19
Interim Final
cents
Payout ratio (cash)
78% 74% 73% 76% 76% 75% 75% 77% 75% 80%2 88%2
53% 61%1 53% 55% 76%1 67%1 62% 64% 53% 68% 88%1Net of
DRP
1. DRP neutralised: 2H10, 1H13, 2H13, 2H14, 1H19, and 2H19. 2. Payout ratios include the impact of notable items. Excluding the impact of notable items, payout ratios would be 80% in FY19
and 73% in FY18 (comparative restated).

1,7122,236 1,951
1,110 792
Jun 17 Dec 17 Jun 18 Dec 18 Jun 19
114
Capital drivers
369 373
57 60
14 105 10
3.2 5.2 3.2(4.0)
Dec 18 Credit Risk IRRBB TradedMarket Risk
OperationalRisk
Jun 19
Total Risk Weighted Assets (RWA)$bn
369373
2.2 1.2 0.4
(0.5)
(0.1)
Dec 18 Volume Quality Data &Methodology
FX RegulatoryTreatments
Jun 19
1 (5) (3) (1) - (8)
Credit RWA$bn
CET1 impact bpts1
(8) 9 (12) (7) (18)
CET1 impact bpts1
453445
Credit
Risk
Op Risk
IRRBB
Market
Risk
1. Basis points contribution to change in APRA CET1 ratio. 2. Capital (Jun 19: $792m) assigned to interest rate risk in banking book per APS117. Basis points of APRA CET1 ratio.
87 1(80) (18)
10.8% 10.7%
Dec 18 Dividend CashNPAT
RiskWeighted
Assets
Other Jun 19
CET1
Credit RWA (8)
IRRBB 9
Market RWA (12)
Op RWA (7)
Interest Rate Risk in Banking Book (IRRBB)2$m
Repricing & Yield
Curve Risk
Basis Risk
Optionality Risk
Embedded Gain
(offset to capital)Bpts 52 71 57 35 24
bpts

Capital generation
115
FY19 $m Bpts
RBS 3,771 84
BPB 2,460 55
IB&M 2,158 49
New Zealand 773 18
IFS and Other (107) (3)
Core 9,055 203
Wealth 195 4
Dividend (net DRP) (6,856) (152)
Total Organic Capital 2,394 55
Organic Capital Generation1
Future Opportunities
Organic Capital Generation
106
67
Jun 16 Jun 19
-37%
IB&M Credit RWA
$bn
• Simpler operating model
• Cost reduction
• Emphasis on regulatory
risk-adjusted returns
• Improved data quality/
models
1. Organic capital generation is Cash NPAT less dividends (net of DRP) and underlying RWA movements (excluding major regulatory treatments). 2. Historical average since implementation of
Basel III in 2013.
35 39
24 16
59 55
Historical Average FY19
DRP
2
Since Basel III, bpts

1108
(99) (49)16.5%16.2%
Dec 18Int'l
Dividend(net of DRP)
CashNPAT
RWA Other Jun 19Int'l
Internationally Comparable1 CET1
116
CET1 – internationally comparable
bpts
1. Internationally comparable capital - refer glossary for definition.
CET1 APRA 10.7%
Equity investments 1.0%
Capitalised expenses 0.1%
Deferred tax assets 0.4%
IRRBB RWA 0.3%
Residential mortgages 2.1%
Other retail standardised exposures 0.1%
Unsecured non-retail exposures 0.4%
Non-retail undrawn commitments 0.3%
Specialised lending 0.7%
Currency conversion 0.1%
CET1 Internationally Comparable 16.2%
Tier 1 Internationally Comparable 18.7%
Total Capital Internationally Comparable 22.1%

$m Jun 18 Dec 18 Jun 19
Regulatory Expected Loss (EL) 4,453 4,600 4,706
Eligible Provisions (EP)
Collective Provisions1 2,484 3,4532 3,5102
Specific Provisions1,3 1,581 1,650 1,751
General Reserve for Credit Losses adjustment 589 539 515
Less: ineligible provisions (standardised portfolio) (253) (325) (353)
Total Eligible Provisions 4,401 5,317 5,423
Regulatory EL in Excess of EP4 52 (717)2 (717)2
Common Equity Tier 1 Adjustment 212 -2 -2
1. Includes transfer from collective provision to specific provisions (Jun 19: $394m, Dec 18: $361m, Jun 18: $279m). 2. Implementation of AASB 9 on 1 July 2018 has increased collective
provisions, resulting in the CET1 deduction reducing to nil. 3. Specific provisions includes partial write offs (Jun 19: $462m, Dec 18: $369m, Jun 18: $432m). 4. Excess of eligible provisions for
non-defaulted exposures included in Tier 2 capital (Jun 19: $527m, Dec 18: $521m, Jun 18: nil).
Regulatory expected loss
117

Leverage ratio
5.5% 5.6% 5.6%6.3% 6.4% 6.5%
APRA International
Leverage ratio = Tier 1 Capital
Total Exposures
Leverage ratio introduced to constrain the build-up of leverage in
the banking system.
Jun 19Jun 18
1. The Tier 1 capital included in the calculation of the internationally comparable leverage ratio aligns with the 13 July 2015 APRA study entitled “International capital comparison study”, and
includes Basel III non-compliant Tier 1 instruments that are currently subject to transitional rules.
3% Basel
Committee
minimum
(1 Jan 2018)
Dec 18
118
$m Jun 19
Group Total Assets 976,502
Less subsidiaries outside the scope of regulatory
consolidations (18,064)
Add net derivative adjustment 4,317
Add securities financing transactions 304
Less asset amounts deducted from Tier 1 Capital (21,002)
Add off balance sheet exposures 81,124
Total Exposures 1,023,181
Proposed
3.5% APRA
minimum
(1 Jan 2022)
1
$m Jun 19
Tier 1 Capital 57,355
Total Exposures 1,023,181
Leverage Ratio (APRA) 5.6%

119
Regulatory capital changes
Leverage ratio
APRA’s
unquestionably strong
Details
Counterparty Credit Risk
(SA-CCR)
1 Jan 2022
1 Jan 2022
(Operational RWA 1 Jan 2021)
APRA commenced consultation in 2018 on:
• Revisions to risk-based capital requirements for credit, interest rate risk in the banking book and
operational risk
• Transparency, comparability and flexibility of the ADI capital framework
APRA commenced consultation on standardised approaches for credit and operational risk and simpler
method for calculating capital requirements for residential mortgages in June 2019
1 Jul 2019
APRA’s revisions to the
ADI capital framework
• Capital to exceed unquestionably strong benchmark of CET1 >10.5% by 1 Jan 2020
AASB 16
Leasing1 Jul 2019
Loss Absorbing Capacity
(“LAC”)1 Jan 2024• Total Capital increase of 3% for all domestically systemically important banks (D-SIBs)
• APRA commenced consultation in 2018
• Proposed minimum 3.5%
• APRA expects that IRB ADIs will continue to report leverage ratios under the existing framework
RBNZ
Capital Review
• RBNZ commenced consultation in 2017, final consultation paper released Dec 2018
• RBNZ expected to finalise reforms towards the end of 2019
• Implementation proposed from Apr 2020 with a transitional period of a number of years
• Minimal impact expected at Level 2 CET1, manageable at Level 1 CET1 (within APS222 capacity limits)
APS 220
Credit Risk Management 1 Jul 2020• Consultation closed Jun 2019
1 Jan 2020
• Effective 1 Jul 2019
• Effective 1 Jul 2019
Transition period commencing
Apr 2020
ImplementationChange

120
APRA’s LAC proposal
CET1
CET1
CET1
Additional Tier 1
Additional Tier 1
Additional Tier 1
Tier 2
Tier 2
Tier 2
CapitalConservation
Buffer
CapitalConservation
Buffer
Capital Surplus
Capital Surplus
CurrentRequirements
CBAJun 19
2024Requirements
$bn Jun 19
Risk Weighted Assets 452.8
Additional Total Capital requirement @ 3% 13.6
• Additional 3% of RWA in Total Capital
applicable to all domestically systemically
important banks (D-SIBs) by 1 January 2024.
• This represents additional $13.6bn of Total
Capital requirement for CBA.
• Over the next four years, APRA will consider
feasible alternative methods for raising
additional 1-2% of RWA, in consultation with
industry and other stakeholders.
15.0%
11.5%
8.0%
6.0%
4.5%
18.0%
14.5%
11.0%
6.0%
4.5%
15.5%
12.7%
10.7%

121
RBNZ capital proposal
• Potential capital increase in ASB of ~NZ$3bn,
assuming current balance sheet size and
composition.
• RBNZ expected to finalise reforms towards the end
of calendar year 2019.
• Implementation expected to commence from April
2020 with a transitional period of a number of years.
• Proposals not expected to change reported CBA
Level 2 CET1 and manageable at Level 1 CET1.
• Sufficient capacity exists under both current and
proposed APS222 (Association with Related Entities)
limits to absorb the proposed additional capital
requirement.
4.5% 4.5%
2.5%
7.5%
1.0%
1.5%
1.5%
1.5%
2.0%
2.0%
10.5%
18.0%
CurrentRequirement
ProposedRequirement
Tier 2
AT1
CCYB Buffer
D-SIB Buffer
Conservation
Buffer
CET1 Minimum
16.0%
Minimum Tier 1
Proposed
increased
buffers
RBNZ proposed capital requirement changes
Tier 2
AT1
Conservation
Buffer
CET1 Minimum
8.5%
MinimumTier 1
7.0%CET1
14.5%CET1

Economic Overview
Against a volatile global backdrop, the Australian
economy has slowed, but remains resilient
9
“”

2.8
2.3
2.9
2.12.5 2.6
2016 2017 2018 2019 2020 2021
GDP % Underlying CPI % Unemployment Rate %
Cash Rate % Total Credit Growth % Housing Credit Growth %
1.41.7 1.8
1.6
2.1 2.1
2016 2017 2018 2019 2020 2021
5.9 5.7 5.55.1 5.0 4.8
2016 2017 2018 2019 2020 2021
1.75
1.50 1.50
1.25
0.75 0.75
2016 2017 2018 2019 2020 2021
6.2
5.4
4.4
3.3
2016 2017 2018 2019 2020 2021
4½-6½
6.7 6.6
5.6
3.5
2016 2017 2018 2019 2020 2021
Credit Growth = 12 months to June
GDP, Unemployment & CPI = Financial year average
Cash Rate = As at June
= forecast
2.4
5.9
4.7
5.64.9 4.7
2016 2017 2018 2019 2020 2021
Nominal GDPGDP
123
Key economic indicators (June FY)
Source: ABS, RBA
4½-6½3½-5½3½-5½

Credit Growth = 12 months to June
GDP, Unemployment & CPI = Financial year average
Cash Rate = As at June
= forecastWorld GDP = Calendar Year Average
124
Key economic indicators (June FY)2014 2015 2016 2017 2018 2019 2020 2021
World GDP 3.6 3.5 3.3 3.8 3.6 3.3 3.6 3.6
Australia Credit Growth % – Total 5.0 5.9 6.2 5.4 4.4 3.3 3½-5½ 4½-6½
Credit Growth % – Housing 6.4 7.3 6.7 6.6 5.6 3.5 3½-5½ 4½-6½
Credit Growth % – Business 3.4 4.5 6.6 4.2 3.2 4.0 4-6 4½-6½
Credit Growth % – Other Personal 0.6 0.8 -0.6 -1.0 -1.3 -3.5 -2½ to -½ -2 to 0
GDP % 2.6 2.3 2.8 2.3 2.9 2.1 2.5 2.6
CPI % 2.7 1.7 1.4 1.7 1.9 1.6 2.1 2.1
Unemployment rate % 5.8 6.2 5.9 5.7 5.5 5.1 5.0 4.8
Cash Rate % 2.50 2.00 1.75 1.50 1.50 1.25 0.75 0.75
New Zealand Credit Growth % – Total 4.4 5.9 7.7 6.5 5.4 5.4 4-6 3-5
Credit Growth % – Housing 5.3 5.4 8.8 7.7 5.9 6.2 4-6 3-5
Credit Growth % – Business 2.8 6.0 7.2 6.2 5.7 5.3 4-6 4-6
Credit Growth % – Agriculture 3.4 7.4 6.0 2.6 2.8 3.1 2-4 2-4
GDP % 2.7 4.0 3.6 3.4 3.2 2.5 2.8 2.5
CPI % 1.5 0.6 0.3 1.4 1.5 1.7 1.6 1.6
Unemployment rate % 5.6 5.4 5.2 5.0 4.5 4.2 4.4 4.3
Overnight Cash Rate % 3.25 3.25 2.25 1.75 1.75 1.50 1.00 1.00
Source: ABS, RBA, IMF, StatsNZ, RBNZ

125
Global growth risks remain elevated
1. Source: IHS Markit. 2. Source: Bloomberg. 3. Source: PolicyUncertainty.com. 4. Source: Goldman Sachs. 5. Source: CEIC China’s Ministry of Finance. 6. Source: CBA.
The global economy has
slowed……as trade war risks
escalate…
…and policy uncertainty remains
elevated
Chinese policy stimulus is
underwayCommodity prices have some
support
But leading indicators are
bottoming out
0
100
200
300
Jun 99 Jun 03 Jun 07 Jun 11 Jun 15 Jun 19
Global Policy Uncertainty3
(higher readings indicate greater uncertainty)Index
44
48
52
56
60
Jun 11 Jun 13 Jun 15 Jun 17 Jun 19
Global PMI1Index
Manufacturing
Services Expansion
Contraction
80
180
280
380
480
Jun 00 Jun 03 Jun 06 Jun 09 Jun 12 Jun 15 Jun 18 Jun 21
CBA Commodity Price Index6Index
0
500
1000
1500
2000
2500
2016 2017 2018 2019
Special Debt Issuance5
(by local government)
CNY
$bn
1
2
3
4
5
6
Jun 11 Jun 13 Jun 15 Jun 17 Jun 19
% Global Leading Indicator4
(% change)
40
45
50
55
60
65
Jun 14 Jun 15 Jun 16 Jun 17 Jun 18 Jun 19
New Export Orders2
Expansion
Contraction
US
(ISM survey)
China
(Caixin survey)

CPI Growth1
0
2
4
6
Jun 07 Jun 13 Jun 19
126
Australia – the economy has slowedGDP growth has dipped below
trend
Progress in reducing unemployment
has stalled
Inflation rates remain
low
Residential construction has
peakedThe drought
continues
Consumer spending is soft in the face of
weak incomes and falling house prices
0
2
4
6
Jun 07 Jun 13 Jun 19
GDP Growth1
%
1. Source: ABS 2. Source: CBA
%
0
2
4
6
Jun 07 Jun 13 Jun 19
Unemployment Rate1
%
-10
-6
-2
2
6
10
Jun 16 Jun 17 Jun 18 Jun 19
CBA Household Indicators2
(annual % change)
%
Spending
(ex cash withdrawals)
Income
Wealth
‘000s
100
120
140
160
180
200
220
240
Jun 86 Jun 93 Jun 00 Jun 07 Jun 14 Jun 21
Dwelling
commencements
Building approvals
Dwelling Construction1
(rolling annual total)
% Agricultural Production1
(annual % change)
-25
-15
-5
5
15
25
35
45
Jun 03 Jun 07 Jun 11 Jun 15 Jun 19
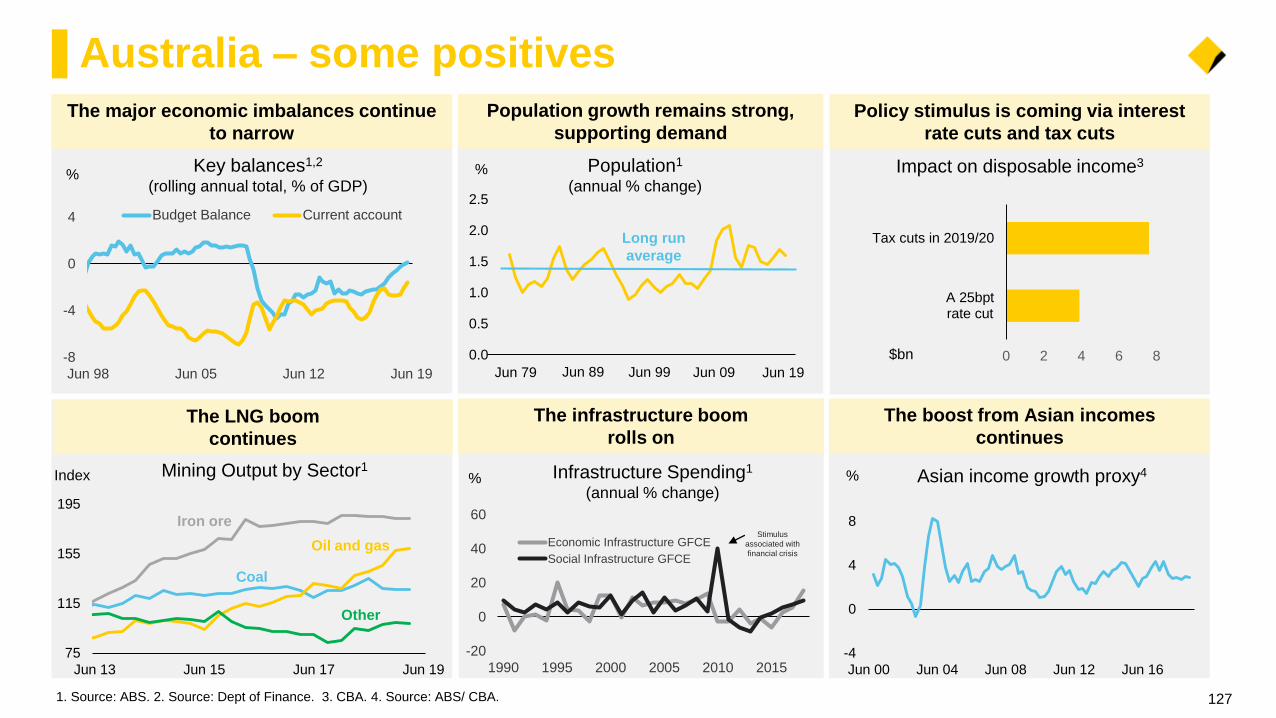
127
Australia – some positivesThe major economic imbalances continue
to narrow
Population growth remains strong,
supporting demand
Policy stimulus is coming via interest
rate cuts and tax cuts
The infrastructure boom
rolls on
The boost from Asian incomes
continuesThe LNG boom
continues
%
-8
-4
0
4
Jun 98 Jun 05 Jun 12 Jun 19
Budget Balance Current account
Key balances1,2
(rolling annual total, % of GDP)
1. Source: ABS. 2. Source: Dept of Finance. 3. CBA. 4. Source: ABS/ CBA.
-20
0
20
40
60
1990 1995 2000 2005 2010 2015
Economic Infrastructure GFCE
Social Infrastructure GFCE
% Infrastructure Spending1
(annual % change)
Stimulus
associated with
financial crisis
Population1
(annual % change)
0.0
0.5
1.0
1.5
2.0
2.5
1973/74 1985/86 1997/98 2009/10
Long run
average
Impact on disposable income3
0 2 4 6 8
A 25bptrate cut
Tax cuts in 2019/20
%
$bn
75
115
155
195
Jun 13 Jun 15 Jun 17 Jun 19
-4
0
4
8
Jun 00 Jun 04 Jun 08 Jun 12 Jun 16
Mining Output by Sector1Asian income growth proxy4%Index
Iron ore
Oil and gas
Coal
Other
Jun 79 Jun 89 Jun 99 Jun 09 Jun 19
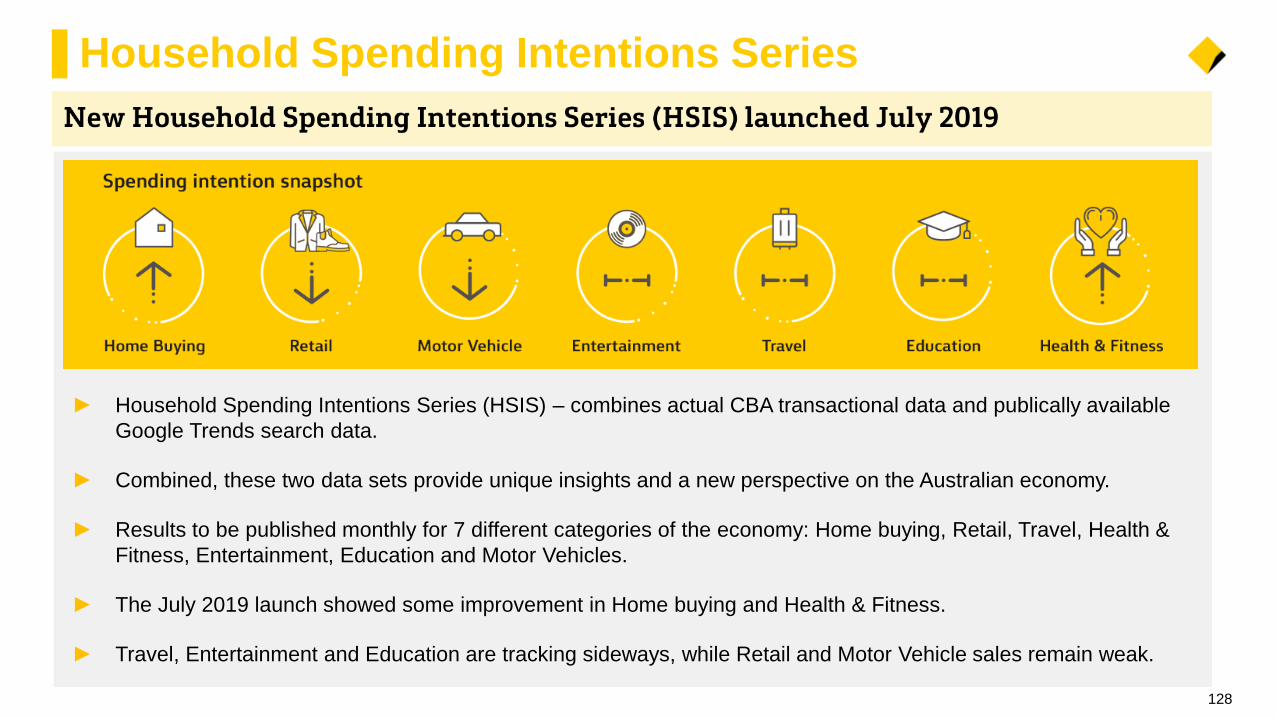
128
Household Spending Intentions Series
► Household Spending Intentions Series (HSIS) – combines actual CBA transactional data and publically available
Google Trends search data.
► Combined, these two data sets provide unique insights and a new perspective on the Australian economy.
► Results to be published monthly for 7 different categories of the economy: Home buying, Retail, Travel, Health &
Fitness, Entertainment, Education and Motor Vehicles.
► The July 2019 launch showed some improvement in Home buying and Health & Fitness.
► Travel, Entertainment and Education are tracking sideways, while Retail and Motor Vehicle sales remain weak.

129
Household Spending Intentions Series
► Home buying intentions have been in negative territory since mid 2018. The pull back in buying intentions
indicates demand weakness was the trigger for falling prices, rather than a supply glut as was the fear in 2017-18.
► Current HSIS readings suggest the market is now turning.
► Retail spending intentions have steadily trended lower since the start of 2018. The indications are that, aside from
the occasional bounce, retail spending remains fairly lacklustre.
-24
-12
0
12
Jun 16 Jun 17 Jun 18 Jun 19
-4
0
4
8
Jun 16 Jun 17 Jun 18 Jun 19
CBA HSI: Home Buying1
(annual % change)
CBA HSI: Retail Sales1
(annual % change)
1. Source: CBA/ Google Trends.
Smoothed
HSI
Smoothed
HSI
% %

-1
0
1
2
3
4
5
6
2000 2004 2008 2012 2016 2020
%
(f)Annual %
quarterly change
NZ CPI inflation3
130
New Zealand
Dairy prices have remained relatively
steady since late 2016
NZ’s terms of trade expected to remain
near record highs
Inflation is likely to range between 1-2%
over next few years
Home lending growth steadied in 2018
after decelerating in 2017
House prices down in Auckland, flat in
Christchurch, growing in other regions
Expect RBNZ to cut OCR to 1% by the end
of 2019
Global dairy trade auction results1
(USD/tonne) NZ Terms of Trade2
OCR Forecasts4
(ASB forecast and implied market pricing) NZ household lending growth5
(annual % change)
NZ median house price6
(3 month moving average)
1. Source: GlobalDairyTrade. 2. Source: Stats NZ. 3. Source: Stats NZ/ASB. 4. Source: ASB. 5. Source: RNBZ/ASB. 6. Source: REINZ.
1,000
2,000
3,000
4,000
5,000
6,000
2008 2009 2010 2011 2012 2013 2014 2015 2016 2017 2018 2019
Whole Milk Powder
GDT overall
700
900
1100
1300
1500
57 62 67 72 77 82 87 92 97 02 07 12 17
Source: Statistics NZ
Index
0.8
1.6
2.4
3.2
4.0
Jun 13 Jun 14 Jun 15 Jun 16 Jun 17 Jun 18 Jun 19 Jun 20
%
OCR implied by current
market pricing
-10
-5
0
5
10
15
20
Jun 04 Jun 07 Jun 10 Jun 13 Jun 16 Jun 19
%
Mortgage lending
Consumer Credit200
300
400
500
600
700
800
900
1000
Jun 05 Jun 07 Jun 09 Jun 11 Jun 13 Jun 15 Jun 17 Jun 19
Auckland
Wellington
Canterbury/Westland
NZ
$ 000's

Sources, Glossary & Notes
10

132
Sources and Notes
Best in digital
Slide 11
1. The total value ($) of transfers and BPAY payments made in digital (NetBank, the CommBank mobile app, CommBank tablet app and old mobile app) as a proportion of
the total value ($) of transfers in over-the-counter, ATM, EFTPOS and digital transactions over the period of January - June 2019.
2. Active digital customers includes total number of customers that logged onto NetBank, the CommBank mobile app, CommBank tablet app and old mobile app at least
once in the month of June 2019. Includes Face ID logons.
3. Online banking: CBA won Canstar's Bank of the Year - Online Banking award for 2019 (for the 10th year in a row). Awarded June 2019.
4. Mobile banking: CBA won Canstar’s Bank of the Year - Mobile Banking award for 2019 (for the 4th year in a row). Awarded June 2019.
5. DBM Australian Financial Awards - Most Innovative Major Bank. Presented February 2019. Award based on DBM’s Consumer Atlas data January to December 2018.
6. The Forrester Banking WaveTM: Australian Mobile Apps, Q2 2019. Commonwealth Bank of Australia received the highest industry WaveTM overall score among mobile
apps in Australia in Forrester's proprietary Industry WaveTM evaluation. Forrester Research does not endorse any company included in any Industry WaveTM report and
does not advise any person or organization to select the products or services of any particular company based on the ratings included in such reports.
7. Net Promoter Score (NPS) - Mobile App (via mobile app on a mobile phone or tablet): Roy Morgan Research. Australian population 14+ who used the internet banking
services of their (self-nominated) main financial institution in the last 4 weeks, rolling average of the last 6 months of spot scores, as at June 2019. Rank based on
comparison to ANZ, NAB and Westpac (at a brand level). Net Promoter®, Net Promoter System®, Net Promoter Score®, NPS® and the NPS-related emoticons are
registered trademarks of Bain & Company, Inc., Fred Reichheld and Satmetrix Systems, Inc.

133
Sources and Notes
Who we are
Slide 33
1. Presented on a continuing basis. Number based on revised methodology.
2. Active digital customers includes total number of customers that logged onto NetBank, the CommBank mobile app, CommBank tablet app and old mobile app at least once
in the month of June 2019. Includes Face ID logons.
3. Presented on a continuing basis.
4. MFI Share measures the proportion of Banking and Finance MFI Customers that nominated each bank as their Main Financial Institution. Main Financial Institution (MFI)
definition: In the Roy Morgan Single Source Survey MFI is a customer determined response where one institution is nominated as the primary financial institution they deal
with (when considering all financial products they hold). Peers includes ANZ Group, NAB Group and Westpac Group (including St George Group). CBA Group includes
Bankwest. Source: Roy Morgan’s Single Source survey conducted by Roy Morgan, Australian population 14+ (12 month average to June 2019).
5. Source: Reserve Bank of Australia, Lending and Credit Aggregates, APRA Monthly Banking Statistics.
6. Source: APRA Monthly Banking Statistics June 2019.
7. Source: DBM BFSM Whole of Market Customer Penetration, All financial relationships: Lending and Deposit Products (holds any of the above types of products with CBA),
12 month rolling to June 2019.
8. Net Promoter Score (NPS) - Mobile App (via mobile app on a mobile phone or tablet): Roy Morgan Research. Australian population 14+ who used the internet banking
services of their (self-nominated) main financial institution in the last 4 weeks, rolling average of the last 6 months of spot scores, as at June 2019. Rank based on
comparison to ANZ, NAB and Westpac (at a brand level). Net Promoter®, Net Promoter System®, Net Promoter Score®, NPS® and the NPS-related emoticons are
registered trademarks of Bain & Company, Inc., Fred Reichheld and Satmetrix Systems, Inc.
9. Net Promoter Score - Mobile App (via mobile app on a mobile phone or tablet), Website and Internet Banking (via the website or mobile app): Roy Morgan Research.
Australian population 14+ who used the internet banking services of their (self-nominated) main financial institution in the last 4 weeks, rolling average of the last 6 months
of spot scores, as at June 2019. Rank based on comparison to ANZ, NAB and Westpac (at a brand level). Net Promoter®, Net Promoter System®, Net Promoter Score®,
NPS® and the NPS-related emoticons are registered trademarks of Bain & Company, Inc., Fred Reichheld and Satmetrix Systems, Inc.
10. Total average NetBank, the CommBank mobile app, CommBank tablet app and old mobile app logons per day in the month of June 2019. Includes Face ID logons.
11. S&P, Moody’s and Fitch. S&P revised Australian Major Banks outlook to “Stable” from “Negative” on 9 July 2019. Moody’s lowered the rating on 19 Jun 17, outlook
“Stable”. Fitch updated outlook on CBA to negative on 7 May 2018.

134
Sources and Notes
Delivering for all our stakeholders
Slide 39
1. DBM Consumer MFI *Net Promoter Score. Based on Australian population aged 14+ years old rating their Main Financial Institution. Net Promoter Score refers to customer
likelihood to recommend their MFI using a scale from 0-10 (where 0 is ‘Not at all likely’ and 10 is ‘Extremely likely) and NPS is calculated by subtracting the percentage of
Detractors (scores 0-6) from the percentage of Promoters (scores 9-10). NPS results are shown as a six-month rolling average. For the major banks, NPS is reported for
main brand only. *Net Promoter Score is a trademark of Bain & Co Inc., Satmetrix Systems, Inc., and Mr Frederick Reichheld.
2. MFI Share measures the proportion of Banking and Finance MFI Customers that nominated each bank as their Main Financial Institution. Main Financial Institution (MFI)
definition: In the Roy Morgan Single Source Survey MFI is a customer determined response where one institution is nominated as the primary financial institution they deal
with (when considering all financial products they hold). Peers includes ANZ Group, NAB Group and Westpac Group (including St George Group). CBA Group includes
Bankwest. Source: Roy Morgan Single Source survey conducted by Roy Morgan, Australian population 14+ (12 month averages to June 2018 & 12 month averages to
June 2019).
3. DBM Business MFI *Net Promoter Score: Based on Australian businesses rating their Main Financial Institution for Business Banking. Net Promoter Score refers to
customer likelihood to recommend their MFI using a scale from 0-10 (where 0 is ‘Extremely unlikely’ and 10 is ‘Extremely likely’) and NPS is calculated by subtracting the
percentage of Detractors (scores 0-6) from the percentage of Promoters (scores 9-10). NPS results are shown as a six-month rolling average. For the major banks, NPS is
reported for main brand only. *Net Promoter Score is a trademark of Bain & Co Inc., Satmetrix Systems, Inc., and Mr Frederick Reichheld.
4. DBM Institutional $300M+ Business MFI *Net Promoter Score: Based on Australian businesses with an annual revenue of $300M or more for the previous financial year
rating their Main Financial Institution for Business Banking. Net Promoter Score refers to customer likelihood to recommend their MFI using a scale from 0-10 where (where
0 is ‘Extremely unlikely’ and 10 is ‘Extremely likely’) and NPS is calculated by subtracting the percentage of Detractors (scores 0-6) from the percentage of Promoters
(scores 9-10). NPS results are shown as a six-month rolling average. For the major banks, NPS is reported for main brand only. *Net Promoter Score is a trademark of
Bain & Co Inc., Satmetrix Systems, Inc., and Mr Frederick Reichheld.
5. People Engagement score overall. Source of global benchmark: IBM Kenexa March 2019. The Top 10% is comprised of companies surveyed by IBM Kenexa in the
Northern Hemisphere
6. Reputation score amongst top 16 ASX customer-facing companies. Source: RepTrak, Reputation Institute, June 2019.
7. Source: Bloomberg. Total Shareholder Return amongst ASX20 excluding mining companies as at 28 Jun 19.

135
Sources and Notes
Best in digital
Slide 42
1. The Forrester Banking WaveTM: Global Mobile Apps Summary, 2018. Commonwealth Bank of Australia received the highest industry WaveTM overall score among mobile
apps in APAC in Forrester's proprietary Industry WaveTM evaluation. Forrester Research does not endorse any company included in any Industry WaveTM report and does
not advise any person or organization to select the products or services of any particular company based on the ratings included in such reports.
2. Net Promoter Score (NPS) – Mobile App (via mobile app on a mobile phone or tablet), Website and Internet Banking (via the website or mobile app): Roy Morgan
Research. Australian population 14+ who used the internet banking services of their (self-nominated) main financial institution in the last 4 weeks, rolling average of the
last 6 months of spot scores, as at June 2019. Rank based on comparison to ANZ, NAB and Westpac (at a brand level). Net Promoter®, Net Promoter System®, Net
Promoter Score®, NPS® and the NPS-related emoticons are registered trademarks of Bain & Company, Inc., Fred Reichheld and Satmetrix Systems, Inc.
3. Online banking: CBA won Canstar's Bank of the Year - Online Banking award for 2019 (for the 10th year in a row). Awarded June 2019.
4. Mobile banking: CBA won Canstar’s Bank of the Year - Mobile Banking award for 2019 (for the 4th year in a row). Awarded June 2019.
5. The Forrester Banking WaveTM: Australian Mobile Apps, Q2 2019. Commonwealth Bank of Australia received the highest industry WaveTM overall score among mobile
apps in Australia in Forrester's proprietary Industry WaveTM evaluation. Forrester Research does not endorse any company included in any Industry WaveTM report and
does not advise any person or organization to select the products or services of any particular company based on the ratings included in such reports.
6. DBM Australian Financial Awards - Most Innovative Major Bank. Presented February 2019. Award based on DBM’s Consumer Atlas data January to December 2018
7. DBM Australian Financial Awards - Best Major Digital Retail Bank. Presented February 2019. Award based on DBM’s Consumer Atlas data January to December 2018
8. The total number of customers that have logged into the CommBank mobile app at least once in the month of June 2019. Includes Face ID logons.
9. The total value ($) of transfers and BPAY payments made in digital (NetBank, the CommBank mobile app, CommBank tablet app and old mobile app) as a proportion of
the total value ($) of transfers in over-the-counter, ATM, EFTPOS and digital transactions over the period of January – June 2019.
136
Sources and Notes
Home Lending - CBA
Slide 83
1. CBA including Bankwest unless noted otherwise. Market share includes subsidiaries. System source: RBA Lending and Credit Aggregates.
2. Presented on a gross basis before value attribution to other business units.
3. Includes refinancing & excludes Viridian line of credit (VLOC).
4. Excludes Bankwest.
5. Includes Residential Mortgage Group (RMG). Interest only, Principal and interest, Investor and owner-occupier growth excludes Viridian line of credit (VLOC).
6. System is the average of three quarters to March 2019. Source: MFAA.
7. State Profile excludes Line of Credit, Reverse Mortgage, Commonwealth Portfolio Loan and Residential Mortgage Group. State Profile determined by location of the
underlying security.

137
GlossaryFunding & Risk
Liquidity coverage
ratio (LCR)
The LCR is the first quantitative liquidity measure that is part of the
Basel III reforms. It was implemented by APRA in Australia on 1 Jan
2015. It requires Australian ADIs to hold sufficient liquid assets to meet
30 day net cash outflows projected under an APRA-prescribed stress
scenario.
High quality liquid
assets (HQLA)
As defined by APRA in Australian Prudential Standard APS210:
Liquidity. Qualifying HQLA includes cash, government and semi-
government securities, and RBNZ eligible securities.
Committed liquidity
facility (CLF)
Given the limited amount of Commonwealth government and Semi-
government debt in Australia, participating ADIs can access contingent
liquidity via the RBA’s CLF. The amount of the CLF for each ADI is set
annually by APRA. To access the CLF, ADIs need to meet certain
conditions and pledge qualifying securities to the RBA.
Net Stable Funding
Ratio (NSFR)
The NSFR is the second quantitative liquidity measure of the Basel III
reforms, in addition to the LCR. It was implemented by APRA in
Australia on 1 Jan 2018. It requires Australian ADIs to fund their assets
with sufficient stable funding to reduce funding risk over a one year
horizon. APRA prescribed factors are used to determine the stable
funding requirement of assets and the stability of funding.
TIA Corporate Troublesome and Group Impaired assets.
Corporate
Troublesome
Corporate Troublesome includes exposures where customers are
experiencing financial difficulties which, if they persist, could result in
losses of principal or interest, and exposures where repayments are 90
days or more past due and the value of security is sufficient to recover
all amounts due.
Total Committed
Exposure (TCE)
Total Committed Exposure is defined as the balance outstanding and
undrawn components of committed facility limits. It is calculated before
collateralisation and excludes settlement exposures.
Credit Risk Estimates
(CRE)
Refers to the Group’s regulatory estimates of long-run Probability of
Default (PD), downturn Loss Given Default (LGD) and Exposure at
Default (EAD).
Capital & Other
Risk Weighted Assets or
RWA
The value of the Group’s On and Off Balance Sheet assets are
adjusted by risk weights calculated according to various APRA
prudential standards. For more information, refer to the APRA
website.
CET1 Expected Loss
(EL) Adjustment
CET1 adjustment that represents the shortfall between the
calculated EL and eligible provisions (EP) with respect to credit
portfolios which are subject to the Basel advanced capital IRB
approach. The adjustment is assessed separately for both defaulted
and non-defaulted exposures. Where there is an excess of EL over
EP in either assessments, the difference must be deducted from
CET1. For non-defaulted exposures where the EL is lower than the
EP, this may be included in Tier 2 capital up to a maximum of 0.6%
of total credit RWAs.
Leverage Ratio Tier 1 Capital divided by Total Exposures, with this ratio expressed
as a percentage. Total exposures is the sum of On Balance Sheet
items, derivatives, securities financing transactions (SFTs), and Off
Balance Sheet items, net of any Tier 1 regulatory deductions that are
already included in these items.
Internationally
comparable capital
The Internationally Comparable CET1 ratio is an estimate of the
Group’s CET1 ratio calculated using rules comparable with our
global peers. The analysis aligns with the APRA study entitled
“International capital comparison study” (13 July 2015).
Derivative Valuation
Adjustments (XVA)
A number of different valuation adjustments are made to the value of
derivative contracts to reflect the additional costs or benefits in
holding these contracts. The material valuation adjustments included
within the CBA result are CVA and FVA.
Credit value adjustment
(CVA)
The market value of the counterparty credit risk on the derivative
portfolio, calculated as the difference between the risk-free portfolio
value and the true portfolio value that takes into account the
possibility of a counterparty’s default.
Funding valuation
adjustment (FVA)
The expected funding cost or benefit over the life of the
uncollateralised derivative portfolio.

Disclaimer
The material in this presentation is general background information about the Group and its activities current as at the date of the presentation, 7 August 2019. It is information given in
summary form and does not purport to be complete. Information in this presentation is not intended to be relied upon as advice to investors or potential investors and does not take into
account the investment objectives, financial situation or needs of any particular investor. Investors should consider these factors, and consult with their own legal, tax, business and/or
financial advisors in connection with any investment decision.
This presentation may contain certain forward-looking statements within the meaning of the United States Private Securities Litigation Reform Act of 1995 and the securities laws of
other jurisdictions. Forward-looking statements can generally be identified by the use of forward-looking words such as “may”, “will”, “would”, “could”, “expect”, “intend”, “plan”, “aim”,
“estimate”, “target”, “anticipate”, “believe”, “continue”, “objectives”, “outlook”, “guidance” or other similar words, and include statements regarding the Group’s intent, belief or current
expectations with respect to the Group’s business and operations, market conditions, results of operations and financial condition, capital adequacy and risk management. Any forward-
looking statements included in this presentation speak only as at the date of this presentation and undue reliance should not be placed upon such statements. Although the Group
believes the forward-looking statements to be reasonable, they are not certain and involve known and unknown risks and assumptions, many of which are beyond the control of the
Group, which may cause actual results, conditions or circumstances to differ materially from those expressed or implied in such statements. To the maximum extent permitted by law,
responsibility for the accuracy or completeness of any forward-looking statements, whether as a result of new information, future events or results or otherwise, is disclaimed.
Readers are cautioned not to place undue reliance on forward-looking statements and the Group is under no obligation to update any of the forward-looking statements contained
within this presentation, subject to disclosure requirements applicable to the Group.
Readers should also be aware that certain financial data in this presentation may be considered “non-GAAP financial measures” under Regulation G of the U.S. Securities and
Exchange Act of 1934, and non-IFRS financial measures. The disclosure of such non-GAAP/IFRS financial measures in the manner included in this presentation would not be
permissible in a registration statement under the U.S. Securities Act of 1933. Such non-GAAP/IFRS financial measures do not have a standardized meaning prescribed by Australian
Accounting Standards or International Financial Reporting Standards (IFRS) and therefore may not be comparable to similarly titled measures presented by other entities, nor should
they be construed as an alternative to other financial measures determined in accordance with Australian Accounting Standards or IFRS. Readers are cautioned not to place undue
reliance on any such measures.
Cash Profit
The Profit Announcement discloses the net profit after tax on both a statutory and cash basis. The statutory basis is prepared in accordance with the Corporations Act and the
Australian Accounting Standards, which comply with International Financial Reporting Standards (IFRS). The cash basis is used by management to present a clear view of the Bank’s
operating results. It is not a measure based on cash accounting or cash flows. The items excluded from cash profit, such as hedging and IFRS volatility and losses or gains on
acquisition, disposal, closure and demerger of businesses are calculated consistently with the prior year and prior half disclosures and do not discriminate between positive and
negative adjustments. A list of items excluded from cash profit is provided on page 3 of the Profit Announcement (PA), which can be accessed at our website:
www.commbank.com.au/results
Images
Mastercard is a registered trademark and the circles design is a trademark of Mastercard International Incorporated.
Apple, the Apple logo, iPhone and iPad are trademarks of Apple Inc., registered in the U.S. and other countries. App Store is a service mark of Apple Inc.
Notes
138